
Chemical Reduction of GO: Comparing Hydroiodic Acid and Sodium Borohydride Chemical Approaches by X-ray Photoelectron Spectroscopy


Abstract
:1. Introduction
2. Experimental
2.1. Chemicals
2.2. Reduction of Graphene Oxide with HI
2.3. Reduction of Graphene Oxide with NaBH4
2.4. Characterization
3. Results and Discussion
4. Conclusions
Author Contributions
Funding
Data Availability Statement
Conflicts of Interest
References
- Georgakilas, V.; Perman, J.A.; Tucek, J.; Zboril, R. Broad Family of Carbon Nanoallotropes: Classification, Chemistry, and Applications of Fullerenes, Carbon Dots, Nanotubes, Graphene, Nanodiamonds, and Combined Superstructures. Chem. Rev. 2015, 115, 4744–4822. [Google Scholar] [CrossRef] [PubMed]
- Allen, M.J.; Tung, V.C.; Kaner, R.B. Honeycomb carbon: A review of graphene. Chem. Comm. 2010, 110, 132–145. [Google Scholar] [CrossRef] [PubMed]
- Kong, W.; Kum, H.; Bae, S.-H.; Shim, J.; Kim, H.; Kong, L.; Meng, K.; Wang, K.; Kim, C.; Kim, J. Path towards graphene commercialization from lab to market. Nat. Nanotechnol. 2019, 14, 927–938. [Google Scholar] [CrossRef] [PubMed]
- Chen, D.; Feng, H.; Li, J. Graphene Oxide: Preparation, Functionalization, and Electrochemical Applications. Chem. Rev. 2012, 112, 6027–6053. [Google Scholar] [CrossRef]
- Wang, Y.; Li, S.; Yang, H.; Luo, J. Progress in the functional modification of graphene/graphene oxide: A review. RSC Adv. 2020, 10, 15328. [Google Scholar]
- Xiong, Y.; Xie, Y.; Zhang, F.; Ou, E.; Jiang, Z.; Ke, L.; Hu, D.; Xu, W. Reduced graphene oxide/hydroxylated styrene-butadiene-styrene tri-block copolymer electroconductive nanocomposites: Preparation and properties. Mater. Sci. Eng. B 2012, 177, 1157–1163. [Google Scholar] [CrossRef]
- Joshi, D.J.; Koduru, J.R.; Malek, N.I.; Hussain, C.M.; Kailasa, S.K. Surface modifications and analytical applications of graphene oxide: A review. Trends Anal. Chem. 2021, 144, 116448. [Google Scholar] [CrossRef]
- Shareena, T.P.D.; McShan, D.; Dasmahapatra, A.K.; Tchounwou, P.B. A Review on Graphene-Based Nanomaterials in Biomedical Applications and Risks in Environment and Health. Nano-Micro Lett. 2018, 10, 53. [Google Scholar] [CrossRef]
- Liu, Y.; Dong, X.; Chen, P. Biological and chemical sensors based on graphene materials. Chem. Soc. Rev. 2012, 41, 2283–2307. [Google Scholar] [CrossRef]
- Ahmad, H.; Fan, M.; Hui, D. Graphene oxide incorporated functional materials: A review. Compos. B 2018, 145, 270–280. [Google Scholar] [CrossRef]
- Wang, Z.; Nelson, J.K.; Hillborg, H.; Zhao, S.; Schadler, L.S. Graphene Oxide Filled Nanocomposite with Novel Electrical and Dielectric Properties. Adv. Mater. 2012, 24, 3134–3137. [Google Scholar] [CrossRef] [PubMed]
- Türkaslan, S.S.; Ugur, S.S.; Türkaslan, B.E.; Fantuzzi, N. Evaluating the X-ray-Shielding Performance of Graphene-Oxide-Coated Nanocomposite Fabric. Materials 2022, 15, 1441. [Google Scholar] [CrossRef] [PubMed]
- Chauhan, D.S.; Quraishi, M.A.; Ansari, K.R.; Saleh, T.A. Graphene and graphene oxide as new class of materials for corrosion control and protection: Present status and future scenario. Progr. Org. Coat. 2020, 147, 105741. [Google Scholar] [CrossRef]
- Obayomi, K.S.; Lau, S.Y.; Danquah, M.; Chiong, T.; Takeo, M. Advances in graphene oxide based nanobiocatalytic technology for wastewater treatment. Environ. Nanotechnol. Monit. Manag. 2022, 17, 100647. [Google Scholar] [CrossRef]
- Siwinska-Stefanska, K.; Fluder, M.; Tylus, W.; Jesionowski, T. Investigation of amino-grafted TiO2/reduced graphene oxide hybrids as a novel photocatalyst used for decomposition of selected organic dyes. J. Environ. Manag. 2018, 212, 395–404. [Google Scholar] [CrossRef]
- Perreault, F.; de Faria, A.F.; Elimelech, M. Environmental applications of graphene-based nanomaterials. Chem. Soc. Rev. 2015, 44, 5861–5896. [Google Scholar] [CrossRef] [PubMed]
- Tian, Y.; Yu, Z.; Cao, L.; Zhang, L.X.; Sun, C.; Wang, D.W. Graphene oxide: An emerging electromaterial for energy storage and conversion. J. Energy Chem. 2021, 55, 323–344. [Google Scholar] [CrossRef]
- Chen, K.; Song, S.; Liu, F.; Xue, D. Structural design of graphene for use in electrochemical energy storage devices. Chem. Soc. Rev. 2015, 44, 6230–6257. [Google Scholar] [CrossRef]
- Guo, S.; Dong, S. Graphene nanosheet: Synthesis, molecular engineering, thin film, hybrids, and energy and analytical applications. Chem. Soc. Rev. 2011, 40, 2644–2672. [Google Scholar] [CrossRef]
- Kamedulski, P.; Truszkowski, S.; Lukaszewicz, J.P. Highly Effective Methods of Obtaining N-Doped Graphene by Gamma Irradiation. Materials 2020, 13, 4975. [Google Scholar] [CrossRef]
- Mankge, N.S.; Madito, M.J.; Hlongwa, N.W.; Kuvarega, A.T. Review of electrochemical production of doped graphene for energy storage applications. J. Energy Storage 2022, 46, 103527. [Google Scholar] [CrossRef]
- Velasco-Soto, M.A.; Perez-Garcia, S.A.; Alvarez-Quintana, J.; Cao, Y.; Nyborg, L.; Licea-jimenez, L. Selective band gap manipulation of graphene oxide by its reduction with mild reagents. Carbon 2015, 93, 967–973. [Google Scholar] [CrossRef] [Green Version]
- Shen, Y.; Yang, S.; Zhou, P.; Sun, Q.; Wang, P.; Wan, L.; Li, J.; Chen, L.; Wang, X.; Ding, S.; et al. Evolution of the band-gap and optical properties of graphene oxide with controllable reduction level. Carbon 2013, 62, 157–164. [Google Scholar] [CrossRef]
- Hasan, M.T.; Senger, B.J.; Ryan, C.; Culp, M.; Gonzalez-Rodriguez, R.; Coffer, J.L.; Naumov, A.V. Optical Band Gap Alteration of Graphene Oxide via Ozone Treatment. Sci. Rep. 2017, 7, 6411. [Google Scholar] [CrossRef] [Green Version]
- Weiss, N.O.; Zhou, H.; Liao, L.; Liu, Y.; Jiang, S.; Huang, Y.; Duan, X. Graphene: An emerging electronic material. Adv. Mater. 2012, 24, 5782–5825. [Google Scholar] [CrossRef]
- Gupta, S.; Joshi, P.; Narayan, J. Electron mobility modulation in graphene oxide by controlling carbon melt lifetime. Carbon 2020, 170, 327–3337. [Google Scholar] [CrossRef]
- Lee, C.; Wei, X.; Kysar, J.W.; Hone, J. Measurement of the elastic properties and intrinsic strength of monolayer graphene. Science 2008, 321, 385–388. [Google Scholar] [CrossRef]
- Liu, L.; Zhang, J.; Zhao, J.; Liu, F. Mechanical properties of graphene oxides. Nanoscale 2012, 4, 5910–5916. [Google Scholar] [CrossRef] [PubMed]
- Nair, R.R.; Blake, P.; Grigorenko, A.N.; Novosdelov, K.S.; Booth, T.J.; Stauber, T.; Peres, N.M.R.; Geim, A.K. Fine Structure Constant Defines Visual Transparency of Graphene. Science 2008, 320, 1308. [Google Scholar] [CrossRef] [Green Version]
- Su, R.; Lin, S.F.; Chen, D.Q.; Chen, G.H. Study on the Absorption Coefficient of Reduced Graphene Oxide Dispersion. J. Phys. Chem. C 2014, 118, 12520–12525. [Google Scholar] [CrossRef]
- Jin, Y.; Zheng, Y.; Podkolzin, S.G.; Lee, W. Band gap of reduced graphene oxide tuned by controlling functional groups. J. Mater. Chem. C 2020, 8, 4885–4894. [Google Scholar] [CrossRef]
- Sehrawat, A.P.; Islam, S.S.; Mishra, P.; Ahmad, S. Reduced graphene oxide (rGO) based wideband optical sensor and the role of Temperature, Defect States and Quantum Efficiency. Sci. Rep. 2018, 8, 3537. [Google Scholar]
- Wang, Y.; Wang, L.; Wang, H.Y.; Chen, Q.D.; Sun, H.B. Ultrafast Spectroscopic Study of Insulator-Semiconductor-Semimetal Transitions in Graphene Oxide and Its Reduced Derivatives. J. Phys. Chem. C 2019, 123, 22550–22555. [Google Scholar] [CrossRef]
- Bhaumik, A.; Haque, A.; Taufique, M.; Karnati, P.; Patel, R.; Nath, M.; Ghosh, K. Reduced Graphene Oxide Thin Films with Very Large Charge Carrier Mobility Using Pulsed Laser Deposition. J. Mater. Sci. Eng. 2017, 6, 4. [Google Scholar] [CrossRef]
- Wang, Y.; Chen, Y.; Lacey, S.D.; Xu, L.; Xie, H.; Li, T.; Danner, V.A.; Hu, L. Reduced graphene oxide film with record-high conductivity and mobility. Mater. Today 2018, 21, 186–192. [Google Scholar] [CrossRef]
- Mohan, V.B.; Brown, R.; Jayaraman, K.; Bhattacharyya, D. Characterisation of reduced graphene oxide: Effects of reduction variables on electrical conductivity. Mater. Sci. Eng. B 2015, 193, 49–60. [Google Scholar] [CrossRef]
- Tarcan, R.; Todor-Boer, O.; Petrovai, I.; Leordean, C.; Astilean, S.; Botiz, I. Reduced graphene oxide today. J. Mater. Chem. C 2020, 8, 1198–1224. [Google Scholar] [CrossRef]
- Smith, A.T.; LaChance, A.M.; Zeng, S.; Liu, B.; Sun, L. Synthesis, properties, and applications of graphene oxide/reduced graphene oxide and their nanocomposites. Nano Mater. Sci. 2019, 1, 31–47. [Google Scholar] [CrossRef]
- Agarwal, V.; Zetterlund, P.B. Strategies for reduction of graphene oxide—A comprehensive review. Chem. Eng. J. 2021, 405, 127018. [Google Scholar] [CrossRef]
- Park, S.; An, J.; Potts, J.R.; Velamakanni, A.; Murali, S.; Ruoff, R.S. Hydrazine-reduction of graphite- and graphene oxide. Carbon 2011, 49, 3019–3023. [Google Scholar] [CrossRef]
- Zhang, J.; Yang, H.; Shen, G.; Cheng, P.; Zhang, J.; Guo, S. Reduction of graphene oxide via ascorbic acid. Chem. Commun. 2010, 46, 1112–1114. [Google Scholar] [CrossRef] [PubMed]
- Zhang, C.; Lv, W.; Zhang, W.; Zheng, X.; Wu, M.-B.; Wei, W.; Tao, Y.; Li, Z.; Yang, Q. Reduction of Graphene Oxide by Hydrogen Sulfide: A Promising Strategy for Pollutant Control and as an Electrode for Li-S Batteries. Adv. Energy Mater. 2014, 4, 1301565. [Google Scholar] [CrossRef]
- Shin, H.-J.; Kim, K.K.; Benayad, A.; Yoon, S.-M.; Park, H.K.; Jung, I.-S.; Jin, M.H.; Jeong, H.-K.; Kim, J.M.; Choi, J.-Y.; et al. Efficient Reduction of Graphite Oxide by Sodium Borohydride and Its Effect on Electrical Conductance. Adv. Funct. Mater. 2009, 19, 1987–1992. [Google Scholar] [CrossRef]
- Moon, I.K.; Lee, J.; Ruoff, R.S.; Lee, H. Reduced graphene oxide by chemical graphitization. Nat. Comm. 2010, 1, 73. [Google Scholar] [CrossRef] [PubMed] [Green Version]
- Liu, C.; Hao, F.; Zhao, Q.; Luo, S.; Lin, H. Low temperature reduction of free-standing graphene oxide papers with metal iodides for ultrahigh bulk conductivity. Sci. Rep. 2014, 4, 3965. [Google Scholar] [CrossRef] [PubMed] [Green Version]
- Chen, D.; Li, L.; Guo, L. An environment-friendly preparation of reduced graphene oxide nanosheets via amino acid. Nanotechnology 2011, 22, 325601. [Google Scholar] [CrossRef]
- Chua, C.K.; Pumera, M. Chemical reduction of graphene oxide: A synthetic chemistry viewpoint. Chem. Soc. Rev. 2014, 43, 291–312. [Google Scholar] [CrossRef]
- Liu, W.; Speranza, G. Tuning the Oxygen Content of Reduced Graphene Oxide and Effects on Its Properties. ACS Omega 2021, 6, 6195–6205. [Google Scholar] [CrossRef]
- Tan, S.M.; Ambrosi, A.; Chua, C.K.; Pumera, M. Electron transfer properties of chemically reduced graphene materials with different oxygen contents. J. Mater. Chem. A 2014, 2, 10668–10675. [Google Scholar] [CrossRef]
- Speranza, G.; Canteri, R. RxpsG a new open project for Photoelectron and Electron Spectroscopy data processing. SoftwareX 2019, 10, 100282. [Google Scholar] [CrossRef]
- Moulder, J.F.; Stickle, W.F.; Sobol, P.E.; Bomben, K.D. Handbook of X-ray Photoelectron Spectroscopy: A Reference Book of Standard Spectra for Identification and Interpretation of Xps Data; EdenPraire, Physical Electronics: Minnesota, MN, USA, 1995. [Google Scholar]
- Beamson, G.; Briggs, D. High Resolution XPS of Organic Polymers: The Scienta ESCA300 Database; Surface Spectra: Chichester, UK, 1992. [Google Scholar]
- Chen, C.; Kong, W.; Duana, H.-M.; Zhang, J. Theoretical simulation of reduction mechanism of graphene oxide in sodium hydroxide solution. Phys. Chem. Chem. Phys. 2014, 16, 12858–12864. [Google Scholar] [CrossRef] [PubMed]
- Guex, L.G.; Sacchi, B.; Peuvot, K.F.; Andersson, R.L.; Pourrahimi, A.M.; Strom, V.; Farris, S.; Olsson, R.T. Experimental review: Chemical reduction of graphene oxide (GO) to reduced graphene oxide (rGO) by aqueous chemistry. Nanoscale 2017, 9, 9562. [Google Scholar] [CrossRef] [PubMed] [Green Version]
- Tien, H.W.; Huang, Y.L.; Yang, S.Y.; Hsiao, S.T.; Liao, W.H.; Li, H.M.; Wang, Y.S.; Wang, J.Y.; Ma, C.C.M. Preparation of transparent, conductive films by graphene nanosheet deposition on hydrophilic or hydrophobic surfaces through control of the pH value. J. Mater. Chem. 2012, 22, 2545–2552. [Google Scholar] [CrossRef]


| Sample Name | HI Concentration | Sample Name | NaBH4 Amount |
|---|---|---|---|
| GO | // | ||
| S_H1 | 0.06 M | S_N1 | 50 mg |
| S_H2 | 0.12 M | S_N2 | 300 mg |
| S_H3 | 0.24 M | S_N3 | 600 mg |
| S_H4 | 0.47 M | S_N4 | 900 mg |
| S_H5 | 0.95 M | S_N5 | 1200 mg |
| S_H6 | 1.89 M | ||
| S_H7 | 3.79 M | ||
| S_H8 | 7.58 M |
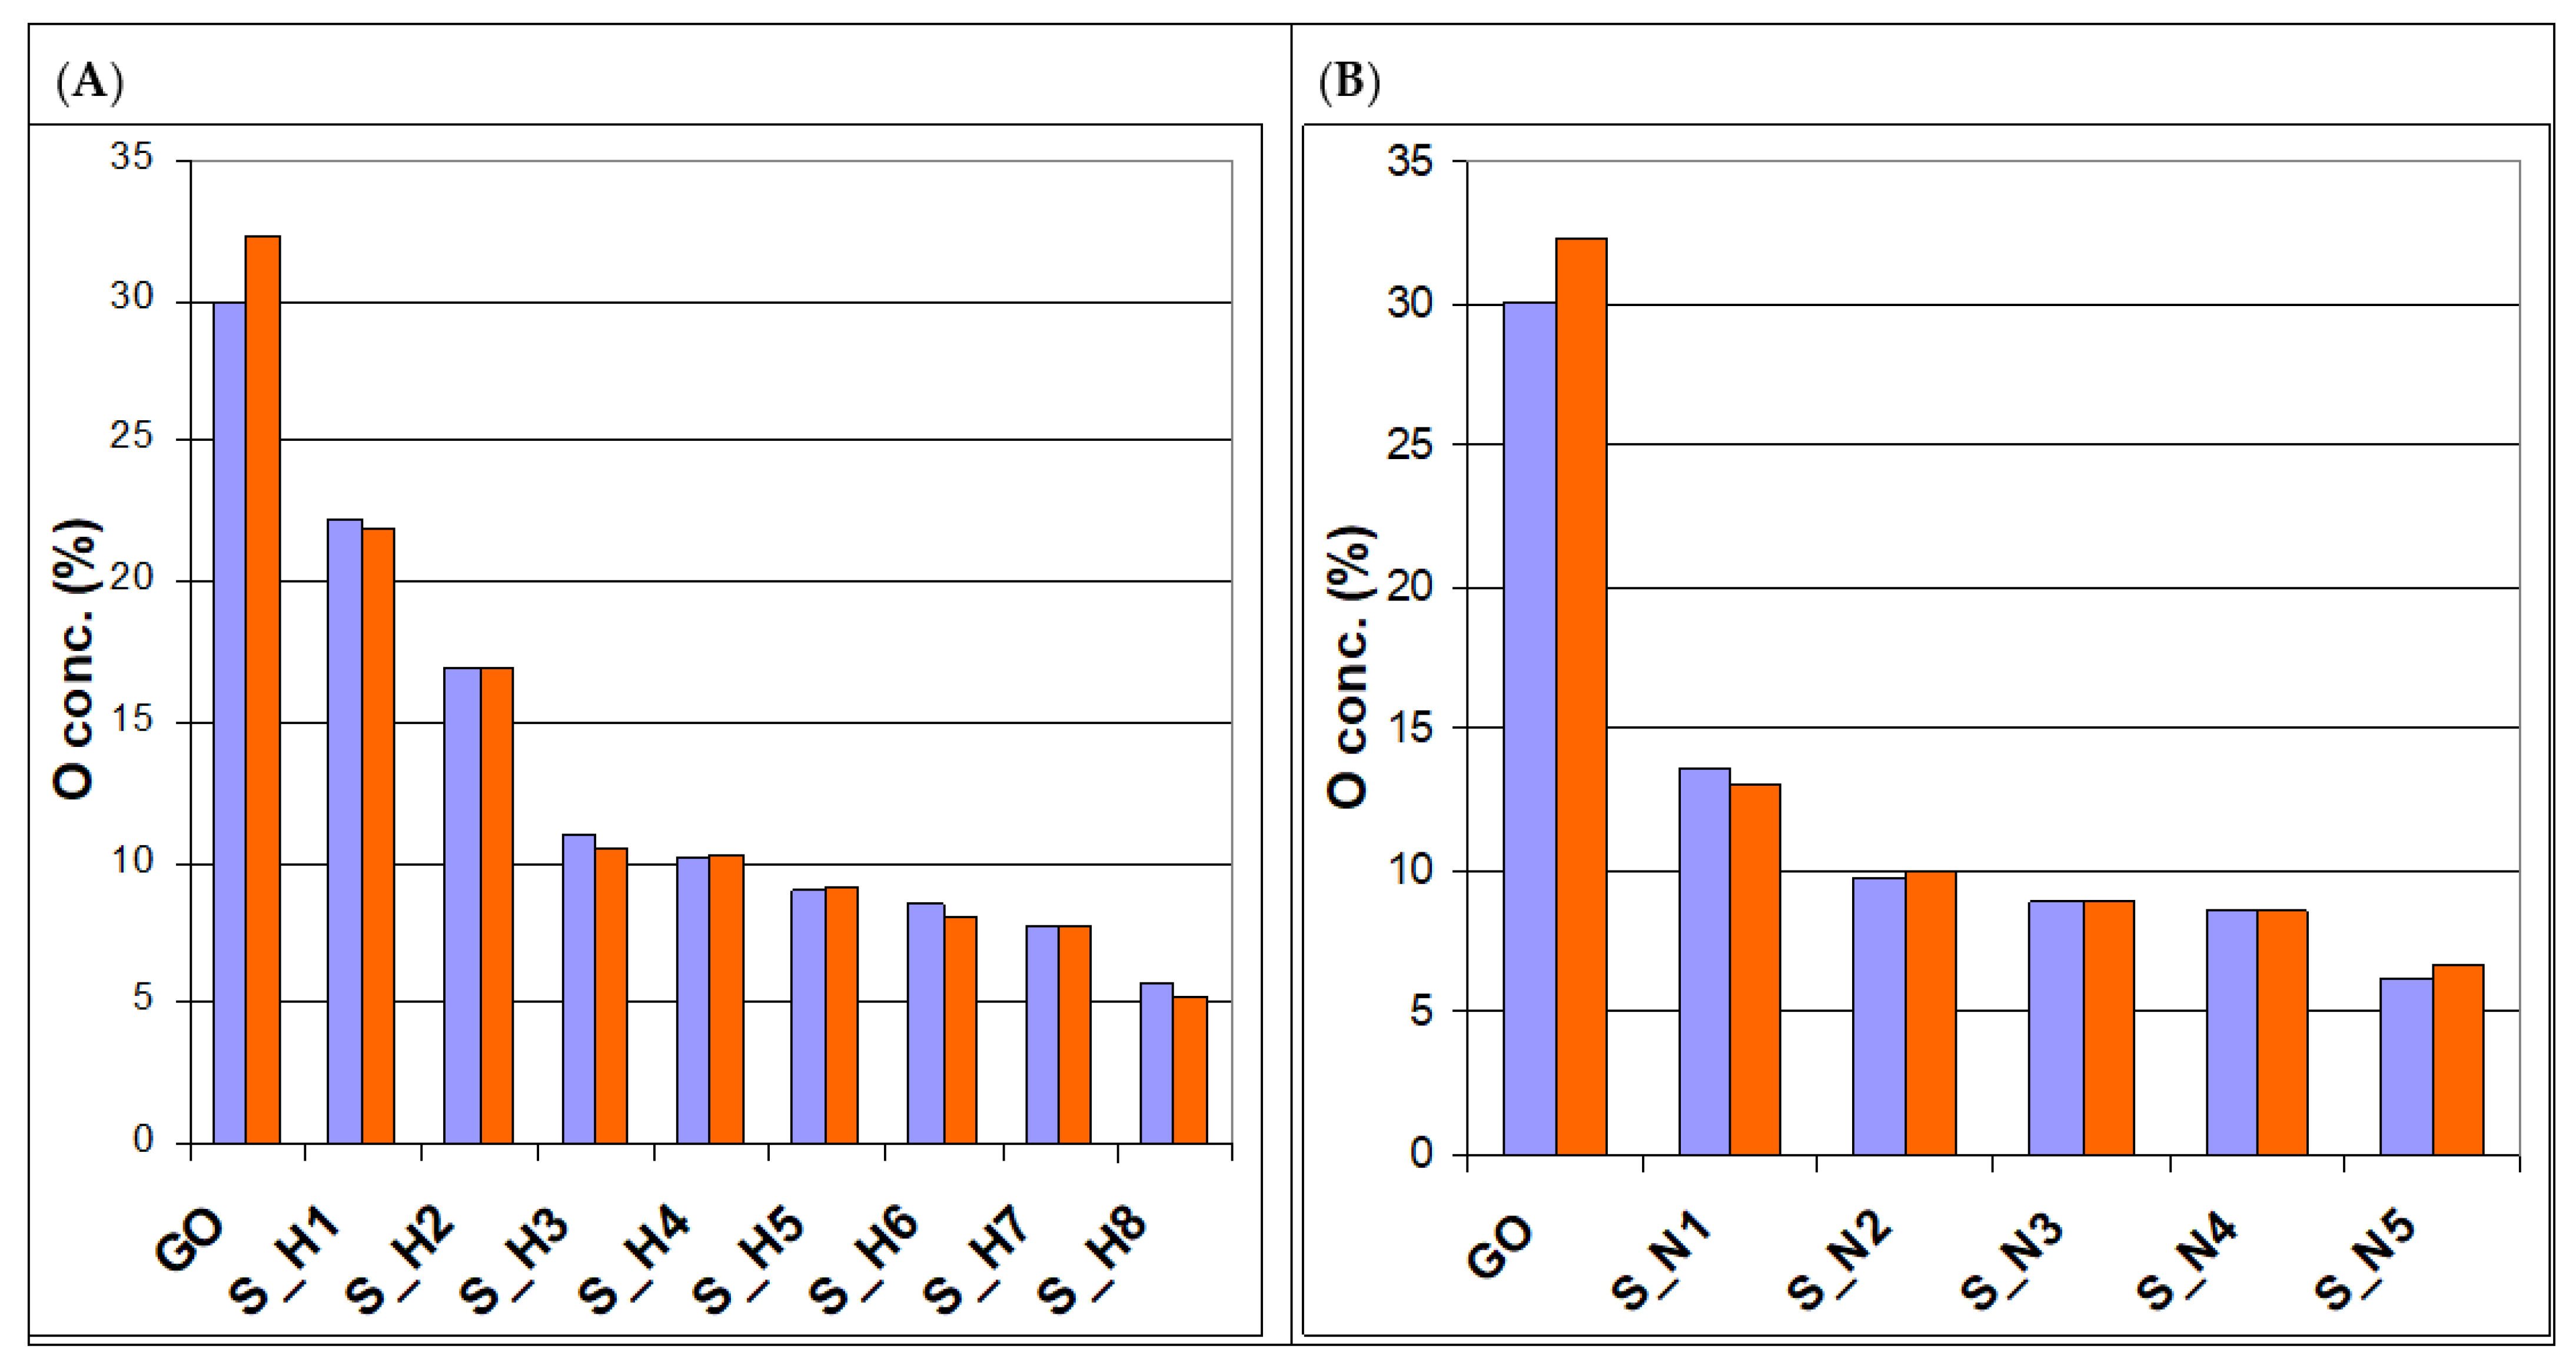
| Sample | O conc. (%) | COx conc. (%) | Sample | O conc. (%) | COx conc. (%) |
|---|---|---|---|---|---|
| GO | 32.34 | 30.02 | |||
| S_H1 | 21.86 | 22.24 | S_N1 | 30.02 | 32.34 |
| S_H2 | 16.94 | 16.96 | S_N2 | 13.59 | 13.07 |
| S_H3 | 10.50 | 10.98 | S_N3 | 9.78 | 9.97 |
| S_H4 | 10.29 | 10.21 | S_N4 | 8.91 | 8.91 |
| S_H5 | 9.09 | 9.01 | S_N5 | 8.62 | 8.63 |
| S_H6 | 8.06 | 8.52 | |||
| S_H7 | 7.72 | 7.76 | |||
| S_H8 | 5.32 | 5.77 |
Publisher’s Note: MDPI stays neutral with regard to jurisdictional claims in published maps and institutional affiliations. |
© 2022 by the authors. Licensee MDPI, Basel, Switzerland. This article is an open access article distributed under the terms and conditions of the Creative Commons Attribution (CC BY) license (https://creativecommons.org/licenses/by/4.0/).
Share and Cite
Liu, W.; Speranza, G. Chemical Reduction of GO: Comparing Hydroiodic Acid and Sodium Borohydride Chemical Approaches by X-ray Photoelectron Spectroscopy. C 2022, 8, 20. https://doi.org/10.3390/c8020020
Liu W, Speranza G. Chemical Reduction of GO: Comparing Hydroiodic Acid and Sodium Borohydride Chemical Approaches by X-ray Photoelectron Spectroscopy. C. 2022; 8(2):20. https://doi.org/10.3390/c8020020
Chicago/Turabian StyleLiu, Wei, and Giorgio Speranza. 2022. "Chemical Reduction of GO: Comparing Hydroiodic Acid and Sodium Borohydride Chemical Approaches by X-ray Photoelectron Spectroscopy" C 8, no. 2: 20. https://doi.org/10.3390/c8020020