Article

Decolorization of Textile Azo Dye via Solid-State Fermented Wheat Bran by Lasiodiplodia sp. YZH1

1
Key Laboratory of Cultivated Land Quality Monitoring and Evaluation, Ministry of Agriculture and Rural Affairs, Yangzhou University, Yangzhou 225127, China
2
Agriculture Products Safety and Environment, College of Agriculture, Yangzhou University, Yangzhou 225127, China
3
Agricultural Botany Department, Faculty of Agriculture, Kafrelsheikh University, Kafr El-Sheikh 33516, Egypt
4
Botany and Microbiology Department, College of Science, King Saud University, P.O. Box 2455, Riyadh 11451, Saudi Arabia
5
National Institute of Laser Enhanced Sciences (NILES), Cairo University, Giza 12613, Egypt
6
Biotechnology Department, Faculty of Science, Damietta University, New Damietta 34517, Egypt
7
College of Environmental Science and Engineering, Yangzhou University, Yangzhou 225127, China
*
Author to whom correspondence should be addressed.
J. Fungi 2023, 9(11), 1069; https://doi.org/10.3390/jof9111069
Submission received: 30 September 2023 / Revised: 24 October 2023 / Accepted: 27 October 2023 / Published: 1 November 2023

Abstract

:
Textile dyes are one of the major water pollutants released into water in various ways, posing serious hazards for both aquatic organisms and human beings. Bioremediation is a significantly promising technique for dye decolorization. In the present study, the fungal strain Lasiodiplodia sp. was isolated from the fruiting bodies of Schizophyllum for the first time. The isolated fungal strain was examined for laccase enzyme production under solid-state fermentation conditions with wheat bran (WB) using ABTS and 2,6-Dimethoxyphenol (DMP) as substrates, then the fermented wheat bran (FWB) was evaluated as a biosorbent for Congo red dye adsorption from aqueous solutions in comparison with unfermented wheat bran. A Box–Behnken design was used to optimize the dye removal by FWB and to analyze the interaction effects between three factors: fermentation duration, pH, and dye concentration. Fourier transform infrared spectroscopy (FTIR), X-ray diffraction (XRD), and scanning electron microscopy (SEM) were applied to study the changes in the physical and chemical characteristics of wheat bran before and after fermentation. An additional experiment was conducted to investigate the ability of the Lasiodiplodia sp. YZH1 to remove Congo red in the dye-containing liquid culture. The results showed that laccase was produced throughout the cultivation, reaching peak activities of ∼6.2 and 22.3 U/mL for ABTS and DMP, respectively, on the fourth day of cultivation. FWB removed 89.8% of the dye (100 mg L−1) from the aqueous solution after 12 h of contact, whereas WB removed only 77.5%. Based on the Box–Behnken design results, FWB achieved 93.08% dye removal percentage under the conditions of 6 days of fermentation, pH 8.5, and 150 mg L−1 of the dye concentration after 24 h. The fungal strain removed 95.3% of 150 mg L−1 of the dye concentration after 8 days of inoculation in the dye-containing liquid culture. These findings indicate that this strain is a worthy candidate for dye removal from environmental effluents.

1. Introduction

The rapid increase in industrialization and urbanization has led to the manufacture of numerous chemicals, including dyes that have been utilized in several industries, such as textiles, food, pharmaceuticals, cosmetics, plastics, and paper [1,2]. Water pollution with dyestuff prevents light from penetrating the water, directly threatening the life of aquatic creatures [3]. For human beings, a lot of synthetic dyes are toxic, mutagenic, and carcinogenic. They have a negative effect on the liver, kidneys, central nervous system, and reproductive system [3,4].
Azo dyes are widely utilized in the textile industry. They contribute to 60 to 70% of all textile industry dyes [5]. The azo dye Congo red, which is widely used in the textile and paper industries, has been found to be exceedingly carcinogenic and harmful to both humans and the environment [6]. Therefore, industrial effluents should be appropriately treated before being released into the environment to avoid environmental issues.
A number of physical and chemical techniques, including adsorption, coagulation–flocculation, photocatalytic ozonation, and inorganic catalysis, have been proposed for dye decolorization [7,8,9]. However, many industrial dyes pass through the majority of these conventional processes, and because of their high level of resistance to temperature, light, and oxidizing agents, they remain in the environment for a long period of time. Moreover, these conventional techniques tend to produce secondary pollutants and are rather expensive [10]. Consequently, it is still vital to develop advanced, economical, and environmentally friendly wastewater treatment technologies in order maintain natural resources.
Biosorption, biodegradation, and fungal remediation are widely used as a biological method for dye decolorization [11]. Physical adsorption and microbial degradation are important examples of techniques with a high potential for dye removal in water [12,13]. Adsorption has been a commonly utilized method for removing dyes and other recalcitrant compounds from effluents, due to its relatively low input, high effectiveness, and simplicity of use; therefore, adsorption has emerged as a promising alternative for wastewater decolorization [14,15].
Plant biomasses are either directly used as biosorbents to remove dyes from effluents or pretreated/modified to improve adsorptive efficacy via thermal, physical, chemical, microbial, or their combination procedures [16,17]. The combination of the adsorption and the microbial decolorization by solid-state fermentation (SSF) is an effective method for dye removal and enzyme production. Some reports suggest that the removal of dyes from textile wastewaters can be achieved using SSF techniques with agricultural wastes such rice bran, yeast biomass, and sugarcane bagasse [18,19,20].
Dye removal optimization has been performed in many previous reports to improve the efficiency of decolorization by one factor at a time (OFAT) [21,22,23] and response surface methodology (RSM) methods [24,25,26]. RSM is a collection of mathematical and statistical techniques used for studying the relationship between influencing factors and response values, and for obtaining the optimal conditions for a specific system [27,28,29]. The Box–Behnken design (BBD) is one of the most commonly used RSM methods. It allows the modeler to explore the relationships between the design variables and the response variables without having to conduct a large number of experiments, which is the main advantage of this analysis; it also has simple and efficient software operation, and high reliability and accuracy of optimization results [30,31]. BBD has been successfully used for the optimization of process parameters in dye decolorization [32,33], heavy metal biosorption [34,35], and a wide range of other field applications [36,37].
Agricultural wastes inoculated with different fungi that produce ligninolytic enzymes such as laccase, manganese peroxidase (MnP), and lignin peroxidase (LiP) have been widely used to treat recalcitrant xenobiotics in wastewater, including dyes [38,39,40,41,42]. White rot fungi (WRF) are widely used to treat recalcitrant xenobiotics in wastewater, as they are the major producer of ligninolytic enzymes [43].
Lasiodiplodia is a phytopathogenic fungus from the family Botryosphaeriaceae. This fungus and other fungi belonging to this family often remain latent inside their host tissues, in which they are able to establish endophytic infections for long periods [44]. Some previous reports referred to the capability of the fungus Lasiodiplodia to produce ligninolytic enzymes and its application in the bioremediation of different contaminants [45,46].
Dye removal using inoculation of fungal strains in agricultural wastes under solid-state fermentation conditions has previously been extensively reported [47,48,49]. However, there is little information available on the effect of SSF of agricultural wastes on dye removal efficiency in aqueous solutions.
In this study, the fungal strain Lasiodiplodia sp. YZH1 was isolated from the fruiting bodies of Schizophyllum for the first time, and used for wheat bran fermentation under SSF (FWB) as a cheap biosorbent for Congo red removal from aqueous solutions. A Box–Behnken design was used for the optimization of dye removal by FWB. The characterization of the wheat bran before and after fungal fermentation was performed. Additionally, dye removal assay by inoculation of Lasiodiplodia sp. YZH1 in aqueous solutions with different dye concentrations was also studied.

2. Materials and Methods

2.1. Isolation and Identification of the Fungal Isolate

The fungus used in this study was isolated from fruiting bodies of the white rot fungus Schizophyllum. The healthy fruiting bodies of schizophyllum were collected from a tree trunk on the Yangzijin campus, Yangzhou University, Jiangsu, China, then kept in a sealed plastic bag and brought immediately to the laboratory for the isolation.
The samples were chopped into small segments (~3 mm) under aseptic conditions, their surfaces sterilized with 70% ethanol solution for 1 min, then rinsed with sterilized distilled water for 1 min. Sterilized segments were air-dried aseptically then cultured on PDA (potato dextrose agar) and incubated at 28 °C (GWP-160A; Huadeli Scientific Equipment Co., Ltd.; Hefei, China). The plates were checked daily for the growth of fungal mycelium. The hyphae were transferred to fresh PDA plates to obtain a pure culture and then maintained on PDA slants at 4 °C.
The fungal isolate was identified by morphological traits based on microscopic features. In addition, the 18S rRNA gene sequencing technique was used for molecular identification.
Genomic DNA was extracted using Ezup Column Fungal Genomic DNA Extraction Kit (Sangon Biotech, Shanghai, China). The 18S rRNA of the fungal strain was amplified by PCR using the universal fungal primers NS1, NS6 as presented by White et al. [50]. The amplification protocol was as follows: one cycle of initial denaturation at 95 °C for 4 min followed by 30 cycles of denaturation at 95 °C for 20 s, annealing at 58 °C for 20 s, extension at 72 °C for 1 min, and final extension at 72 °C for 10 min. The PCR product was gel-purified using SanPrep Column DNA Gel Recovery Kit and sequenced in Sangon Biotech® (Shanghai, China) by using ABI® 3730xl DNA sequencer (Applied Biosystems, Waltham, MA, USA).
The obtained sequence was compared with those deposited in GenBank database for significant alignments using the Basic Alignment Search Tool (BLAST) (https://blast.ncbi.nlm.nih.gov) (accessed on 12 September 2023).
The phylogenetic analysis was conducted using MEGA software (version 11.0.13) and the neighbor-joining algorithm from 1000 bootstrap replicates [51].

2.2. Solid-State Fermentation of Wheat Bran

Wheat bran was selected in this study as a substrate for solid-state fermentation with the fungal isolate to assay ligninolytic enzymes and as a biosorbent for Congo red dye decolorization.
A total of 5 g of wheat bran (obtained from Yangtai chemical Co., Ltd., Yangzhou, China) was sieved to collect 2 mm sized particles and then mixed with 5 mL of basal salt media ((NH4)2SO4, 1.4 g L−1; Na2HPO4·12H2O, 1.2 g L−1; KH2PO4, 0.9 g L−1; KCl, 0.5 g L−1; MgSo4·7H2O, 0.5 g L−1; yeast extract, 0.5 g L−1; and pH 6.5), then autoclaved at 121 °C for 20 min.
The SSF process was performed in Petri dishes (100 mm) as follows. A total of 10 g of the autoclaved mixer of wheat bran and the basal media was distributed in each sterilized Petri dish, then each Petri dish was inoculated at the center by one mycelial agar disk (with a diameter of ~5 mm) from the colony margin of 7-day-old culture of the fungal isolate grown on PDA plates. After that, all plates were incubated at 28 °C for 8 days.
Fungal growth was recorded every 24 h by analyzing photographic records using the image-processing software Image J® v. 1.53 (National Institutes of Health, Bethesda, MD, USA) [49,52,53,54]. The growth of the fungus was described as a fungal growth area (%) and calculated using the following equation:
F u n g a l   g r o w t h % = A P e t r i   d i s h   t o t a l   a r e a × 100
where A is the growth area obtained by the Image J software at different days sampled (cm2), and the Petri dish total area is 56.7 cm2.
The biomass loss of the substrate was measured at two-day intervals for up to eight days by calculating the weight changes in the dry fermented wheat bran in each Petri dish for each sampling day [55]. All experiments were performed in triplicate for each sampling day using the same operational conditions.

2.3. Enzyme Extraction and Assay

The extracellular enzyme of laccase was determined at 2-day intervals (2, 4, 6, and 8 days after inoculation) by transferring the contents of the fermented wheat bran from each Petri dish (as described above) into a 250 mL conical flask. Then, 50 mL of 0.05 mM citric acid buffer (pH 4.8) was added into each flask and stirred on an orbital shaker (Honghua, HY-5B, Changzhou, China) at room temperature, 200 rpm for 2 h. The mixture was then primary filtered via Whatman filter paper and secondary filtered with a 0.45 µm syringe filter. The change in pH was also recorded. The fungal extract after the two-step filtration was considered as a crude enzyme and used immediately for enzyme assay.
Laccase activity was determined spectrophotometrically (INESA, 722N, Shanghai China) by recording the oxidation of 5mM 2,2′-azinobis-(3-ethylbenzothiazoline-6-sulfonic acid) (ABTS) in Na-citrate buffer (0.05 mM, pH 4.8) at 420 (ε420 = 36,000 M−1 cm−1) nm for 5 min. The assay mixture contained 100 µL of crude enzyme, 800 µL Na-citrate buffer (0.05 mM, pH 4.8), and 100 µL of 5 mM ABTS and was assayed at room temperature at OD 420 nm at 1 min intervals for 5 min [56]. Additionally, laccase activity was assayed using another substrate 2,6-Dimethoxyphenol (DMP) at OD 470 nm (ε470 = 27,500 M−1 cm−1) at 1 min intervals for 5 min [48]. The assay mixture contained 50 µL of the crude enzyme, 1000 µL Na-citrate buffer (0.05 mM, pH 4.8), and 200 µL of 10 mM DMP. One unit of enzyme activity was defined as the amount of enzyme required to oxidize 1 μmol of the substrate in 1 min. The activity was expressed as U/mL.

2.4. Dye Removal Assays

Dye removal efficiency was studied with 6-day-fermented wheat bran in Petri dishes by the fungal isolate Lasiodiplodia sp. YZH1 (denoted as FWB) in comparison with unfermented wheat bran (referred as WB). WB and FWB from each Petri dish were oven-dried at 70 °C for 48 h and ground to a fine powder and then stored at room temperature prior to use for decolorization studies.
Dye adsorption assays were performed in 50 mL Falcon tubes by transferring 250 mg of the WB or FWB and 25 mL of 100 mg L−1 of Congo red solution (prepared from 1000 mg L−1 stock solution in distilled water). Then, all tubes were shaken at 150 rpm and 25 °C using an orbital shaker for 12 h.
A 1 mL solution from each Falcon tube was withdrawn at 0, 2, 4, 6, 9, and 12 h, then centrifuged at 12,000 rpm for 10 min at 4 °C. The Congo red decolorization efficiency was determined in the supernatant spectrophotometrically by measuring the absorbance at the dye λMax (498 nm), which is the wavelength of the maximum visible absorbance of Congo red; it is referred to as dye removal percentage (%) and calculated according to Equation (2) [53,57,58]:
D y e   r e m o v a l   p e r c e n t a g e ( % ) = A 0 A t A 0 × 100
where A0 denotes the initial dye absorbance and At denotes the absorbance at the t sampling time.

2.5. Optimization of Dye Removal

FWB was employed to statistically analyze the interaction effects between three independent variables (factors)—fermentation duration of the wheat bran (X1), pH of the dye solution (X2), and dye concentration (X3)—on its dye removal percentage, and to predict the optimal conditions for dye removal using the Box–Behnken design.
The three independent variables were studied at three levels; –1, 0, and 1 (the range and levels are listed in Table 1).
The experimental matrix was designed using the Box–Behnken design in the Design-Expert® software version 13.0.5.0. The response variable (predicted response) was measured with the following second-order polynomial quadratic model equation:
Y = β 0 + i β i X i + i j β i j X i X j + i i β i i X i 2
where Y is the predicted response (dye removal percentage), β0 is the intercept, βi is the linear coefficient, βii is the quadratic coefficient, and βij is the interactive coefficient. Xi, Xj represent independent variables.
The model was laboratory-validated for dye removal to confirm the model’s prediction. Every design was carried out in 3 replicates, and the mean value was reported.
The experiment was carried out in 50 mL Falcon tubes by transferring 250 mg of the oven-dried FWB previously fermented by the fungal isolate (as mentioned before) for 2, 4, or 6 days (according to the experiment design) and 25 mL of dye solution. Then, all tubes were shaken at 150 rpm and 25 °C using an orbital shaker. A stock solution of 1000 mg L−1 Congo red in distilled water was used to prepare the required dye concentrations; 0.1 N solutions of HCl or NaOH were used to adjust the pH. The dye removal percentage as the response variable was measured at contact times of 12 and 24 h, as mentioned before [53].

2.6. Characterization of Wheat Bran

Wheat bran before and after fermentation was analyzed using Fourier transform infrared spectroscopy (FTIR; Thermofisher Nicolet IS50, Waltham, MA, USA) to detect the functional groups involved in the adsorption process. IR spectroscopy is a useful technique for investigating changes in the constituent structure of lignocellulosic materials [59]. The samples were prepared as potassium bromide pellets and FTIR spectra were measured in the range of 4000–400 cm−1. X-ray diffraction (XRD; Bruker D8 Advance) at U = 40 kV and 1 = 30 mA was used to examine the crystalline structures, and scanning electron microscopy (SEM; Thermofisher Quanta 250FEG) was employed to study the surface morphology of wheat bran before and after fermentation.

2.7. Dye Removal Assay in Liquid Cultures

An additional experiment was performed to examine the impact of different dye concentrations on dye removal efficiency by Lasiodiplodia sp. YZH1 in the dye-containing liquid culture; one mycelial agar disk was inoculated at a quantity of 50 mL in an Erlenmeyer flask containing 25 mL of the basal media ((NH4)2 SO4,1.4 g L−1; Na2HPO4·12H2O, 1.2 g L−1; KH2PO4, 0.9 g L−1; KCl, 0.5 g L−1; MgSO4·7H2O, 0.5 g L−1; yeast extract, 0.5 g L−1; and glucose, 1.0 g L−1) and Congo red in concentrations of 50, 150, and 250 mg L−1. Then, it was incubated at 28 °C and 150 rpm in an orbital shaker incubator. The dye removal percentage was assessed spectrophotometrically after 2, 4, 6, and 8 days of incubation.

3. Results and Discussion

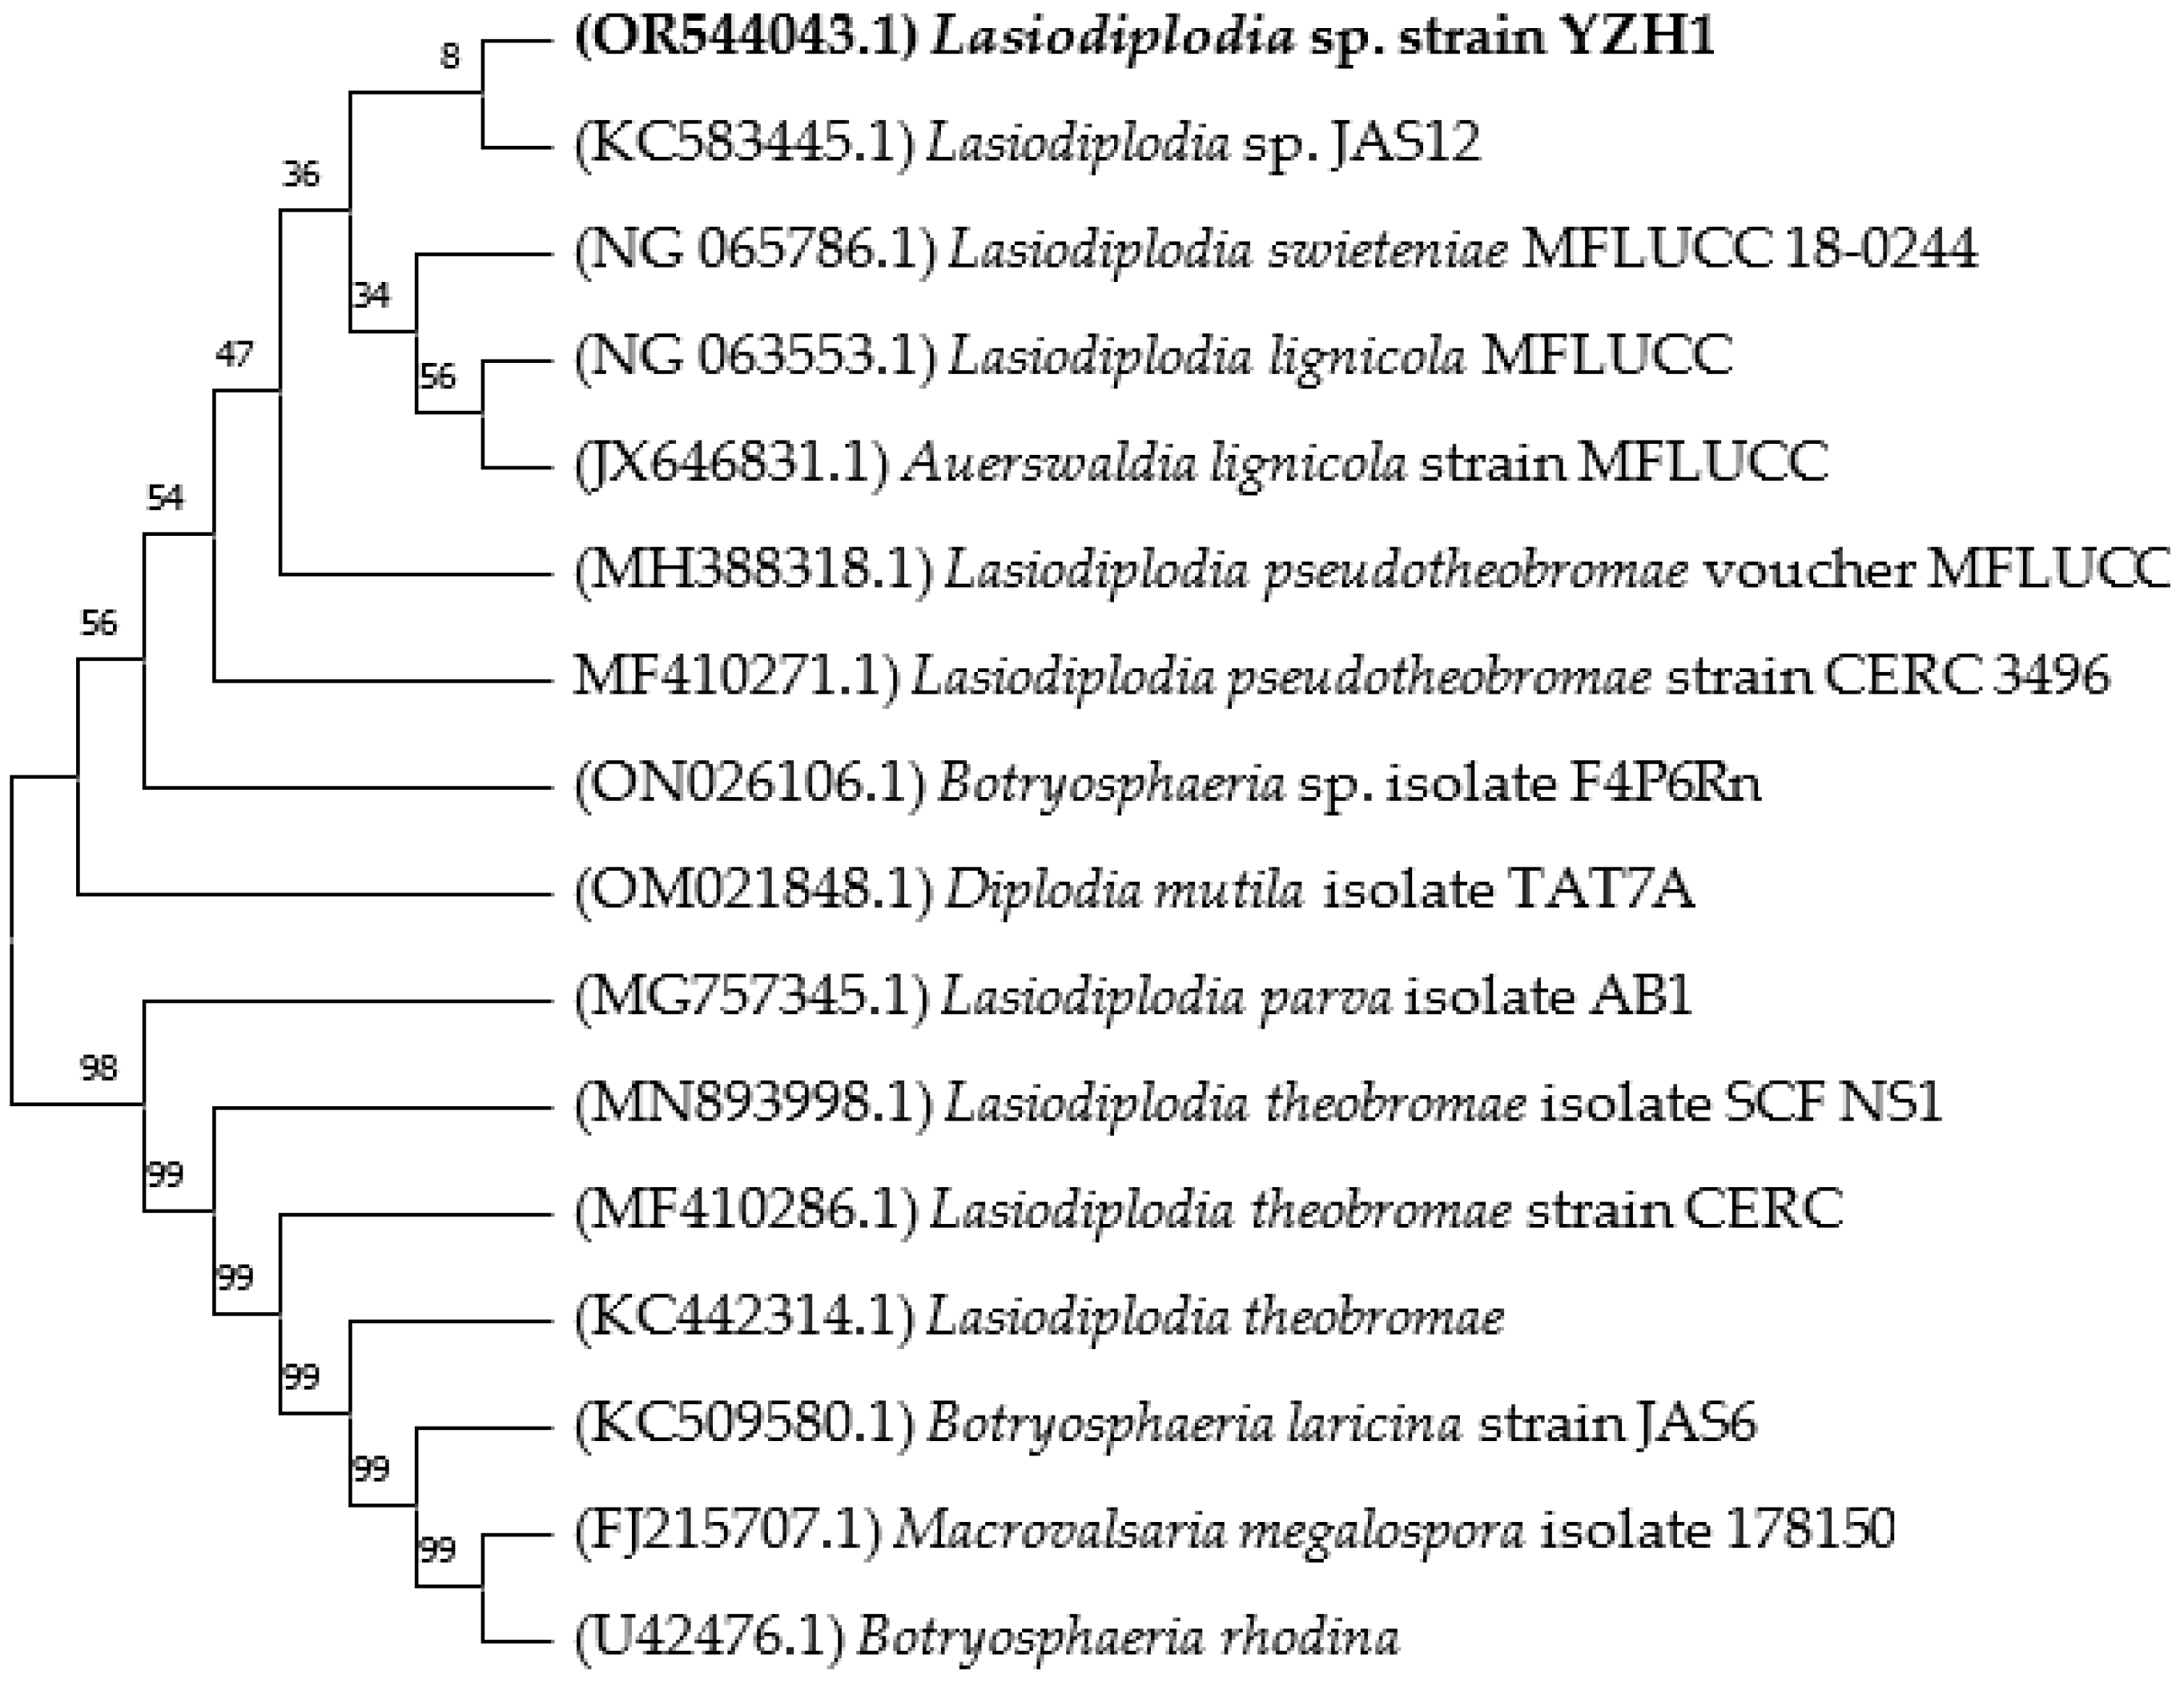
3.1. Isolation and Identification of the Fungal Isolate

The morphological characteristics of the fungal isolate indicate that it is a fast-growing fungus with abundant aerial mycelium which covers the whole Petri dish area (56.75 cm2) in just 3 days on PDA. The initial color of the mycelium is white, then it turns smoke-gray and produces pycnidia with age.
After comparison with other 18S rRNA sequences in the NCBI database using BLAST search, the sequencing results revealed that this strain belongs to Lasiodiplodia sp. YZH1 (Figure 1). The sequences were deposited in NCBI GenBank under the accession number OR544043.
Li et al. studied the endophytic microorganisms associated with the fruiting bodies of Tricholoma matsutake, and revealed that they have 13 fungal strains [60]. Calcarisporium arbuscula is a mushroom endophytic fungus, which primarily produces the aurovertin antibiotic [61]. This is the first report isolation of an endophytic fungus Lasiodiplodia from the white rot fungus Schizophyllum. Earlier reports demonstrated the capability of the fungus.
Lasiodiplodia can be used to produce ligninolytic enzymes, such as laccase and MnP. and for applications in the bioremediation of different contaminants. Lasiodiplodia isolated from biota containing a high concentration of xenobiotics exhibited the ability to degrade malachite green [45]. The endophytic fungus strain Lasiodiplodia sp. MXSF31 isolated from oleracea showed the ability to remove multiple heavy metals (Cd-, Pb-, and Zn) from contaminated water and soils [46].

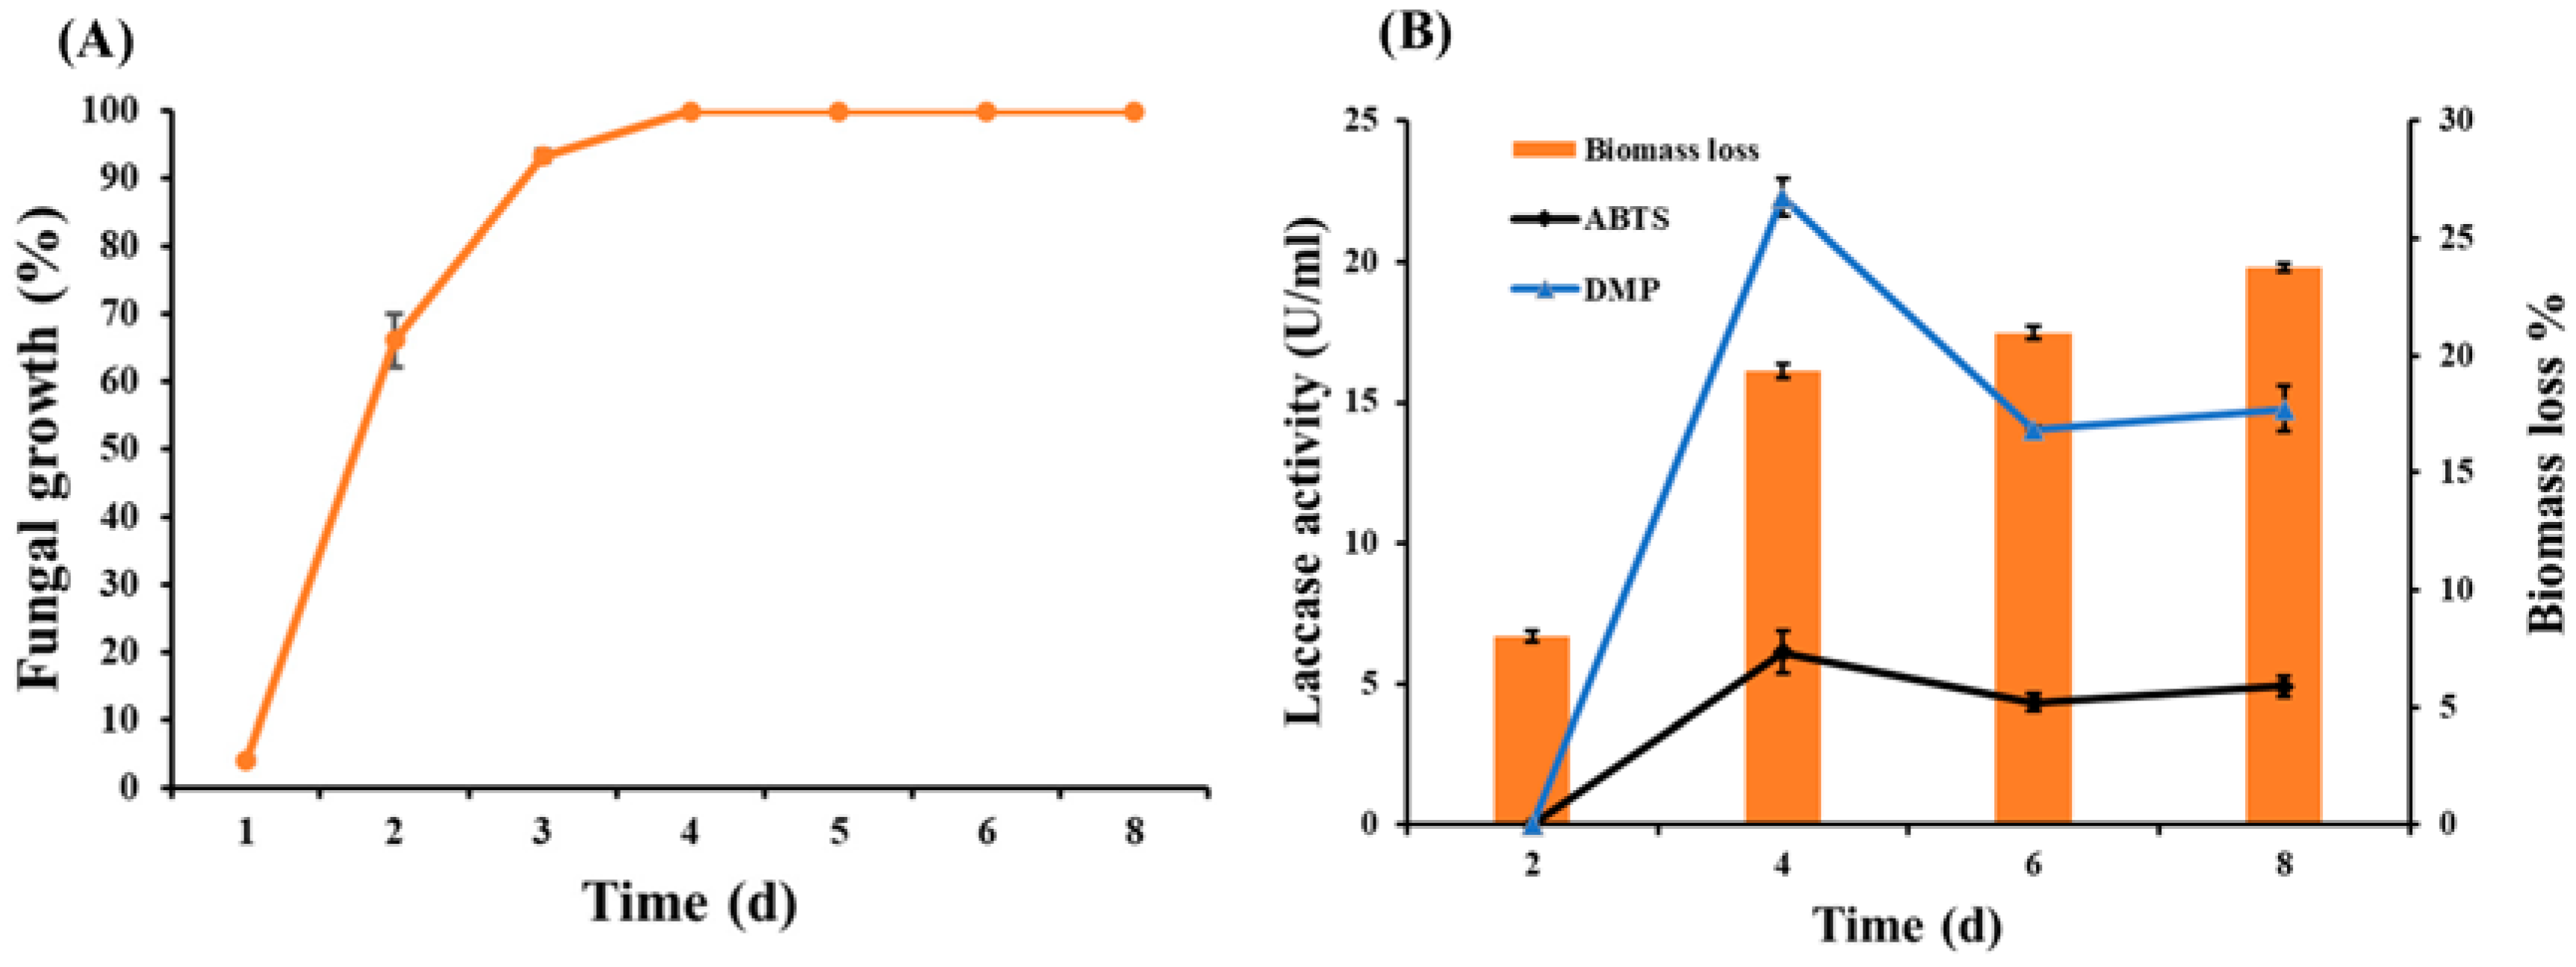
3.2. Fungal Growth, Enzyme Assay, and Biomass Loss during SSF of Wheat Bran

Wheat bran was selected in this work for solid-state fermentation with Lasiodiplodia sp. YZH1. As shown in Figure 2A, the initial mycelium production signal was observed after one day of cultivation, then the surface growth reached the maximum and stopped on the fourth day due to lack of dish area.
Due to the rapid growth of the fungi during cultivation, the biomass of the substrate was continuously consumed and considerably decreased, reaching the highest biomass loss of 23.7% after 8 days of culture (Figure 2B). The continuous loss of the substrate biomass despite the mycelium growth stopped after four days due to lack of area; this can be attributed to the three-dimensional growth of the fungus, while the fungal growth was recorded as fungal growth area (%) through the relationship between the mycelium surface area and the Petri dish surface area. This is similar to results with peanut shell fermented with white rot fungus Pycnoporus SYBC-L3, which achieved 25% biomass loss but after 25 days of cultivation [48].
The pH of the wheat bran continuously increased during the fermentation, reaching 5.2 on the eighth day (Supplementary Figure S1). Khaled et al. indicated that Bacillus cereus and Pseudomonas parafulva had maximum laccase production in alkaline conditions [62].
Laccase was produced throughout the cultivation, reaching its peak activities of 6.2 and 22.3 U/mL for the substrates ABTS and DMP, respectively, on the fourth day of cultivation (Figure 2B). The difference between these two values is due to the different type of substrate, including their different molar absorptivity coefficient and different wavelength at which each substrate absorbs.
Laccase activity expressed by Lasiodiplodia sp. YZH1 under SSF conditions of WB (6.2 U/mL) was higher than that expressed by Trametes villosa in SSF of wood chip biochar (0.7 U/mL) [49] and Trametes sp. in SSF of cassava residue (0.15 U/mL) [63]. On the contrary, it was lower than laccase produced by Trametes pubescens under semi-SSF conditions of sunflower seed shells (30.27 U/mL) [64] and Trametes versicolor in SSF of corncobs (911 U/mL) [65].
Enzyme production and biomass loss could vary considerably depending on the use of a culture substrate with a different biomass structure as well as the use of a different fungal strain with different abilities for biomass degradation.

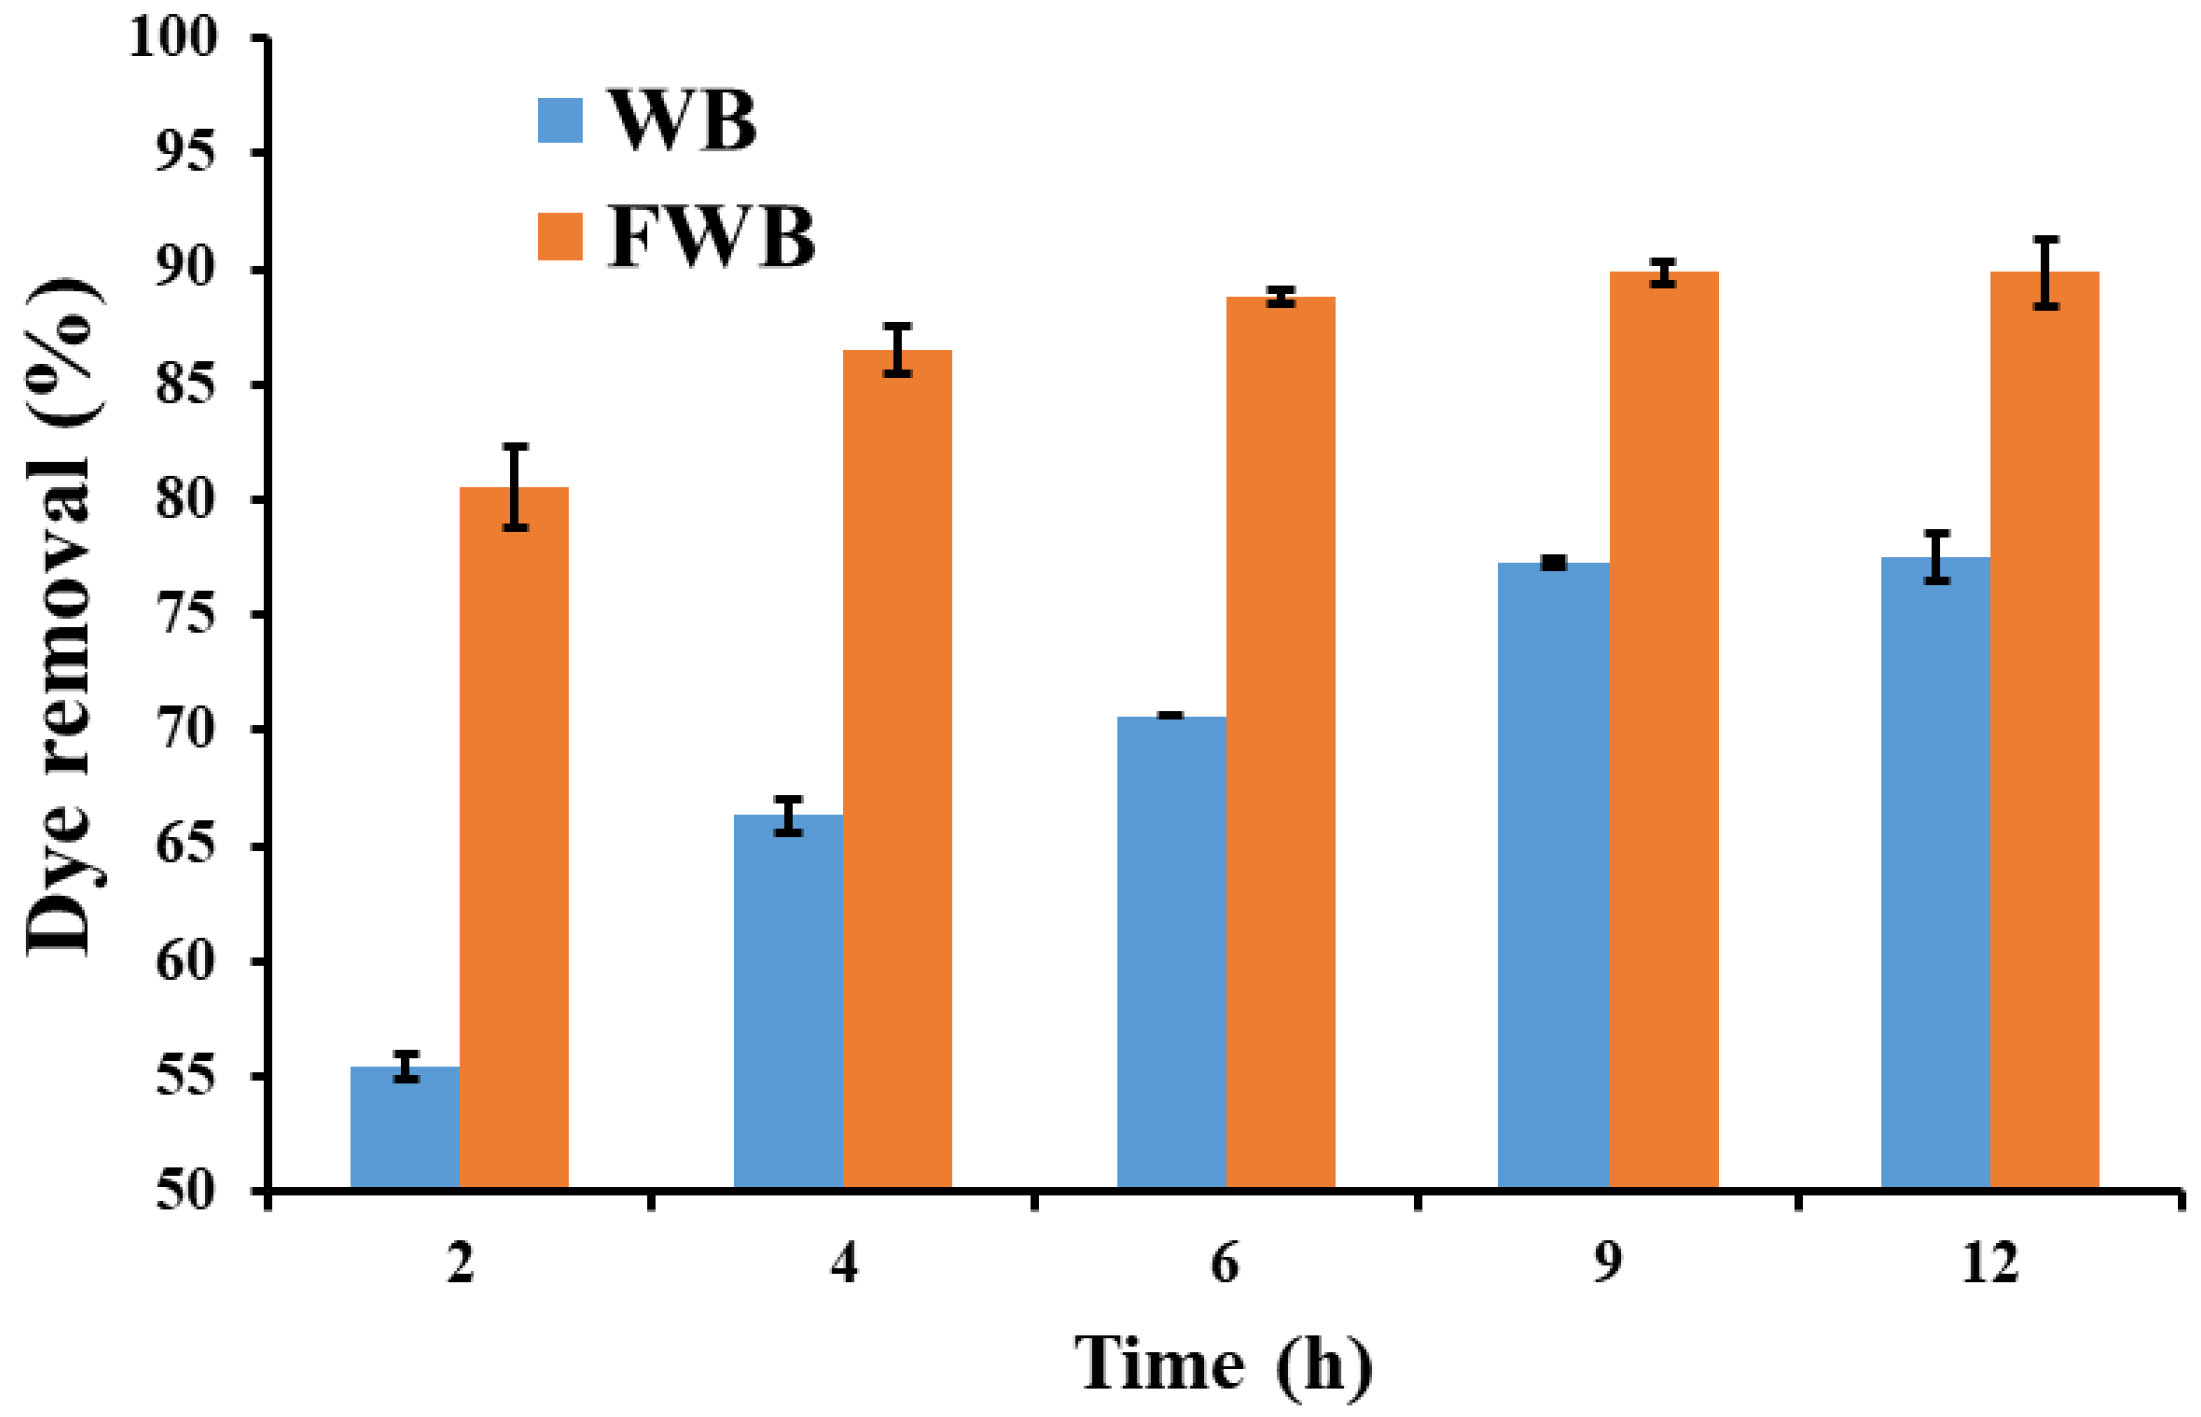
3.3. Dye Removal Efficiency

The Congo red (100 mg L−1) removal assay by 6-day-fermented wheat bran (FWB) in comparison with unfermented wheat bran (WB) is shown in Figure 3.
It can be observed that Congo red removal by FWB increased sharply within the first 2 h of adsorption (80.5%), probably because there are several binding sites and enough surface area, and then after 9 h, it remained relatively constant because the available free active sites were saturated by dye molecules. Then it reached its peak (89.8%) after 12 h. On the other hand, WB removed about 55.4% of the dye in the first 2 h, reaching the maximum of 77.5% after 12 h.
These findings revealed that the dye removal efficiency of the fermented wheat bran with the fungal isolate Lasiodiplodia sp. YZH1 (FWB) was remarkably higher than that of unfermented wheat bran (WB), which is likely due to the fact that the fungal growth changed the physicochemical properties of the substrate (wheat bran), as well as increased the available binding active sites on the surface of the mycelium.
Similar results were obtained by Li and Jia, who recorded a maximum dye decolorization of 89.71% by Schizophyllum sp. under SSF of rice hull after 41 h [66]. In other reports, T. versicolor decolorized 86% of Astrazon Black dye adsorbed onto wheat bran under SSF conditions [67], and wheat straw and corncob shreds removed 70–75% of the color from dye solutions [68].

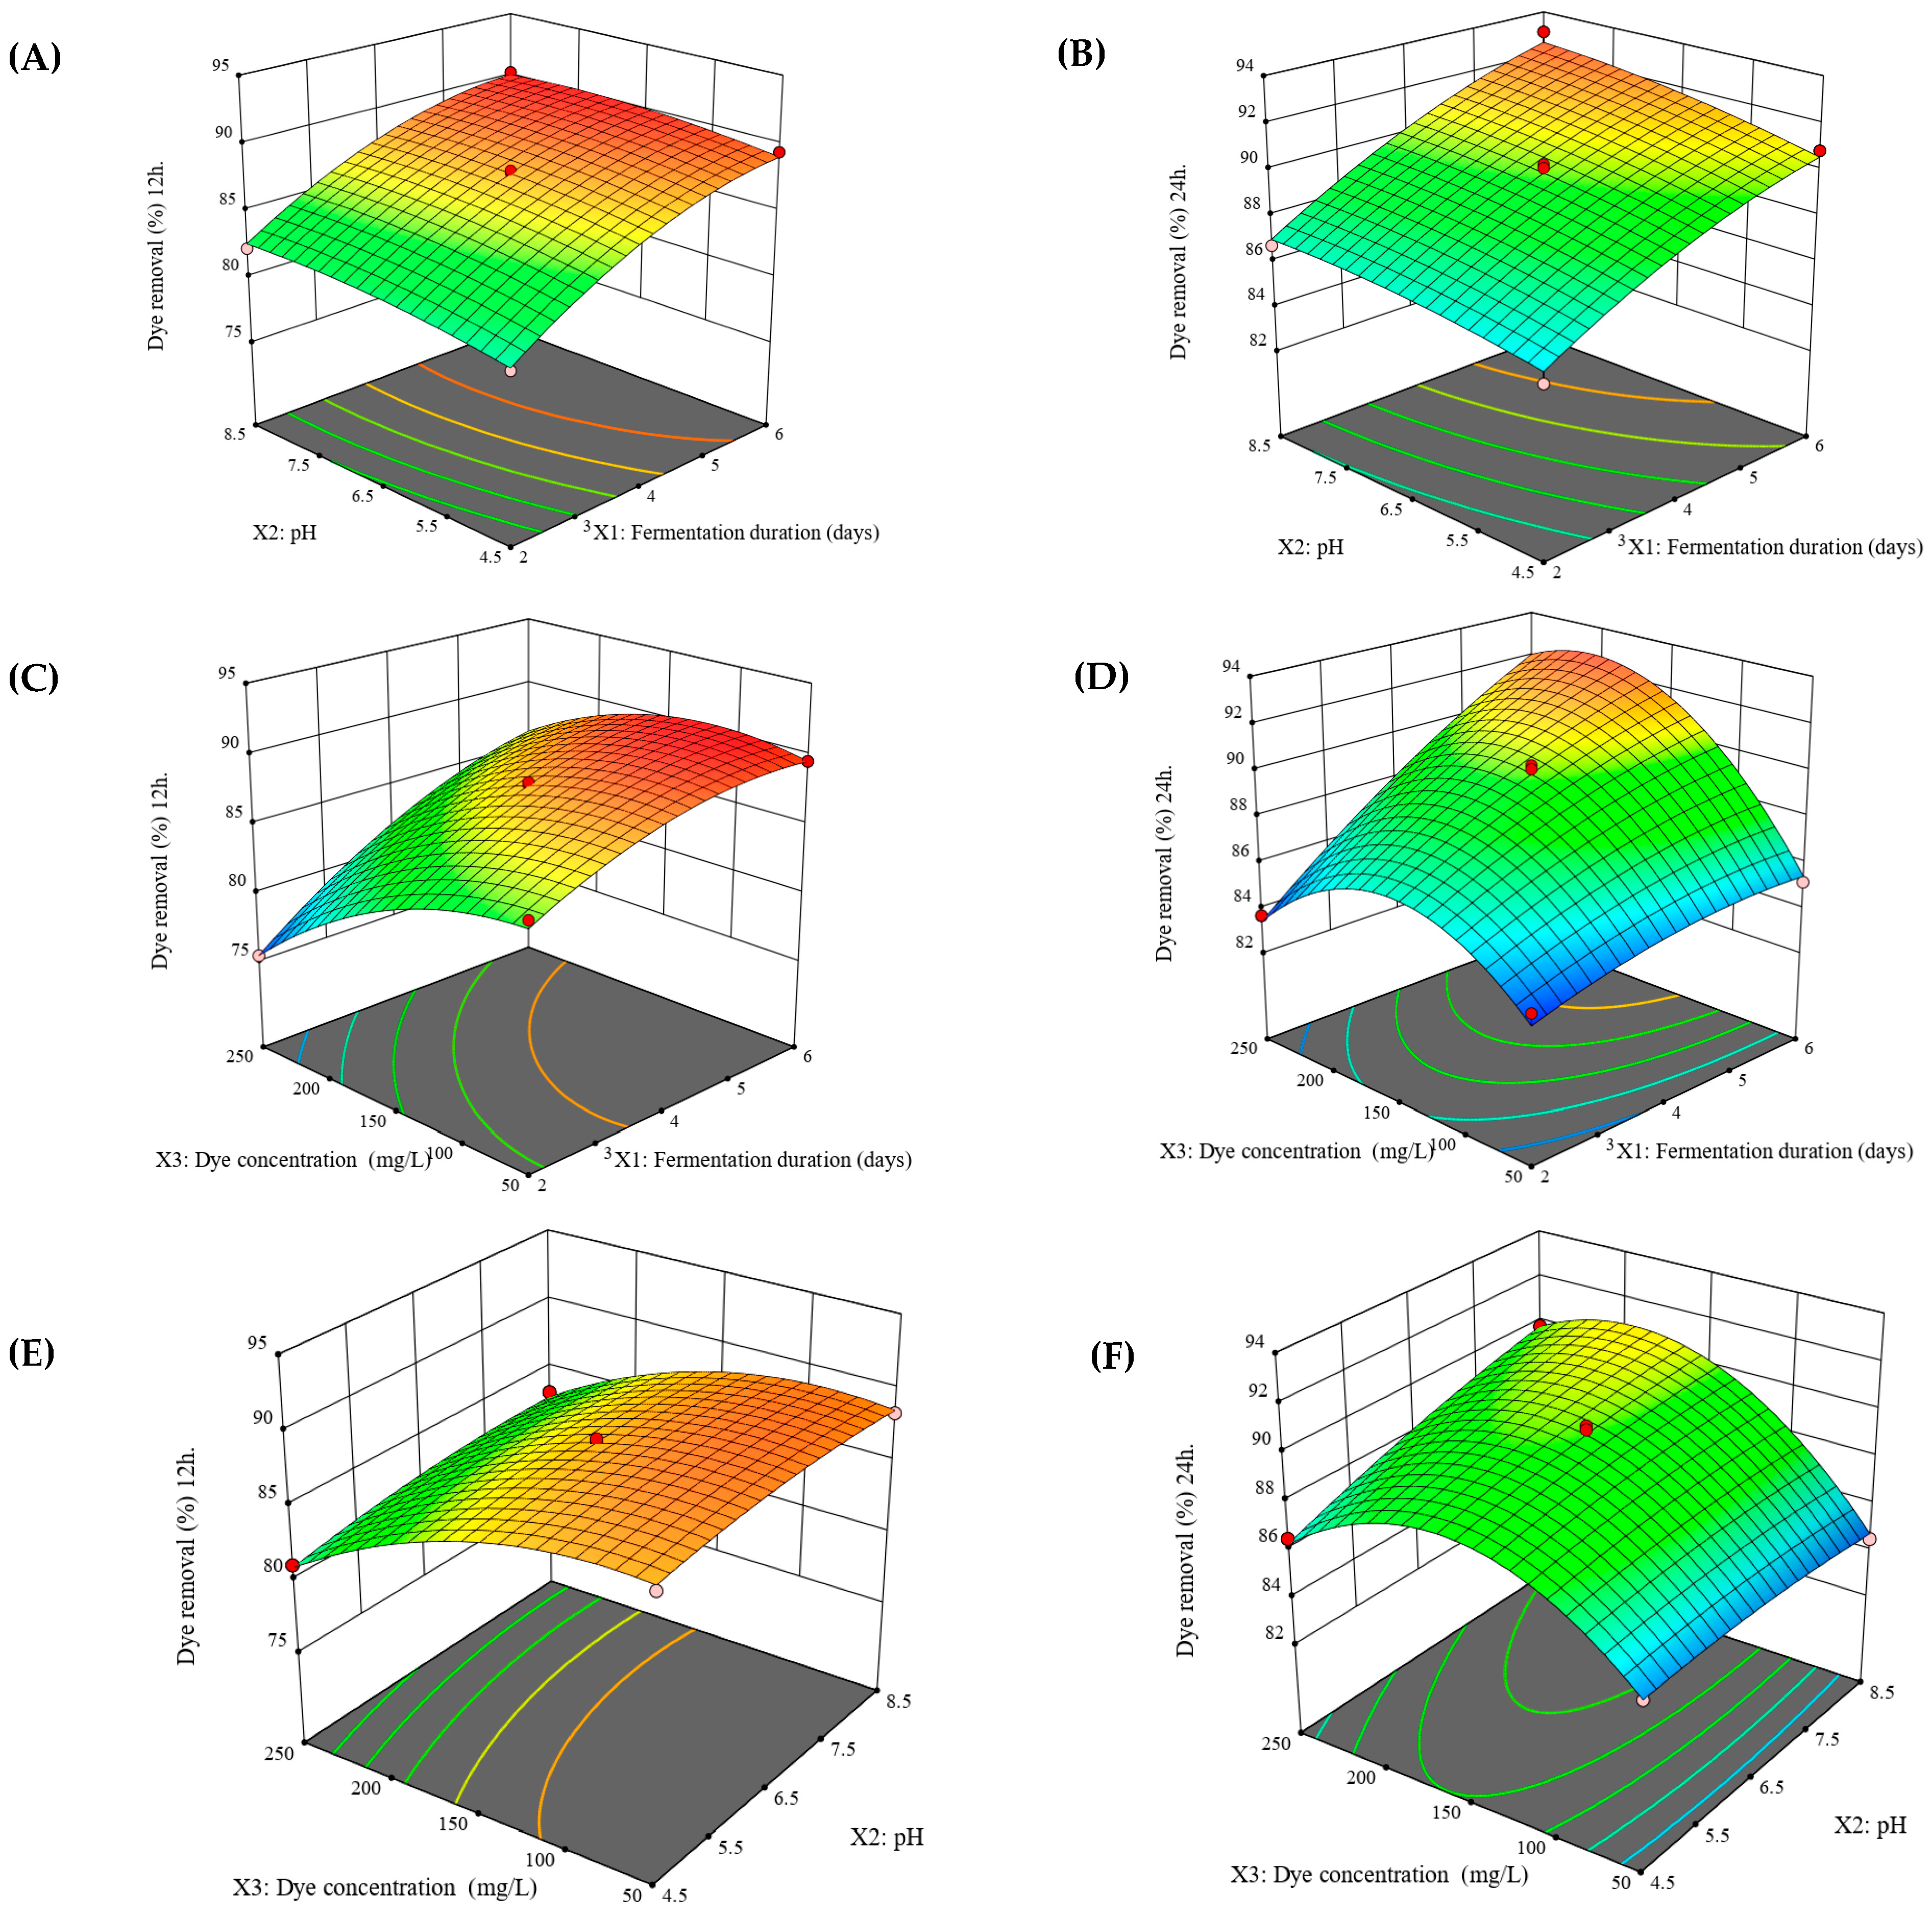
3.4. Optimization of Dye Removal

The Box–Behnken design (BBD) was applied in this study to determine the interactive effects between the three independent variables—fermentation duration of wheat bran by the fungal strain (X1), pH of the solution (X2), and dye concentration (X3)—and to predict the optimal conditions for dye removal. The experimental design generated by the Design-Expert® software had a total of 15 runs (carried out in triplicate), as displayed in Table 2.
As can be seen, the dye removal percentage obtained from this study was in the range of 75.35–90.26% and 83.66–93.07% for the contact time of 12 and 24 h, respectively. The highest dye removal percentages of 90.26% and 93.07% were recorded in run no. 12, while run no. 6 showed the lowest value of dye removal percentages (75.35 and 83.66%) for 12 and 24 h, respectively. It can also be seen that the predicted dye removal values are quite similar to the experimental values, which indicates the model’s accuracy in predicting dye removal.
According to analysis of variance (ANOVA) analysis, the following second-order polynomial quadratic model equations for dye removal were derived:
Y1 = 87.83 + 3.89 X1 + 0.6446 X2 − 3.2 X3 − 0.1372 X1 X2 + 1.54 X1 X3 + 0.3217 X2 X3 − 1.61 X12 − 0.5484 X22 − 2.24 X32
Y2 = 89.87 + 2.58 X1 + 0.7925 X2 + 1.56 X3 + 0.2198 X1 X2 + 1.74 X1 X3 + 0.9673 X2 X3 − 0.5967 X12 − 0.2843 X22 − 3.12 X32
where Y1 and Y2 are the predicted dye removal percentage (%) after contact time of 12 and 24 h, respectively, X1 is the fermentation duration (day), X2 is the solution pH, and X3 is the dye concentration (mg L−1).
The analysis of variance (ANOVA) for the quadratic prediction models (presented in Table 3 and Table 4) revealed that both models are significant for predicting the dye removal, as evidenced by the model’s F-value and low p-value (p < 0.05).
The p-values of both models are very low (<0.0001 and 0.0005 for 12 and 24 h, respectively), which indicates that both models are highly significant. The analysis also indicated that the lack of fit values was not significant in either model. The lack of fit of both models was 1.689 and 3.873 (for 12 and 24 h, respectively), with a p-value < 0.05. The non-significant lack of fit implies that the model is fit [69].
The coefficient of determination (R2) value was 0.9940 and 0.9854 (for Equations (1) and (2), respectively); a higher R2 value indicates that the model describes the data more effectively. The predicted R2 of 0.9142 and 0.8225 is in reasonable agreement with the adjusted R2 of 0.9833 and 0.9592 for models 1 and 2, respectively, proving the generated model’s accuracy in predictions.
The Adeq Precision metric measures the signal-to-noise ratio. A ratio greater than 4 is desirable. The present ratios are 33.4159 and 18.1209, indicating that the signal is strong enough to be used to navigate the design space.
p-values are also used to find out the significance of each variable, which in turn helps in understanding the pattern of interaction between the tested factors. It is obvious from the data that the linear effect of all variables (X1, X2, X3) was significant (p < 0.05) in the dye removal. The interaction effect between X1X3 on the dye removal was significant, while the interactions between X1X2 were not significant.

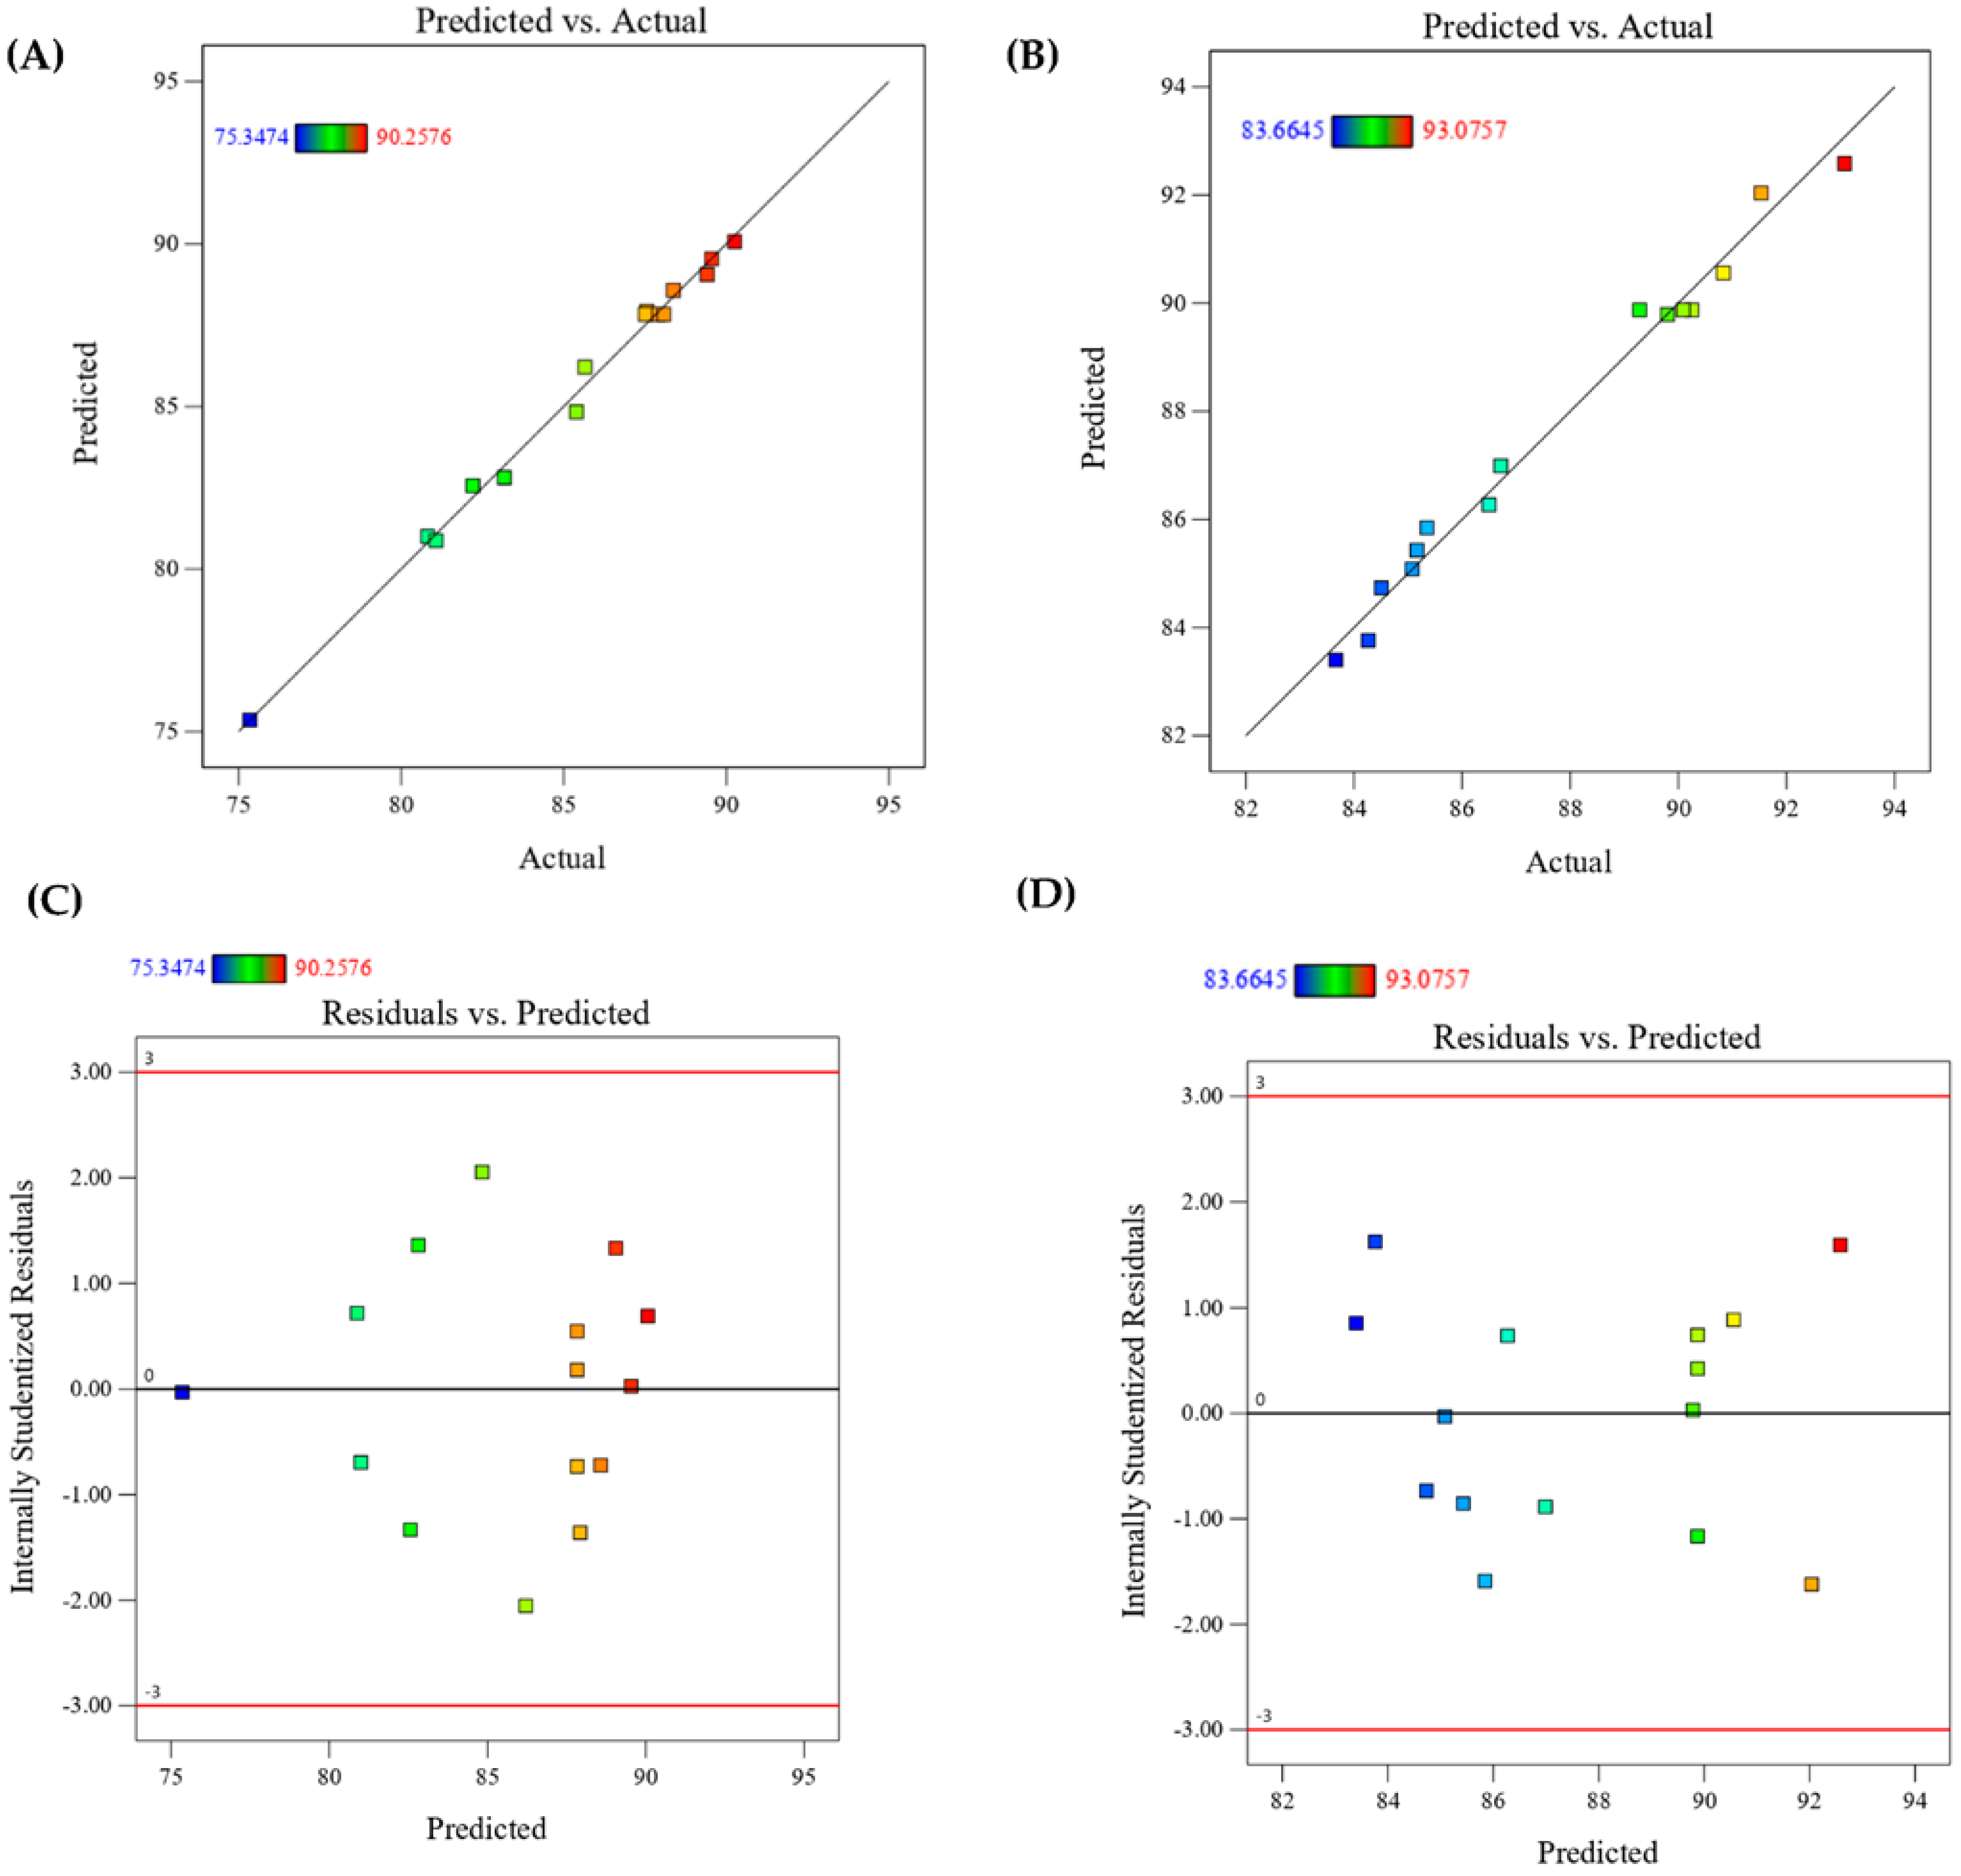
3.5. Validation of the Design Model

The selected quadratic model was laboratory-validated by conducting an additional experiment at 6 days of wheat bran fermentation duration, 8.265 of pH dye solution, and 164.88 mg/L of dye concentration. The obtained results (Table 5) were 89.485 and 93.402% after a contact time of 12 and 24 h, respectively. These values came within the confidence interval as specified by the model, which confirms the accuracy of the model.
The actual values were plotted against predicted values in Figure 4A,B. It can be clearly seen that the actual and predicted values are linearly correlated, where the correlation coefficients are 0.997 and 0.992 for the dye removal percentage after the contact time of 12 and 24 h, respectively. The points are either on or very close to the 45-degree straight line, indicating that the residuals are normally distributed and the response surface model is accurate. This suggests that the experimental points are well-aligned with the predicted values and the quadratic model fits the data well.
Figure 4C,D show the residuals versus fitted response values (predicted). The residuals are randomly distributed, as the number of points above and below the horizontal line is approximately equal. Additionally, the residual values are within the range of ±3.00, which is considered a threshold for identifying outliers [70].
Three-dimensional (3D) response surface plots were created to illustrate the interactive effects of the three variables on the dye removal efficiency and the optimal value of each variable required to maximize dye removal %.
Figure 5 illustrates 3D surface plots of the interaction effect of each two variables on the dye removal by FWB after contact time of 12 and 24 h, while the third variable was set at the center point (level 0).
The simultaneous effect of wheat bran fermentation duration (X1) and pH of the solution (X2) on dye removal efficiency after 12 and 24 h, with the initial dye concentration (X3) fixed at the central point of 150 mg/L, is shown in Figure 5A,B. It can be seen that an increase in both fermentation duration and pH of the solution led to a significant increase in dye removal. Figure 5C,D show the interaction effect of fermentation duration and initial dye concentration on the dye removal. An increase in fermentation duration led to a significant increase in dye removal, and the interaction between these two factors had a highly significant effect (p-value < 0.05) on the dye removal efficiency.
Accordingly, the fermentation duration of wheat bran by the fungal strain plays an important role in dye removal percentage. As the fermentation period increases, the fungus growth in wheat bran increases. There are no data available in the literature about the effect of fermentation duration of the adsorbent on dye removal efficiency; however, this positive effect can mostly be attributed to the increase in mycelium content and the increase in the numbers of binding active sites as well as available surface area of the adsorbent as a result of increased fungal growth with increased fermentation duration, which was confirmed by FTIR, XRD, and SEM analysis.
The effect of pH and initial dye concentration on dye removal is displayed in Figure 5E,F. It’s obvious that, solution pH had a slight effect on dye removal, while the initial dye concentration had a significant effect on dye removal efficiency. An increase in dye concentration led to a significant decrease in dye removal, especially after a contact time of 12 h.
Tejada-Tovar et al. reported, at higher initial dye concentrations, the available active sites on the adsorbent are limited, which in turn lead to a reduction in the dye removal percentage [71]. Similar results were obtained by Arellano G. Rodríguez et al. who noted a negative correlation between removal efficiency and dye concentration occurred during Congo red removal by cocoa bean shells [72].
However, after the contact time of 24 h, the removal efficiency at first increased as the dye concentration increased, and then declined at higher dye concentrations (>150 mg L−1). This pattern of dye removal is also similarly reported by [73,74].
The maximum predicted dye removal of 89.877 and 93.076% after a contact time of 12 and 24 h, respectively, were achieved at 6 days fermentation duration, 8.266 pH and an initial dye concentration of 164.871 mg/L.

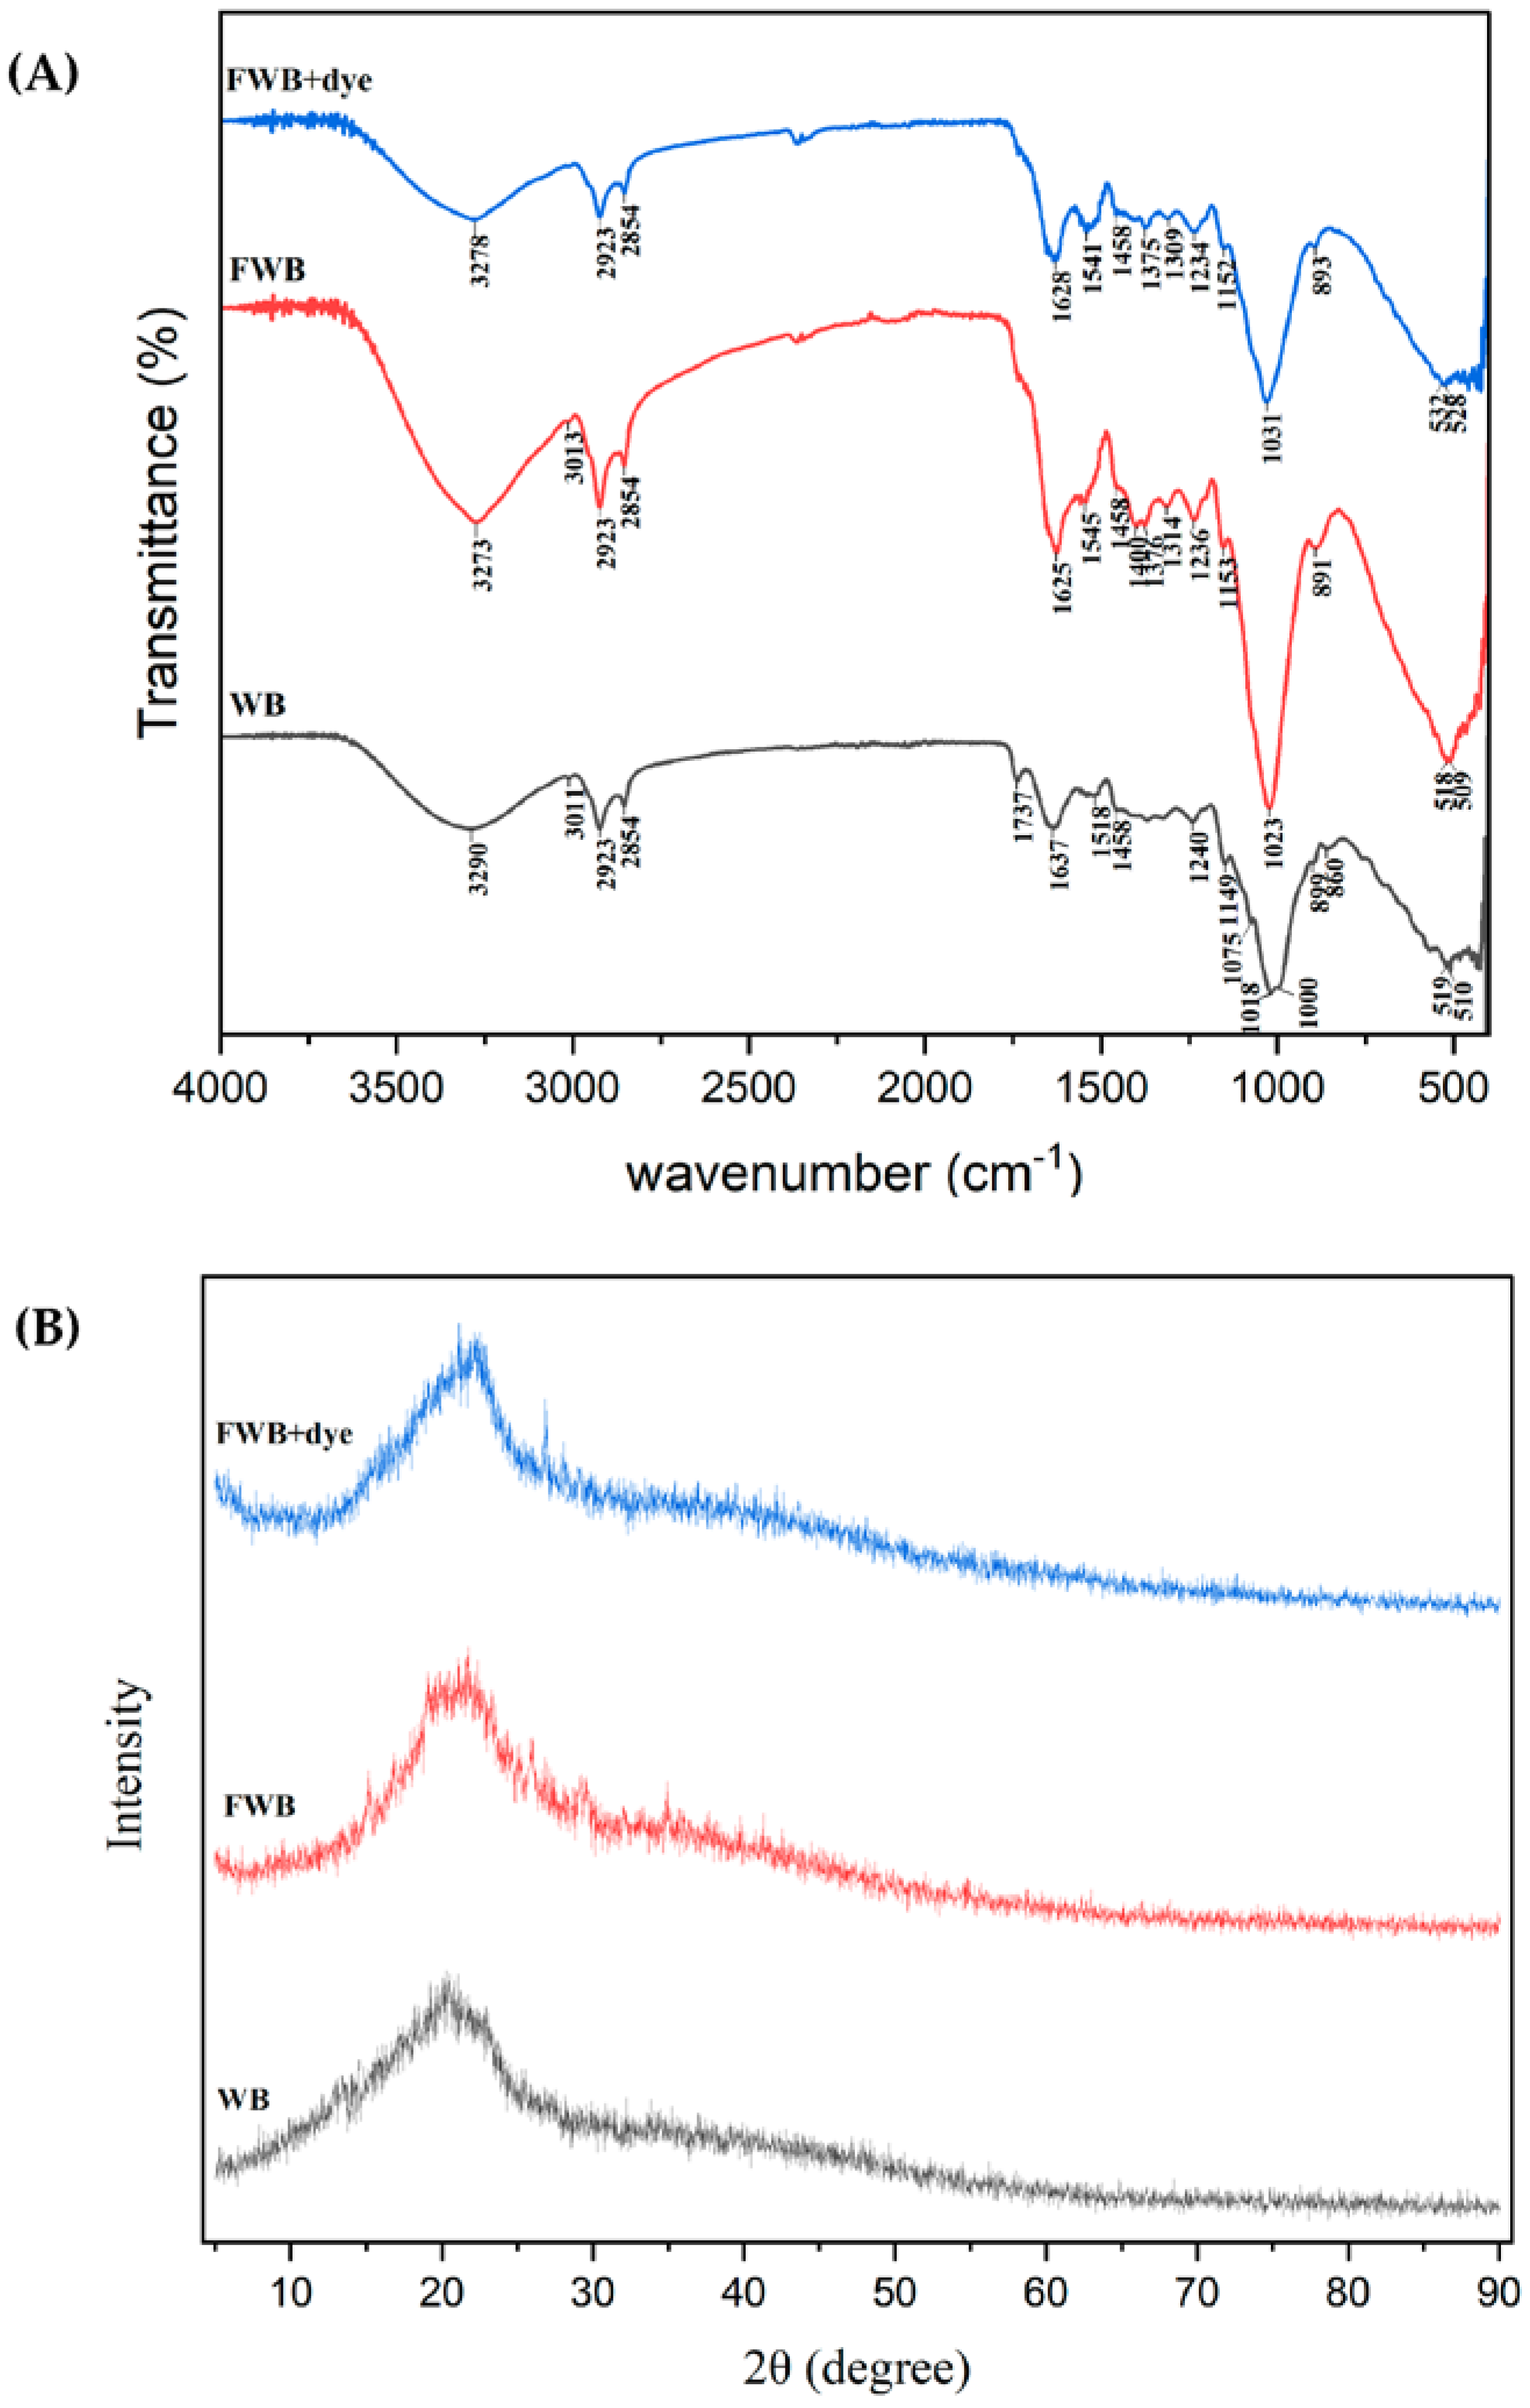
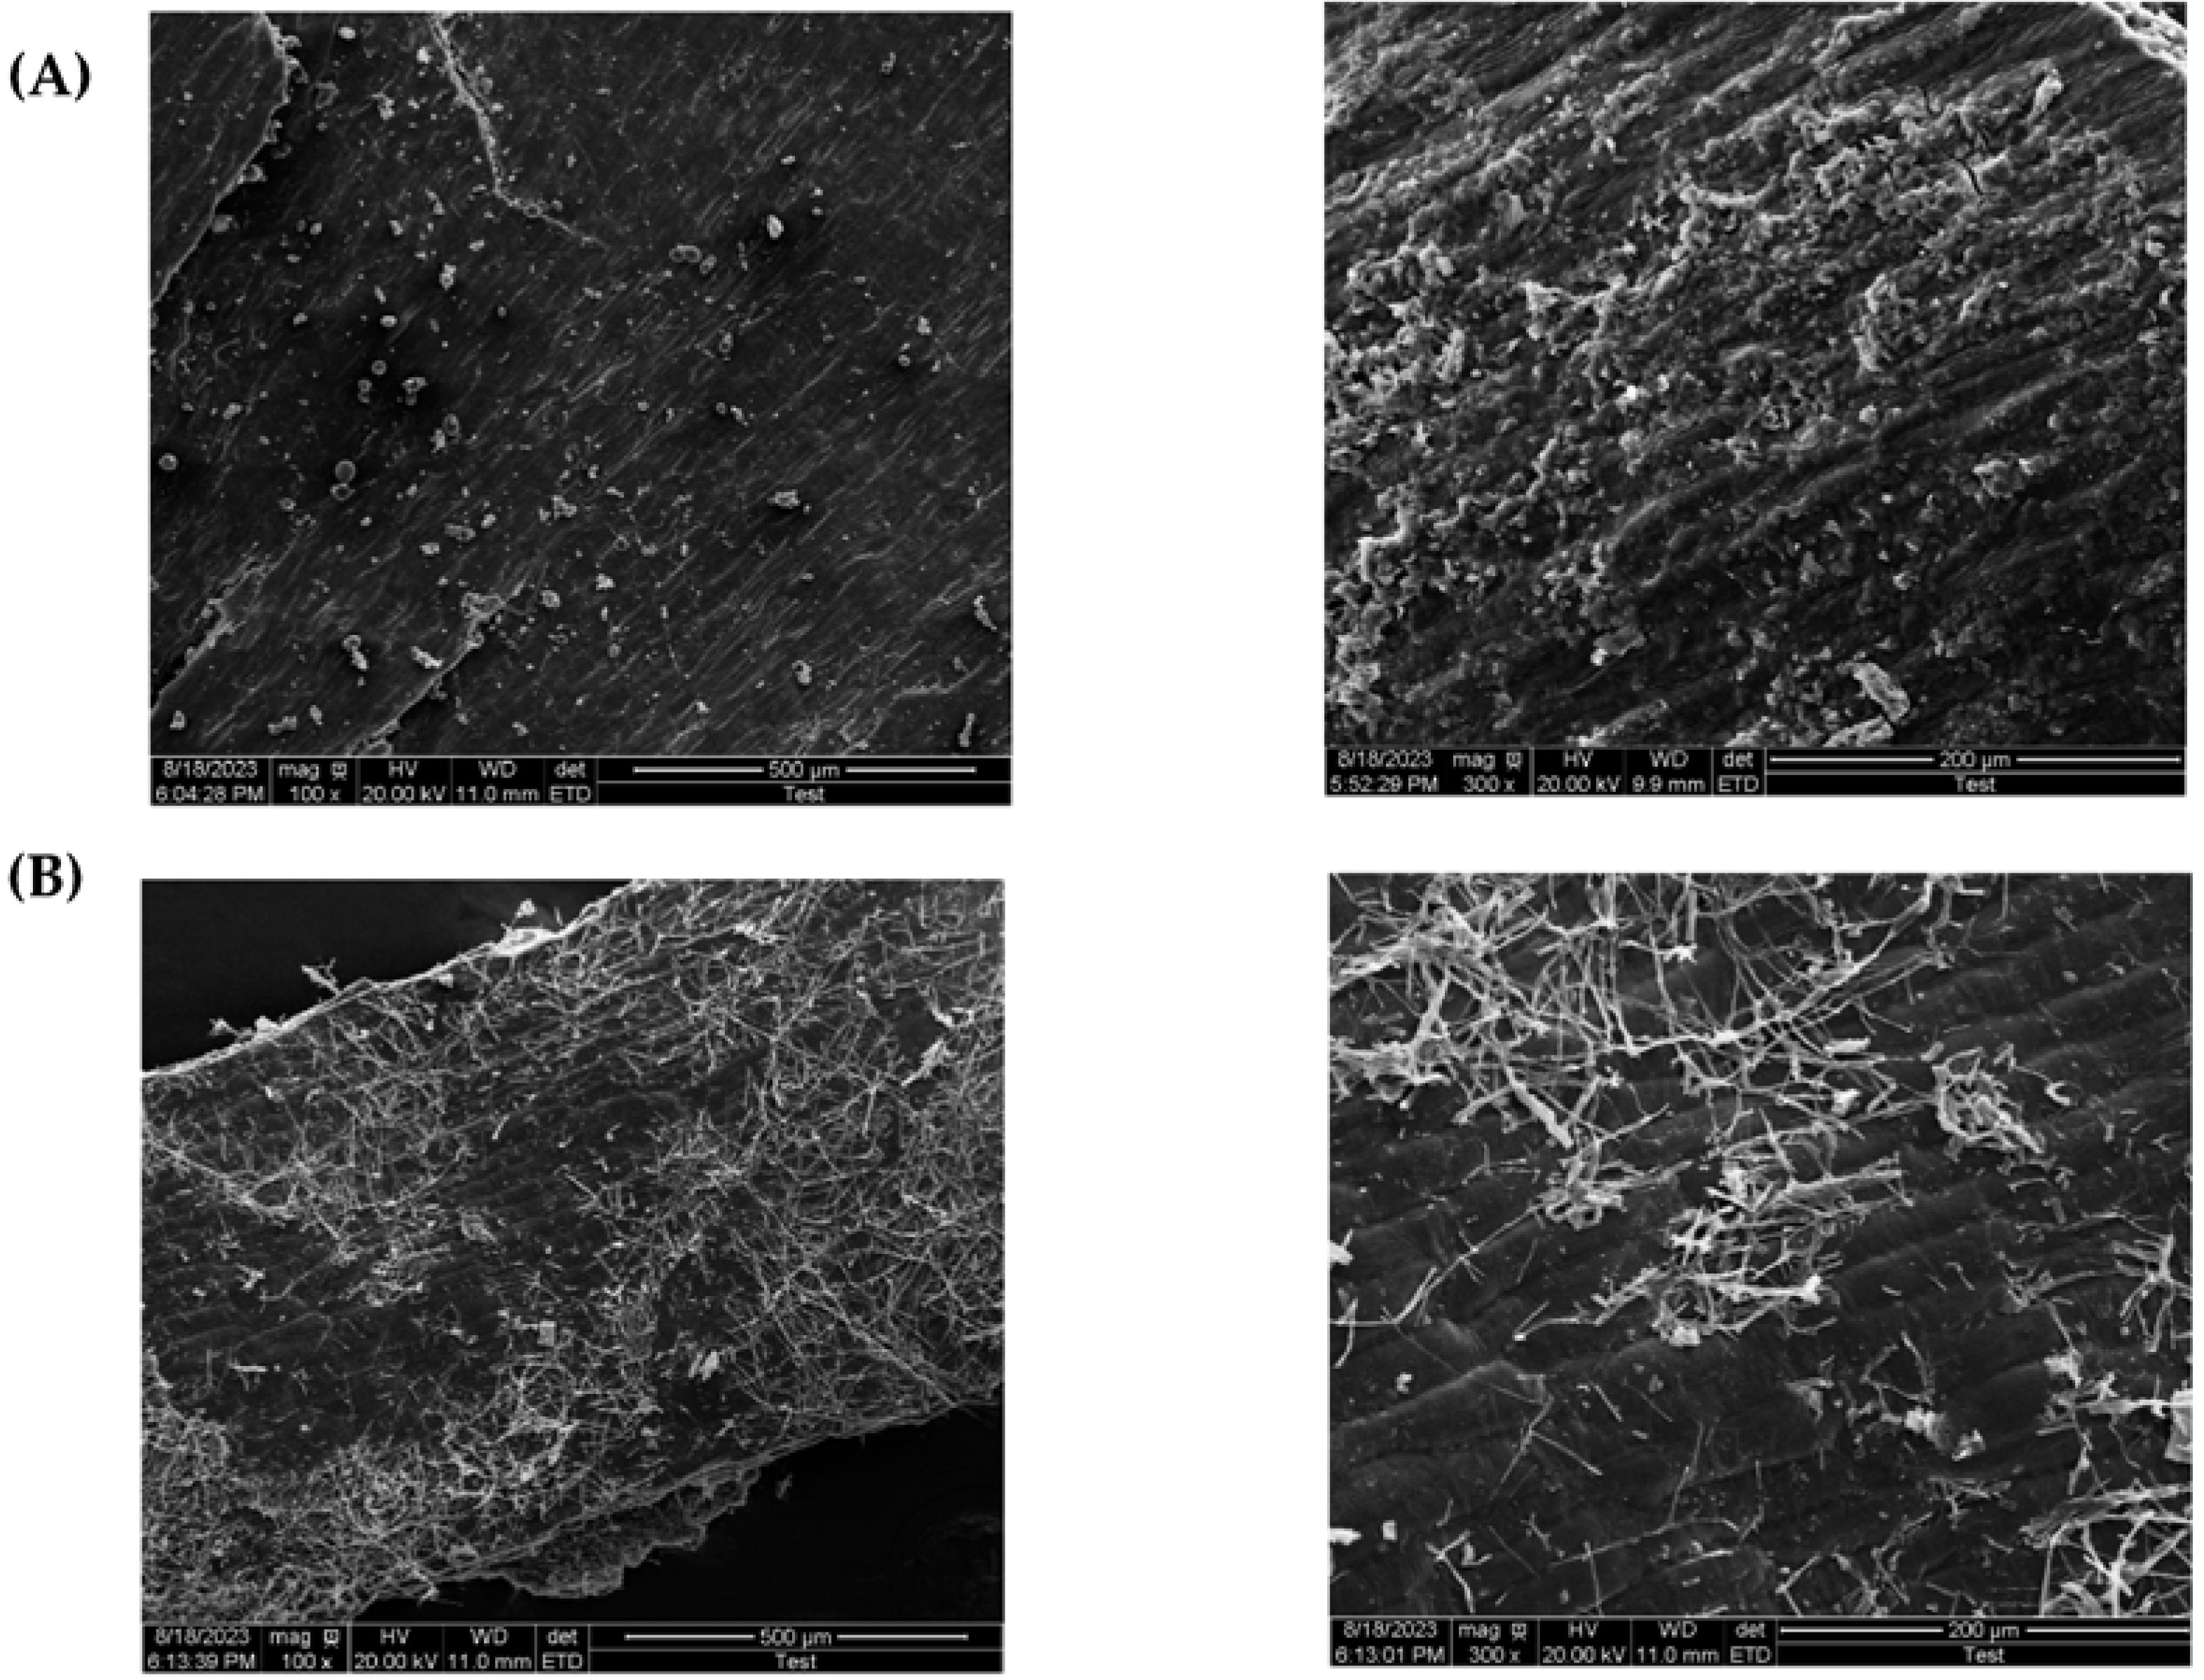
3.6. Characterization of Wheat Bran

FTIR spectroscopy was employed to analyze wheat bran before and after fermentation, as well as after dye adsorption to investigate the changes in the surface functional groups on the biosorbent.
Given that wheat bran and fungal biomass is mostly composed of polysaccharides (cellulose or glucans) and proteins, the presence of numerous functional groups on the biomass surface, including carboxyl, amine, and hydroxyl groups, could be useful for adsorption [75].
As seen in Figure 6A, the FTIR spectra displayed a variety of absorption peaks, indicating the complex functional sites on the surface. The absorption peaks at wave numbers of 3290, 3273, and 3278 cm−1 indicate that the stretching vibration of the OH functional group originated from the cellulose-derived materials [76]. The band around 1000 cm−1 was related to C–O–C stretching vibrations in cellulose and hemicellulose [77].
FWB showed lower transmittance at 2923 and 2854 cm−1 (associated with the C-H vibration) compared with the WB. Unfermented wheat bran (WB) had the functional group with a signal at 1737 cm−1, which was attributed to C=O stretching of carboxyl groups and ketones [78]. The transmittance at the wavelengths of 1149, 1075, 899, and 860 cm−1 (b-glycosidic bond vibrations, mostly in hemicelluloses) reduced after fungal fermentation, indicating that cellulose and hemicellulose were degraded [79].
The reduced transmittance and changes in absorption bands at wavelengths of 1637, 1518, and 1458 cm−1 (stretching of the C=C and C=O lignin aromatic ring) demonstrated the change in aromatic hydrocarbon compounds and lignin degradation [80,81]. IR bands near 1240 or 1737 cm−1 (representing acetyl groups) were used as diagnostic spectral peaks for cellulose [82]. The changes in the wave numbers lower than 1000 cm−1 were due to the presence of heterocyclic aromatics in lignin. This demonstrates that the functional sites on wheat bran were somewhat altered by fungus treatment [48].
After fermentation, the peaks at 1737, 1075, and 860 cm−1 (associated with carbon bonds) disappeared, proving that the depolymerization process led to chemical changes in the wheat bran structure. Furthermore, some peaks displayed higher intensity after fermentation, such as those at 3273, 2923, 1625, 1236, and 1023 cm−1 (related to O-containing groups). The appearance of new peaks at 1400 cm−1 (associated with carboxylate group), 1376 (C–H bending of amorphous cellulose), and 1314 (C–H bending vibration in crystallized cellulose) proves that fungal fermentation alters the wheat bran structure of cellulose.
As for the spectrum after dye adsorption, by comparing with the wavenumbers of the peaks and its intensity before and after dye adsorption, it can be clearly seen that some peaks shifted, while others weakened or enhanced [83]. The change in peak wave number after dye adsorption demonstrates its involvement in the reaction (biosorption), while the weakened intensity of a functional group implies a reduction in its content [80].
The chart of analysis shows that the absorption peak of the stretching vibration of the OH at 3273 weakened and shifted to 3278 after adsorption, indicating its participation in the dye removal.
Similarly, the peaks at 1625 and 1545 (amide group vibrations) weakened and shifted to 1628 and 1541, respectively, the peak at 1376 (C–H bending of cellulose) shifted to 1375, and 1314 (C–H bending vibration) shifted to 1309 cm−1 and 1236 to 1234 (C–O–C) after dye adsorption. Also, it can be clearly seen that the strong absorption peak at 1023 weakened and shifted to 1031 (related to S=O stretching vibrations), demonstrating the existence of Congo red on the biosorbent after dye adsorption, since this chemical bond corresponds to Congo red structure.
The disappearance of the peak at 1400 (related to carboxylate group) confirmed the involvement of the functional group in the dye adsorption.
The XRD patterns of wheat bran before and after fermentation and after dye adsorption are shown in Figure 6B. The XRD pattern showed a major broad peak between 10° and 30°, representing the cellulose diffraction peak. The two minor peaks in XRD spectrum fungal fermentation at 26° and 29° are possibly related to the low degree structure of polysaccharides [80,83].
The absence of sharp peaks demonstrates the non-crystalline nature of the wheat bran or fermented wheat bran and supports their amorphous structures [49,84]. These disordered structures contain several functional groups on the absorbent surface, such amide, carboxyl, and phosphate, which enhance the dye adsorption process [49,85]. A similar structure pattern was also found in Pleurotus ostreatus spent substrate [83], Beauveria bassiana [86], Agaricus bisporus residue [84], nutshell biochar [87], microalgae biochar [88], and wood chip biochar [49].
SEM micrographs were used to compare the surface morphology of wheat bran before and after fermentation.
As shown in Figure 7, unfermented wheat bran has starch granules and adherent endosperm protein on its surface [89], while after fermentation, they were consumed by the fungi. Additionally, after fungal fermentation, the wheat barn surface was colonized by the fungal mycelium and made the fibrous cellulose more exposed, with an irregular surface, resulting in increasing external surface area [81]. These features of the biosorbent led to a high adsorption capacity [49]; hence, it can be said that wheat bran fermentation by Lasiodiplodia sp. YZH1 enhanced its adsorption efficiency.

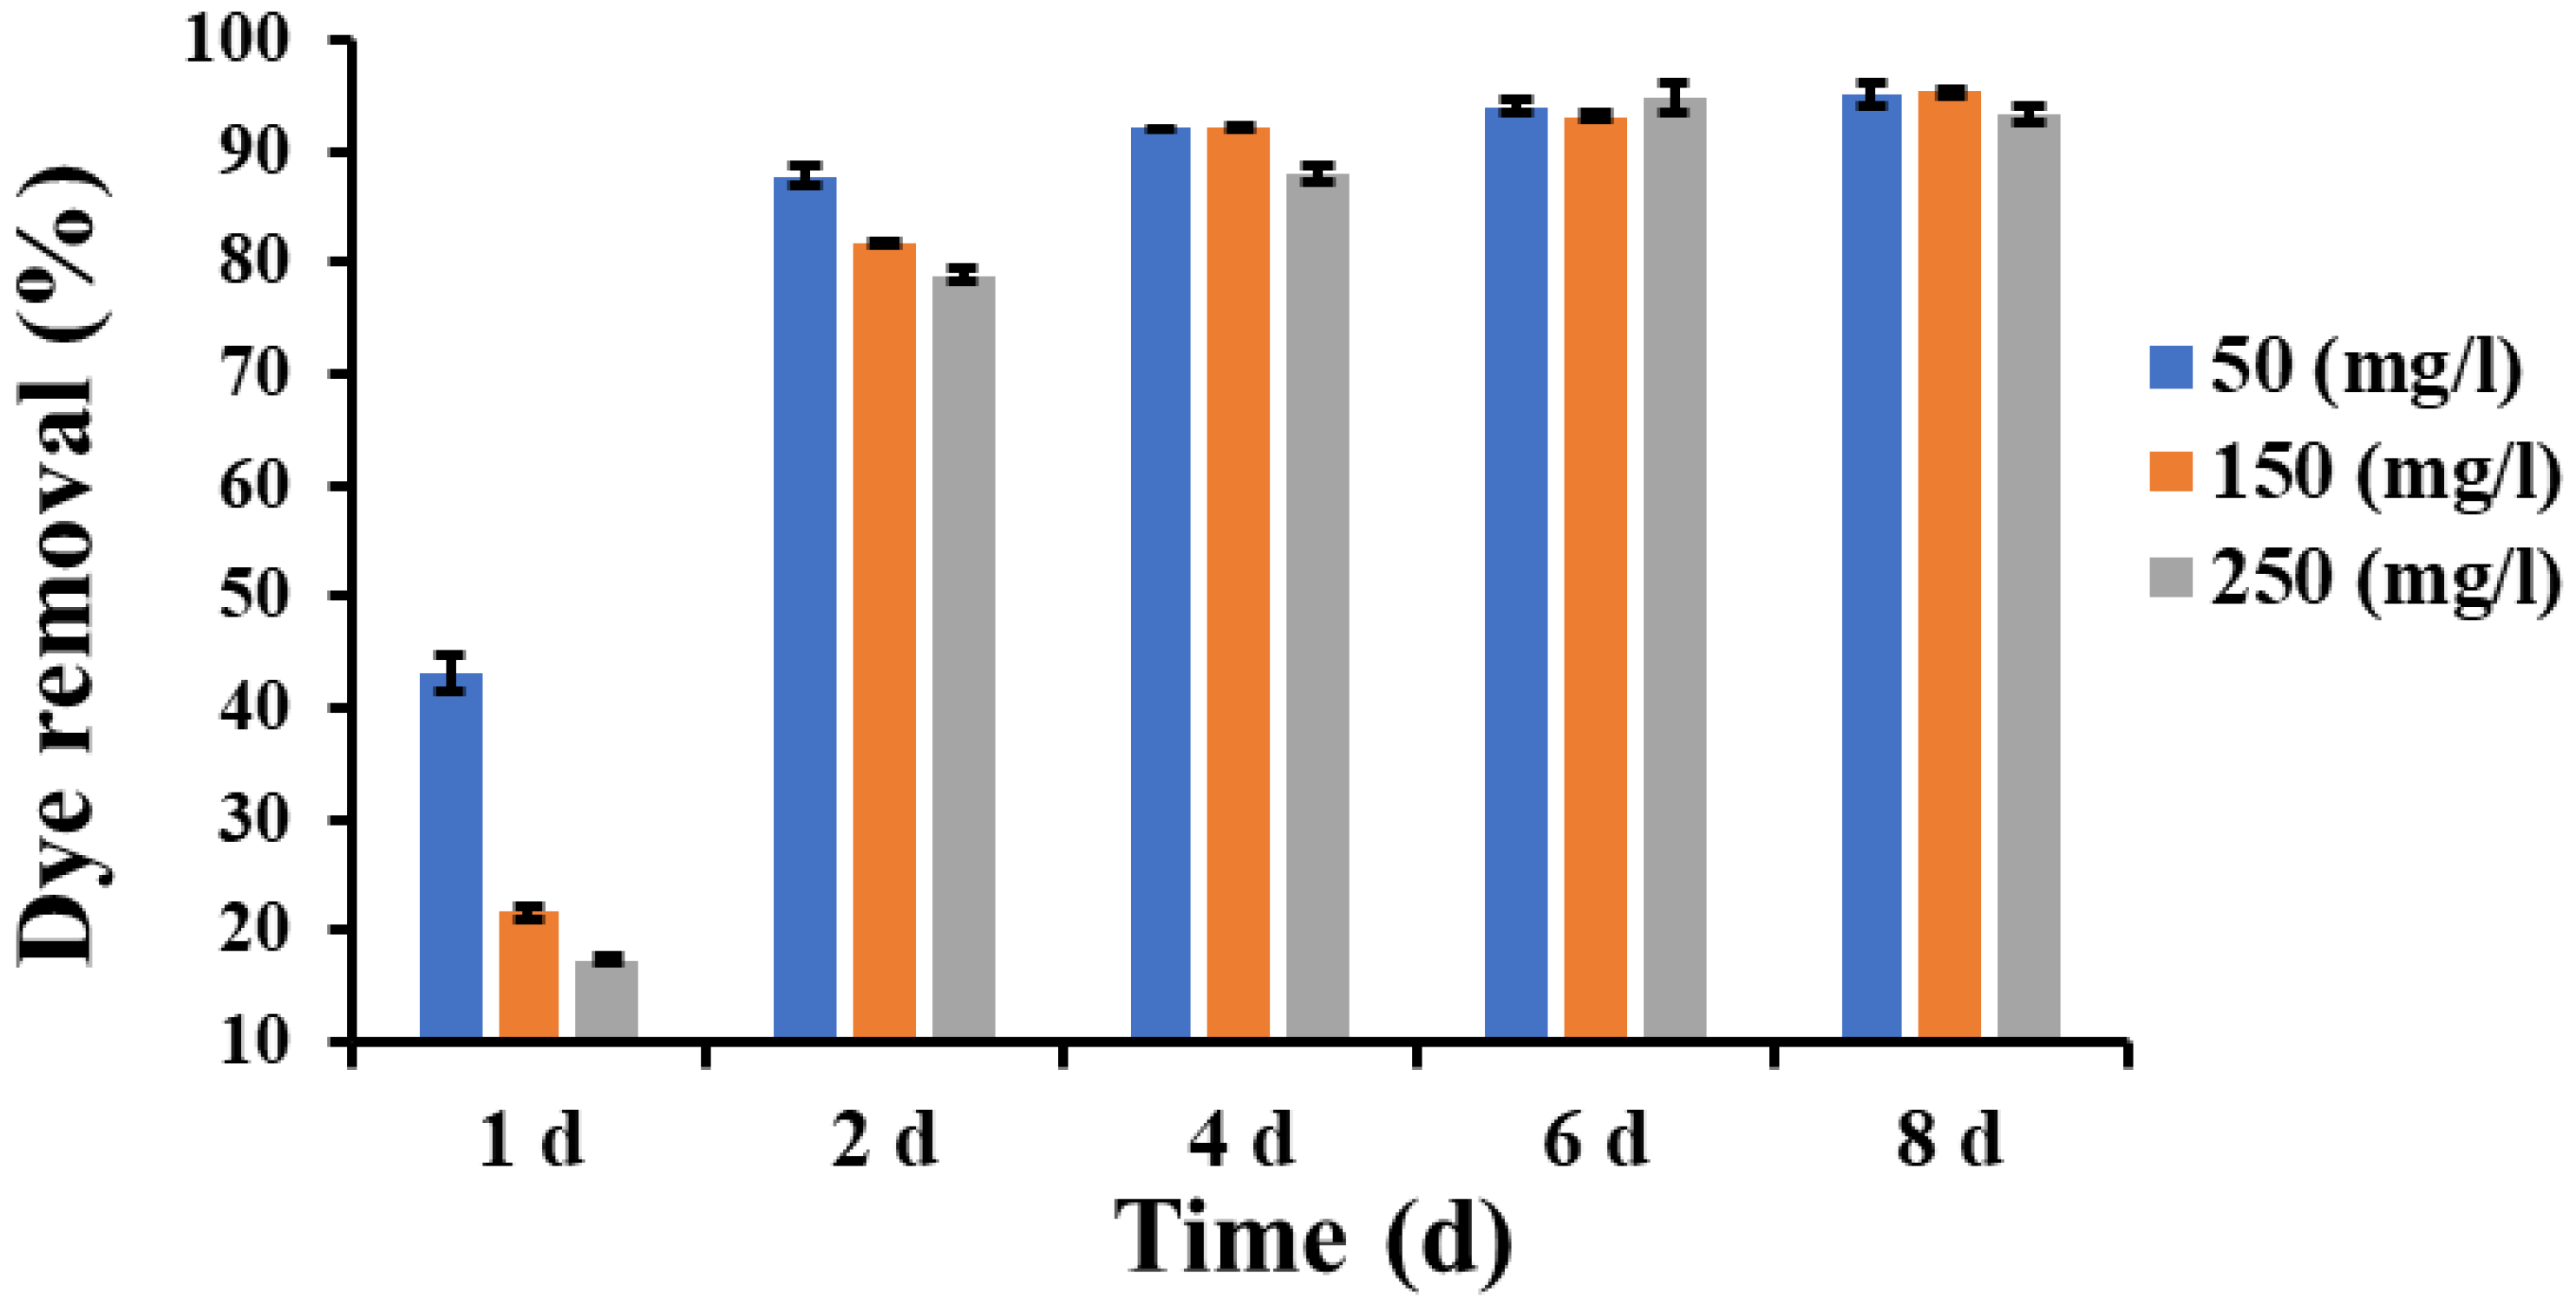
3.7. Dye Removal Assay in Liquid Cultures

An additional experiment was conducted to investigate the dye removal efficiency by the fungal strain at three dye concentrations (50, 150, 250 mg L−1).
Figure 8 shows that the removal percentage after 1 day of inoculation was 43.2, 21.6, and 17.4%, then it increased sharply after 2 days to become 87.8, 81.7, and 78.8% for the dye concentrations of 50, 150, and 250 mg L−1, respectively. The decrease in dye removal efficiency at higher dye concentrations was probably caused by the saturation of the fixed number of biosorbent active sites.
From 4 to 8 days, the dye removal percentage increased slightly and reached the highest values of 95% and 95.3% for the concentrations of 50 and 150 mg L−1, respectively, and it reached 94.8% for the concentration of 250 mg L−1 after 6 days of inoculation.
These results indicated the ability of the fungal strain Lasiodiplodia sp. YZH1 to remove Congo red dye from aqueous solutions, which occurs primarily via an adsorption process on the fungal biomass present in the culture. Similar results were obtained by Asses et al. 2018, who recorded 97% decolorization of Congo red (200 mg L−1) by Aspergillus niger after 6 days at 120 to 150 rpm shaking speed [22].

4. Conclusions

This study reported the effectiveness of SSF of wheat bran with endophytic fungi Lasiodiplodia isolated from white rot fungus Schizophyllum for the first time to decolorize Congo red azo dye from aqueous solutions, as well as the ability of this fungal strain to remove Congo red dye in liquid culture. The fermented wheat (FWB) bran removed 89.8% of the dye (100 mg L−1), whereas WB removed only 77.5% after 12 h of contact with the dye solution. According to the Box–Behnken design results, FWB removed 93.08% of the dye under the condition of 6 days’ fermentation duration, and resulted in pH 8.5 and 150 mg L−1 dye concentration after 24 h. Additionally, the fungal strain removed 95.3% of the dye (150 mg L−1) in liquid culture after 8 days of inoculation. Ultimately, this study introduced a cheap, effective, and environmentally friendly procedure for biodecolorization of dye from aqueous solutions. In future studies, this fungal strain needs to be applied for industrial wastewater treatment on a larger scale and in bioreactor conditions, and SSF also should be performed with other agro-industrial wastes in order to assess its ability for bioremediation of other xenobiotics.

Supplementary Materials

The following supporting information can be downloaded at: https://www.mdpi.com/article/10.3390/jof9111069/s1, Figure S1: pH of the fermented wheat bran with Lasiodiplodia sp. YZH1 under SSF condition at a period of 8 days.

Author Contributions

Conceptualization, X.Q. and A.B.; methodology, J.W. and A.B.; software, A.G. and H.H.; validation, X.Q., J.W. and A.B.; formal analysis, A.B., L.L. and C.Z.; investigation, A.B., R.X. and S.Z.; resources, C.Z., N.H. and S.Z.; writing—original draft preparation, A.B., J.W. and N.H.; writing—review and editing, A.B., A.G., M.K.O. and M.A.E.-T.; visualization, H.H., R.X. and L.L.; supervision, X.Q.; project administration, X.Q.; funding acquisition, X.Q., A.B., M.K.O. and M.A.E.-T. All authors have read and agreed to the published version of the manuscript.

Funding

This study was sponsored by the National Key Research and Development Program of China (2022YFD1500403) and the Key research and development projects (social development) of Yangzhou, grant number YZ2022060.

Data Availability Statement

Data are contained within the article.

Acknowledgments

The authors extend their appreciation to the Researchers Supporting Project (RSPD2023R678) King Saud University, Riyadh, Saud Arabia.

Conflicts of Interest

The authors declare no conflict of interest.

References

  1. Zhou, Y.; Lu, J.; Zhou, Y.; Liu, Y. Recent advances for dyes removal using novel adsorbents: A review. Environ. Pollut. 2019, 252, 352–365. [Google Scholar] [CrossRef] [PubMed]
  2. Ardila-Leal, L.D.; Poutou-Pinales, R.A.; Pedroza-Rodriguez, A.M.; Quevedo-Hidalgo, B.E. A Brief History of Colour, the Environmental Impact of Synthetic Dyes and Removal by Using Laccases. Molecules 2021, 26, 3813. [Google Scholar] [CrossRef] [PubMed]
  3. Lellis, B.; Fávaro-Polonio, C.Z.; Pamphile, J.A.; Polonio, J.C. Effects of textile dyes on health and the environment and bioremediation potential of living organisms. Biotechnol. Res. Innov. 2019, 3, 275–290. [Google Scholar] [CrossRef]
  4. Ehrampoush, M.; Ghanizadeh, G.; Ghaneian, M. Equilibrium and kinetics study of reactive red 123 dye removal from aqueous solution by adsorption on eggshell. J. Environ. Health Sci. Eng. 2011, 8, 101–106. [Google Scholar]
  5. Zhang, J.; Feng, M.; Jiang, Y.; Hu, M.; Li, S.; Zhai, Q. Efficient decolorization/degradation of aqueous azo dyes using buffered H2O2 oxidation catalyzed by a dosage below ppm level of chloroperoxidase. Chem. Eng. J. 2012, 191, 236–242. [Google Scholar] [CrossRef]
  6. Chung, K.-T. Azo dyes and human health: A review. J. Environ. Sci. Health Part C 2016, 34, 233–261. [Google Scholar] [CrossRef] [PubMed]
  7. Ajaz, M.; Elahi, A.; Rehman, A. Degradation of azo dye by bacterium, Alishewanella sp. CBL-2 isolated from industrial effluent and its potential use in decontamination of wastewater. J. Water Reuse Desalination 2018, 8, 507–515. [Google Scholar] [CrossRef]
  8. Baena-Baldiris, D.; Montes-Robledo, A.; Baldiris-Avila, R. Franconibacter sp., 1MS: A new strain in decolorization and degradation of azo dyes ponceau s red and methyl orange. ACS Omega 2020, 5, 28146–28157. [Google Scholar] [CrossRef]
  9. Devi, P.; Saroha, A.K. Utilization of sludge based adsorbents for the removal of various pollutants: A review. Sci. Total Environ. 2017, 578, 16–33. [Google Scholar] [CrossRef]
  10. Routoula, E.; Patwardhan, S.V. Degradation of anthraquinone dyes from effluents: A review focusing on enzymatic dye degradation with industrial potential. Environ. Sci. Technol. 2020, 54, 647–664. [Google Scholar] [CrossRef]
  11. Wanyonyi, W.C.; Onyari, J.M.; Shiundu, P.M.; Mulaa, F.J. Biodegradation and detoxification of malachite green dye using novel enzymes from Bacillus cereus strain KM201428: Kinetic and metabolite analysis. Energy Procedia 2017, 119, 38–51. [Google Scholar] [CrossRef]
  12. Vishwakarma, S.; Singh, M.; Srivastava, A.; Pandey, V. Azo dye (direct blue 14) decolorization by immobilized extracellular enzymes of Pleurotus species. Cell. Mol. Biol. 2012, 58, 21–25. [Google Scholar] [PubMed]
  13. Gupta, V. Application of low-cost adsorbents for dye removal–a review. J. Environ. Manag. 2009, 90, 2313–2342. [Google Scholar] [CrossRef]
  14. Abdolali, A.; Guo, W.; Ngo, H.; Chen, S.; Nguyen, N.; Tung, K. Typical lignocellulosic wastes and by-products for biosorption process in water and wastewater treatment: A critical review. Bioresour. Technol. 2014, 160, 57–66. [Google Scholar] [CrossRef] [PubMed]
  15. Huang, D.-L.; Wang, R.-Z.; Liu, Y.-G.; Zeng, G.-M.; Lai, C.; Xu, P.; Lu, B.-A.; Xu, J.-J.; Wang, C.; Huang, C. Application of molecularly imprinted polymers in wastewater treatment: A review. Environ. Sci. Pollut. Res. 2015, 22, 963–977. [Google Scholar] [CrossRef] [PubMed]
  16. Hokkanen, S.; Bhatnagar, A.; Sillanpää, M. A review on modification methods to cellulose-based adsorbents to improve adsorption capacity. Water Res. 2016, 91, 156–173. [Google Scholar] [CrossRef]
  17. Choi, J.; Won, W.; Capareda, S.C. The economical production of functionalized Ashe juniper derived-biochar with high hazardous dye removal efficiency. Ind. Crops Prod. 2019, 137, 672–680. [Google Scholar] [CrossRef]
  18. Kadam, A.A.; Telke, A.A.; Jagtap, S.S.; Govindwar, S.P. Decolorization of adsorbed textile dyes by developed consortium of Pseudomonas sp. SUK1 and Aspergillus ochraceus NCIM-1146 under solid state fermentation. J. Hazard. Mater. 2011, 189, 486–494. [Google Scholar] [CrossRef]
  19. Kadam, A.A.; Kamatkar, J.D.; Khandare, R.V.; Jadhav, J.P.; Govindwar, S.P. Solid-state fermentation: Tool for bioremediation of adsorbed textile dyestuff on distillery industry waste-yeast biomass using isolated Bacillus cereus strain EBT1. Environ. Sci. Pollut. Res. 2013, 20, 1009–1020. [Google Scholar] [CrossRef]
  20. Waghmare, P.R.; Kadam, A.A.; Saratale, G.D.; Govindwar, S.P. Enzymatic hydrolysis and characterization of waste lignocellulosic biomass produced after dye bioremediation under solid state fermentation. Bioresour. Technol. 2014, 168, 136–141. [Google Scholar] [CrossRef]
  21. Singh, G.; Dwivedi, S.K. Decolorization and degradation of Direct Blue-1 (Azo dye) by newly isolated fungus Aspergillus terreus GS28, from sludge of carpet industry. Environ. Technol. Innov. 2020, 18, 100751. [Google Scholar] [CrossRef]
  22. Asses, N.; Ayed, L.; Hkiri, N.; Hamdi, M. Congo Red Decolorization and Detoxification by Aspergillus niger: Removal Mechanisms and Dye Degradation Pathway. BioMed Res. Int. 2018, 2018, 1–9. [Google Scholar] [CrossRef] [PubMed]
  23. Reda, F.M.; El-Mekkawy, R.M.; Hassan, N.S. Detoxification and Bioremediation of Sulfa Drugs and Synthetic Dyes by Streptomyces mutabilis A17 Laccase Produced in Solid State Fermentation. J. Pure Appl. Microbiol. 2019, 13, 85–96. [Google Scholar] [CrossRef]
  24. Karimifard, S.; Moghaddam, M.R.A. Application of response surface methodology in physicochemical removal of dyes from wastewater: A critical review. Sci. Total Environ. 2018, 640, 772–797. [Google Scholar] [CrossRef]
  25. Archin, S. Optimization of process parameters by response surface methodology for methylene blue removal using cellulose dusts. Civ. Eng. J. 2018, 4, 3. [Google Scholar]
  26. Abdulhameed, A.S.; Mohammad, A.-T.; Jawad, A.H. Application of response surface methodology for enhanced synthesis of chitosan tripolyphosphate/TiO2 nanocomposite and adsorption of reactive orange 16 dye. J. Clean. Prod. 2019, 232, 43–56. [Google Scholar] [CrossRef]
  27. Mohammad, A.-T.; Abdulhameed, A.S.; Jawad, A.H. Box-Behnken design to optimize the synthesis of new crosslinked chitosan-glyoxal/TiO2 nanocomposite: Methyl orange adsorption and mechanism studies. Int. J. Biol. Macromol. 2019, 129, 98–109. [Google Scholar] [CrossRef]
  28. Gadekar, M.R.; Ahammed, M.M. Modelling dye removal by adsorption onto water treatment residuals using combined response surface methodology-artificial neural network approach. J. Environ. Manag. 2019, 231, 241–248. [Google Scholar] [CrossRef]
  29. Karri, R.R.; Tanzifi, M.; Yaraki, M.T.; Sahu, J. Optimization and modeling of methyl orange adsorption onto polyaniline nano-adsorbent through response surface methodology and differential evolution embedded neural network. J. Environ. Manag. 2018, 223, 517–529. [Google Scholar] [CrossRef]
  30. Duan, X.; Liu, X.; Xiao, S.; Du, C.; Yan, B. Fe-Trimesic Acid/Melamine Gel-Derived Fe/N-Doped Carbon Nanotubes as Catalyst of Peroxymonosulfate to Remove Sulfamethazine. Water 2023, 15, 381. [Google Scholar] [CrossRef]
  31. Yang, Y.; Zheng, Z.; Zhang, D.; Zhang, X. Response surface methodology directed adsorption of chlorate and chlorite onto MIEX resin and study of chemical properties. Environ. Sci. Water Res. Technol. 2020, 6, 2454–2464. [Google Scholar] [CrossRef]
  32. Shahamat, Y.D.; Masihpour, M.; Borghei, P.; Rahmati, S.H. Removal of azo red-60 dye by advanced oxidation process O3/UV from textile wastewaters using Box-Behnken design. Inorg. Chem. Commun. 2022, 143, 109785. [Google Scholar] [CrossRef]
  33. Prabhakar, Y.; Gupta, A.; Kaushik, A. Microbial degradation of reactive red-35 dye: Upgraded progression through Box–Behnken design modeling and cyclic acclimatization. J. Water Process Eng. 2021, 40, 101782. [Google Scholar] [CrossRef]
  34. Choińska-Pulit, A.; Sobolczyk-Bednarek, J.; Łaba, W. Optimization of copper, lead and cadmium biosorption onto newly isolated bacterium using a Box-Behnken design. Ecotoxicol. Environ. Saf. 2018, 149, 275–283. [Google Scholar] [CrossRef] [PubMed]
  35. Parmar, P.; Shukla, A.; Goswami, D.; Patel, B.; Saraf, M. Optimization of cadmium and lead biosorption onto marine Vibrio alginolyticus PBR1 employing a Box-Behnken design. Chem. Eng. J. Adv. 2020, 4, 100043. [Google Scholar] [CrossRef]
  36. Matrawy, A.A.; Marey, H.S.; Embaby, A.M. The Agro-industrial Byproduct Wheat Bran as an Inducer for Alkaline Protease (ALK-PR23) Production by Pschyrotolerant Lysinibacillus sphaericus Strain AA6 EMCCN3080. Waste Biomass Valorization 2023, 1–16. [Google Scholar] [CrossRef]
  37. Kler, R.; Gangurde, R.; Elmirzaev, S.; Hossain, M.S.; Vo, N.V.; Nguyen, T.V.; Kumar, P.N. Optimization of Meat and Poultry Farm Inventory Stock Using Data Analytics for Green Supply Chain Network. Discret. Dyn. Nat. Soc. 2022, 2022, 1–8. [Google Scholar] [CrossRef]
  38. Liu, J.; Sidhu, S.S.; Wang, M.L.; Tonnis, B.; Habteselassie, M.; Mao, J.; Huang, Q. Evaluation of various fungal pretreatment of switchgrass for enhanced saccharification and simultaneous enzyme production. J. Clean. Prod. 2015, 104, 480–488. [Google Scholar] [CrossRef]
  39. Osma, J.F.; Herrera, J.L.T.; Couto, S.R. Banana skin: A novel waste for laccase production by Trametes pubescens under solid-state conditions. Application to synthetic dye decolouration. Dye. Pigment. 2007, 75, 32–37. [Google Scholar] [CrossRef]
  40. Wang, Z.; Liu, J.; Ning, Y.; Liao, X.; Jia, Y. Eichhornia crassipes: Agro-waster for a novel thermostable laccase production by Pycnoporus sanguineus SYBC-L1. J. Biosci. Bioeng. 2017, 123, 163–169. [Google Scholar] [CrossRef]
  41. Torres-Farradá, G.; Manzano Leon, A.M.; Rineau, F.; Ledo Alonso, L.L.; Sánchez-López, M.I.; Thijs, S.; Colpaert, J.; Ramos-Leal, M.; Guerra, G.; Vangronsveld, J. Diversity of ligninolytic enzymes and their genes in strains of the genus Ganoderma: Applicable for biodegradation of xenobiotic compounds? Front. Microbiol. 2017, 8, 898. [Google Scholar] [CrossRef] [PubMed]
  42. Dayi, B.; Kyzy, A.D.; Abduloglu, Y.; Cikrikci, K.; Ardag Akdogan, H. Investigation of the ability of immobilized cells to different carriers in removal of selected dye and characterization of environmentally friendly laccase of Morchella esculenta. Dye. Pigment. 2018, 151, 15–21. [Google Scholar] [CrossRef]
  43. Latif, W.; Ciniglia, C.; Iovinella, M.; Shafiq, M.; Papa, S. Role of White Rot Fungi in Industrial Wastewater Treatment: A Review. Appl. Sci. 2023, 13, 8318. [Google Scholar] [CrossRef]
  44. Jami, F.; Slippers, B.; Wingfield, M.J.; Gryzenhout, M. Greater Botryosphaeriaceae diversity in healthy than associated diseased Acacia karroo tree tissues. Australas. Plant Pathol. 2013, 42, 421–430. [Google Scholar] [CrossRef]
  45. Arunprasath, T.; Sudalai, S.; Meenatchi, R.; Jeyavishnu, K.; Arumugam, A. Biodegradation of triphenylmethane dye malachite green by a newly isolated fungus strain. Biocatal. Agric. Biotechnol. 2019, 17, 672–679. [Google Scholar] [CrossRef]
  46. Deng, Z.; Zhang, R.; Shi, Y.; Hu, L.a.; Tan, H.; Cao, L. Characterization of Cd-, Pb-, Zn-resistant endophytic Lasiodiplodia sp. MXSF31 from metal accumulating Portulaca oleracea and its potential in promoting the growth of rape in metal-contaminated soils. Environ. Sci. Pollut. Res. 2014, 21, 2346–2357. [Google Scholar] [CrossRef]
  47. Aminin, A.L.; Ulvairoh, U.; Mulyani, N.S.; Gunawan, G. Optimization of solid state fermentation of banana peel for removal of crystal violet dye from aqueous solution. In AIP Conference Proceedings; AIP Publishing: New York, NY, USA, 2022. [Google Scholar]
  48. Liu, J.; Wang, Z.; Li, H.; Hu, C.; Raymer, P.; Huang, Q. Effect of solid state fermentation of peanut shell on its dye adsorption performance. Bioresour. Technol. 2018, 249, 307–314. [Google Scholar] [CrossRef]
  49. Ortiz-Monsalve, S.; Gutterres, M.; Valente, P.; Plácido, J.; Bustamante-López, S.; Kelly, D.; Kelly, S.L. Degradation of a leather-dye by the combination of depolymerised wood-chip biochar adsorption and solid-state fermentation with Trametes villosa SCS-10. Bioresour. Bioprocess. 2020, 7, 61. [Google Scholar] [CrossRef]
  50. White, T.J.; Bruns, T.; Lee, S.; Taylor, J. Amplification and direct sequencing of fungal ribosomal RNA genes for phylogenetics. PCR Protoc. A Guide Methods Appl. 1990, 18, 315–322. [Google Scholar]
  51. Kumar, S.; Stecher, G.; Li, M.; Knyaz, C.; Tamura, K. MEGA X: Molecular evolutionary genetics analysis across computing platforms. Mol. Biol. Evol. 2018, 35, 1547. [Google Scholar] [CrossRef]
  52. Bharti, V.; Vikrant, K.; Goswami, M.; Tiwari, H.; Sonwani, R.K.; Lee, J.; Tsang, D.C.; Kim, K.-H.; Saeed, M.; Kumar, S. Biodegradation of methylene blue dye in a batch and continuous mode using biochar as packing media. Environ. Res. 2019, 171, 356–364. [Google Scholar] [CrossRef]
  53. Copete-Pertuz, L.S.; Alandete-Novoa, F.; Placido, J.; Correa-Londono, G.A.; Mora-Martinez, A.L. Enhancement of ligninolytic enzymes production and decolourising activity in Leptosphaerulina sp. by co-cultivation with Trichoderma viride and Aspergillus terreus. Sci. Total Environ. 2019, 646, 1536–1545. [Google Scholar] [CrossRef]
  54. Ferreira, T.; Rasband, W. ImageJ user guide. ImageJ 2012, 1, 155–161. [Google Scholar]
  55. Smits, J.P.; Rinzema, A.; Tramper, J.; Van Sonsbeek, H.M.; Knol, W. Solid-state fermentation of wheat bran by Trichoderma reesei QM9414—Substrate composition changes, C balance, enzyme production, growth and kinetics. Appl. Microbiol. Biotechnol. 1996, 46, 489–496. [Google Scholar] [CrossRef]
  56. Dayi, B.; Onac, C.; Kaya, A.; Akdogan, H.A.; Rodriguez-Couto, S. New Type Biomembrane: Transport and Biodegradation of Reactive Textile Dye. ACS Omega 2020, 5, 9813–9819. [Google Scholar] [CrossRef] [PubMed]
  57. Forootanfar, H.; Rezaei, S.; Zeinvand-Lorestani, H.; Tahmasbi, H.; Mogharabi, M.; Ameri, A.; Faramarzi, M.A. Studies on the laccase-mediated decolorization, kinetic, and microtoxicity of some synthetic azo dyes. J. Environ. Health Sci. Eng. 2016, 14, 7. [Google Scholar] [CrossRef] [PubMed]
  58. Shedbalkar, U.; Dhanve, R.; Jadhav, J. Biodegradation of triphenylmethane dye cotton blue by Penicillium ochrochloron MTCC 517. J. Hazard. Mater. 2008, 157, 472–479. [Google Scholar] [CrossRef] [PubMed]
  59. Xu, Z.; Wang, Q.; Jiang, Z.; Yang, X.-x.; Ji, Y. Enzymatic hydrolysis of pretreated soybean straw. Biomass Bioenergy 2007, 31, 162–167. [Google Scholar] [CrossRef]
  60. Li, Q.; Chen, C.; Penttinen, P.; Xiong, C.; Zheng, L.; Huang, W. Microbial diversity associated with Tricholoma matsutake fruiting bodies. Microbiology 2016, 85, 531–539. [Google Scholar] [CrossRef]
  61. Cheng, J.-T.; Wang, H.-M.; Yu, J.-H.; Sun, C.-F.; Cao, F.; Jiang, X.-H.; Chen, X.-A.; Zhao, Q.-W.; Gan, L.-S.; Xie, R.-R. Discovery of a Potential Liver Fibrosis Inhibitor from a Mushroom Endophytic Fungus by Genome Mining of a Silent Biosynthetic Gene Cluster. J. Agric. Food Chem. 2021, 69, 11303–11310. [Google Scholar] [CrossRef]
  62. Khaled, J.M.; Alyahya, S.A.; Govindan, R.; Chelliah, C.K.; Maruthupandy, M.; Alharbi, N.S.; Kadaikunnan, S.; Issac, R.; Murugan, S.; Li, W.J. Laccase producing bacteria influenced the high decolorization of textile azo dyes with advanced study. Environ. Res 2022, 207, 112211. [Google Scholar] [CrossRef] [PubMed]
  63. Li, H.-X.; Zhang, R.-J.; Tang, L.; Zhang, J.-H.; Mao, Z.-G. In vivo and in vitro decolorization of synthetic dyes by laccase from solid state fermentation with Trametes sp. SYBC-L4. Bioprocess Biosyst. Eng. 2014, 37, 2597–2605. [Google Scholar] [CrossRef] [PubMed]
  64. Rodríguez-Couto, S.; Osma, J.F.; Toca-Herrera, J.L. Removal of synthetic dyes by an eco-friendly strategy. Eng. Life Sci. 2009, 9, 116–123. [Google Scholar] [CrossRef]
  65. Asgher, M.; Noreen, S.; Bilal, M. Enhancing catalytic functionality of Trametes versicolor IBL-04 laccase by immobilization on chitosan microspheres. Chem. Eng. Res. Des. 2017, 119, 1–11. [Google Scholar] [CrossRef]
  66. Li, X.; Jia, R. Decolorization and biosorption for Congo red by system rice hull- Schizophyllum sp. F17 under solid-state condition in a continuous flow packed-bed bioreactor. Bioresour. Technol. 2008, 99, 6885–6892. [Google Scholar] [CrossRef]
  67. Ozmen, N.; Yesilada, O. Valorization and biodecolorization of dye adsorbed on lignocellulosics using white rot fungi. BioResources 2012, 7, 1656–1665. [Google Scholar] [CrossRef]
  68. Nigam, P.; Armour, G.; Banat, I.M.; Singh, D.; Marchant, R. Physical removal of textile dyes from effluents and solid-state fermentation of dye-adsorbed agricultural residues. Bioresour. Technol. 2000, 72, 219–226. [Google Scholar] [CrossRef]
  69. Dil, E.A.; Ghaedi, M.; Asfaram, A.; Mehrabi, F.; Bazrafshan, A.A.; Tayebi, L. Synthesis and application of Ce-doped TiO2 nanoparticles loaded on activated carbon for ultrasound-assisted adsorption of Basic Red 46 dye. Ultrason. Sonochem. 2019, 58, 104702. [Google Scholar]
  70. Noshadi, I.; Amin, N.; Parnas, R.S. Continuous production of biodiesel from waste cooking oil in a reactive distillation column catalyzed by solid heteropolyacid: Optimization using response surface methodology (RSM). Fuel 2012, 94, 156–164. [Google Scholar] [CrossRef]
  71. Tejada-Tovar, C.; Villabona-Ortíz, Á.; Gonzalez-Delgado, Á.D. Adsorption of azo-anionic dyes in a solution using modified coconut (Cocos nucifera) mesocarp: Kinetic and equilibrium study. Water 2021, 13, 1382. [Google Scholar] [CrossRef]
  72. Rodríguez-Arellano, G.; Barajas-Fernández, J.; García-Alamilla, R.; Lagunes-Gálvez, L.M.; Lara-Rivera, A.H.; García-Alamilla, P. Evaluation of cocoa beans shell powder as a bioadsorbent of Congo red dye aqueous solutions. Materials 2021, 14, 2763. [Google Scholar] [CrossRef] [PubMed]
  73. Zonoozi, M.H.; Moghaddam, M.A.; Arami, M. Coagulation/flocculation of dye-containing solutions using polyaluminium chloride and alum. Water Sci. Technol. 2009, 59, 1343–1351. [Google Scholar] [CrossRef] [PubMed]
  74. Sadri, M.S.; Alavi, M.M.; Arami, M. Decolorization of an acidic dye from synthetic wastewater by sludge of water treatment. Plant 2010, 7, 437–442. [Google Scholar]
  75. Mishra, A.; Tripathi, B.D.; Rai, A.K. Biosorption of Cr (VI) and Ni (II) onto Hydrilla verticillata dried biomass. Ecol. Eng. 2014, 73, 713–723. [Google Scholar] [CrossRef]
  76. Li, D.; Xu, X.; Yu, H.; Han, X. Characterization of Pb2+ biosorption by psychrotrophic strain Pseudomonas sp. I3 isolated from permafrost soil of Mohe wetland in Northeast China. J. Environ. Manag. 2017, 196, 8–15. [Google Scholar] [CrossRef]
  77. Shen, D.; Liu, G.; Zhao, J.; Xue, J.; Guan, S.; Xiao, R. Thermo-chemical conversion of lignin to aromatic compounds: Effect of lignin source and reaction temperature. J. Anal. Appl. Pyrolysis 2015, 112, 56–65. [Google Scholar] [CrossRef]
  78. Boakye, P.; Tran, H.N.; Lee, D.S.; Woo, S.H. Effect of water washing pretreatment on property and adsorption capacity of macroalgae-derived biochar. J. Environ. Manag. 2019, 233, 165–174. [Google Scholar] [CrossRef]
  79. Plaza, C.; Nogales, R.; Senesi, N.; Benitez, E.; Polo, A. Organic matter humification by vermicomposting of cattle manure alone and mixed with two-phase olive pomace. Bioresour. Technol. 2008, 99, 5085–5089. [Google Scholar] [CrossRef]
  80. Liu, X.; Bai, X.; Dong, L.; Liang, J.; Jin, Y.; Wei, Y.; Li, Y.; Huang, S.; Qu, J. Composting enhances the removal of lead ions in aqueous solution by spent mushroom substrate: Biosorption and precipitation. J. Clean. Prod. 2018, 200, 1–11. [Google Scholar] [CrossRef]
  81. Wu, Y.; Chen, Y.; Shaaban, M.; Zhu, D.; Hu, C.; Chen, Z.; Wang, Y. Evaluation of microbial inoculants pretreatment in straw and manure co-composting process enhancement. J. Clean. Prod. 2019, 239, 118078. [Google Scholar] [CrossRef]
  82. Stefke, B.; Windeisen, E.; Schwanninger, M.; Hinterstoisser, B. Determination of the weight percentage gain and of the acetyl group content of acetylated wood by means of different infrared spectroscopic methods. Anal. Chem. 2008, 80, 1272–1279. [Google Scholar] [CrossRef] [PubMed]
  83. Jin, Y.; Teng, C.; Yu, S.; Song, T.; Dong, L.; Liang, J.; Bai, X.; Liu, X.; Hu, X.; Qu, J. Batch and fixed-bed biosorption of Cd(II) from aqueous solution using immobilized Pleurotus ostreatus spent substrate. Chemosphere 2018, 191, 799–808. [Google Scholar] [CrossRef] [PubMed]
  84. Drumm, F.C.; Franco, D.S.P.; Georgin, J.; Grassi, P.; Jahn, S.L.; Dotto, G.L. Macro-fungal (Agaricus bisporus) wastes as an adsorbent in the removal of the acid red 97 and crystal violet dyes from ideal colored effluents. Environ. Sci. Pollut. Res. Int. 2021, 28, 405–415. [Google Scholar] [CrossRef] [PubMed]
  85. Li, X.; Zhang, D.; Sheng, F.; Qing, H. Adsorption characteristics of Copper (II), Zinc (II) and Mercury (II) by four kinds of immobilized fungi residues. Ecotoxicol. Environ. Saf. 2018, 147, 357–366. [Google Scholar] [CrossRef]
  86. Georgin, J.; Franco, D.S.; Grassi, P.; Tonato, D.; Piccilli, D.G.; Meili, L.; Dotto, G.L. Potential of Cedrella fissilis bark as an adsorbent for the removal of red 97 dye from aqueous effluents. Environ. Sci. Pollut. Res. 2019, 26, 19207–19219. [Google Scholar] [CrossRef]
  87. Zazycki, M.A.; Godinho, M.; Perondi, D.; Foletto, E.L.; Collazzo, G.C.; Dotto, G.L. New biochar from pecan nutshells as an alternative adsorbent for removing reactive red 141 from aqueous solutions. J. Clean. Prod. 2018, 171, 57–65. [Google Scholar] [CrossRef]
  88. Behl, K.; Sinha, S.; Sharma, M.; Singh, R.; Joshi, M.; Bhatnagar, A.; Nigam, S. One-time cultivation of Chlorella pyrenoidosa in aqueous dye solution supplemented with biochar for microalgal growth, dye decolorization and lipid production. Chem. Eng. J. 2019, 364, 552–561. [Google Scholar] [CrossRef]
  89. Li, N.; Wang, S.; Wang, T.; Liu, R.; Zhi, Z.; Wu, T.; Sui, W.; Zhang, M. Valorization of Wheat Bran by Three Fungi Solid-State Fermentation: Physicochemical Properties, Antioxidant Activity and Flavor Characteristics. Foods 2022, 11, 1722. [Google Scholar] [CrossRef]
Figure 1. Phylogenetic tree of Lasiodiplodia sp. strain YZH1 with related fungal strains. The tree was constructed using the neighbor-joining method with 1000 replicates of bootstrap values. The accession numbers are given in brackets.
Jof 09 01069 g001
Figure 2. Growth curve of Lasiodiplodia sp. YZH1 in wheat bran (A) and laccase activity and biomass loss during SSF of WB with Lasiodiplodia sp. YZH1 (B) in a period of 8 days.
Jof 09 01069 g002
Figure 3. Dye removal efficiency by WB (wheat bran) and FWB (fermented wheat bran with Lasiodiplodia sp. YZH1).
Jof 09 01069 g003
Figure 4. The parity plots illustrate the relationship between experimental and predicted values after contact time of 12 h (A) and 24 h (B) and residual versus predicted response values after 12 h (C) and 24 h (D).
Jof 09 01069 g004
Figure 5. Three-dimensional response surface plots showing the interactive effects between each of the two variables on dye removal efficiency by FWB after contact time of 12 h (A,C,E) and after contact time of 24 h (B,D,F).
Jof 09 01069 g005
Figure 6. Characterization of WB and FWB: (A) FTIR spectra; (B) XRD spectra.
Jof 09 01069 g006
Figure 7. Scanning electron microscopy (SEM) images of WB (A); FWB (B) at magnifications of ×100 and ×300.
Jof 09 01069 g007
Figure 8. Dye removal efficiency by Lasiodiplodia sp. YZH1 in 50, 150, 250 mg L−1 dye-containing liquid cultures.
Jof 09 01069 g008
Table 1. Ranges and levels of the Box–Behnken design.
VariableRange and Level
NameUnit−101
Wheat bran fermentation duration
(X1)
day246
pH of the dye solution
(X2)
4.56.58.5
Dye concentration
(X3)
mg L−150150250
Table 2. Box–Behnken experimental design matrix for optimization of dye removal by solid-state fermentation of wheat bran with Lasiodiplodia sp. YZH1 (FWB).
RunVariablesResponse 1
Dye Removal Percentage after 12 h (%)
Response 2
Dye Removal Percentage after 24 h (%)
Fermentation Duration
(X1)
Solution pH
(X2)
Dye
Concentration (X3)
ExperimentalPredictedExperimentalPredicted
166.55089.5589.5485.1785.43
246.515087.5187.8389.2889.87
344.55087.5687.9385.0785.08
446.515087.9187.8390.2589.87
528.515082.2182.5786.7186.99
626.525075.3575.3583.6683.40
748.55088.3888.5784.5184.73
864.515089.4189.0690.8390.56
924.515080.8181.0085.3585.84
1026.55085.3984.8484.2783.76
1146.515088.0887.8390.0989.87
1268.515090.2690.0793.0892.58
1348.525083.1882.8189.8089.79
1444.525081.0780.8886.5086.27
1566.525085.6686.2191.5392.04
Table 3. Analysis of variance (ANOVA) for the Box–Behnken design experimental outcomes of dye removal after 12 h of adsorption by FWB.
SourceSums of SquaresdfMean SquareF-Valuep-ValueRemarks
Model242.83926.9892.75<0.0001Significant
X1121.051121.05416.13<0.0001Significant
X23.3213.3211.430.0197Significant
X382.07182.07282.12<0.0001Significant
X1X20.075310.07530.25880.6326Not significant
X1X39.4619.4632.520.0023Significant
X2X30.413910.41391.420.2865Not significant
X129.5919.5932.970.0022Significant
X221.1111.113.820.1082Not significant
X3218.46118.4663.470.0005Significant
Residual1.4550.2909
Lack of Fit1.2930.42865.080.1689Not significant
Pure Error0.168820.0844
Cor Total244.2914
Std. Dev.0.5394R2 =0.9940
Mean85.49Adj. R2 =0.9833
C.V. %0.6309Pred. R2 =0.9142
PRESS20.95Adeq. Precision 33.4159
Std. Dev.: standard deviation; C.V.: coefficient of variation; PRESS: prediction error sum of squares; Adeq. Precision: adequate precision.
Table 4. Analysis of variance (ANOVA) for the Box–Behnken design experimental outcomes of dye removal after 24 h of adsorption by FWB.
SourceSums of SquaresdfMean SquareF-Valuep-ValueRemarks
Model130.11914.4637.530.0005Significant
X153.10153.10137.83<0.0001Significant
X25.0215.0213.040.0154Significant
X319.48119.4850.560.0009Significant
X1X20.193210.19320.50160.5104Not significant
X1X312.14112.1431.530.0025Significant
X2X33.7413.749.720.0263Significant
X121.3111.313.410.1240Not significant
X220.298410.29840.77460.4191Not significant
X3235.96135.9693.330.0002Significant
Residual1.9350.3852
Lack of Fit1.3930.46321.730.3873Not significant
Pure Error0.536720.2683
Cor Total132.0414
Std. Dev.0.5394R2 =0.9940
Mean85.49Adj. R2 =0.9833
C.V. %0.6309Pred. R2 =0.9142
PRESS20.95Adeq. Precision 33.4159
Std. Dev.: standard deviation; C.V.: coefficient of variation; PRESS: prediction error sum of squares; Adeq. Precision: adequate precision.
Table 5. Validation of the design model.
AnalysisPredicted MeanPredicted MedianStd DevSE Pred95% PI LowData Mean95% PI High
12 h89.87789.8770.5390.68988.10689.48591.648
24 h92.88292.8820.5940.71391.13893.40295.114
Disclaimer/Publisher’s Note: The statements, opinions and data contained in all publications are solely those of the individual author(s) and contributor(s) and not of MDPI and/or the editor(s). MDPI and/or the editor(s) disclaim responsibility for any injury to people or property resulting from any ideas, methods, instructions or products referred to in the content.

