Article

Population Genomics Reveals Population Structure and Mating-Type Loci in Marssonina brunnea

Co-Innovation Center for Sustainable Forestry in Southern China, Nanjing Forestry University, Nanjing 210037, China
*
Author to whom correspondence should be addressed.
J. Fungi 2022, 8(6), 579; https://doi.org/10.3390/jof8060579
Submission received: 25 April 2022 / Revised: 21 May 2022 / Accepted: 24 May 2022 / Published: 28 May 2022

Abstract

:
Marssonina brunnea is an important fungal pathogen of poplar trees. We collected 32 M. brunnea f.sp. multigermtubi (MbMu) and three M. brunnea f.sp. monogermtubi (MbMo) isolates from four poplar species in three Chinese regions and performed genome resequencing. An annotation of SNPs of MbMu indicated that the SNPs potentially have a functional effect on 69.2% of the predicted genes. Using the SNP dataset of nonredundant isolates, a structure and principal component analysis revealed that MbMu and MbMo belong to two genetically distinct populations. By contrast, subpopulation structures could not be found among MbMu isolates. A neighbor-net analysis and a homoplasy index test provided evidence of recombination among MbMu isolates. The short distance (109–174 bp) of linkage disequilibrium half-decay supported the presence of a high level of recombination in the MbMu population. The genetic architectures of the MAT loci of MbMu and MbMo were revealed by searching genome assemblies or by homology-based cloning, and a BLAST search verified each isolate carrying one of the two opposite MAT loci. This study revealed that the MbMu population contains a wide range of functional variants, shows high-frequency recombination, and exhibits heterothallic mating systems, indicating high evolutionary potential and a resultant threat to poplar plantations.

1. Introduction

Marssonina leaf spot disease (MLSD) is a widespread and devastating disease of poplar (Populus spp.), and its causal agent is Marssonina brunnea (Helotiales, Ascomycota) [1]. M. brunnea was first reported in the USA in 1889 [2], and to date, this fungal pathogen has spread to Europe [3], Asia [4], and Oceania [1], resulting in early defoliation, weakened tree vigor, and reduced biomass accumulation. The isolates of M. brunnea observed in China are classified into two formae speciales, M. brunnea f.sp. multigermtubi (MbMu) and M. brunnea f.sp. monogermtubi (MbMo). MbMu infects poplar trees of the sections Aigeiros and Tacamahaca, and MbMo is hosted by poplar trees of the section Leuce. In Europe, M. brunnea also has two formae speciales, M. brunnea f.sp. trepidae, which specifically infects P. tremula of sect. Leuce, and M. brunnea f.sp. brunnea, which infects P. deltoides and P. × euramerieana of sect. Aigeiros [5]. According to their specialized host range, the two formae speciales in Europe may represent MbMo and MbMo, but there is no molecular phylogenetic evidence supporting this association.
Poplars of sect. Aigeros present differences in resistance and susceptibility to MbMu. P. × euramericana, P. × canadensis and some P. deltoides are susceptible to MbMu; however, some P. deltoides genotypes have complete resistance. A recent study has shown that two large-effect quantitative trait loci were responsible for the differentiation of MbMu resistance in P. deltoides [6]. P. deltoides and P. × euramericana were introduced into China in the 1970s from North America and Europe, and these poplars and their hybrids are widely cultivated in the country. In particular, elite cultivars with MbMu resistance have been planted on over 4 million acres in the lower-middle reaches of the Yangtze river basin, where MLSD is prevalent [6].
Widespread poplar planting with resistant cultivars in China poses the risk of resistance to M. brunnea being overcome. However, to date, there has been limited research on the M. brunnea population and its means of reproduction. With randomly amplified polymorphic DNA (RAPD) markers, Han et al. analyzed the genetic diversity of 37 MbMu and five MbMo isolates from multiple geographic regions and hosts. The results supported the genetic classification of the formae speciales, and no significant associations between genetic divergence and geographic regions/hosts were found within the MbMu population [4].
The teleomorph (sexual stage) of M. brunnea is referred to as Drepanopeziza tremulae and the apothecia of D. tremulae has been observed once on naturally infected leaves, but not on an artificial medium [7]. In the Ascomycota, a single mating-type (MAT) locus, which has alternative forms (idiomorphs), MAT1-1 and MAT1-2, controls sexual reproduction. The MAT1-1 idiomorph contains the MAT1-1-1 gene, encoding an alpha-box protein, and the MAT1-2 idiomorph carries the MAT1-2-1 gene, encoding a high mobility group-motif protein. Strains of heterothallic fungi contain one idiomorph and are required to mate with a member containing the opposite idiomorph for sexual production. In contrast, homothallic fungi contain both MAT1-1-1 and MAT1-2-1 genes within a single individual, which allows for self-crossing [8]. The MAT locus and mating system of M. brunnea remain unknown to date.
The whole-genome sequence of one MbMu isolate, MB_m1, which is a 51.95 Mb genome assembled from 89 scaffolds, was reported in 2012 [9], but no MbMo genome has been reported. Here, we sequenced 32 MbMu and three MbMo isolates and conducted population genomic analyses to explore (i) the population structure of M. brunnea, including whether an admixture between MbMu and MbMo exists, and whether there are host or geographic subpopulations in the MbMu population; (ii) genetic recombination among MbMu isolates; and (iii) the mating system of M. brunnea.

2. Materials and Methods

2.1. Isolates Collection

MbMu isolates were collected from infected leaves of P. × euramericana cv. I214 during 2015 in Nanjing (118°77′ E, 32°04′ N), located in the southeast of China; P. × canadensis during 2015 and 2018 in Nanjing, P. × canadensis during 2018 in Qiannan (107°47′ E, 27°07′ N), located in southwest China; and P. simonii in Yan’an (109°28′ E, 36°36′ N), located in northwest China. MbMo isolates were collected from infected leaves of P. tomentosa located in Nanjing during 2016 (Figure 1 and Table 1). The infected leaves were cut into ~5-mm segments, surface-disinfected in 0.1% mercuric chloride, and washed in sterile distilled water; the segments were placed on potato dextrose agar (PDA) and incubated at 25 °C for 2 weeks. After 20 days, colonies with asexual conidia developed on the edge of the leaf disk. Single-spore isolates were produced by diluting the conidia and spreading them on water agar and later transferring single, germinating conidia to PDA.

2.2. DNA Extraction and Genome Sequencing

The mycelia of single-spore isolates grown on cellophane-overlaid PDA plates were collected and ground in liquid nitrogen. DNA was extracted using the DNAsecure Plant Kit (Tiangen, Beijing, China). DNA quality was verified on 1.5% agarose gels, and DNA concentration was measured using a Qubit 3.0 Fluorometer (Invitrogen, Carlsbad, CA, USA). The libraries were made with a NEB Next Ultra DNA Library Prep Kit for Illumina (New England Biolabs, Ipswich, MA, USA) with an insert size of 350 bp following the manufacturer’s protocol. The DNA libraries were sequenced on an Illumina HiSeq 2500 sequencer (Illumina, San Diego, CA, USA) producing 150 bp paired-end reads. The raw reads were cleaned by removing the adapter sequences, low-quality sequences (Phred quality < 5), and any reads with more than 10% unknown sequences.

2.3. Read Mapping, SNP Calling, and Summary Statistics

The clean reads were mapped onto the MbMu MB_m1 reference genome [9] using a Burrows-Wheeler Aligner (BWA) v0.7.15 [10]. Aligned reads were sorted and duplicates dislodged with Samtools 1.6 [11]. SNP calling was performed using GATKs HaplotypeCaller [12] with the ploidy set to one, according to the Best Practices guidelines. SNPs were filtered using the following parameters: QD < 2.0, MQ < 40.0, FS > 60.0, and DP < 20. Only biallelic SNPs supported by more than five aligned reads and SNPs presenting in all isolates were kept in the final variant call file. FST values were calculated with DNAsp 6 [13]. SNPs were annotated using SnpEff5.0 [14].

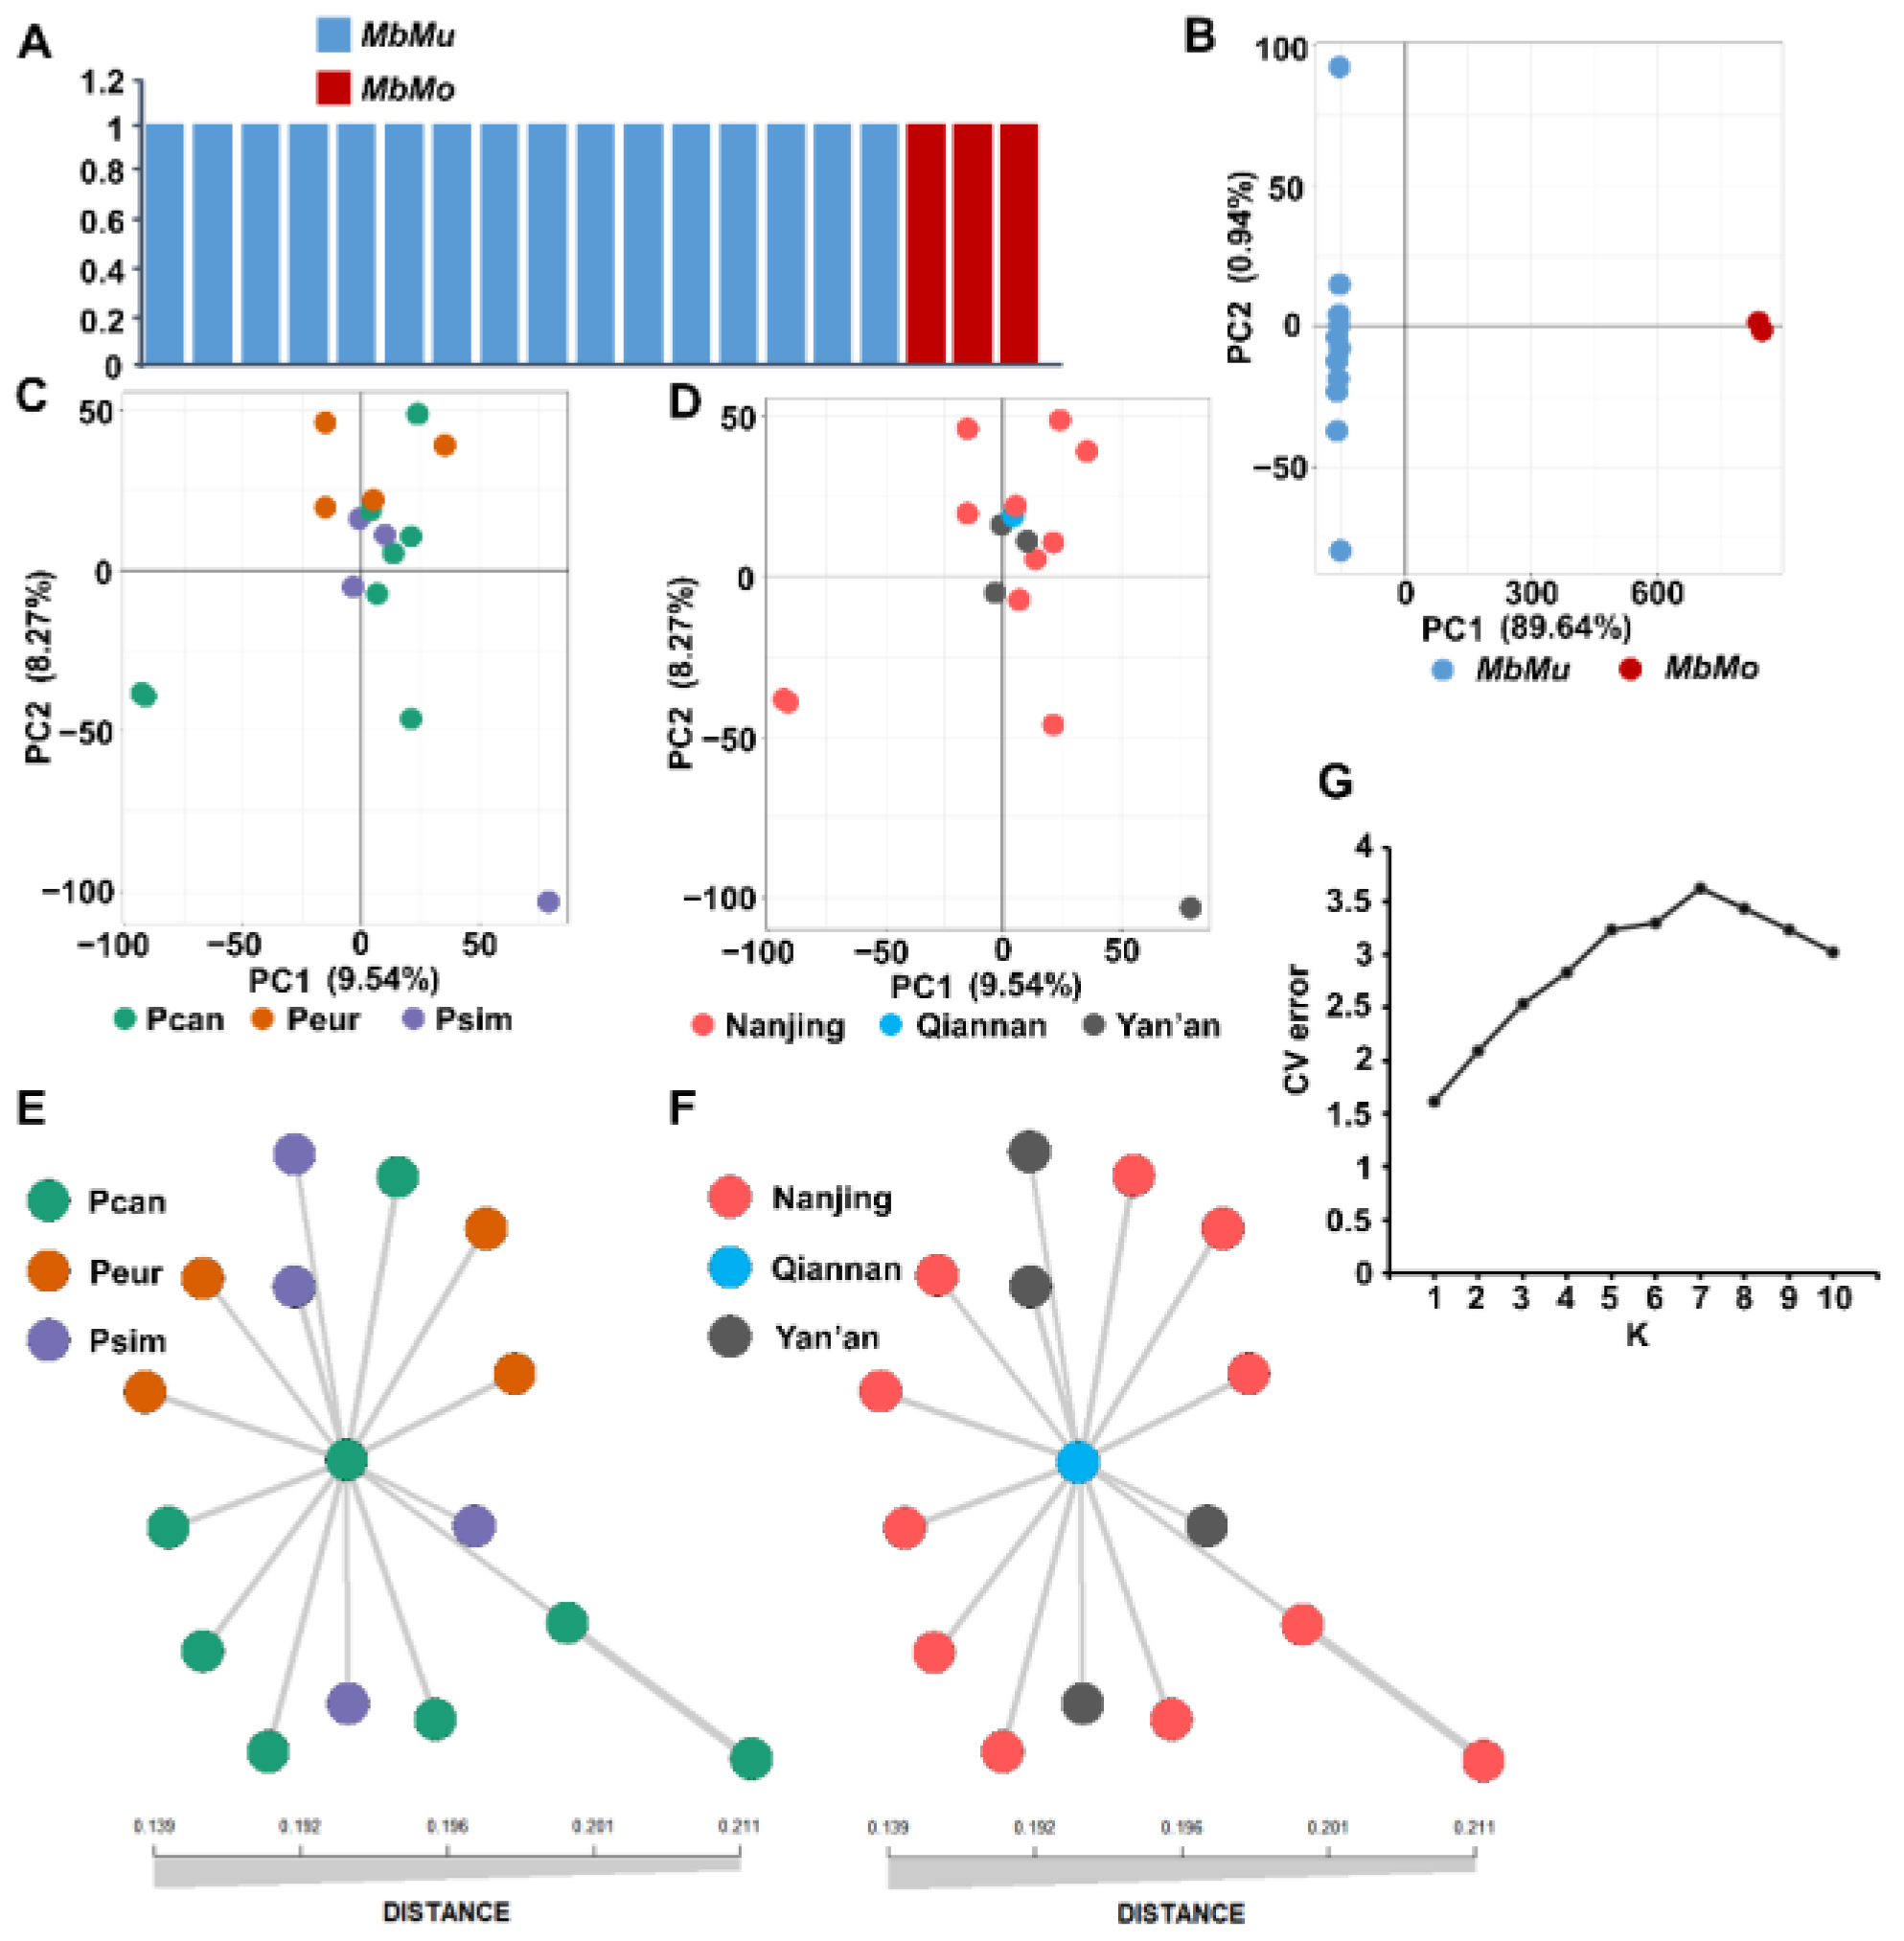
2.4. Population Structure

The structure of M. brunnea was analyzed with fastSTRUCTURE 1.0 software [15], with 10 replicates for each K value (population cluster) from 1 to 10. The optimal K value was chosen using the “chooseK.py” script and visual inspection. The optimal number of clusters was also determined on the lowest cross-validation error of K values from 1 to 10 generated by ADMIXTURE software [16]. A principal component analysis (PCA) was run using the glPCA function of the R package in Poppr v3.2.4 [17]. A minimum spanning network (MSN) using bitwise genetic distance was implemented with the poppr.msn function of Poppr v3.2.4, to show the relationships among all isolates in the population.

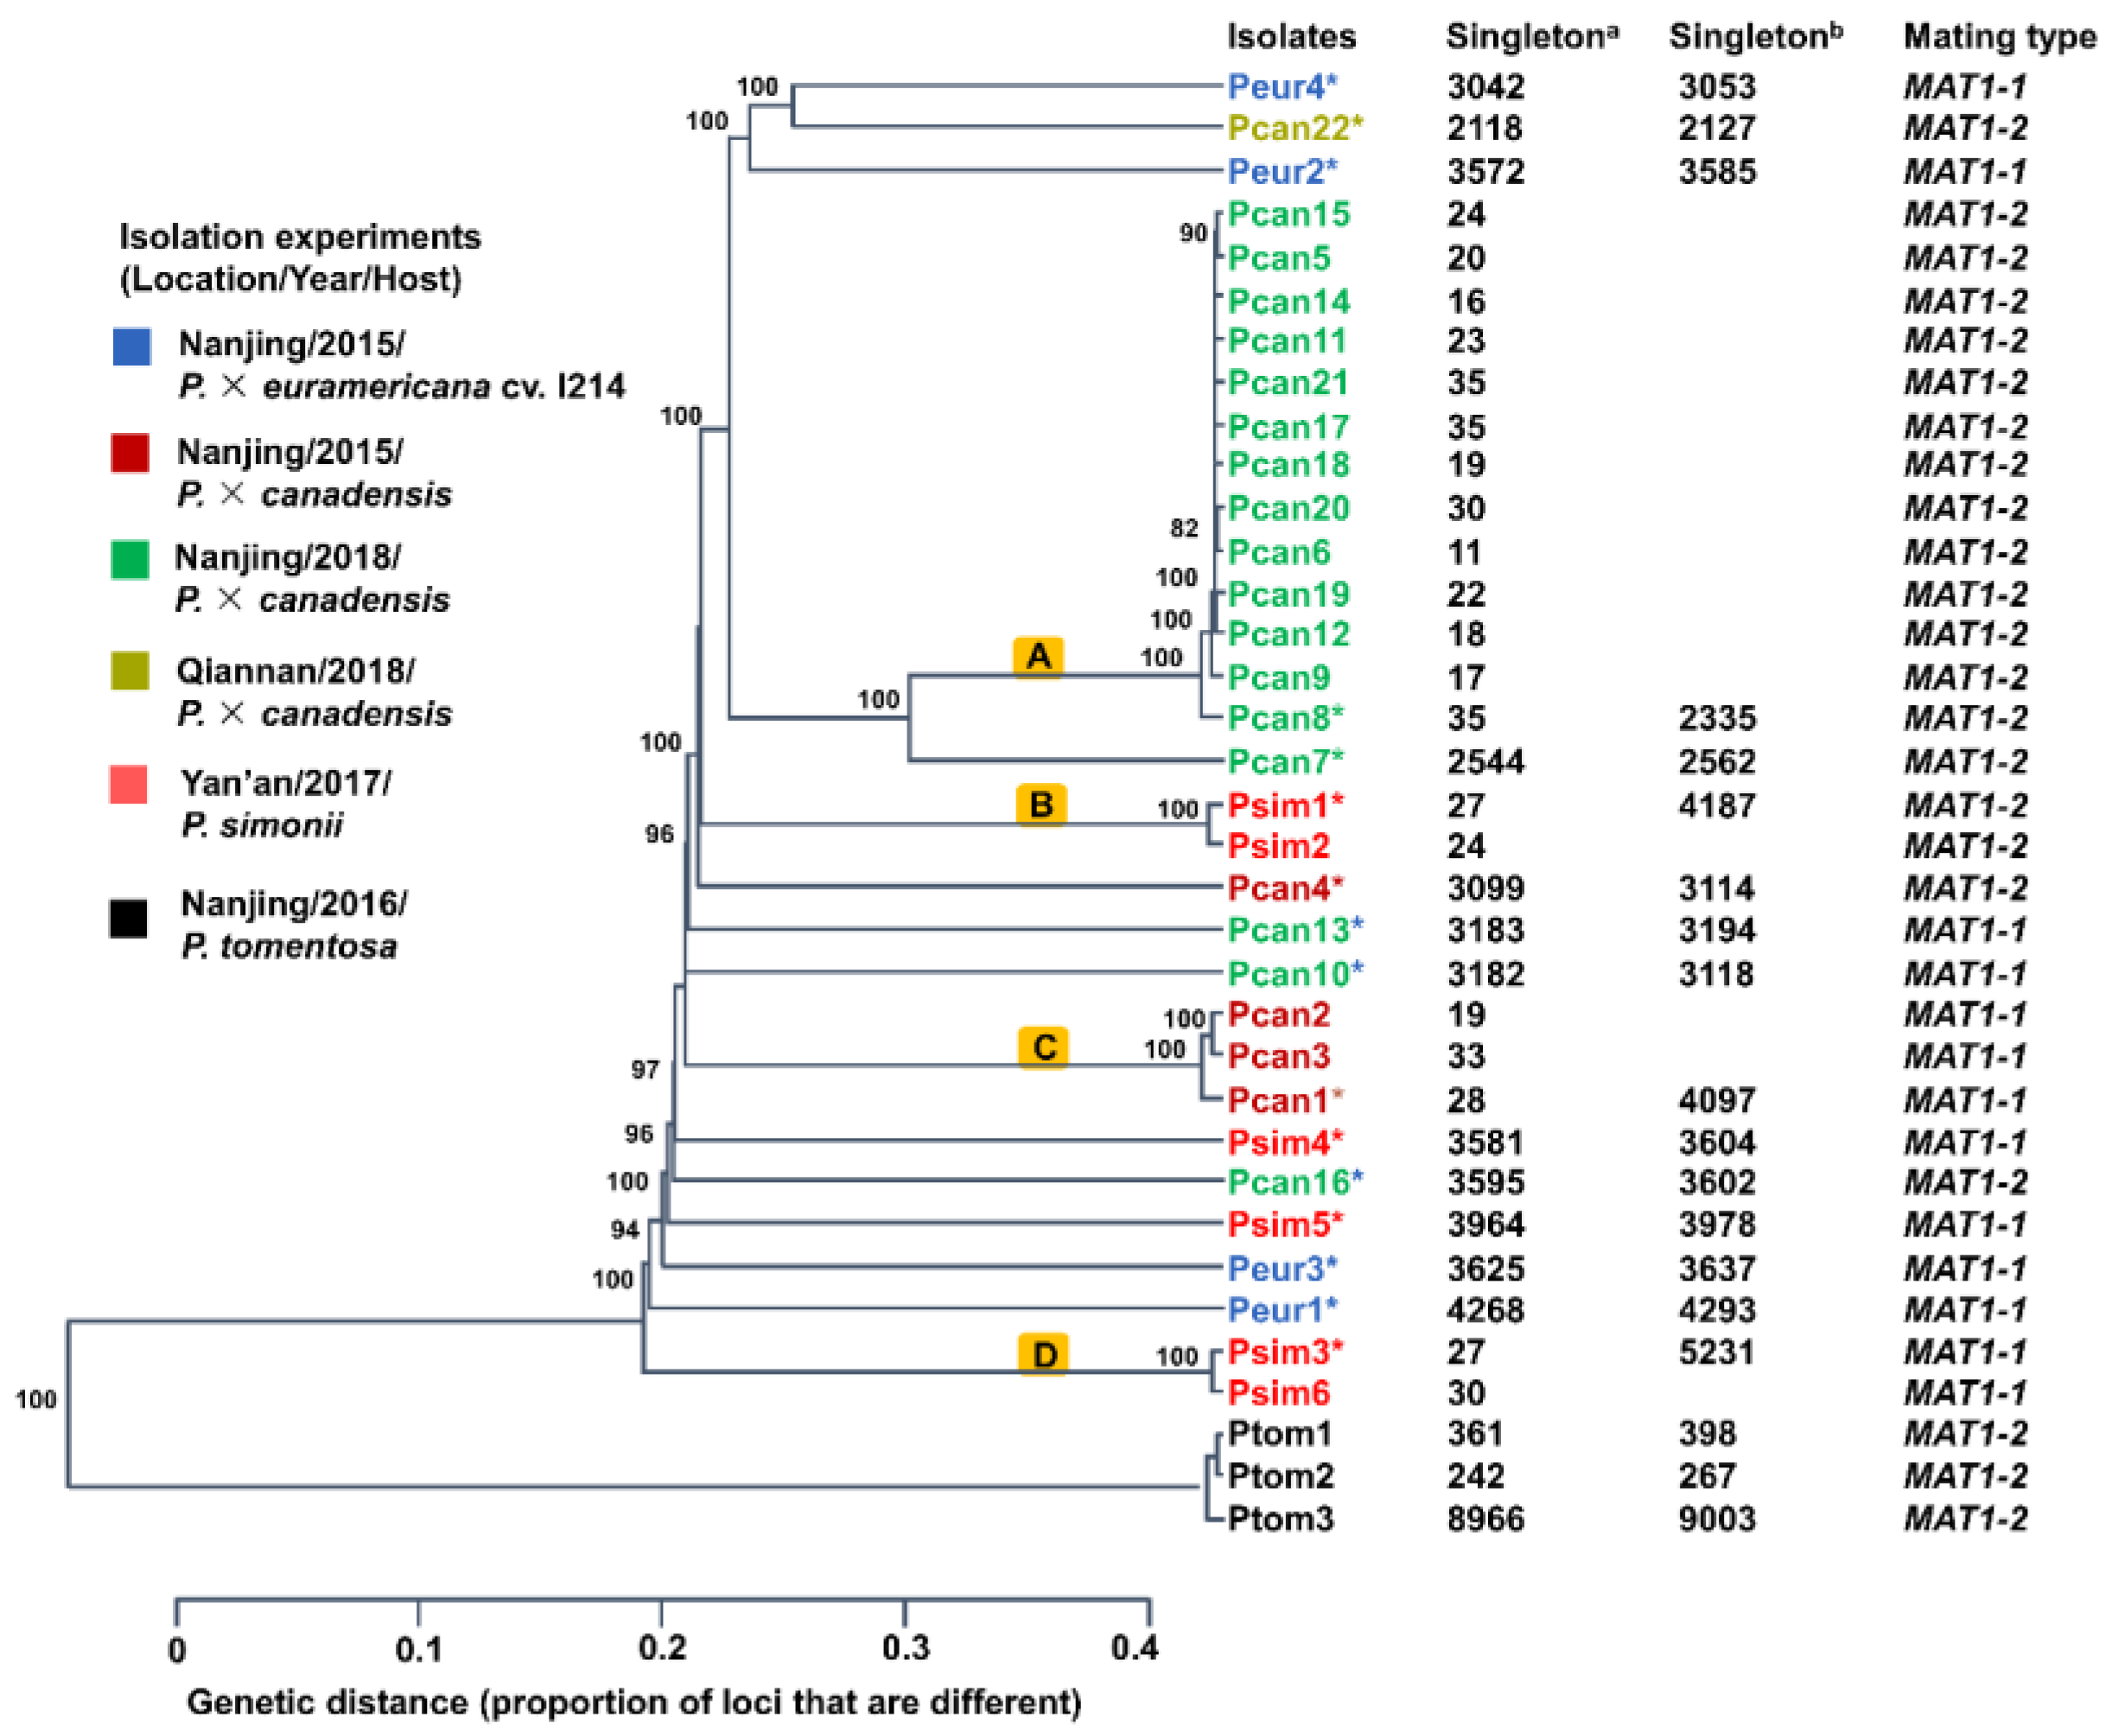
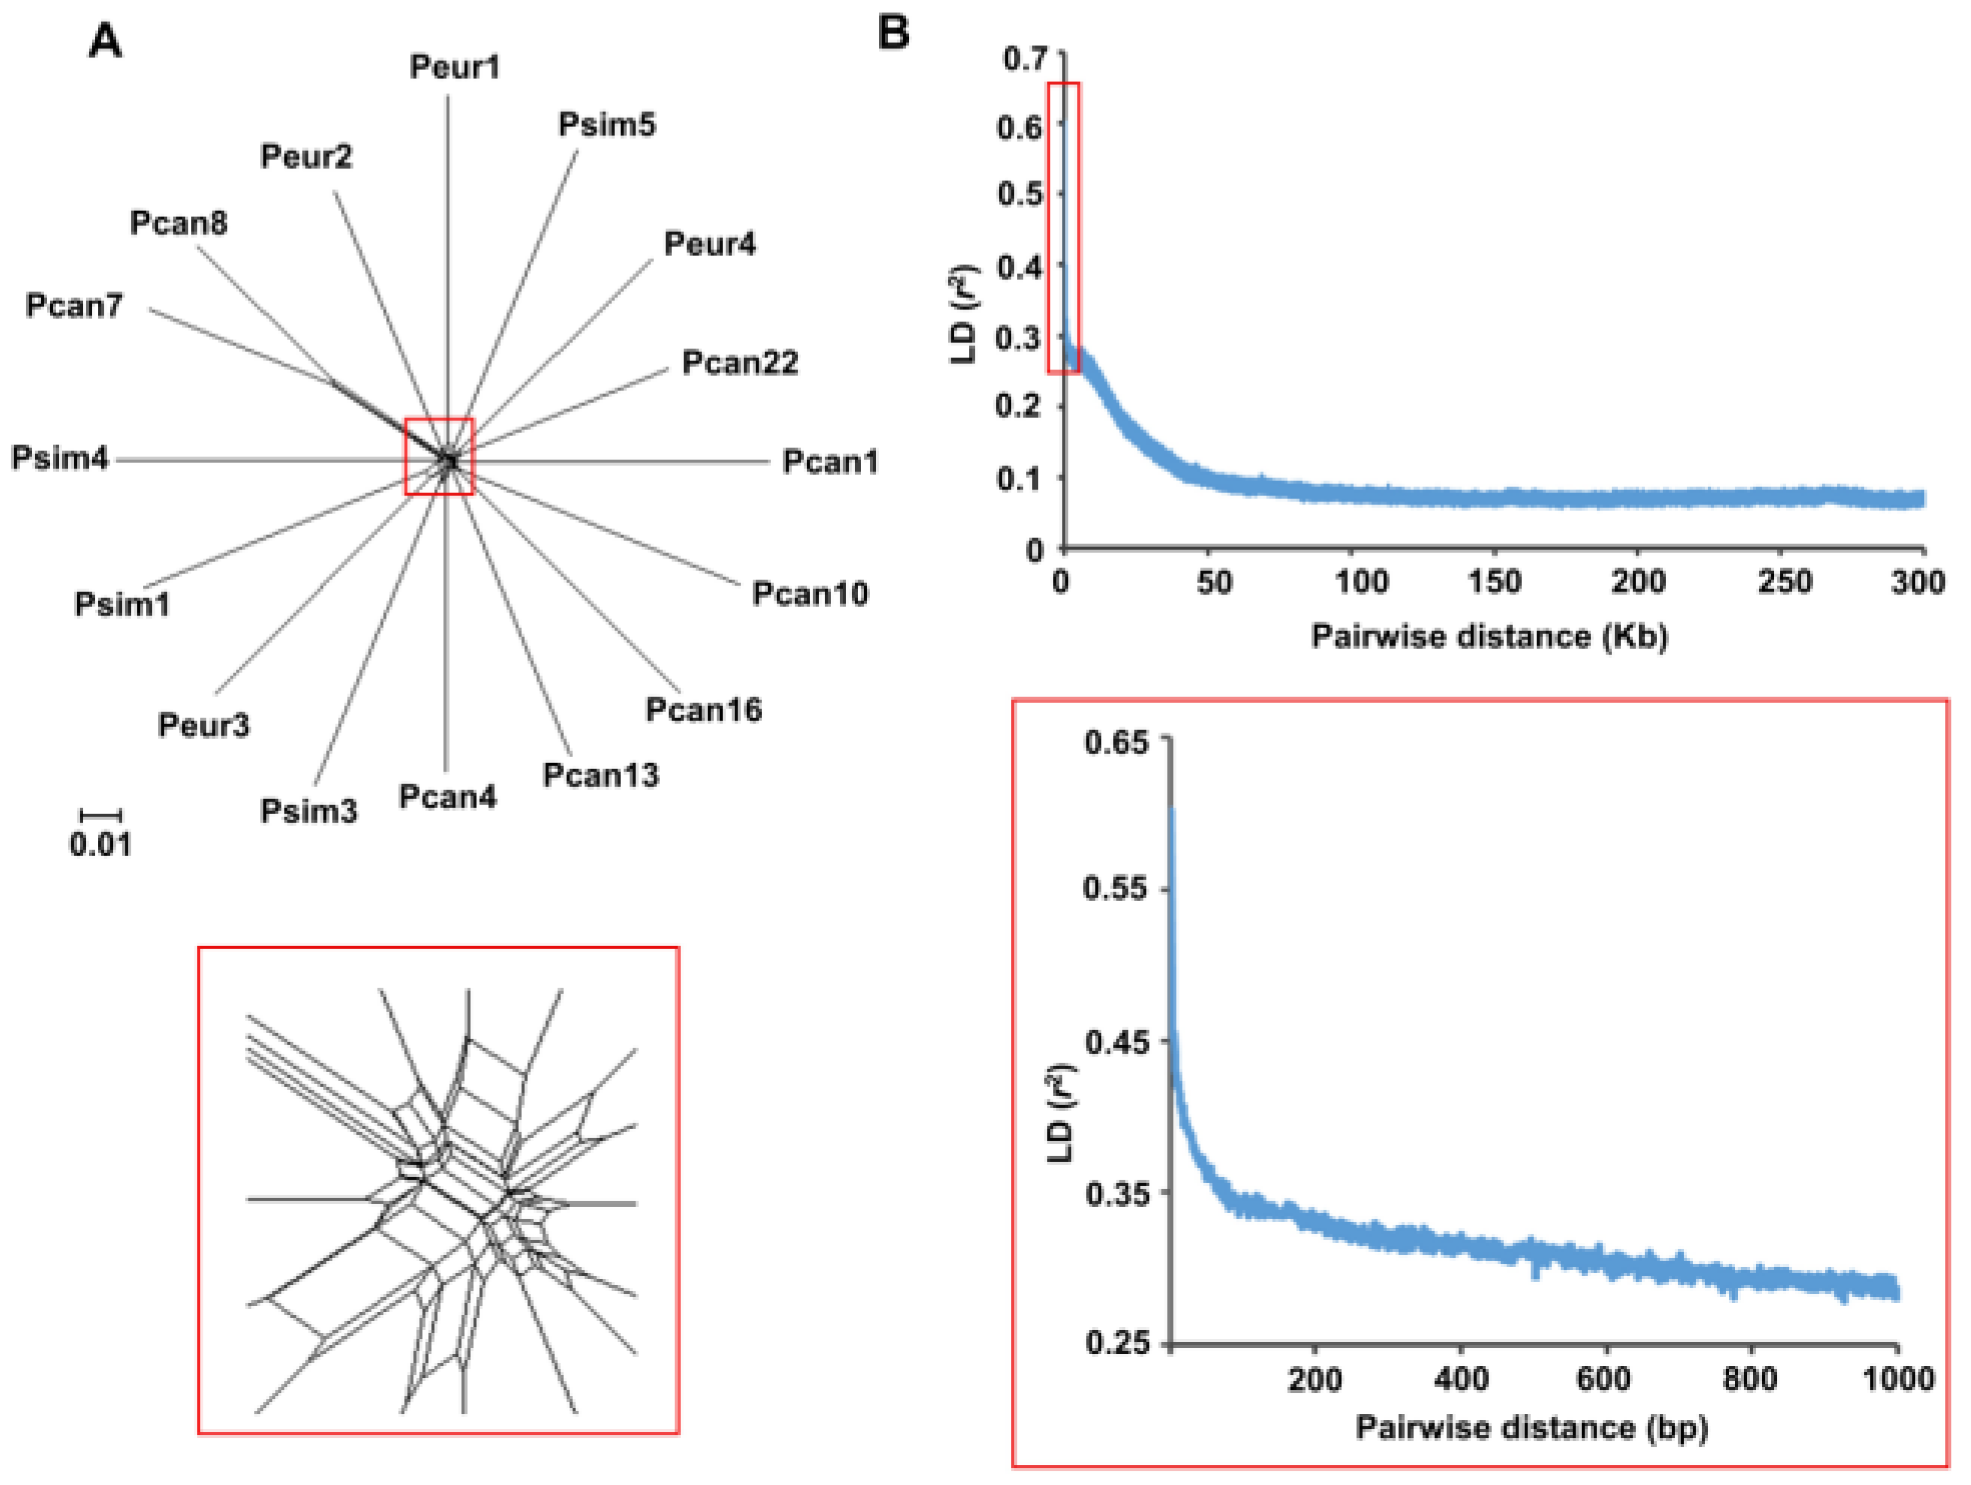
2.5. Phylogeny and Recombination Analysis

Phylogenic analyses that were estimated using the SNP dataset were conducted with Poppr v3.2.4 using the unweighted pair group method with arithmetic mean (UPGMA) and 1000 bootstrap resamples and with SplitsTree 4 [18] using a neighbor-net algorithm with the uncorrected P distance. A phylogenetic analysis estimated using MAT1-2 idiomorph sequences was implemented in Mega 7.0 [19] using the maximum-likelihood method with the Tamura–Nei model and 1000 bootstrap replicates.
The presence of recombination was tested with the homoplasy index (PHI)-test implemented in SplitsTree 4. Linkage disequilibrium (LD) decay was calculated for all pairs of SNPs within 300 kb using PopLDdecay [20].

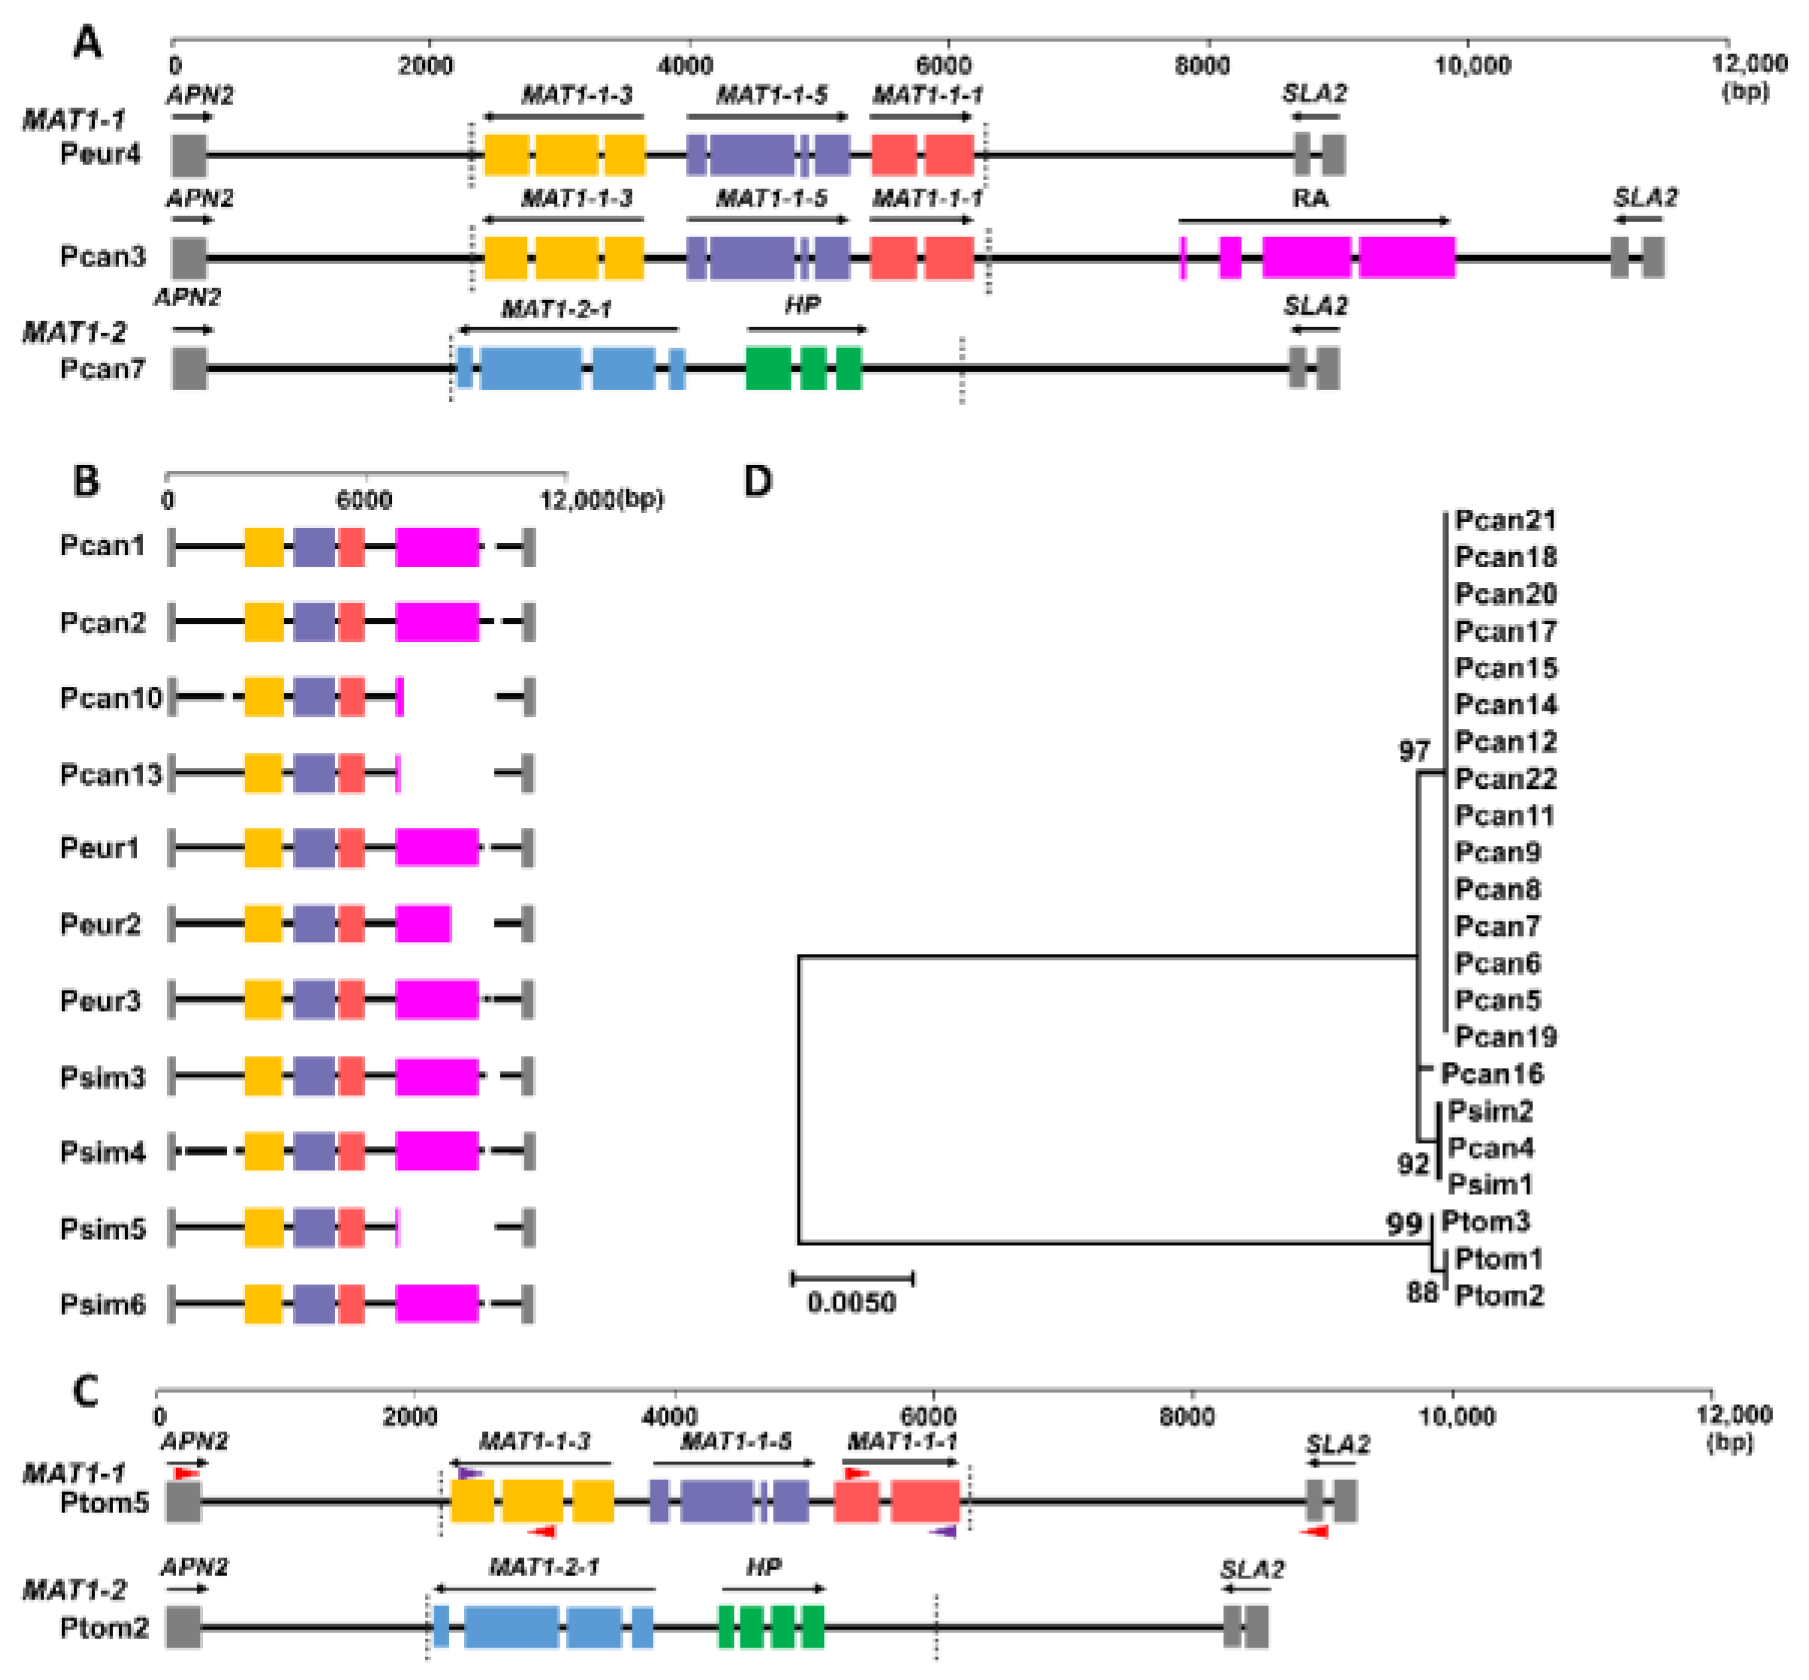
2.6. Genome Assembly and MAT Loci

The cleaned reads from each isolate were assembled using SOAPdenovo [21], and the completeness assessment of the assembled genomes was undertaken using BUSCO v3 against the fungi_odb9 dataset [22]. The MAT1-1 and MAT1-2 loci of MbMu and MAT1-2 loci of MbMo were revealed by tBLASTn searches against these assemblies using the representative MAT genes (MAT1-1-1 and MAT1-2-1) of Pezizomycotina as query sequences [8]. The MAT1-1 locus of MbMo was obtained by homology-based cloning. The middle section of MbMo MAT1-1 was amplified by primers designed according to MAT1-1-3 and MAT1-1-1 of MbMu (5′-CAGATCAGCGAAGTAGTTGTCG-3′ and 5′-ACTGGCGTAAGGATCATTGAGT-3′, respectively); then, according to the middle section of MbMo MAT1-1, endonuclease DNA lyase gene (APN2) and cytoskeleton assembly control protein gene (SLA2) of MbMo, two pairs of primers (5′-GGGACTTTTATTTGGAGCAGTG-3′/5′-GCTGCCGGATCTTTCTCTACTA-3′ and 5′-AGTACCTGTTGAACCACCCAAT-3′/5′-GAAGGTATCGTACCAGGAGGAG-3, respectively) were designed to amplify the flanking regions. We amplified the above-mentioned sections from MbMo Ptom5 genomic DNA using LA Taq (Takara, Dalian, China). The polymerase chain reaction (PCR) procedure was as follows: initial denaturation at 94 °C for 3 min, followed by 36 cycles at 94 °C for 30 s, 56 °C for 30 s, 68 °C for 4 min. The PCR products were cloned into pMD-19T vector (Takara, Dalian, China) and sequenced. Full-length MbMo MAT1-1 locus was assembled from overlapping DNA fragments.

3. Results

3.1. Resequencing and SNP Calling of MbMu and MbMo

We obtained 2.00–3.26 Gb of clean DNA data from 32 MbMu isolates and mapped them to the reference genome (MbMu MB_m1). Most MB_m1 genomic regions (88.99% to 97.92%) were covered by at least one read, and the mean depth was 36.9-fold (30.16–47.27 fold) (Table 1). We also sequenced three MbMo isolates and generated 16.18, 3.51, and 3.81 Gb of clean data, respectively, which covered 47.38–48.25% of the MB_m1 genomic regions (mean depth 30.88–127.28 fold). Based on the mapping results, 1,139,808 biallelic SNPs without missing data were obtained. Phylogenetic analysis using this SNP dataset revealed that 20 isolates in four clades (A, B, C, and D) showed very short genetic distances, and isolates from each clade were derived from the same isolation experiments (same location, host, and time). Furthermore, the number of SNP singletons of these isolates was low (11–35) (Figure 1), indicating that they were redundant clones.
After removing the redundant isolates, we obtained a SNP dataset of 19 isolates containing 1,140,345 biallelic SNPs without missing data, in which 32,941–43,147 SNPs were identified in 16 MbMu isolates and 1,023,223–1,023,392 SNPs were identified in three MbMo isolates (Table 1). The number of singletons of each isolate ranged from 267 to 5231 (Figure 1). SNP calling with the 16 nonredundant MbMu isolates obtained a dataset containing 430,649 biallelic SNPs without missing data. SNP annotation of the SNP dataset of 16 nonredundant MbMu isolates showed that 864 gene structures had been greatly influenced by changes in splicing (481) or resulted in stop codon gain (1116) and loss (104), and 6584 gene coding sequences were changed due to non-synonymous SNPs (42,359). That is, 6938 genes possessing potential functional variations accounted for over 69.2% of the predicted genes (10,027) in M. brunnea MB_m1.

3.2. Population Structure Analysis of MbMu and MbMo

The above phylogenetic analysis showed that isolates from MbMu and MbMo belong to distinct clades. The genetic distance between the two formae speciales is larger than that within each clade. With the SNP dataset of 19 nonredundant isolates, fastSTRUCTURE analyses identified K = 2 as the optimal population number, in which isolates from MbMu and MbMo were separately grouped, and no admixture signal was found (Figure 2A). In the PCA, one principal component accounted for 89.64% of the total variance in the data, which clearly distinguished isolates from the two formae speciales (Figure 2B). Furthermore, the huge genetic differentiation between MbMu and MbMo was supported by an FST value of 0.91.
In contrast with the SNP subset of 16 nonredundant MbMu isolates, the PCA showed that the first and second principal components explained only 9.54% and 8.27% of the variance, respectively, and no clustering associated with host or sampling location was observed (Figure 2C,D). The minimum spanning network (MSN) plots also showed that the MbMu population was not differentiated according to host or location (Figure 2E,F). fastSTRUCTURE analysis assigned all samples into a single cluster (the optimal population number K = 1), and based on the lowest cross-validation error, admixture software determined that the most likely number of populations was 1 (Figure 2G). Furthermore, the FST values among different host and geographic MbMu groups were 0.0017–0.01. Therefore, all of these results supported no subdivision within the MbMu population.

3.3. Recombination in the MbMu Population

The lack of a subpopulation structure among the MbMu isolates might be explained by frequent recombination. The neighbor-net analysis of MbMu isolates showed a multifurcating phylogenetic tree with complicated reticulations in the base, implying the existence of recombination events (Figure 3A). Furthermore, a PHI-test implemented in SplitsTree provided statistically significant evidence for recombination (p = 0.0). We then measured the frequency of genetic recombination by LD decay. The LD value decayed to half between the maximum and minimum (LD50) at 109–174 bp, indicating high-frequency recombination in the MbMu population (Figure 3B).

3.4. MAT Loci of M. brunnea

To identify the MAT loci of M. brunnea, we assembled the genomes of 35 isolates and obtained 33.8–40.99 Mb assemblies of MbMu and 37.06–50.87 Mb assemblies of MbMo. The completeness of the assemblies was estimated to be 91%–99%. Using a BLAST search against assemblies with MAT genes of Pezizomycotina, a single MAT1-1-1 gene was identified in 13 MbMu isolates, a single MAT1-2-1 gene in 19 MbMu isolates, and a single MAT1-2-1 gene in each MbMo isolates (Figure 1).
One complete MbMu MAT1-1 locus was found in the Pcan3 assembly, of which a retrotransposon structure, i.e., a gene encoding a complete RNaseH domain of reverse transcriptase (RA), was located in the region between MAT1-1-1 and SLA2 (Figure 4A). The RA was moderately repetitive in the MB_m1 genome, with 17 copies (E-value < 1E-50, identity > 81%). The MAT1-1 loci of 11 MbMu isolates had a gap flanking part of the RA sequence (Figure 4B), indicating that these isolates may also carry RA in their MAT1-1 loci. By contrast, the complete MAT1-1 locus of the Peur4 assembly did not contain any of the RA sequence. Three protein-coding genes were predicted in each MbMu MAT1-1 locus, MAT1-1-1, MAT1-1-3, and MAT1-1-5 (Figure 4A,B).
The MAT1-2 loci of MbMu isolates were well assembled, with 12 complete MAT1-2 loci, and seven MAT1-2 loci disrupted in short repetitive sequences. Each MAT1-2 locus included two genes, MAT1-2-1 and a hypothetical protein gene (HP). HP homologs were found in the MAT1-2 locus of M. coronaria (49.8% amino acid sequence identity) and Rhynchosporium agropyri (30%).
Through homologous cloning and sequencing, a complete MAT1-1 locus in Ptom5 was revealed; the MAT1-1 locus of Ptom5 also included MAT1-1-1, MAT1-1-3, and MAT1-1-5, which had a high identity of nucleotide sequences with homologs of MbMu (98%, 97%, and 96%, respectively) and no transposon sequence. The MAT1-2 locus structure of MbMo was consistent with that of MbMu, with high similarity to MAT1-2-1 and HP (91% and 82% identity, respectively) (Figure 4C).
The sizes of the MAT1-1 and MAT1-2 idiomorphs of MbMu were 4204 bp and 3646–3727 bp, and those of MbMo were 4210 bp and 3664 bp, respectively. The MAT1-1 idiomorphs of different MbMu isolates had 100% identity, and there were 150 DNA polymorphic sites between the MAT1-1 idiomorphs of MbMu and MbMo. Alignment of the idiomorphs of MAT1-2 revealed nine DNA polymorphic sites within the MbMu isolates, two DNA polymorphic sites within the MbMo isolates, and 175 DNA polymorphic sites between MbMu and MbMo. A phylogenetic analysis of the MAT1-2 idiomorphs revealed that the MbMu isolates were divided into two highly supported clades and a single branch, and this phylogenetic relationship was similar to that generated by all SNPs (Figure 4D).

4. Discussion

The primary goal of this study was to explore the population structure of M. brunnea distributed in China using a population genomics approach. In China, there are two M. brunnea formae speciales, MbMu and MbMo, which are exclusively derived from Aigeiros/Tacamahaca and Leuce poplar trees, respectively. We found that the sequencing reads of MbMo covered 47.38–48.25% of the reference of genome MbMu, while two other Marssonina fungi, M. coronaria and M. rosae that infect apple and rose, respectively, covered less than 2% of the MbMu genome (data not shown), indicating a highly similar genomic content between MbMo and MbMu.
The early analysis of the M. brunnea population structure with 78 RAPD polymorphic sites supported the suggestion that MbMu and MbMo are two genetically distinct populations, while this analysis also revealed that an isolate from a Leuce poplar tree admixed polymorphisms of MbMu and MbMo [4]. The poplar hosts of MbMu and MbMo are distributed in overlapping regions of China. For example, the distance between poplar trees (P. × euramericana cv. I214, P. × canadensis, and P. tomentosa) involved in the Nanjing sampling experiments was less than 500 m. The trees were more than 40 years old, and MLSD had been recorded on them since the 1990s. Therefore, it is noteworthy to test the admixture between closely related MbMu and MbMo that have a long-term overlapping distribution. In this study, analyses with more than 1 million SNPs, including phylogenic analysis, structure analysis, and PCA, clearly distinguished isolates of MbMu and MbMo (Figure 1 and Figure 2A,B), indicating that even if there was individual recombination between MbMu and MbMo, there was no significant gene flow at the population genome level.
When the SNP dataset containing all isolates was used for phylogenetic analysis, four poorly differentiated clades within the MbMu population were observed (Figure 1), and for structure analyses, the isolates from each clade were also assigned to different clusters (data not shown). However, the isolates of each clade always exhibited the same mating type and carried a very small number of SNP singletons (Figure 1). Therefore, these poorly differentiated clades were likely to be separately composed of redundant clones generated by asexual reproduction of one genotype. After removing redundant clones, the phylogenetic relationships of the MbMu isolates formed a star-like multifurcating tree without any tight clades (Figure 2E,F and Figure 3A), and PCA and structure analysis supported one genetic cluster of all MbMu isolates without the subdivision of host and geographic region (Figure 2C–E). This conclusion was consistent with that of the early M. brunnea population research conducted by Han et al. [4].
Since chromosomal crossover that breaks linkage leads to an LD decrease with the distance between the two loci, LD decay is often used to analyze the frequency of genetic recombination in population genomic research. According to the LD decay study on multiple fungal populations by Nieuwenhuis et al., the obligately outcrossing mushroom Schizophyllum commune has the lowest LD50 at 110 bp, fungi with mixed reproductive modes have LD50 values of 130–27,010 bp, and highly clonal Candida albicans has an LD50 of 162,100 bp [23]. This indicated that the MbMu population (LD50 = 109–174 bp) has a very high recombination frequency. Therefore, the lack of a subpopulation of MbMu may be explained by the high frequency of genetic recombination between isolates. In addition, poplars of sect. Aigeros, introduced in the 1970s, were first bred in a limited area, such as Nanjing and northern Jiangsu province, where MLSD was prevalent. This allowed the genetic admixture between isolates or putative subpopulations. Then, the frequent transportation of nursery stock that bore MbMu may have resulted in the current countrywide admixture of MbMu isolates.
A BLAST search against assemblies revealed that single isolates only carry one of the two opposite MAT idiomorphs, implying a heterothallic system in M. brunnea. Due to recombination suppression in the MAT loci of heterothallic fungi [24], the phylogenetic analysis based on idiomorph sequences should be not affected by admixture of recombination. Using this approach, we found that all the MAT1-1 MbMu isolates may come from the same ancestor (100% identity within idiomorph), while the MAT1-2 MbMu isolates may be derived from three different ancestors. Whether these inferred ancestors represent MbMu isolates before genetic admixture needs further verification using isolates collected from natural forests far from areas to which seedlings may have been transported.
The structures of the MAT loci of many Helotiales fungi have been revealed; for example, Monilinia fructicola, M. laxa, M. fructigena [25], Hymenoscyphus fraxineus, H. albidus [26], Botrytis cinerea, Sclerotinia sclerotiorum [27], S. minor [28], Phialocephala scopiformis [29], Rhynchosporium commune, R. agropyri [30], and M. coronaria [31], in which Rhynchosporium spp., M. coronaria, and M. brunnea have the same set of MAT homologous genes. M. brunnea does not have truncated MAT1-1-1 (dMAT1-1-1) fragments in the MAT1-2 locus, while this dMAT1-1-1 is conserved in other heterothallic fungi in the order Helotiales, which was presumed to be a trace of evolution from the homothallic MAT1 locus to the heterothallic locus [27]. In addition, we found a transposon component, an RNaseH gene (RA), in the MAT1-1 loci of most MbMu isolates. RA was not included in the idiomorph region, because the sequence between MAT1-1-1 and RA was conserved in the MAT1-2 locus. However, we also found that there was no RA sequence in the MAT1-2 loci of all MbMu isolates, reflecting the expansion of the range of recombination suppression beyond the MAT idiomorph region in MbMu.

5. Conclusions

In conclusion, we confirmed that MbMu and MbMo are genetically distinct populations at the population genome level. We found a wide range of functional variants, high-frequency recombination, and heterothallic mating systems in MbMu, implying that MbMu is able to efficiently create new genotypes through outcrossing. Considering that there are extensive plantations of Aigeiros poplars in China, which consist of a small number of MbMu resistant clones, the evolution of the MbMu population to overcome resistance is likely to be an important risk.

Author Contributions

Conceptualization, Q.C.; sampling, Q.C., H.Y., J.C., L.Z.; writing—original draft preparation, Q.C.; funding acquisition, Q.C. All authors have read and agreed to the published version of the manuscript.

Funding

This research was funded by the National Natural Science Foundation of China, grant number 31870658 and 31570639.

Institutional Review Board Statement

Not applicable.

Informed Consent Statement

Not applicable.

Data Availability Statement

Clean reads were deposited in the NCBI Sequence Read Archive under BioProject ID PRJNA825296. The assembly of Ptom1 was deposited in GenBank under the accession number GCA_011750725.1. All other assemblies were deposited in CoGe database (https://genomevolution.org/coge/) under the genome ID 63935 (Pcan1), 63936 (Pcan2), 63937 (Pcan3), 63938 (Pcan4), 63939 (Pcan5), 63944 (Pcan6), 63945 (Pcan7), 63946 (Pcan8), 63947 (Pcan9), 63948 (Pcan10), 63949 (Pcan11), 63950 (Pcan12), 63951 (Pcan13), 63952 (Pcan14), 63953 (Pcan15), 63954 (Pcan16), 63955 (Pcan17), 63956 (Pcan18), 63957 (Pcan19), 63958 (Pcan20), 63959 (Pcan21), 63960 (Pcan22), 63961 (Peur1), 63962 (Peur2), 63963 (Peur3), 63964 (Peur4), 63965 (Psim1), 63966 (Psim2), 63967 (Psim3), 63968 (Psim4), 63969 (Psim5), 63970 (Psim6), 63971 (Ptom2) and 63972 (Ptom3). The sequences of MAT loci were deposited in GenBank under the accession numbers ON556642 (Peur4), ON556643 (Pcan3), ON556644 (Pcan7), ON556645 (Ptom1) and ON556646 (Ptom5).

Conflicts of Interest

The authors declare no conflict of interest.

References

  1. Spiers, A.G.; Wenham, H.T. Poplar seed-transmission of Marssonina brunnea. Eur. J. For. Pathol. 1983, 13, 305–314. [Google Scholar] [CrossRef]
  2. Ellis, J.; Everhart, B. New and rare species of North American fungi (Sphœropsideœ). J. Mycol. 1889, 5, 145–157. [Google Scholar] [CrossRef]
  3. Gennaro, M.; Giorcelli, A. The biotic adversities of poplar in Italy: A reasoned analysis of factors determining the current state and future perspectives. Ann. Silvic. Res. 2019, 43, 41–51. [Google Scholar]
  4. Han, Z.M.; Yin, T.M.; Li, C.D.; Huang, M.R.; Wu, R.L. Host effect on genetic variation of Marssonina brunnea pathogenic to poplars. Theor. Appl. Genet. 2000, 100, 614–620. [Google Scholar] [CrossRef]
  5. Spiers, A.G. Comparative studies of host specificity and symptoms exhibited by poplars infected with Marssonina brunnea, Marssonina castagnei and Marssonina populi. Eur. J. For. Pathol. 1984, 14, 202–218. [Google Scholar] [CrossRef]
  6. Jiang, H.R.; Wan, Z.B.; Liu, M.; Hou, J.; Yin, T.M. Mapping quantitative trait loci conferring resistance to Marssonina leaf spot disease in Populus deltoides. Trees 2019, 33, 697–706. [Google Scholar] [CrossRef]
  7. Spiers, A.G.; Hopcroft, D.H. Studies of microconidia of Marssonina brunnea and apothecia of Drepanopeziza tremulae. Eur. J. For. Pathol. 1986, 16, 65–82. [Google Scholar] [CrossRef]
  8. Wilken, P.M.; Steenkamp, E.T.; Wingfield, M.J.; De Beer, Z.W.; Wingfield, B.D. Which MAT gene? Pezizomycotina (Ascomycota) mating-type gene nomenclature reconsidered. Fungal Biol. Rev. 2017, 31, 199–211. [Google Scholar] [CrossRef] [Green Version]
  9. Zhu, S.; Cao, Y.Z.; Jiang, C.; Tan, B.Y.; Wang, Z.; Feng, S.; Zhang, L.; Su, X.H.; Brejova, B.; Vinar, T.; et al. Sequencing the genome of Marssonina brunnea reveals fungus-poplar co-evolution. BMC Genom. 2012, 13, 382. [Google Scholar] [CrossRef] [Green Version]
  10. Li, H.; Durbin, R. Fast and accurate short read alignment with Burrows-Wheeler transform. Bioinformatics 2009, 25, 1754–1760. [Google Scholar] [CrossRef] [Green Version]
  11. Li, H.; Handsaker, B.; Wysoker, A.; Fennell, T.; Ruan, J.; Homer, N.; Marth, G.; Abecasis, G.; Durbin, R. The Sequence Alignment/Map format and SAMtools. Bioinformatics 2009, 25, 2078–2079. [Google Scholar] [CrossRef] [PubMed] [Green Version]
  12. McKenna, A.; Hanna, M.; Banks, E.; Sivachenko, A.; Cibulskis, K.; Kernytsky, A.; Garimella, K.; Altshuler, D.; Gabriel, S.; Daly, M.; et al. The Genome Analysis Toolkit: A MapReduce framework for analyzing next-generation DNA sequencing data. Genome Res. 2010, 20, 1297–1303. [Google Scholar] [CrossRef] [PubMed] [Green Version]
  13. Rozas, J.; Ferrer-Mata, A.; Sanchez-DelBarrio, J.C.; Guirao-Rico, S.; Librado, P.; Ramos-Onsins, S.E.; Sanchez-Gracia, A. DnaSP 6: DNA Sequence Polymorphism Analysis of Large Data Sets. Mol. Biol. Evol. 2017, 34, 3299–3302. [Google Scholar] [CrossRef]
  14. Cingolani, P.; Platts, A.; Wang, L.L.; Coon, M.; Nguyen, T.; Wang, L.; Land, S.J.; Lu, X.; Ruden, D.M. A program for annotating and predicting the effects of single nucleotide polymorphisms, SnpEff: SNPs in the genome of Drosophila melanogaster strain w1118; iso-2; iso-3. Fly 2012, 6, 80–92. [Google Scholar] [CrossRef] [PubMed] [Green Version]
  15. Raj, A.; Stephens, M.; Pritchard, J.K. fastSTRUCTURE: Variational inference of population structure in large SNP data sets. Genetics 2014, 197, 573–589. [Google Scholar] [CrossRef] [PubMed] [Green Version]
  16. Alexander, D.H.; Novembre, J.; Lange, K. Fast model-based estimation of ancestry in unrelated individuals. Genome Res. 2009, 19, 1655–1664. [Google Scholar] [CrossRef] [Green Version]
  17. Kamvar, Z.N.; Tabima, J.F.; Grunwald, N.J. Poppr: An R package for genetic analysis of populations with clonal, partially clonal, and/or sexual reproduction. PeerJ 2014, 2, e281. [Google Scholar] [CrossRef] [Green Version]
  18. Huson, D.H.; Bryant, D. Application of phylogenetic networks in evolutionary studies. Mol. Biol. Evol. 2006, 23, 254–267. [Google Scholar] [CrossRef]
  19. Kumar, S.; Stecher, G.; Tamura, K. MEGA7: Molecular Evolutionary Genetics Analysis Version 7.0 for Bigger Datasets. Mol. Biol. Evol. 2016, 33, 1870–1874. [Google Scholar] [CrossRef] [Green Version]
  20. Zhang, C.; Dong, S.S.; Xu, J.Y.; He, W.M.; Yang, T.L. PopLDdecay: A fast and effective tool for linkage disequilibrium decay analysis based on variant call format files. Bioinformatics 2019, 35, 1786–1788. [Google Scholar] [CrossRef]
  21. Luo, R.B.; Liu, B.H.; Xie, Y.L.; Li, Z.Y.; Huang, W.H.; Yuan, J.Y.; He, G.Z.; Chen, Y.X.; Pan, Q.; Liu, Y.J.; et al. SOAPdenovo2: An empirically improved memory-efficient short-read de novo assembler. GigaScience 2012, 1, 18. [Google Scholar] [CrossRef] [PubMed]
  22. Waterhouse, R.M.; Seppey, M.; Simão, F.A.; Manni, M.; Ioannidis, P.; Klioutchnikov, G.; Kriventseva, E.V.; Zdobnov, E.M. BUSCO applications from quality assessments to gene prediction and phylogenomics. Mol. Biol. Evol. 2018, 35, 543–548. [Google Scholar] [CrossRef] [PubMed] [Green Version]
  23. Nieuwenhuis, B.P.; James, T.Y. The frequency of sex in fungi. Philos. Trans. R. Soc. Lond. B Biol. Sci. 2016, 371, 20150540. [Google Scholar] [CrossRef] [PubMed] [Green Version]
  24. Hartmann, F.E.; Duhamel, M.; Carpentier, F.; Hood, M.E.; Foulongne-Oriol, M.; Silar, P.; Malagnac, F.; Grognet, P.; Giraud, T. Recombination suppression and evolutionary strata around mating-type loci in fungi: Documenting patterns and understanding evolutionary and mechanistic causes. New Phytol. 2021, 229, 2470–2491. [Google Scholar] [CrossRef] [PubMed]
  25. Abate, D.; De Miccolis Angelini, R.M.; Rotolo, C.; Pollastro, S.; Faretra, F. Mating System in the Brown Rot Pathogens Monilinia fructicola, M. laxa, and M. fructigena. Phytopathology 2018, 108, 1315–1325. [Google Scholar] [CrossRef] [PubMed] [Green Version]
  26. Wey, T.; Schlegel, M.; Stroheker, S.; Gross, A. MAT--gene structure and mating behavior of Hymenoscyphus fraxineus and Hymenoscyphus albidus. Fungal Genet. Biol. 2016, 87, 54–63. [Google Scholar] [CrossRef]
  27. Amselem, J.; Cuomo, C.A.; van Kan, J.A.; Viaud, M.; Benito, E.P.; Couloux, A.; Coutinho, P.M.; de Vries, R.P.; Dyer, P.S.; Fillinger, S.; et al. Genomic analysis of the necrotrophic fungal pathogens Sclerotinia sclerotiorum and Botrytis cinerea. PLoS Genet. 2011, 7, e1002230. [Google Scholar] [CrossRef] [Green Version]
  28. Chitrampalam, P.; Pryor, B.M. Characterization of mating type (MAT) alleles differentiated by a natural inversion in Sclerotinia minor. Plant Pathol. 2015, 64, 911–920. [Google Scholar] [CrossRef]
  29. Robicheau, B.M.; Bunbury-Blanchette, A.L.; LaButti, K.; Grigoriev, I.V.; Walker, A.K. The homothallic mating-type locus of the conifer needle endophyte Phialocephala scopiformis DAOMC 229536 (order Helotiales). Fungal Biol. 2017, 121, 1011–1024. [Google Scholar] [CrossRef]
  30. Penselin, D.; Munsterkotter, M.; Kirsten, S.; Felder, M.; Taudien, S.; Platzer, M.; Ashelford, K.; Paskiewicz, K.H.; Harrison, R.J.; Hughes, D.J.; et al. Comparative genomics to explore phylogenetic relationship, cryptic sexual potential and host specificity of Rhynchosporium species on grasses. BMC Genom. 2016, 17, 953. [Google Scholar] [CrossRef] [Green Version]
  31. Cheng, Q.; Chen, J.X.; Zhao, L.J. Draft genome sequence of Marssonina coronaria, causal agent of apple blotch, and comparisons with the Marssonina brunnea and Marssonina rosae genomes. PLoS ONE 2021, 16, e0246666. [Google Scholar] [CrossRef] [PubMed]
Figure 1. Phylogenetic analysis of 35 M. brunnea isolates. The UPGMA tree was inferred by Poppr with 1000 bootstrap replicates. Different isolation experiments are labeled in different colors. Pcan, P. canadensis of sect. Aigeiros; Peur, P. × euramericana cv. I214 of sect. Aigeiros; Psim, P. simonii of sect. Tacamahaca; Ptom, P. tomentosa of sect. Leuce; Nanjing, 118°77′ E, 32°04′ N; Yan’an, 109°28′ E, 36°36′ N; Qiannan, 107°47′ E, 27°07′ N; Singleton a, singletons identified in the SNP dataset of 35 isolates; Singleton b, singletons identified in the SNP dataset of 19 nonredundant isolates; Asterisk, 19 nonredundant isolates; and mating-type, a single MAT locus identified in genome assembly of each isolate. Clades (A, B, C, and D), redundant clones.
Jof 08 00579 g001
Figure 2. Population structure analysis of M. brunnea isolates. (A) Structure plot inferred by fastSTRUCTURE with the SNP dataset of 19 nonredundant M. brunnea isolates. K = 2. y-axis quantifies cluster memberships. (B) PCA of 19 nonredundant M. brunnea isolates. (C,D) PCA of 16 nonredundant MbMu isolates. The color of the circle corresponds to the hosts (C) and sampling locations (D). (E,F) MSN plots of 16 nonredundant MbMu isolates. The color of the circle corresponds to the hosts (E) and sampling locations (F). (G) Cross-validation (CV) error (y-axis) for K between 1 and 10. The estimation was generated by ADMIXTURE software.
Jof 08 00579 g002
Figure 3. Recombination in the MbMu population. (A) Neighbor-net phylogenetic network of the 16 nonredundant MbMu isolates. Lower panel, local enlargement. (B) LD decay in MbMu. The squared correlation coefficient (r2) between pairs of SNP loci was plotted against the physical distance along the genome. Lower panel, local enlargement.
Jof 08 00579 g003
Figure 4. The MAT loci of M. brunnea. (A) Structures of the MAT1-1 and MAT1-2 loci of MbMu. Solid boxes represent the coding regions of the predicted genes interrupted by introns. Black arrows indicate the orientations of the coding sequences. Dotted lines mark the sizes of the unique sequences of the idiomorphs. (B) A simple diagram of MAT1-1 loci of 11 MbMu isolates. The correspondence of box colors and predicted genes are consistent with that seen in (A). The interruption of the solid line represents the gap in the assembly. (C) Structures of the MAT1-1 and MAT1-2 loci of MbMo. Triangles represent primers used to clone MAT1-1 of MbMo. Purple triangle, primers designed based on MAT1-1 sequence of MbMu; red triangle, primers designed based on MAT1-1 sequence of MbMo. (D) Phylogenetic tree constructed with MAT1-2 idiomorph sequences. The tree was constructed using the maximum likelihood method and tested with 1000 bootstrap replicates.
Jof 08 00579 g004
Table 1. M. brunnea isolates sampled in this study and associated data.
Isolate aSampling
Experiment b
Clean Data (Gb)Assembly (Mb)Genome CoverageAverage Read DepthSNP cSNP dSNP e
Peur1 *12.3635.5295.51%32.9742,31440,63399,752
Peur2 *12.6636.0695.64%38.1439,39038,06688,244
Peur3 *13.1235.7996.82%44.0542,25240,76693,741
Peur4 *12.2836.0196.37%33.4839,15737,69888,639
Pcan1 *22.0433.892.65%32.6142,50140,96194,116
Pcan222.7936.1896.58%39.0642,438
Pcan322.3435.0693.59%36.1542,455
Pcan4 *23.2635.7493.69%47.2740,18238,82991,156
Pcan532.5636.8693.83%40.6238,552
Pcan632.7235.2292.97%41.4238,531
Pcan7 *32.0335.3496.24%3139,54838,05594,022
Pcan8 *32.1534.2388.99%35.8638,62237,17192,645
Pcan932.2834.9492.11%34.9238,558
Pcan10 *32.5636.1296.96%38.940,25638,84490,990
Pcan1132.0035.1893.17%31.238,551
Pcan1232.6435.7892.91%40.0538,563
Pcan13 *32.5635.8895.62%35.9238,97737,53990,490
Pcan1432.8535.9793.41%42.8738,540
Pcan1533.1736.0793.63%43.6638,550
Pcan16 *32.8336.597.55%38.3539,90238,40590,985
Pcan1732.5837.4493.35%37.6538,543
Pcan1832.0535.7993.25%30.1638,546
Pcan1932.0835.7593.52%30.838,546
Pcan2032.2235.7293.61%32.5838,547
Pcan2132.3235.9793.69%34.9538,551
Pcan22 *42.8636.0596.07%39.434,12032,94180,407
Psim1 *52.7036.3396.63%39.5242,37440,85793,843
Psim252.4335.0195.63%37.3542,376
Psim3 *53.0140.9997.87%35.4544,69243,14795,753
Psim4 *52.1935.8796.32%33.4641,27939,67194,038
Psim5 *52.0035.3192.77%31.540,95239,39994,477
Psim652.7836.1493.61%39.6244,683
Ptom1 *616.1850.8748.25%127.281,023,0421,023,392
Ptom3 *63.537.1647.38%30.881,023,0091,023,361
Ptom2 *63.8137.0647.49%31.461,022,8701,023,223
Total 1,139,8081,140,405430,649
a The asterisk represents nonredundant isolate. b 1, host: P. × euramericana cv. I214, year: 2015, location: Nanjing; 2, host: P. × canadensis, year: 2015, location: Nanjing; 3, host: P. × canadensis, year: 2018, location: Nanjing; 4, host: P. × canadensis, year: 2018, location: Qiannan; 5, host: P. simonii, year: 2017, location: Yan’an; 6, host: P. tomentosa, year: 2016, location: Nanjing. c SNP calling with 35 M. brunnea isolates. d SNP calling with nonredundant 19 M. brunnea isolates. e SNP calling with nonredundant 16 MbMu isolates.
Publisher’s Note: MDPI stays neutral with regard to jurisdictional claims in published maps and institutional affiliations.

