
Adaptive Response of Saccharomyces Hosts to Totiviridae L-A dsRNA Viruses Is Achieved through Intrinsically Balanced Action of Targeted Transcription Factors

 , , and
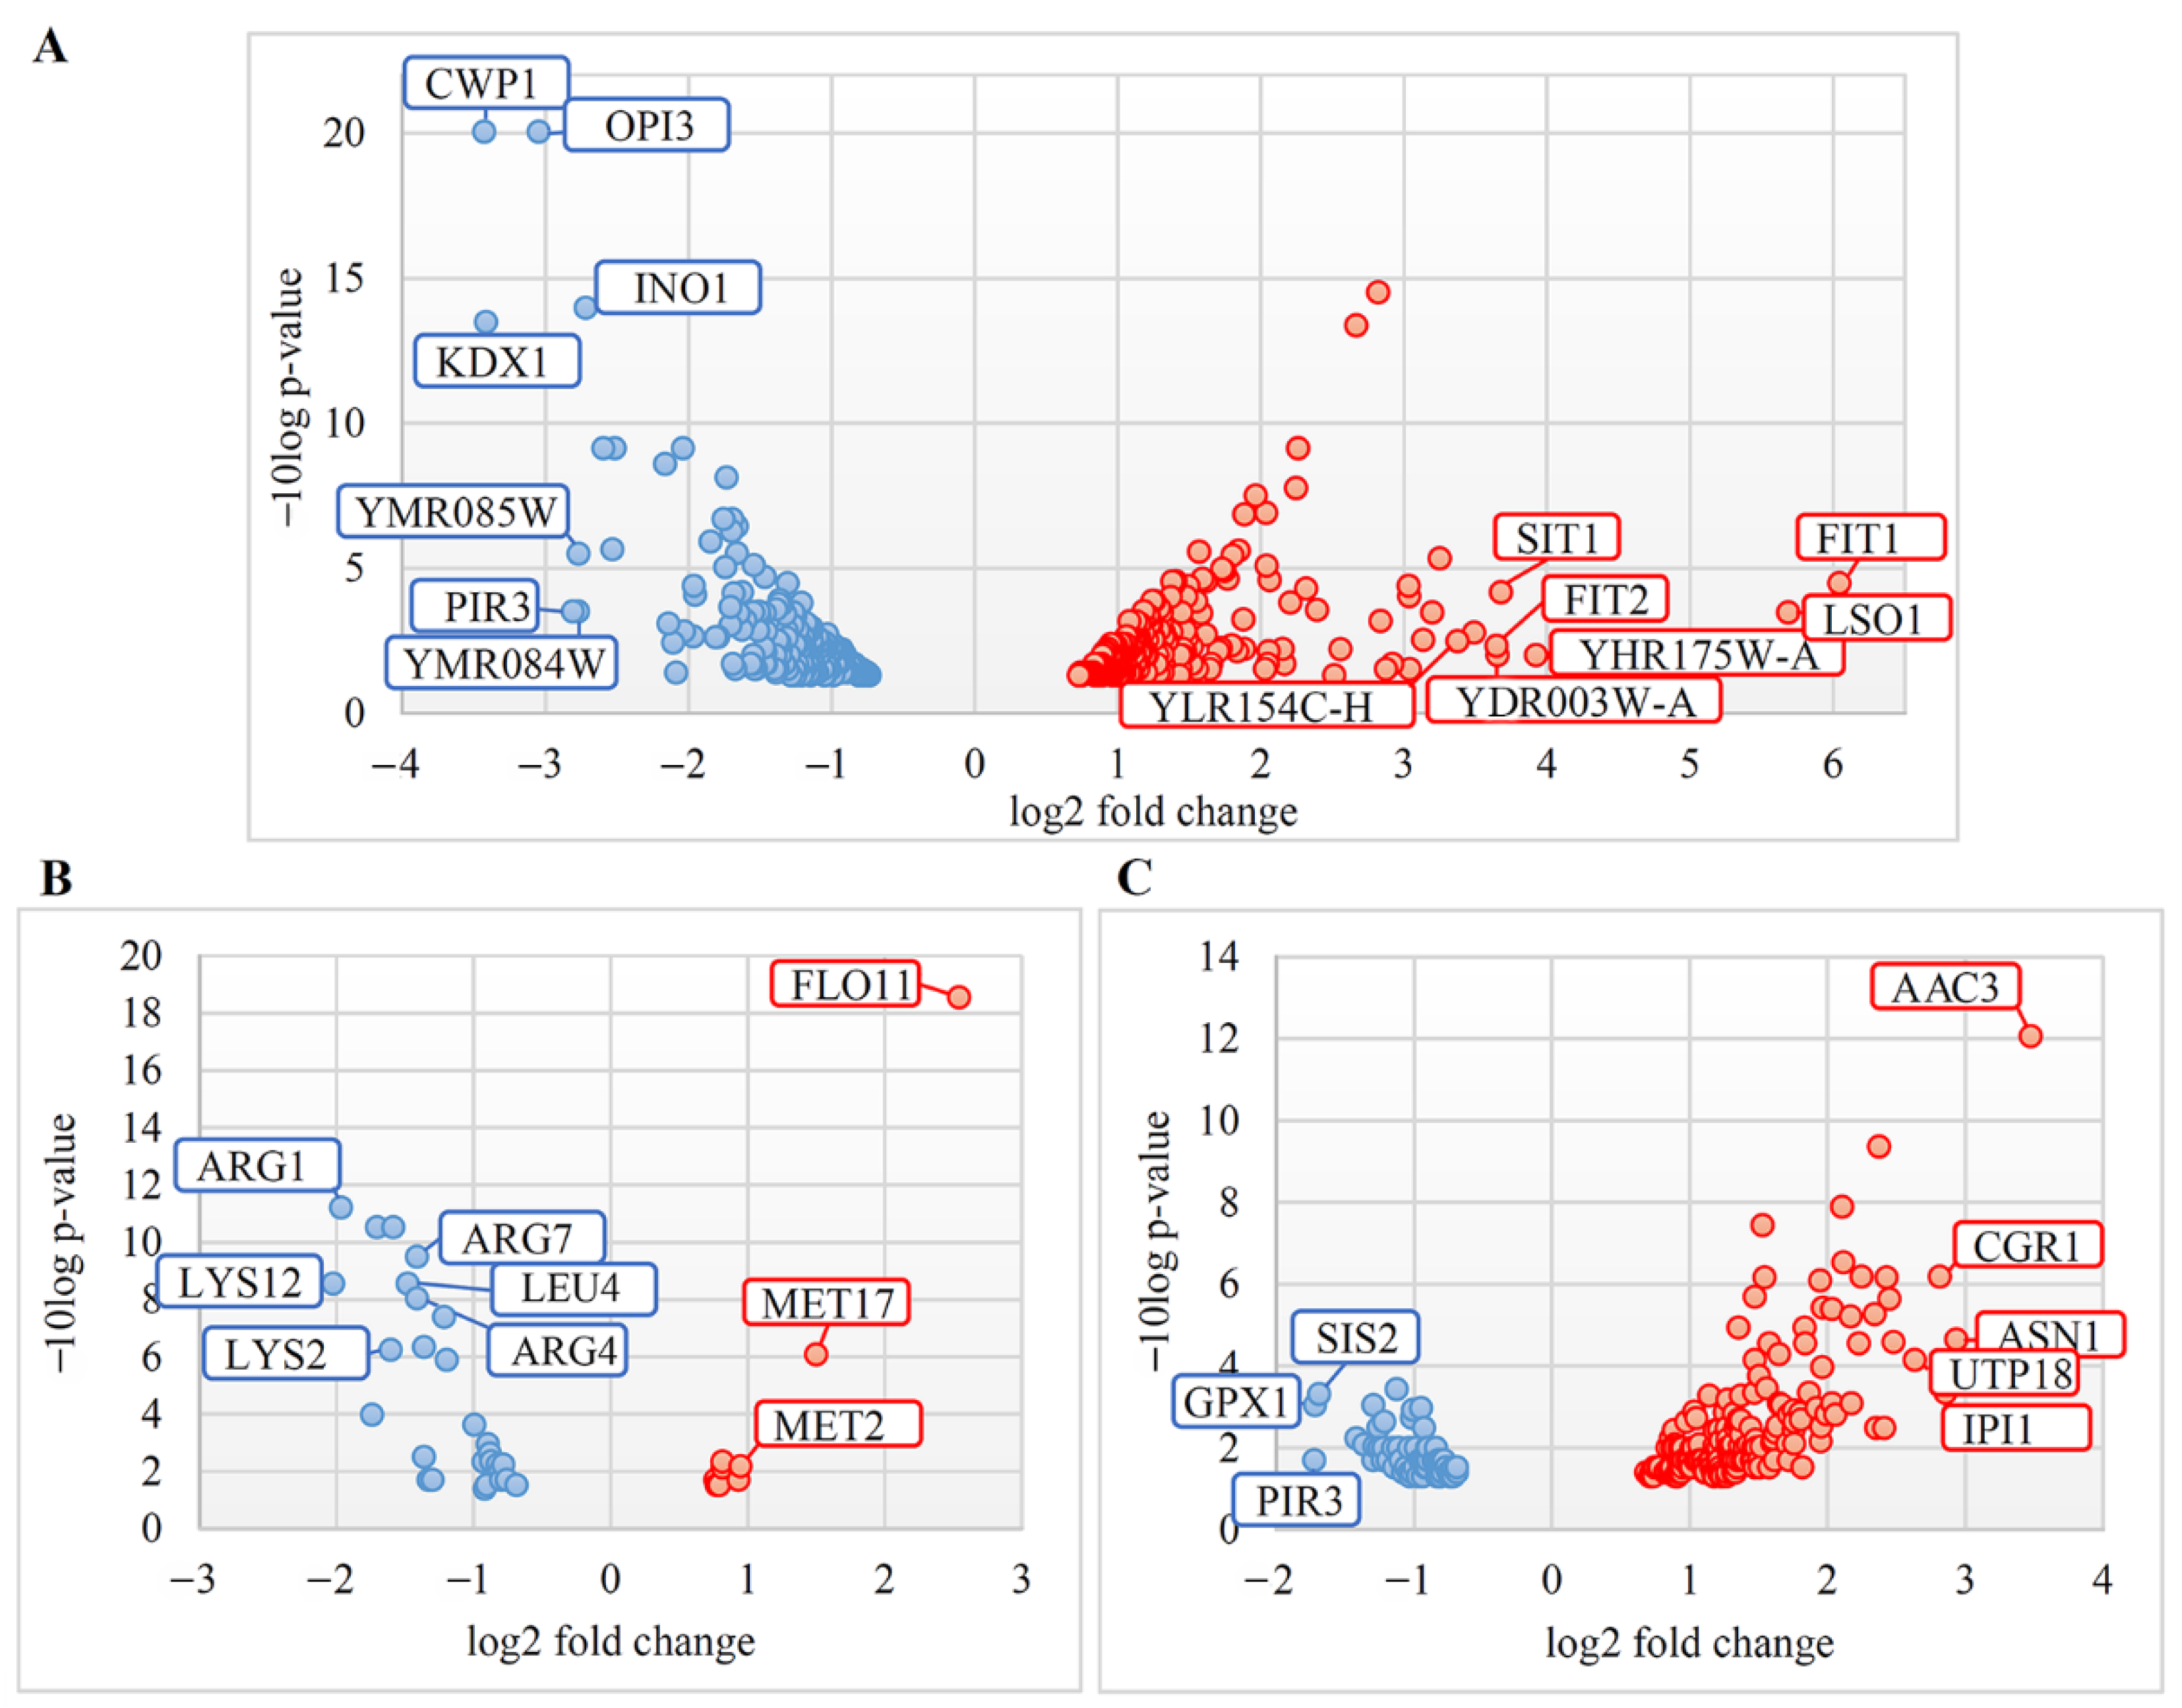
Abstract
:1. Introduction
2. Materials and Methods
2.1. Gene Expression Data
2.2. Identification of Differently Expressed Genes (DEGs)
2.3. GO Pathway Enrichment Analysis
2.4. Essential Genes
2.5. Determination of Transcriptional Regulators
2.6. Strains and Media
2.7. Total RNA Extraction and Evaluation of L-A dsRNA Content Changes
3. Results
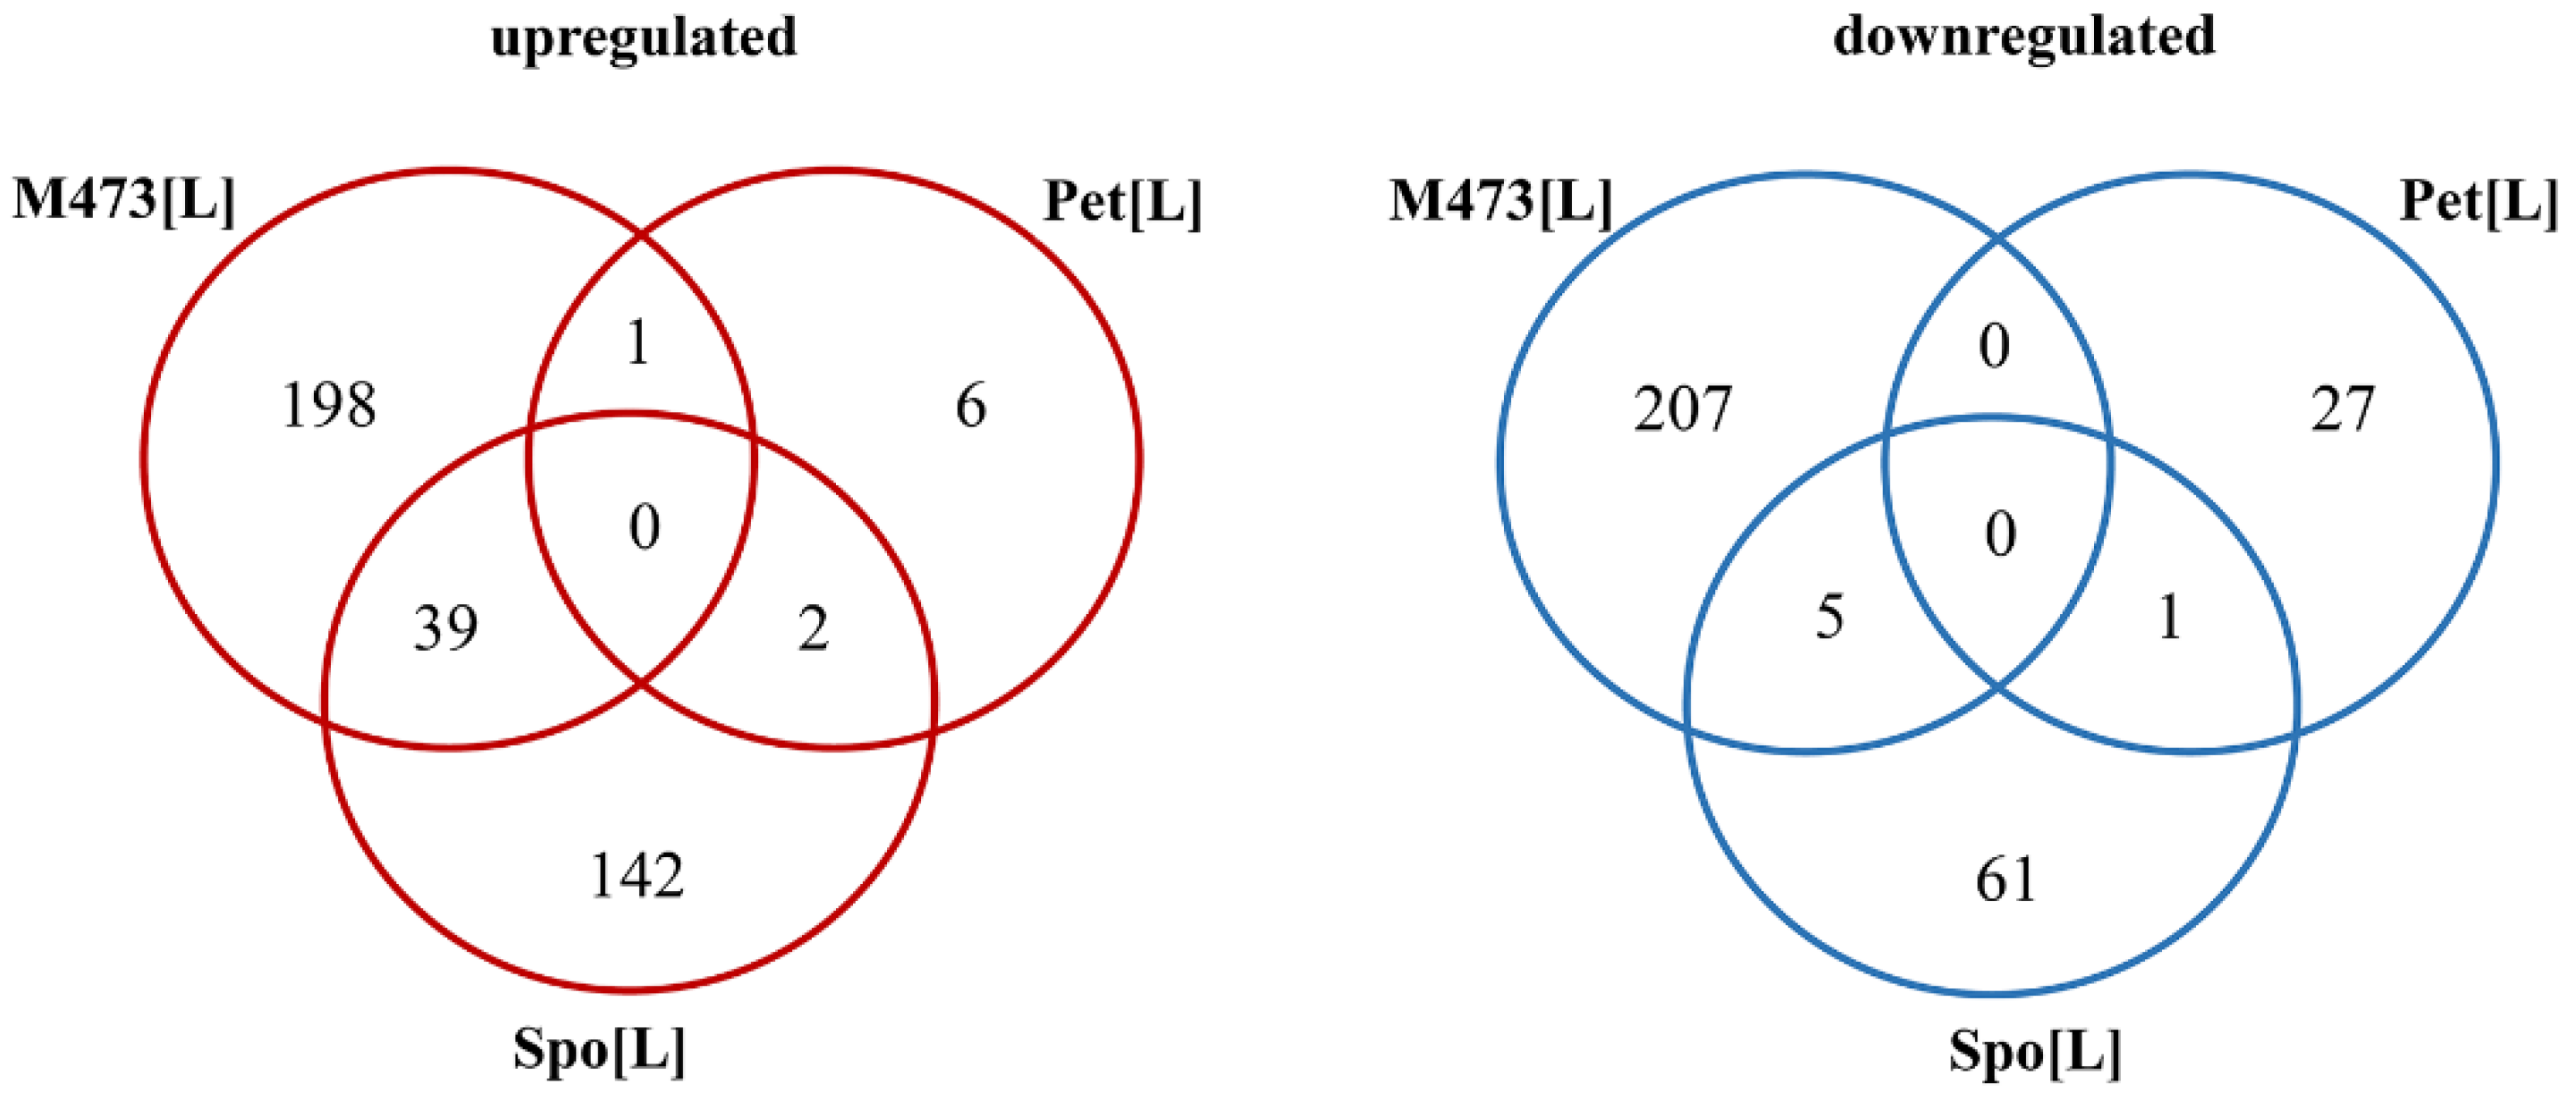
3.1. Transcriptional Response in L-A dsRNA Maintaining S. cerevisiae and S. paradoxus Cells
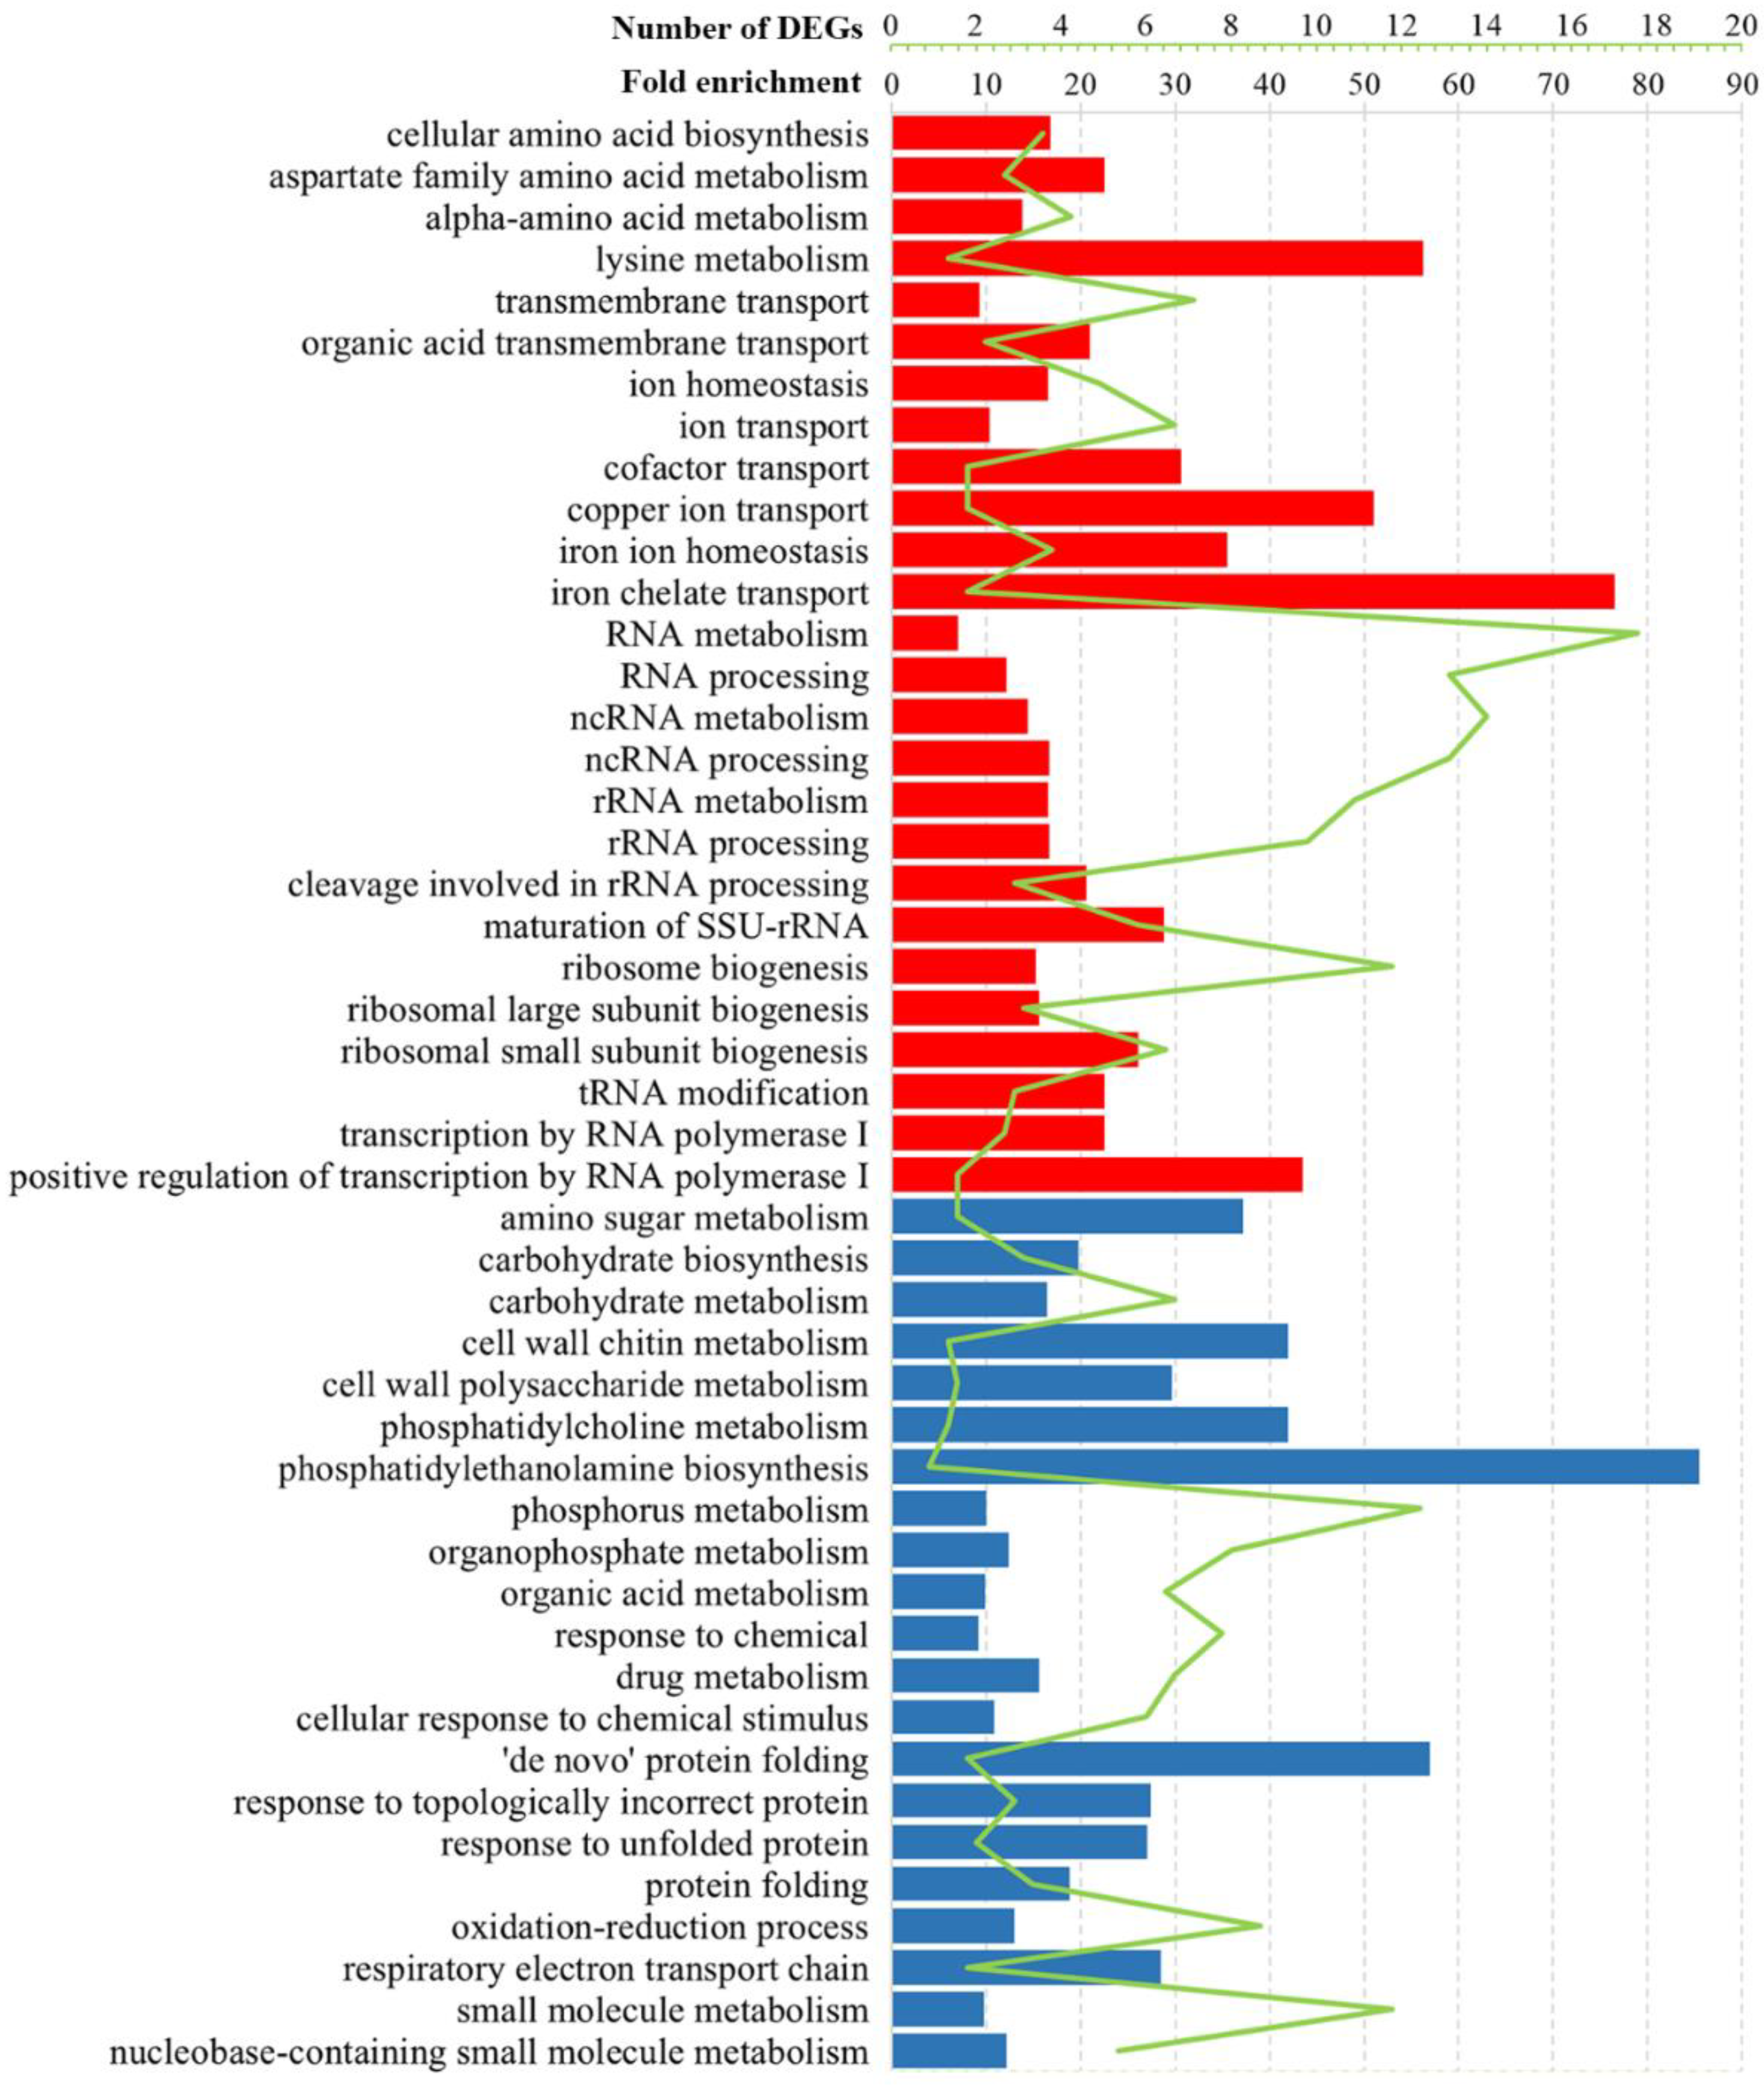
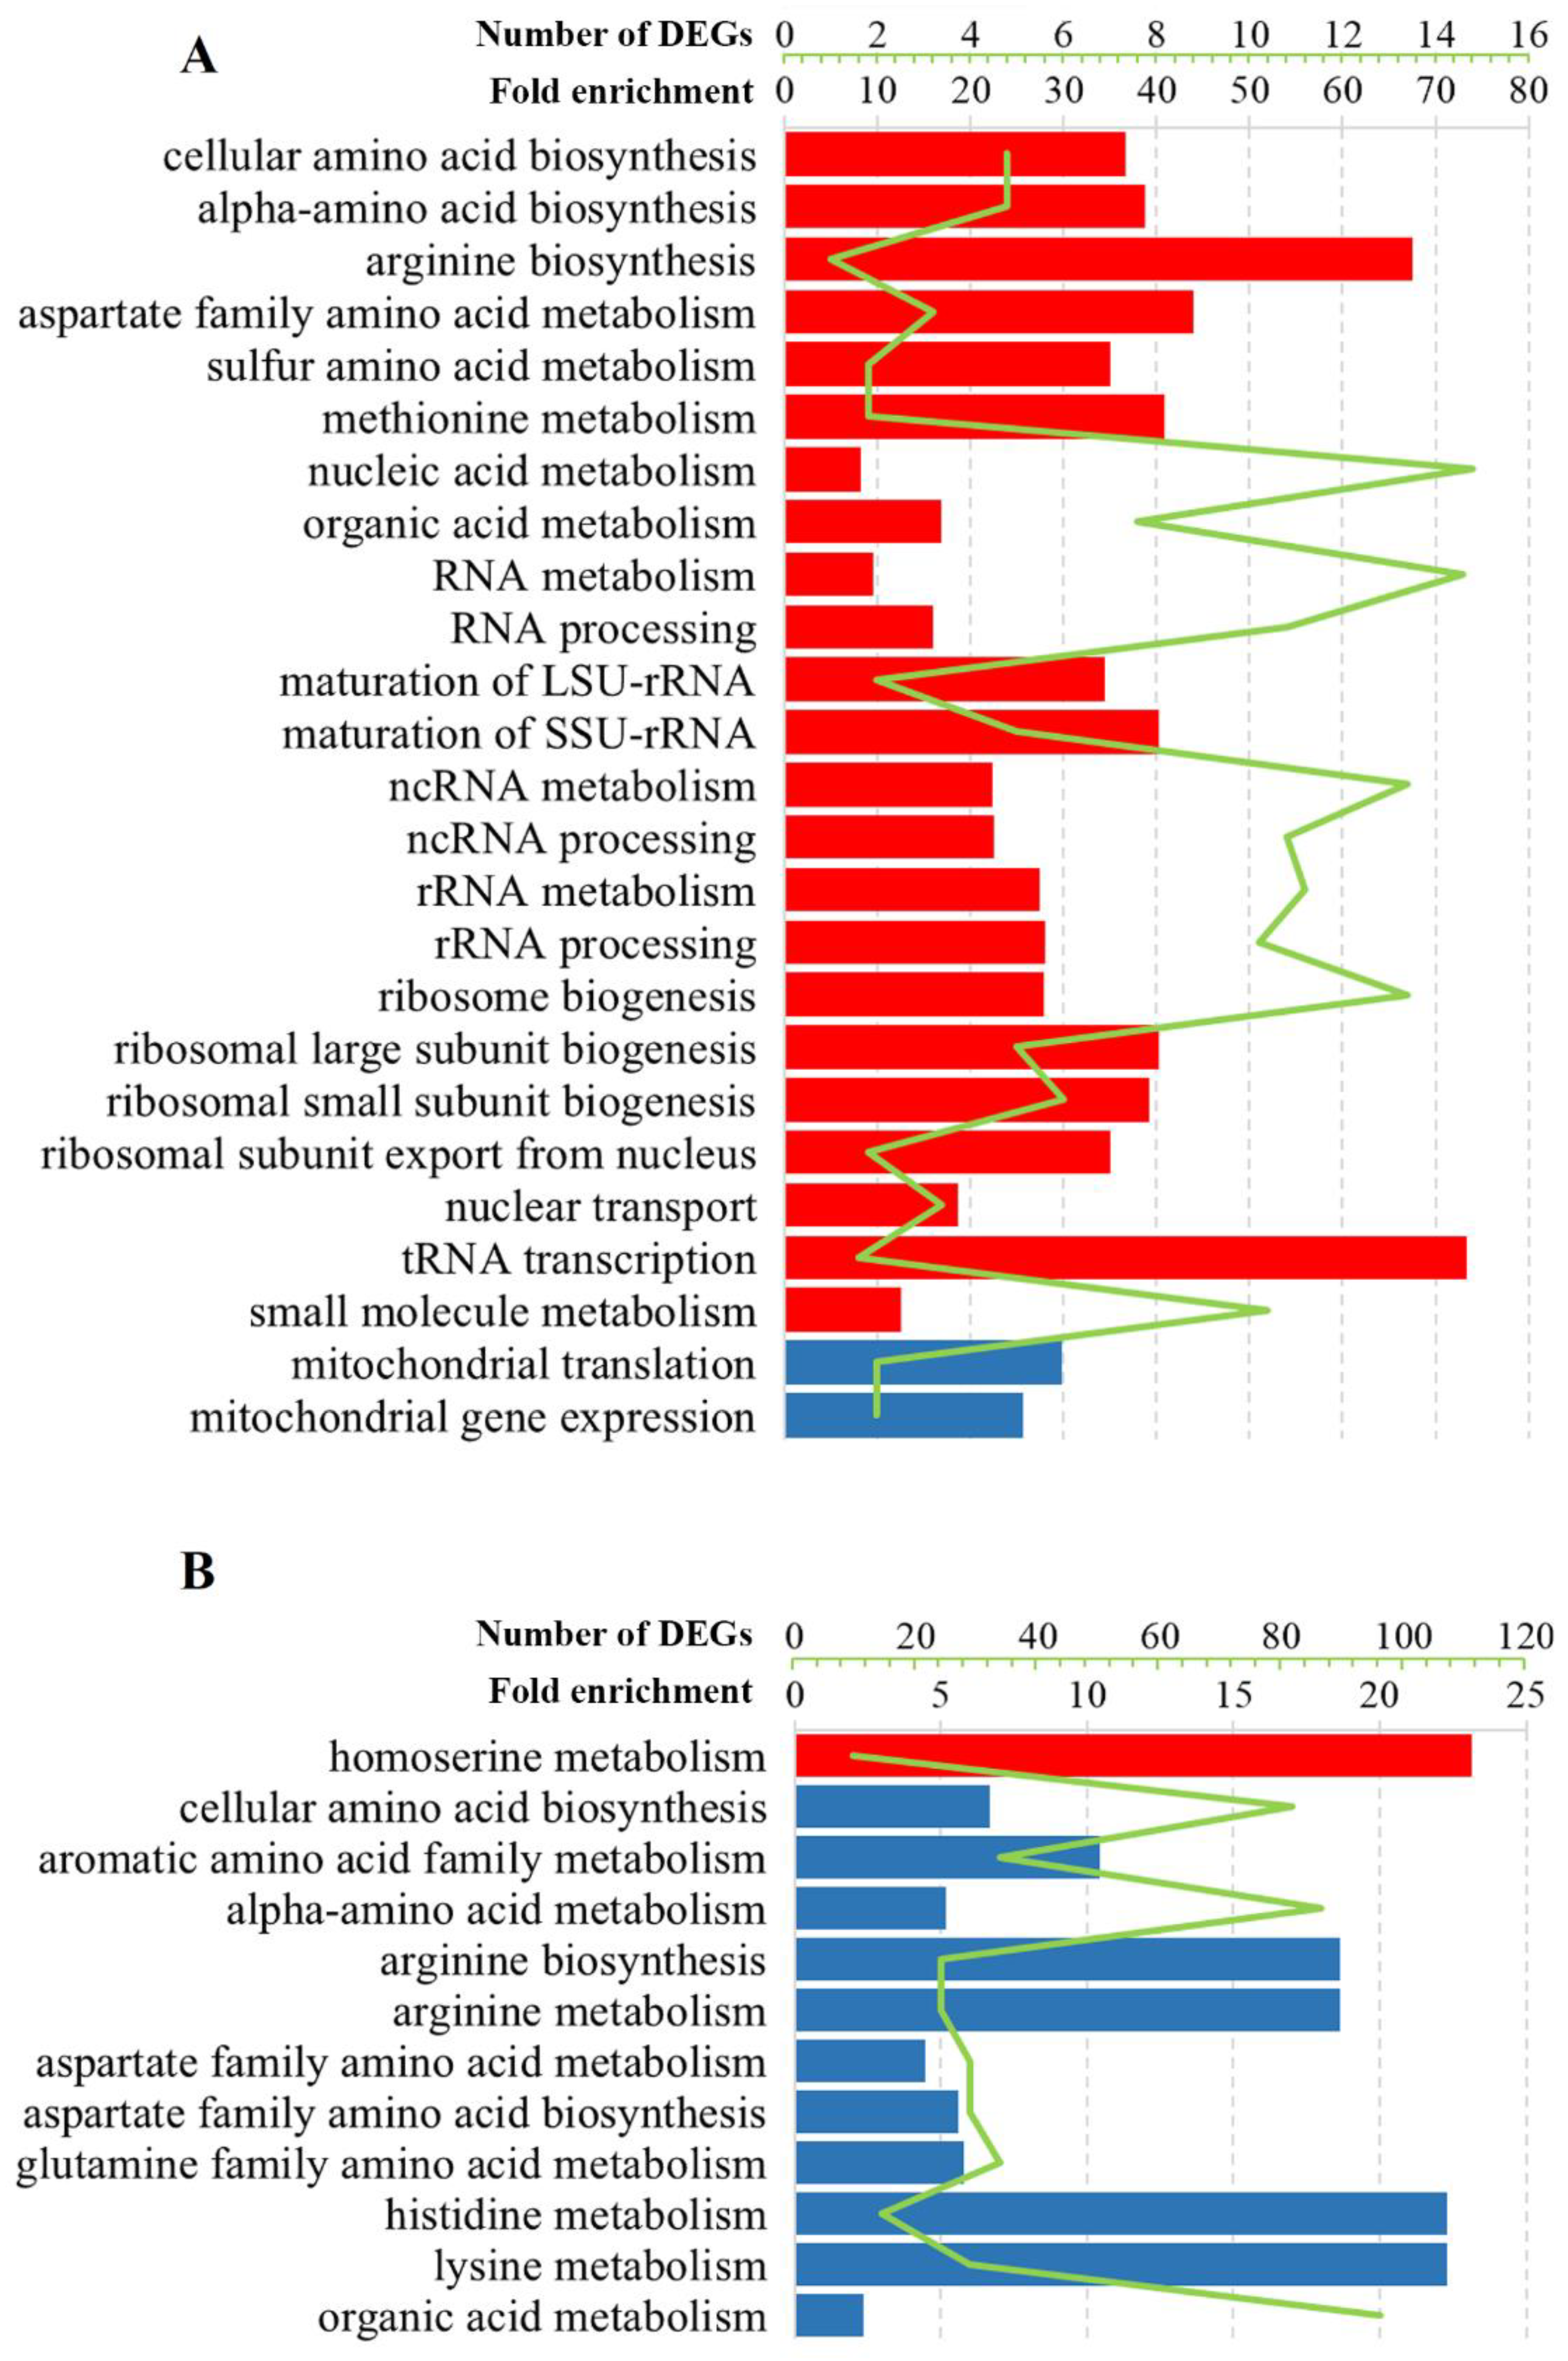
3.2. Gene Ontology Analysis of DEGs in Solely L-A dsRNA Maintaining Cells
3.3. Differently Expressed Essential Genes
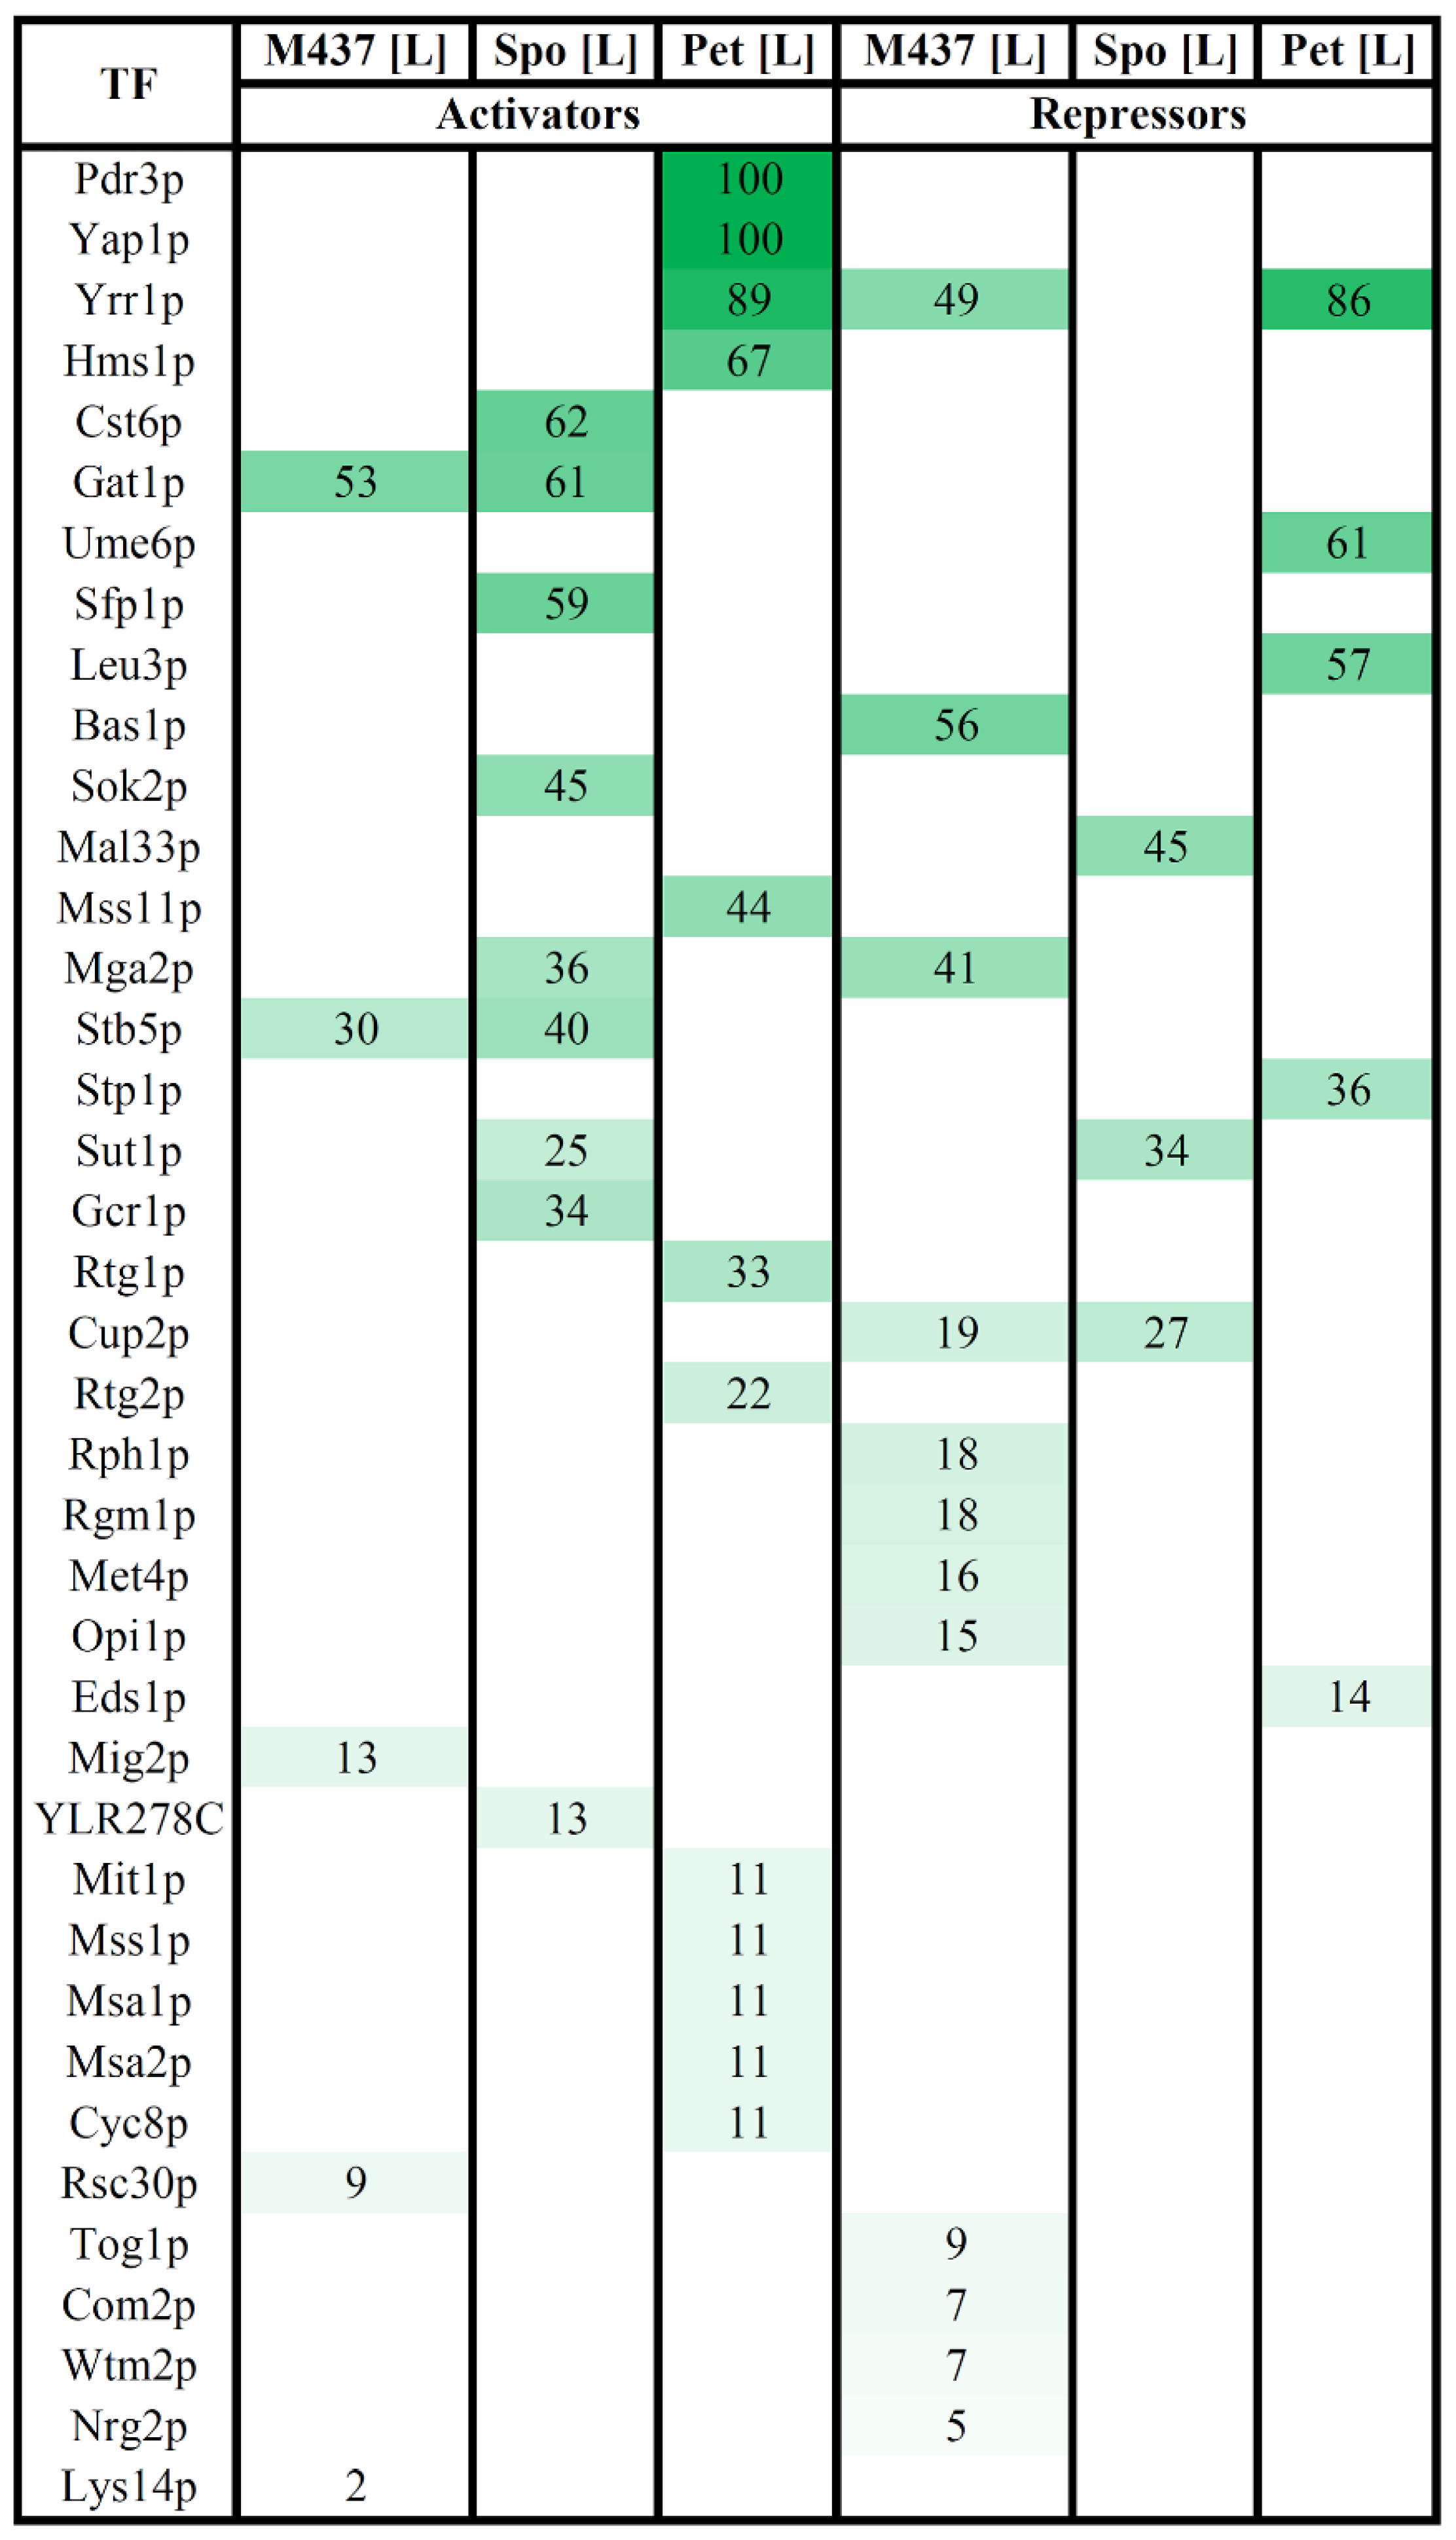
3.4. Transcription Factors Regulating DEGs in Solely L-A-Infected Cells
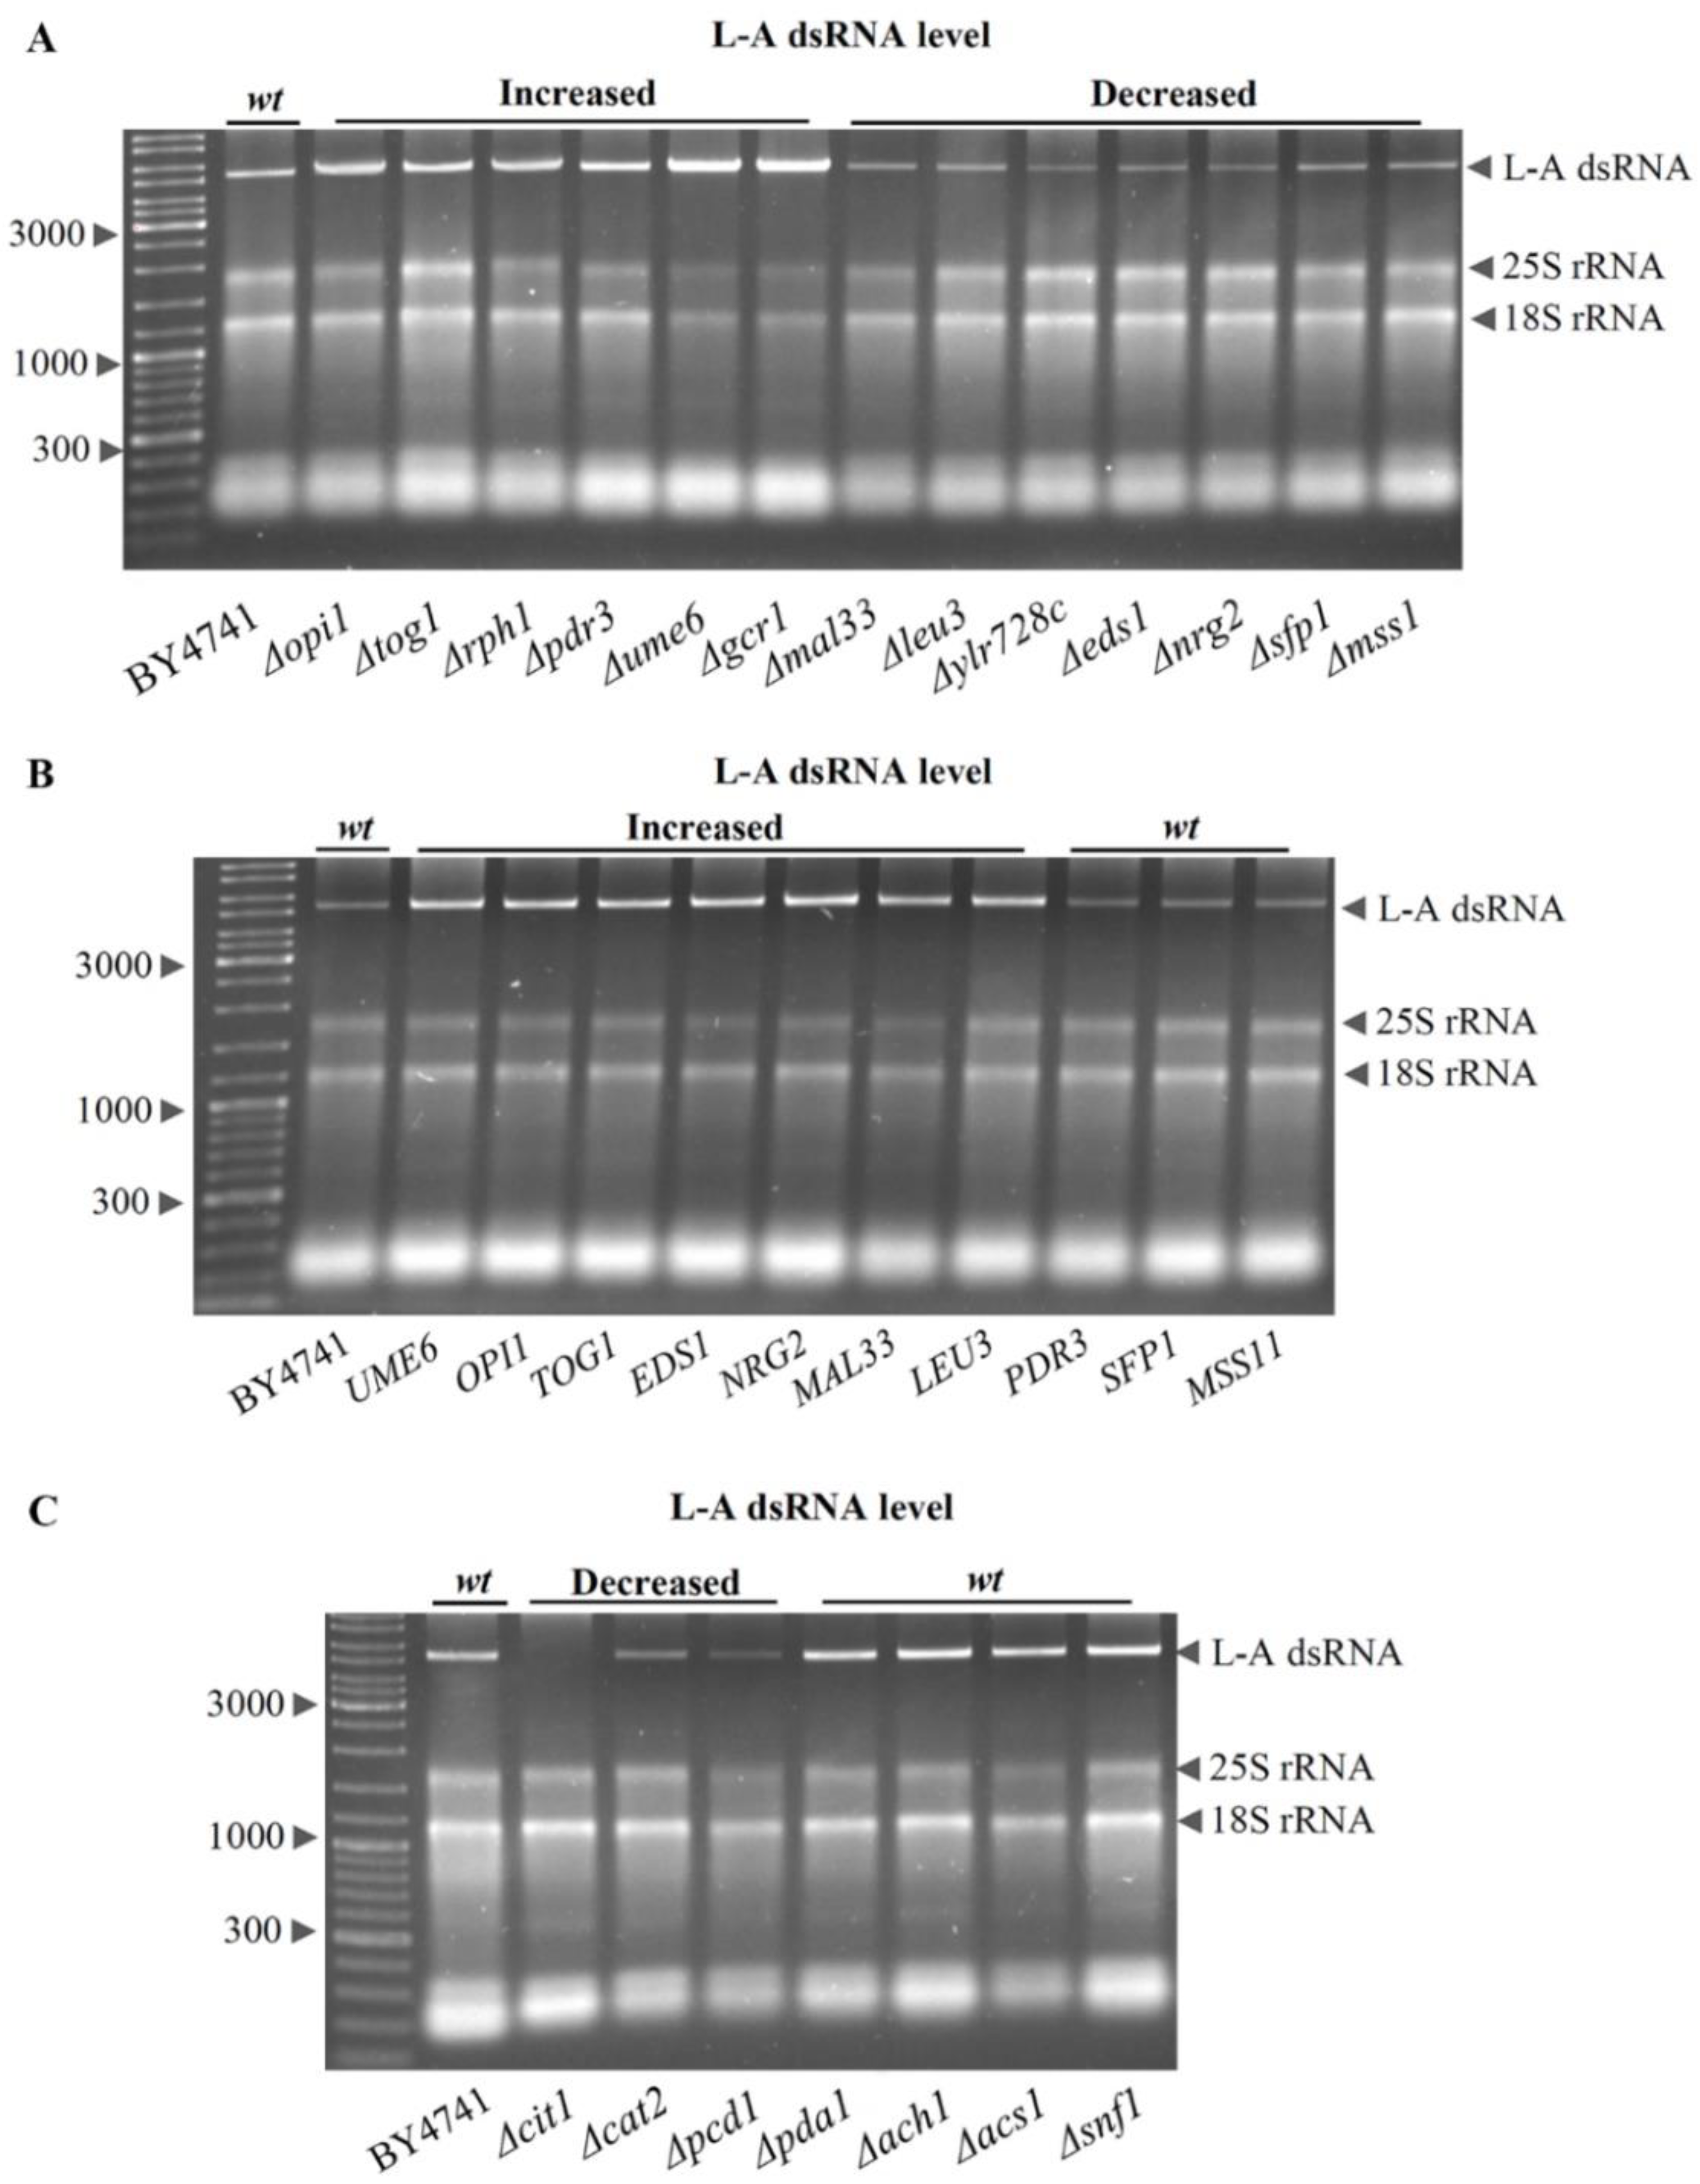
3.5. Role of Transcription Factors on Intracellular L-A dsRNA Content
4. Discussion
4.1. Gene Expression in Yeast Cells Maintaining Totiviridae L-A Virus
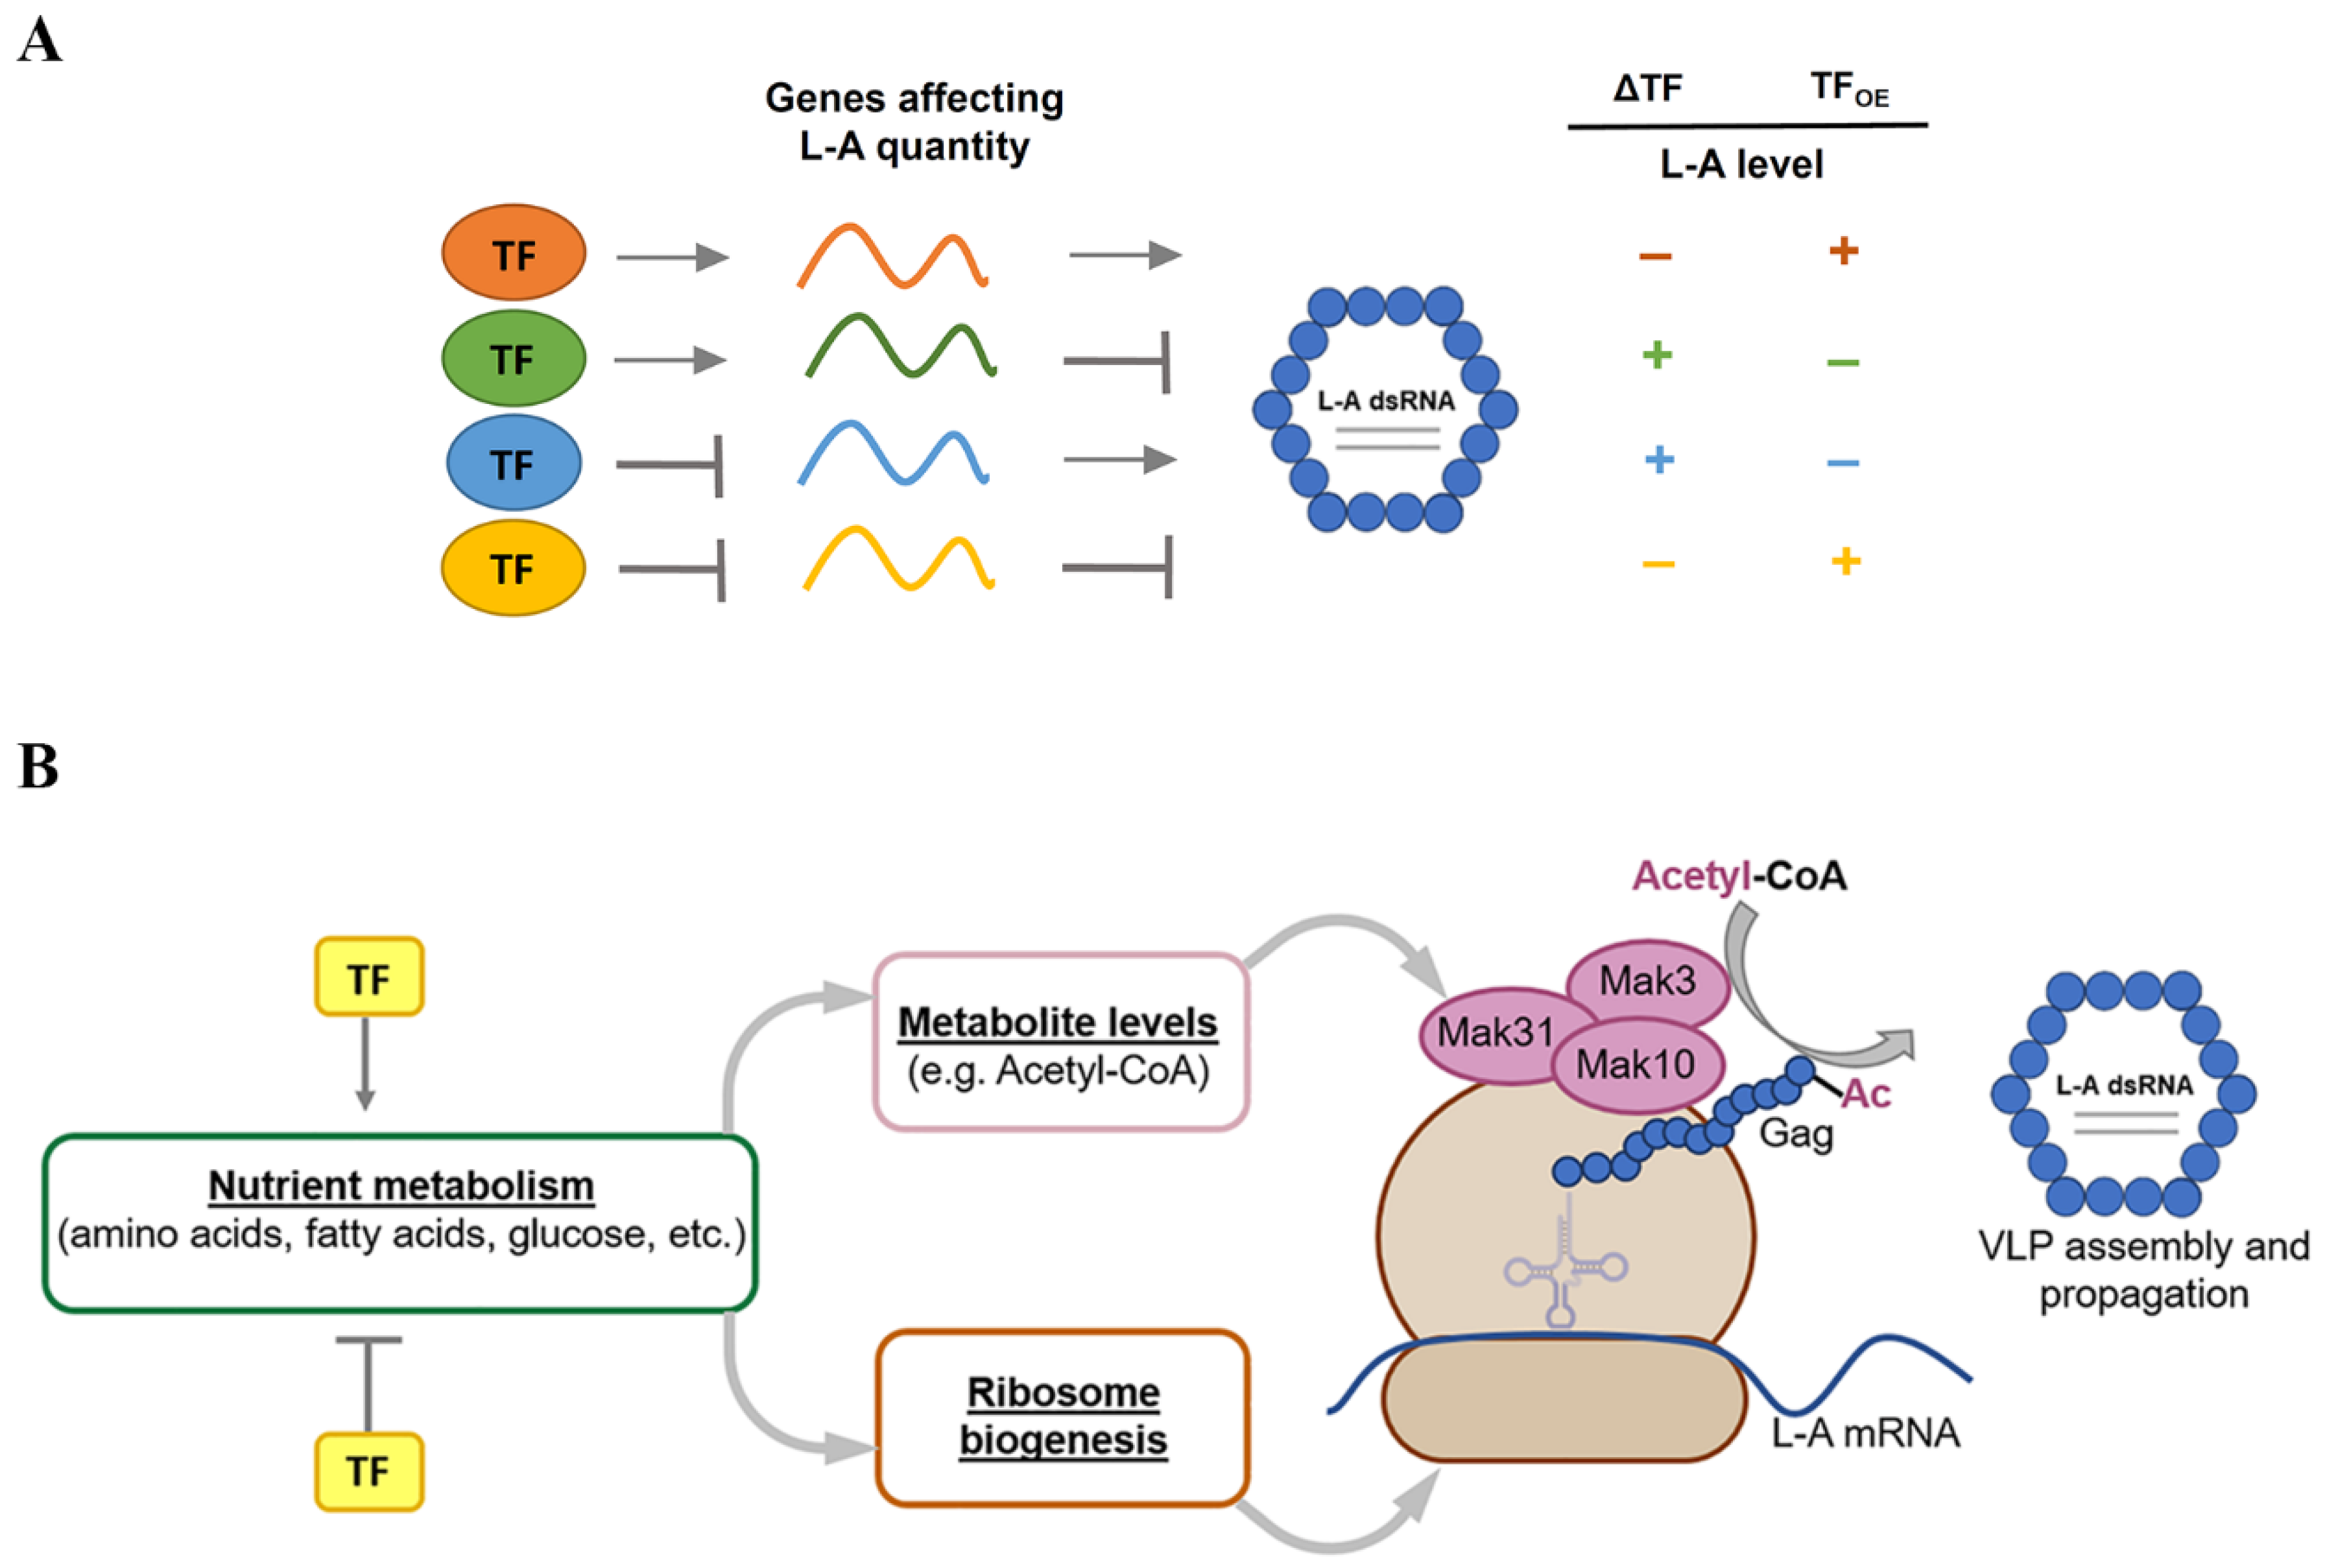
4.2. Interconnection between Transcription Factors and L-A dsRNA Levels
5. Conclusions
Supplementary Materials
Author Contributions
Funding
Institutional Review Board Statement
Informed Consent Statement
Data Availability Statement
Conflicts of Interest
References
- Schmitt, M.J.; Breinig, F. Yeast Viral Killer Toxins: Lethality and Self-Protection. Nat. Rev. Microbiol. 2006, 4, 212–221. [Google Scholar] [CrossRef] [PubMed]
- Vepštaitė-Monstavičė, I.; Lukša, J.; Konovalovas, A.; Ežerskytė, D.; Stanevičienė, R.; Strazdaitė-Žielienė, Ž.; Serva, S.; Servienė, E. Saccharomyces paradoxus K66 Killer System Evidences Expanded Assortment of Helper and Satellite Viruses. Viruses 2018, 10, 564. [Google Scholar] [CrossRef] [PubMed] [Green Version]
- Rodríguez-Cousiño, N.; Gomez, P.; Esteban, R. Variation and Distribution of L-A Helper Totiviruses in Saccharomyces Sensu Stricto Yeasts Producing Different Killer Toxins. Toxins 2017, 9, 313. [Google Scholar] [CrossRef] [PubMed]
- Wickner, R.B. “Killer Character” of Saccharomyces cerevisiae: Curing by Growth at Elevated Temperature. J. Bacteriol. 1974, 117, 1356–1357. [Google Scholar] [CrossRef] [Green Version]
- Nuss, D.L. Hypovirulence: Mycoviruses at the Fungal-Plant Interface. Nat. Rev. Microbiol. 2005, 3, 632–642. [Google Scholar] [CrossRef]
- Ahn, I.P.; Lee, Y.H. A Viral Double-Stranded RNA Upregulates the Fungal Virulence of Nectria Radicicola. Mol. Plant. Microbe Interact. 2001, 14, 496–507. [Google Scholar] [CrossRef] [Green Version]
- Ejmal, M.A.; Holland, D.J.; MacDiarmid, R.M.; Pearson, M.N. A Novel Chrysovirus from a Clinical Isolate of Aspergillus thermomutatus Affects Sporulation. PLoS ONE 2018, 13, e0209443. [Google Scholar] [CrossRef]
- Mannazzu, I.; Domizio, P.; Carboni, G.; Zara, S.; Zara, G.; Comitini, F.; Budroni, M.; Ciani, M. Yeast Killer Toxins: From Ecological Significance to Application. Crit. Rev. Biotechnol. 2019, 39, 603–617. [Google Scholar] [CrossRef]
- Ghabrial, S.A. Origin, Adaptation and Evolutionary Pathways of Fungal Viruses. Virus Genes 1998, 16, 119–131. [Google Scholar] [CrossRef]
- Ball, S.G.; Tirtiaux, C.; Wickner, R.B. Genetic Control of L-A and L-(BC) DsRNA Copy Number in Killer Systems of Saccharomyces cerevisiae. Genetics 1984, 107, 199–217. [Google Scholar] [CrossRef]
- Icho, T.; Wickner, R.B. The Double-Stranded RNA Genome of Yeast Virus L-A Encodes Its Own Putative RNA Polymerase by Fusing Two Open Reading Frames. J. Biol. Chem. 1989, 264, 6716–6723. [Google Scholar] [CrossRef]
- Rowley, P.A.; Ho, B.; Bushong, S.; Johnson, A.; Sawyer, S.L. XRN1 Is a Species-Specific Virus Restriction Factor in Yeasts. PLoS Pathog. 2016, 12, e1005890. [Google Scholar] [CrossRef] [PubMed] [Green Version]
- Rodríguez-Cousiño, N.; Esteban, R. Relationships and Evolution of Double-Stranded RNA Totiviruses of Yeasts Inferred from Analysis of L-A-2 and L-BC Variants in Wine Yeast Strain Populations. Appl. Environ. Microbiol. 2017, 83, e02991-16. [Google Scholar] [CrossRef] [PubMed] [Green Version]
- Rodríguez-Cousiño, N.; Gómez, P.; Esteban, R. L-A-Lus, a New Variant of the L-A Totivirus Found in Wine Yeasts with Klus Killer Toxin-Encoding Mlus Double-Stranded RNA: Possible Role of Killer Toxin-Encoding Satellite RNAs in the Evolution of Their Helper Viruses. Appl. Environ. Microbiol. 2013, 79, 4661–4674. [Google Scholar] [CrossRef] [Green Version]
- Konovalovas, A.; Serviené, E.; Serva, S. Genome Sequence of Saccharomyces cerevisiae Double-Stranded RNA Virus L-A-28. Genome Announc. 2016, 4, e00549-16. [Google Scholar] [CrossRef] [Green Version]
- Ramírez, M.; Velázquez, R.; López-Piñeiro, A.; Martínez, A. Genome Features of a New Double-Stranded RNA Helper Virus (LBCbarr) from Wine Torulaspora Delbrueckii Killer Strains. Int. J. Mol. Sci. 2021, 22, 13492. [Google Scholar] [CrossRef]
- Wickner, R.B. Double-Stranded and Single-Stranded RNA Viruses of Saccharomyces cerevisiae. Annu. Rev. Microbiol. 1992, 46, 347–375. [Google Scholar] [CrossRef]
- Aitmanaitė, L.; Konovalovas, A.; Medvedevas, P.; Servienė, E.; Serva, S. Specificity Determination in Saccharomyces cerevisiae Killer Virus Systems. Microorganisms 2021, 9, 236. [Google Scholar] [CrossRef]
- Sommer, S.S.; Wickner, R.B. Co-Curing of Plasmids Affecting Killer Double-Stranded RNAs of Saccharomyces cerevisiae: [HOK], [NEX], and the Abundance of L Are Related and Further Evidence That M1 Requires L. J. Bacteriol. 1982, 150, 545–551. [Google Scholar] [CrossRef] [Green Version]
- Esteban, R.; Fujimura, T.; Wickner, R.B. Internal and Terminal Cis-Acting Sites Are Necessary for In Vitro Replication of the L-A Double-Stranded RNA Virus of Yeast. EMBO J. 1989, 8, 947–954. [Google Scholar] [CrossRef]
- Fujimura, T.; Wickner, R.B. Replicase of L-A Virus-like Particles of Saccharomyces cerevisiae. In Vitro Conversion of Exogenous L-A and M1 Single-Stranded RNAs to Double-Stranded Form. J. Biol. Chem. 1988, 263, 454–460. [Google Scholar] [CrossRef]
- Fujimura, T.; Wickner, R.B. L-A Double-Stranded RNA Viruslike Particle Replication Cycle in Saccharomyces cerevisiae: Particle Maturation in Vitro and Effects of Mak10 and Pet18 Mutations. Mol. Cell. Biol. 1987, 7, 420–426. [Google Scholar] [CrossRef] [PubMed]
- Polevoda, B.; Sherman, F. NatC Nalpha-Terminal Acetyltransferase of Yeast Contains Three Subunits, Mak3p, Mak10p, and Mak31p. J. Biol. Chem. 2001, 276, 20154–20159. [Google Scholar] [CrossRef] [PubMed] [Green Version]
- Meskauskas, A.; Petrov, A.N.; Dinman, J.D. Identification of Functionally Important Amino Acids of Ribosomal Protein L3 by Saturation Mutagenesis. Mol. Cell. Biol. 2005, 25, 10863–10874. [Google Scholar] [CrossRef] [Green Version]
- Ohtake, Y.; Wickner, R.B. Yeast Virus Propagation Depends Critically on Free 60S Ribosomal Subunit Concentration. Mol. Cell. Biol. 1995, 15, 2772–2781. [Google Scholar] [CrossRef] [Green Version]
- Meskauskas, A.; Baxter, J.L.; Carr, E.A.; Yasenchak, J.; Gallagher, J.E.G.; Baserga, S.J.; Dinman, J.D. Delayed RRNA Processing Results in Significant Ribosome Biogenesis and Functional Defects. Mol. Cell. Biol. 2003, 23, 1602–1613. [Google Scholar] [CrossRef] [Green Version]
- Meskauskas, A.; Harger, J.W.; Jacobs, K.L.M.; Dinman, J.D. Decreased Peptidyltransferase Activity Correlates with Increased Programmed-1 Ribosomal Frameshifting and Viral Maintenance Defects in the Yeast Saccharomyces cerevisiae. RNA 2003, 9, 982–992. [Google Scholar] [CrossRef] [Green Version]
- Dihanich, M.; van Tuinen, E.; Lambris, J.D.; Marshallsay, B. Accumulation of Viruslike Particles in a Yeast Mutant Lacking a Mitochondrial Pore Protein. Mol. Cell. Biol. 1989, 9, 1100–1108. [Google Scholar] [CrossRef]
- Oliver, S.G.; McCready, S.J.; Holm, C.; Sutherland, P.A.; McLaughlin, C.S.; Cox, B.S. Biochemical and Physiological Studies of the Yeast Virus-like Particle. J. Bacteriol. 1977, 130, 1303–1309. [Google Scholar] [CrossRef] [Green Version]
- Lee, Y.J.; Wickner, R.B. MAK10, a Glucose-Repressible Gene Necessary for Replication of a DsRNA Virus of Saccharomyces cerevisiae, Has T Cell Receptor Alpha-Subunit Motifs. Genetics 1992, 132, 87–96. [Google Scholar] [CrossRef]
- Edwards, M.D.; Symbor-Nagrabska, A.; Dollard, L.; Gifford, D.K.; Fink, G.R. Interactions between Chromosomal and Nonchromosomal Elements Reveal Missing Heritability. Proc. Natl. Acad. Sci. USA 2014, 111, 7719–7722. [Google Scholar] [CrossRef] [PubMed] [Green Version]
- Fujimura, T.; Esteban, R. Yeast Double-Stranded RNA Virus L-A Deliberately Synthesizes RNA Transcripts with 5′-Diphosphate. J. Biol. Chem. 2010, 285, 22911–22918. [Google Scholar] [CrossRef] [PubMed] [Green Version]
- Widner, W.R.; Wickner, R.B. Evidence That the SKI Antiviral System of Saccharomyces cerevisiae Acts by Blocking Expression of Viral MRNA. Mol. Cell. Biol. 1993, 13, 4331–4341. [Google Scholar] [CrossRef] [PubMed]
- Solinger, J.A.; Pascolini, D.; Heyer, W.D. Active-Site Mutations in the Xrn1p Exoribonuclease of Saccharomyces cerevisiae Reveal a Specific Role in Meiosis. Mol. Cell. Biol. 1999, 19, 5930–5942. [Google Scholar] [CrossRef] [Green Version]
- Kim, J.; Kim, J. KEM1 Is Involved in Filamentous Growth of Saccharomyces cerevisiae. FEMS Microbiol. Lett. 2002, 216, 33–38. [Google Scholar] [CrossRef]
- Sheth, U.; Parker, R. Decapping and Decay of Messenger RNA Occur in Cytoplasmic Processing Bodies. Science 2003, 300, 805–808. [Google Scholar] [CrossRef] [Green Version]
- Askree, S.H.; Yehuda, T.; Smolikov, S.; Gurevich, R.; Hawk, J.; Coker, C.; Krauskopf, A.; Kupiec, M.; McEachern, M.J. A Genome-Wide Screen for Saccharomyces cerevisiae Deletion Mutants That Affect Telomere Length. Proc. Natl. Acad. Sci. USA 2004, 101, 8658–8663. [Google Scholar] [CrossRef] [Green Version]
- Sinturel, F.; Bréchemier-Baey, D.; Kiledjian, M.; Condon, C.; Bénard, L. Activation of 5′-3′ Exoribonuclease Xrn1 by Cofactor Dcs1 Is Essential for Mitochondrial Function in Yeast. Proc. Natl. Acad. Sci. USA 2012, 109, 8264–8269. [Google Scholar] [CrossRef] [Green Version]
- Delorme-Axford, E.; Abernathy, E.; Lennemann, N.J.; Bernard, A.; Ariosa, A.; Coyne, C.B.; Kirkegaard, K.; Klionsky, D.J. The Exoribonuclease Xrn1 Is a Post-Transcriptional Negative Regulator of Autophagy. Autophagy 2018, 14, 898–912. [Google Scholar] [CrossRef] [Green Version]
- Chlebowski, A.; Lubas, M.; Jensen, T.H.; Dziembowski, A. RNA Decay Machines: The Exosome. Biochim. Biophys. Acta 2013, 1829, 552–560. [Google Scholar] [CrossRef]
- Fujimura, T.; Esteban, R. Cap-Snatching Mechanism in Yeast L-A Double-Stranded RNA Virus. Proc. Natl. Acad. Sci. USA 2011, 108, 17667–17671. [Google Scholar] [CrossRef] [PubMed] [Green Version]
- Georgopoulos, D.E.; Leibowitz, M.J. Nucleotide Phosphotransferase, Nucleotide Kinase and Inorganic Pyrophosphatase Activities of Killer Virions of Yeast. Yeast 1987, 3, 117–129. [Google Scholar] [CrossRef] [PubMed]
- Fujimura, T.; Esteban, R. Diphosphates at the 5′ End of the Positive Strand of Yeast L-A Double-Stranded RNA Virus as a Molecular Self-Identity Tag. Mol. Microbiol. 2016, 102, 71–80. [Google Scholar] [CrossRef] [PubMed] [Green Version]
- Liu, Y.X.; Dieckmann, C.L. Overproduction of Yeast Viruslike Particles by Strains Deficient in a Mitochondrial Nuclease. Mol. Cell. Biol. 1989, 9, 3323–3331. [Google Scholar] [CrossRef] [Green Version]
- Gao, J.; Chau, S.; Chowdhury, F.; Zhou, T.; Hossain, S.; McQuibban, G.A.; Meneghini, M.D. Meiotic Viral Attenuation through an Ancestral Apoptotic Pathway. Proc. Natl. Acad. Sci. USA 2019, 116, 16454–16462. [Google Scholar] [CrossRef] [Green Version]
- McBride, R.C.; Boucher, N.; Park, D.S.; Turner, P.E.; Townsend, J.P. Yeast Response to LA Virus Indicates Coadapted Global Gene Expression during Mycoviral Infection. FEMS Yeast Res. 2013, 13, 162–179. [Google Scholar] [CrossRef] [Green Version]
- Lukša, J.; Ravoitytė, B.; Konovalovas, A.; Aitmanaitė, L.; Butenko, A.; Yurchenko, V.; Serva, S.; Servienė, E. Different Metabolic Pathways Are Involved in Response of Saccharomyces cerevisiae to L-A and M Viruses. Toxins 2017, 9, 233. [Google Scholar] [CrossRef]
- Xu, S.; Yamamoto, N. Anti-Infective Nitazoxanide Disrupts Transcription of Ribosome Biogenesis-Related Genes in Yeast. Genes Genom. 2020, 42, 915–926. [Google Scholar] [CrossRef]
- Ravoitytė, B.; Lukša, J.; Yurchenko, V.; Serva, S.; Servienė, E. Saccharomyces paradoxus Transcriptional Alterations in Cells of Distinct Phenotype and Viral DsRNA Content. Microorganisms 2020, 8, 1902. [Google Scholar] [CrossRef]
- Pieczynska, M.D.; de Visser, J.A.G.M.; Korona, R. Incidence of Symbiotic DsRNA “killer” Viruses in Wild and Domesticated Yeast. FEMS Yeast Res. 2013, 13, 856–859. [Google Scholar] [CrossRef] [Green Version]
- Naumova, G.I.; Naumova, T.I. Comparative genetics of yeasts. XIII, Comparative study of Saccharomycetes-killers from different collections. Genetika 1973, 9, 140–145. [Google Scholar] [PubMed]
- Robinson, M.D.; Smyth, G.K. Small-Sample Estimation of Negative Binomial Dispersion, with Applications to SAGE Data. Biostatistics 2008, 9, 321–332. [Google Scholar] [CrossRef] [PubMed] [Green Version]
- Benjamini, Y.; Hochberg, Y. Controlling the False Discovery Rate: A Practical and Powerful Approach to Multiple Testing. J. R. Stat. Soc. Ser. B 1995, 57, 289–300. [Google Scholar] [CrossRef]
- Balakrishnan, R.; Park, J.; Karra, K.; Hitz, B.C.; Binkley, G.; Hong, E.L.; Sullivan, J.; Micklem, G.; Cherry, J.M. YeastMine—An Integrated Data Warehouse for Saccharomyces cerevisiae Data as a Multipurpose Tool-Kit. Database 2012, 2012, bar062. [Google Scholar] [CrossRef]
- Boyle, E.I.; Weng, S.; Gollub, J.; Jin, H.; Botstein, D.; Cherry, J.M.; Sherlock, G. GO::TermFinder—Open Source Software for Accessing Gene Ontology Information and Finding Significantly Enriched Gene Ontology Terms Associated with a List of Genes. Bioinformatics 2004, 20, 3710–3715. [Google Scholar] [CrossRef] [Green Version]
- Cherry, J.M.; Hong, E.L.; Amundsen, C.; Balakrishnan, R.; Binkley, G.; Chan, E.T.; Christie, K.R.; Costanzo, M.C.; Dwight, S.S.; Engel, S.R.; et al. Saccharomyces Genome Database: The Genomics Resource of Budding Yeast. Nucleic Acids Res. 2012, 40, D700-5. [Google Scholar] [CrossRef] [Green Version]
- Monteiro, P.T.; Oliveira, J.; Pais, P.; Antunes, M.; Palma, M.; Cavalheiro, M.; Galocha, M.; Godinho, C.P.; Martins, L.C.; Bourbon, N.; et al. YEASTRACT+: A Portal for Cross-Species Comparative Genomics of Transcription Regulation in Yeasts. Nucleic Acids Res. 2020, 48, D642–D649. [Google Scholar] [CrossRef]
- Fernández-Cid, A.; Riera, A.; Herrero, P.; Moreno, F. Glucose Levels Regulate the Nucleo-Mitochondrial Distribution of Mig2. Mitochondrion 2012, 12, 370–380. [Google Scholar] [CrossRef]
- Zhao, H.; Eide, D. The Yeast ZRT1 Gene Encodes the Zinc Transporter Protein of a High-Affinity Uptake System Induced by Zinc Limitation. Proc. Natl. Acad. Sci. USA 1996, 93, 2454–2458. [Google Scholar] [CrossRef] [Green Version]
- Brzywczy, J.; Paszewski, A. Role of O-Acetylhomoserine Sulfhydrylase in Sulfur Amino Acid Synthesis in Various Yeasts. Yeast 1993, 9, 1335–1342. [Google Scholar] [CrossRef]
- Gier, S.; Simon, M.; Gasparoni, G.; Khalifa, S.; Schulz, M.H.; Schmitt, M.J.; Breinig, F. Yeast Viral Killer Toxin K1 Induces Specific Host Cell Adaptions via Intrinsic Selection Pressure. Appl. Environ. Microbiol. 2020, 86, e02446-19. [Google Scholar] [CrossRef] [PubMed]
- Becker, B.; Schmitt, M.J. Yeast Killer Toxin K28: Biology and Unique Strategy of Host Cell Intoxication and Killing. Toxins 2017, 9, 333. [Google Scholar] [CrossRef] [PubMed]
- Tipper, D.J.; Schmitt, M.J. Yeast DsRNA Viruses: Replication and Killer Phenotypes. Mol. Microbiol. 1991, 5, 2331–2338. [Google Scholar] [CrossRef] [PubMed]
- Day, M. Yeast Petites and Small Colony Variants: For Everything There Is a Season. Adv. Appl. Microbiol. 2013, 85, 1–41. [Google Scholar] [CrossRef]
- Evans, I.H.; Diala, E.S.; Earl, A.; Wilkie, D. Mitochondrial Control of Cell Surface Characteristics in Saccharomyces cerevisiae. Biochim. Biophys. Acta 1980, 602, 201–206. [Google Scholar] [CrossRef]
- Traven, A.; Wong, J.M.; Xu, D.; Sopta, M.; Ingles, C.J. Interorganellar Communication. Altered Nuclear Gene Expression Profiles in a Yeast Mitochondrial DNA Mutant. J. Biol. Chem. 2001, 276, 4020–4027. [Google Scholar] [CrossRef] [Green Version]
- Kennedy, B.K.; Austriaco, N.R.J.; Zhang, J.; Guarente, L. Mutation in the Silencing Gene SIR4 Can Delay Aging in S. cerevisiae. Cell 1995, 80, 485–496. [Google Scholar] [CrossRef] [Green Version]
- Kispal, G.; Sipos, K.; Lange, H.; Fekete, Z.; Bedekovics, T.; Janáky, T.; Bassler, J.; Aguilar Netz, D.J.; Balk, J.; Rotte, C.; et al. Biogenesis of Cytosolic Ribosomes Requires the Essential Iron-Sulphur Protein Rli1p and Mitochondria. EMBO J. 2005, 24, 589–598. [Google Scholar] [CrossRef] [Green Version]
- Wickner, R.B. Chromosomal and Nonchromosomal Mutations Affecting the “Killer Character” of Saccharomyces cerevisiae. Genetics 1974, 76, 423–432. [Google Scholar] [CrossRef]
- Unchwaniwala, N.; Zhan, H.; Pennington, J.; Horswill, M.; den Boon, J.A.; Ahlquist, P. Subdomain Cryo-EM Structure of Nodaviral Replication Protein A Crown Complex Provides Mechanistic Insights into RNA Genome Replication. Proc. Natl. Acad. Sci. USA 2020, 117, 18680–18691. [Google Scholar] [CrossRef]
- Lau, S.K.P.; Lo, G.C.S.; Chow, F.W.N.; Fan, R.Y.Y.; Cai, J.J.; Yuen, K.-Y.; Woo, P.C.Y. Novel Partitivirus Enhances Virulence of and Causes Aberrant Gene Expression in Talaromyces marneffei. mBio 2018, 9, e00947-18. [Google Scholar] [CrossRef] [PubMed] [Green Version]
- Drinnenberg, I.A.; Fink, G.R.; Bartel, D.P. Compatibility with Killer Explains the Rise of RNAi-Deficient Fungi. Science 2011, 333, 1592. [Google Scholar] [CrossRef] [PubMed] [Green Version]
- Clancey, S.A.; Ruchti, F.; LeibundGut-Landmann, S.; Heitman, J.; Ianiri, G. A Novel Mycovirus Evokes Transcriptional Rewiring in the Fungus Malassezia and Stimulates Interferon-β Production in Macrophages. mBio 2020, 11, e01534-20. [Google Scholar] [CrossRef]
- Park, M.; Cho, Y.-J.; Kim, D.; Yang, C.-S.; Lee, S.M.; Dawson, T.L.; Nakamizo, S.; Kabashima, K.; Lee, Y.W.; Jung, W.H. A Novel Virus Alters Gene Expression and Vacuolar Morphology in Malassezia Cells and Induces a TLR3-Mediated Inflammatory Immune Response. mBio 2020, 11, e01521-20. [Google Scholar] [CrossRef] [PubMed]
- Lee Marzano, S.-Y.; Neupane, A.; Domier, L. Transcriptional and Small RNA Responses of the White Mold Fungus Sclerotinia sclerotiorum to Infection by a Virulence-Attenuating Hypovirus. Viruses 2018, 10, 713. [Google Scholar] [CrossRef] [Green Version]
- Adaui, V.; Lye, L.-F.; Akopyants, N.S.; Zimic, M.; Llanos-Cuentas, A.; Garcia, L.; Maes, I.; De Doncker, S.; Dobson, D.E.; Arevalo, J.; et al. Association of the Endobiont Double-Stranded RNA Virus LRV1 With Treatment Failure for Human Leishmaniasis Caused by Leishmania braziliensis in Peru and Bolivia. J. Infect. Dis. 2016, 213, 112–121. [Google Scholar] [CrossRef] [Green Version]
- Grybchuk, D.; Akopyants, N.S.; Kostygov, A.Y.; Konovalovas, A.; Lye, L.-F.; Dobson, D.E.; Zangger, H.; Fasel, N.; Butenko, A.; Frolov, A.O.; et al. Viral Discovery and Diversity in Trypanosomatid Protozoa with a Focus on Relatives of the Human Parasite Leishmania. Proc. Natl. Acad. Sci. USA 2018, 115, E506–E515. [Google Scholar] [CrossRef] [Green Version]
- Kotta-Loizou, I. Mycoviruses and Their Role in Fungal Pathogenesis. Curr. Opin. Microbiol. 2021, 63, 10–18. [Google Scholar] [CrossRef]
- Święciło, A. Cross-Stress Resistance in Saccharomyces cerevisiae Yeast--New Insight into an Old Phenomenon. Cell Stress Chaperones 2016, 21, 187–200. [Google Scholar] [CrossRef] [Green Version]
- Sánchez-Gaya, V.; Casaní-Galdón, S.; Ugidos, M.; Kuang, Z.; Mellor, J.; Conesa, A.; Tarazona, S. Elucidating the Role of Chromatin State and Transcription Factors on the Regulation of the Yeast Metabolic Cycle: A Multi-Omic Integrative Approach. Front. Genet. 2018, 9, 578. [Google Scholar] [CrossRef] [Green Version]
- Karunanithi, S.; Cullen, P.J. The Filamentous Growth MAPK Pathway Responds to Glucose Starvation Through the Mig1/2 Transcriptional Repressors in Saccharomyces cerevisiae. Genetics 2012, 192, 869–887. [Google Scholar] [CrossRef] [PubMed] [Green Version]
- Angus-Hill, M.L.; Schlichter, A.; Roberts, D.; Erdjument-Bromage, H.; Tempst, P.; Cairns, B.R. A Rsc3/Rsc30 Zinc Cluster Dimer Reveals Novel Roles for the Chromatin Remodeler RSC in Gene Expression and Cell Cycle Control. Mol. Cell 2001, 7, 741–751. [Google Scholar] [CrossRef]
- Hill, M.S.; Vande Zande, P.; Wittkopp, P.J. Molecular and Evolutionary Processes Generating Variation in Gene Expression. Nat. Rev. Genet. 2021, 22, 203–215. [Google Scholar] [CrossRef] [PubMed]
- Hahn, S.; Young, E.T. Transcriptional Regulation in Saccharomyces cerevisiae: Transcription Factor Regulation and Function, Mechanisms of Initiation, and Roles of Activators and Coactivators. Genetics 2011, 189, 705–736. [Google Scholar] [CrossRef] [PubMed] [Green Version]
- Hughes, T.R.; de Boer, C.G. Mapping Yeast Transcriptional Networks. Genetics 2013, 195, 9–36. [Google Scholar] [CrossRef] [Green Version]
- Reimand, J.; Vaquerizas, J.M.; Todd, A.E.; Vilo, J.; Luscombe, N.M. Comprehensive Reanalysis of Transcription Factor Knockout Expression Data in Saccharomyces cerevisiae Reveals Many New Targets. Nucleic Acids Res. 2010, 38, 4768–4777. [Google Scholar] [CrossRef] [Green Version]
- Marion, R.M.; Regev, A.; Segal, E.; Barash, Y.; Koller, D.; Friedman, N.; O’Shea, E.K. Sfp1 Is a Stress- and Nutrient-Sensitive Regulator of Ribosomal Protein Gene Expression. Proc. Natl. Acad. Sci. USA 2004, 101, 14315–14322. [Google Scholar] [CrossRef] [Green Version]
- Jorgensen, P.; Rupes, I.; Sharom, J.R.; Schneper, L.; Broach, J.R.; Tyers, M. A Dynamic Transcriptional Network Communicates Growth Potential to Ribosome Synthesis and Critical Cell Size. Genes Dev. 2004, 18, 2491–2505. [Google Scholar] [CrossRef] [Green Version]
- Gertz, J.; Riles, L.; Turnbaugh, P.; Ho, S.-W.; Cohen, B.A. Discovery, Validation, and Genetic Dissection of Transcription Factor Binding Sites by Comparative and Functional Genomics. Genome Res. 2005, 15, 1145–1152. [Google Scholar] [CrossRef] [Green Version]
- Cipollina, C.; van den Brink, J.; Daran-Lapujade, P.; Pronk, J.T.; Porro, D.; de Winde, J.H. Saccharomyces cerevisiaeSFP1: At the Crossroads of Central Metabolism and Ribosome Biogenesis. Microbiology 2008, 154, 1686–1699. [Google Scholar] [CrossRef] [Green Version]
- Venters, B.J.; Wachi, S.; Mavrich, T.N.; Andersen, B.E.; Jena, P.; Sinnamon, A.J.; Jain, P.; Rolleri, N.S.; Jiang, C.; Hemeryck-Walsh, C.; et al. A Comprehensive Genomic Binding Map of Gene and Chromatin Regulatory Proteins in Saccharomyces. Mol. Cell 2011, 41, 480–492. [Google Scholar] [CrossRef] [PubMed] [Green Version]
- Vyas, V.K.; Berkey, C.D.; Miyao, T.; Carlson, M. Repressors Nrg1 and Nrg2 Regulate a Set of Stress-Responsive Genes in Saccharomyces cerevisiae. Eukaryot. Cell 2005, 4, 1882–1891. [Google Scholar] [CrossRef] [PubMed] [Green Version]
- MacPherson, S.; Larochelle, M.; Turcotte, B. A Fungal Family of Transcriptional Regulators: The Zinc Cluster Proteins. Microbiol. Mol. Biol. Rev. 2006, 70, 583–604. [Google Scholar] [CrossRef] [PubMed] [Green Version]
- Friden, P.; Schimmel, P. LEU3 of Saccharomyces cerevisiae Activates Multiple Genes for Branched-Chain Amino Acid Biosynthesis by Binding to a Common Decanucleotide Core Sequence. Mol. Cell. Biol. 1988, 8, 2690–2697. [Google Scholar] [CrossRef] [PubMed]
- dos Santos, S.C.; Tenreiro, S.; Palma, M.; Becker, J.; Sá-Correia, I. Transcriptomic Profiling of the Saccharomyces cerevisiae Response to Quinine Reveals a Glucose Limitation Response Attributable to Drug-Induced Inhibition of Glucose Uptake. Antimicrob. Agents Chemother. 2009, 53, 5213–5223. [Google Scholar] [CrossRef] [PubMed] [Green Version]
- Gagiano, M.; Bester, M.; van Dyk, D.; Franken, J.; Bauer, F.F.; Pretorius, I.S. Mss11p Is a Transcription Factor Regulating Pseudohyphal Differentiation, Invasive Growth and Starch Metabolism in Saccharomyces cerevisiae in Response to Nutrient Availability. Mol. Microbiol. 2003, 47, 119–134. [Google Scholar] [CrossRef] [PubMed]
- Ross, C.D.; McCarty, B.R.; Hamilton, M.; Ben-Hur, A.; Ross, E.D. A Promiscuous Prion: Efficient Induction of [URE3] Prion Formation by Heterologous Prion Domains. Genetics 2009, 183, 929–940. [Google Scholar] [CrossRef] [Green Version]
- Thepnok, P.; Ratanakhanokchai, K.; Soontorngun, N. The Novel Zinc Cluster Regulator Tog1 Plays Important Roles in Oleate Utilization and Oxidative Stress Response in Saccharomyces cerevisiae. Biochem. Biophys. Res. Commun. 2014, 450, 1276–1282. [Google Scholar] [CrossRef]
- Uemura, H.; Jigami, Y. Mutations in GCR1, a Transcriptional Activator of Saccharomyces cerevisiae Glycolytic Genes, Function as Suppressors of Gcr2 Mutations. Genetics 1995, 139, 511–521. [Google Scholar] [CrossRef]
- Kratzer, S.; Schüller, H.J. Transcriptional Control of the Yeast Acetyl-CoA Synthetase Gene, ACS1, by the Positive Regulators CAT8 and ADR1 and the Pleiotropic Repressor UME6. Mol. Microbiol. 1997, 26, 631–641. [Google Scholar] [CrossRef]
- Gaspar, M.L.; Chang, Y.-F.; Jesch, S.A.; Aregullin, M.; Henry, S.A. Interaction between Repressor Opi1p and ER Membrane Protein Scs2p Facilitates Transit of Phosphatidic Acid from the ER to Mitochondria and Is Essential for INO1 Gene Expression in the Presence of Choline. J. Biol. Chem. 2017, 292, 18713–18728. [Google Scholar] [CrossRef] [PubMed] [Green Version]
- Buechel, E.R.; Pinkett, H.W. Transcription Factors and ABC Transporters: From Pleiotropic Drug Resistance to Cellular Signaling in Yeast. FEBS Lett. 2020, 594, 3943–3964. [Google Scholar] [CrossRef] [PubMed]
- Shu, W.-J.; Chen, R.; Yin, Z.-H.; Li, F.; Zhang, H.; Du, H.-N. Rph1 Coordinates Transcription of Ribosomal Protein Genes and Ribosomal RNAs to Control Cell Growth under Nutrient Stress Conditions. Nucleic Acids Res. 2020, 48, 8360–8373. [Google Scholar] [CrossRef] [PubMed]
- Pietrocola, F.; Galluzzi, L.; Bravo-San Pedro, J.M.; Madeo, F.; Kroemer, G. Acetyl Coenzyme A: A Central Metabolite and Second Messenger. Cell Metab. 2015, 21, 805–821. [Google Scholar] [CrossRef] [Green Version]
- Galdieri, L.; Zhang, T.; Rogerson, D.; Lleshi, R.; Vancura, A. Protein Acetylation and Acetyl Coenzyme a Metabolism in Budding Yeast. Eukaryot. Cell 2014, 13, 1472–1483. [Google Scholar] [CrossRef] [Green Version]
- Cartwright, J.L.; Gasmi, L.; Spiller, D.G.; McLennan, A.G. The Saccharomyces cerevisiae PCD1 Gene Encodes a Peroxisomal Nudix Hydrolase Active toward Coenzyme A and Its Derivatives. J. Biol. Chem. 2000, 275, 32925–32930. [Google Scholar] [CrossRef] [Green Version]
- Kayikci, Ö.; Nielsen, J. Glucose Repression in Saccharomyces cerevisiae. FEMS Yeast Res. 2015, 15, fov068. [Google Scholar] [CrossRef] [Green Version]
- Zhang, M.; Galdieri, L.; Vancura, A. The Yeast AMPK Homolog SNF1 Regulates Acetyl Coenzyme A Homeostasis and Histone Acetylation. Mol. Cell. Biol. 2013, 33, 4701–4717. [Google Scholar] [CrossRef] [Green Version]
- Grunwald, S.; Hopf, L.V.M.; Bock-Bierbaum, T.; Lally, C.C.M.; Spahn, C.M.T.; Daumke, O. Divergent Architecture of the Heterotrimeric NatC Complex Explains N-Terminal Acetylation of Cognate Substrates. Nat. Commun. 2020, 11, 5506. [Google Scholar] [CrossRef]
- Tercero, J.C.; Dinman, J.D.; Wickner, R.B. Yeast MAK3 N-Acetyltransferase Recognizes the N-Terminal Four Amino Acids of the Major Coat Protein (Gag) of the L-A Double-Stranded RNA Virus. J. Bacteriol. 1993, 175, 3192–3194. [Google Scholar] [CrossRef] [Green Version]
- Drazic, A.; Varland, S. Human NAA30 Can Rescue Yeast Mak3∆ Mutant Growth Phenotypes. Biosci. Rep. 2021, 41, BSR20202828. [Google Scholar] [CrossRef] [PubMed]
- Aksnes, H.; Ree, R.; Arnesen, T. Co-Translational, Post-Translational, and Non-Catalytic Roles of N-Terminal Acetyltransferases. Mol. Cell 2019, 73, 1097–1114. [Google Scholar] [CrossRef] [PubMed] [Green Version]
- Kalvik, T.V.; Arnesen, T. Protein N-Terminal Acetyltransferases in Cancer. Oncogene 2013, 32, 269–276. [Google Scholar] [CrossRef] [PubMed] [Green Version]
- Le Crom, S.; Devaux, F.; Marc, P.; Zhang, X.; Moye-Rowley, W.S.; Jacq, C. New Insights into the Pleiotropic Drug Resistance Network from Genome-Wide Characterization of the YRR1 Transcription Factor Regulation System. Mol. Cell. Biol. 2002, 22, 2642–2649. [Google Scholar] [CrossRef] [Green Version]
- Jiang, Y.; Vasconcelles, M.J.; Wretzel, S.; Light, A.; Martin, C.E.; Goldberg, M.A. MGA2 Is Involved in the Low-Oxygen Response Element-Dependent Hypoxic Induction of Genes in Saccharomyces cerevisiae. Mol. Cell. Biol. 2001, 21, 6161–6169. [Google Scholar] [CrossRef] [Green Version]
- Romero, A.M.; Jordá, T.; Rozès, N.; Martínez-Pastor, M.T.; Puig, S. Regulation of Yeast Fatty Acid Desaturase in Response to Iron Deficiency. Biochim. Biophys. Acta. Mol. Cell Biol. Lipids 2018, 1863, 657–668. [Google Scholar] [CrossRef] [Green Version]
- Bourot, S.; Karst, F. Isolation and Characterization of the Saccharomyces cerevisiae SUT1 Gene Involved in Sterol Uptake. Gene 1995, 165, 97–102. [Google Scholar] [CrossRef]
- Regnacq, M.; Alimardani, P.; El Moudni, B.; Berges, T. SUT1p Interaction with Cyc8p(Ssn6p) Relieves Hypoxic Genes from Cyc8p-Tup1p Repression in Saccharomyces cerevisiae. Mol. Microbiol. 2001, 40, 1085–1096. [Google Scholar] [CrossRef] [Green Version]
- Foster, H.A.; Cui, M.; Naveenathayalan, A.; Unden, H.; Schwanbeck, R.; Hofken, T. The Zinc Cluster Protein Sut1 Contributes to Filamentation in Saccharomyces cerevisiae. Eukaryot. Cell 2013, 12, 244–253. [Google Scholar] [CrossRef] [Green Version]
- Blanda, C.; Hofken, T. Regulation of Mating in the Budding Yeast Saccharomyces cerevisiae by the Zinc Cluster Proteins Sut1 and Sut2. Biochem. Biophys. Res. Commun. 2013, 438, 66–70. [Google Scholar] [CrossRef] [Green Version]


Publisher’s Note: MDPI stays neutral with regard to jurisdictional claims in published maps and institutional affiliations. |
© 2022 by the authors. Licensee MDPI, Basel, Switzerland. This article is an open access article distributed under the terms and conditions of the Creative Commons Attribution (CC BY) license (https://creativecommons.org/licenses/by/4.0/).
Share and Cite
Ravoitytė, B.; Lukša, J.; Wellinger, R.E.; Serva, S.; Servienė, E. Adaptive Response of Saccharomyces Hosts to Totiviridae L-A dsRNA Viruses Is Achieved through Intrinsically Balanced Action of Targeted Transcription Factors. J. Fungi 2022, 8, 381. https://doi.org/10.3390/jof8040381
Ravoitytė B, Lukša J, Wellinger RE, Serva S, Servienė E. Adaptive Response of Saccharomyces Hosts to Totiviridae L-A dsRNA Viruses Is Achieved through Intrinsically Balanced Action of Targeted Transcription Factors. Journal of Fungi. 2022; 8(4):381. https://doi.org/10.3390/jof8040381
Chicago/Turabian StyleRavoitytė, Bazilė, Juliana Lukša, Ralf Erik Wellinger, Saulius Serva, and Elena Servienė. 2022. "Adaptive Response of Saccharomyces Hosts to Totiviridae L-A dsRNA Viruses Is Achieved through Intrinsically Balanced Action of Targeted Transcription Factors" Journal of Fungi 8, no. 4: 381. https://doi.org/10.3390/jof8040381