Article

Regulator of G Protein Signaling Proteins Control Growth, Development and Cellulase Production in Neurospora crassa

Department of Microbiology and Plant Pathology, University of California-Riverside, 900 University Avenue, Riverside, CA 92521, USA
*
Author to whom correspondence should be addressed.
These authors contributed equally to this work.
Current Address: Department of Cell and Developmental Biology, University of California-San Diego, La Jolla, CA 92093, USA.
§
Current Address: Department of Biochemistry, Baylor College of Medicine, Houston, TX 77030, USA.
Current Address: Department of Pharmacology, University of Texas-Southwestern, Dallas, TX 75390, USA.
J. Fungi 2022, 8(10), 1076; https://doi.org/10.3390/jof8101076
Submission received: 30 August 2022 / Revised: 5 October 2022 / Accepted: 11 October 2022 / Published: 13 October 2022
(This article belongs to the Special Issue Signal Transductions in Fungi 2.0)

Abstract

:
Heterotrimeric (αβγ) G protein signaling pathways are critical environmental sensing systems found in eukaryotic cells. Exchange of GDP for GTP on the Gα subunit leads to its activation. In contrast, GTP hydrolysis on the Gα is accelerated by Regulator of G protein Signaling (RGS) proteins, resulting in a return to the GDP-bound, inactive state. Here, we analyzed growth, development and extracellular cellulase production in strains with knockout mutations in the seven identified RGS genes (rgs-1 to rgs-7) in the filamentous fungus, Neurospora crassa. We compared phenotypes to those of strains with either knockout mutations or expressing predicted constitutively activated, GTPase-deficient alleles for each of the three Gα subunit genes (gna-1Q204L, gna-2Q205L or gna-3Q208L). Our data revealed that six RGS mutants have taller aerial hyphae than wild type and all seven mutants exhibit reduced asexual sporulation, phenotypes shared with strains expressing the gna-1Q204L or gna-3Q208L allele. In contrast, Δrgs-1 and Δrgs-3 were the only RGS mutants with a slower growth rate phenotype, a defect in common with gna-1Q204L strains. With respect to female sexual development, Δrgs-1 possessed defects most similar to gna-3Q208L strains, while those of Δrgs-2 mutants resembled strains expressing the gna-1Q204L allele. Finally, we observed that four of the seven RGS mutants had significantly different extracellular cellulase levels relative to wild type. Of interest, the Δrgs-2 mutant had no detectable activity, similar to the gna-3Q208L strain. In contrast, the Δrgs-1 and Δrgs-4 mutants and gna-1Q204L and gna-2Q205L strains exhibited significantly higher cellulase activity than wild type. With the exception of sexual development, our results demonstrate the greatest number of genetic interactions between rgs-1 and gna-1 and rgs-2 and gna-3 in N. crassa.

1. Introduction

The filamentous fungus Neurospora crassa colonizes new environments through the polar growth, branching and fusion of tube-like structures called hyphae to form a networked structure, the mycelium [1,2,3]. As hyphae grow, crosswalls (septa) are laid down between cell compartments [4]. Septa have pores that allow movement of small molecules, proteins and even organelles, facilitating cell–cell communication throughout the mycelial colony [5].
N. crassa uses three different developmental pathways to produce spores for dispersal [1,6,7]. The major asexual sporulation pathway, macroconidiation, results in production of multinucleated spores (macroconidia) [6]. These macroconidia develop via a budding routine from the tips of aerial hyphae and are easily released into the environment upon maturation. Spores produced during the second asexual sporulation pathway, microconidia, contain only one nucleus and develop from basal hyphae [8]. The third type of spore, the ascospore, is produced during sexual reproduction between male and female cells of opposite mating type [7]. Fertilization is accomplished when female reproductive structures (protoperithecia) extend chemotropic hyphae (trichogynes) towards a microconidium, macroconidium or hyphal fragment (male) from a strain of opposite mating type. The meiotic products (ascospores) are ejected from the mature fruiting body (perithecium) into the environment and are able to germinate to form a colony upon activation by heat, such as during a fire [7].
Previous studies have demonstrated that perturbation of components in the G protein signaling pathway results in altered growth and development in N. crassa [9]. N. crassa possesses three Gα proteins GNA-1, GNA-2, and GNA-3 (Guanine Nucleotide-binding protein Alpha—1/2/3) [10,11,12,13], two predicted Gβ proteins GNB-1 (Guanine Nucleotide-binding protein Beta -1) and CPC-2 (Cross Pathway Control -2) [14,15,16] and one Gγ protein GNG-1 (Guanine Nucleotide-binding protein Gamma -1) [17]. Various G protein subunits have been shown to regulate hyphal growth rate, aerial hyphae height, macroconidia abundance, development of protoperithecia and perithecia, and stress resistance. Alterations in adenylyl cyclase activity and protein levels and the resulting effects on cAMP amount have been identified as downstream effects of G protein signaling in N. crassa [13,18,19,20]. Our group has recently demonstrated that five of the six predicted G protein subunit genes (including the Gα subunits gna-1 and gna-3) and adenylyl cyclase are required for production of detectable cellulase activity in N. crassa [21].
Regulator of G protein Signaling (RGS) proteins have been demonstrated to function as negative regulators of G protein pathways in numerous eukaryotes [22,23,24,25]. RGS proteins act as GTPase Activating Proteins (GAPs) by accelerating hydrolysis of GTP bound to Gα subunits by more than 2000 times, returning the Gα more rapidly to the inactive GDP-bound state [23]. Functions for certain RGS proteins have been characterized in several fungal systems, including the ascomycetes Saccharomyces cerevisiae, Aspergillus nidulans, Aspergillus fumigatus, Aspergillus flavus, Fusarium verticillioides and Magnaporthe oryzae [26,27,28,29,30,31]. A recent study provided evidence that an RGS protein (RGS-1) negatively regulates the alternative oxidase gene aod-1 in N. crassa [32]. However, functions for RGS-1 and the other RGS proteins in regulation of growth and development have not yet been studied in N. crassa. Furthermore, roles for RGS proteins in cellulase production have not been systematically analyzed in any fungal system.
In this study, we characterize the phenotypes of mutants lacking each of the seven predicted RGS genes in N. crassa. We compare RGS mutant defects to those of strains carrying null or constitutively activated, GTPase-deficient mutations in the three Gα genes. Our results implicate genetic interactions between particular Gα-RGS partners during regulation of growth, asexual and sexual development, and extracellular cellulase production in N. crassa.

2. Materials and Methods

2.1. Media, Strains and Genetic Procedures

Vogel’s minimal medium (VM) [33] was used for strain propagation and assays of vegetative growth and development, with the exception that the carbon source was either (all expressed as wt/vol) 1.5% sucrose (normal concentration), 2% glucose or 2% crystalline cellulose (Avicel-PH101, 50-µm particle; Sigma-Aldrich, St. Louis, MO, USA), as indicated in the Results and Figure Legends. Sorbose-containing medium (FGS) was used to facilitate colony formation on plates [34]. Where indicated, media contained 100 μg/mL histidine, 200 μg/mL hygromycin B (Calbiochem, San Diego, CA, USA), 200 μg/mL nourseothricin (for nat+ selection; [35] (Werner BioAgents, Jena, Germany), or 400 μg/mL phosphinothricin purified from Finale (Bayer Crop Science, St. Louis, MO, USA), for bar+ selection, as described previously [36]. Medium used for bar+ selection contained proline as the nitrogen source [37]. Macroconidia from 5- to 7-day-old VM agar flasks or slant cultures or packed hyphae were used to inoculate all media, as previously described [16]. Submerged liquid cultures were inoculated at a density of 1 × 10⁶ macroconidia/mL and incubated for 16 h at 30 °C with shaking at 200 RPM. Escherichia coli strain DH5α was used to maintain plasmids.
N. crassa strains used in this study are listed in Table 1. All RGS gene deletion mutants were constructed by the Neurospora genome project using homologous recombination at the RGS gene locus, replacing the gene with a hygromycin B resistance cassette as described [38]. The Δrgs-3, Δrgs-5, Δrgs-6 and Δrgs-7 mutants were obtained as homokaryons, while the Δrgs-1, Δrgs-2, and Δrgs-4 mutants were obtained as heterokaryons, all in the mat a mating type. Homokaryons in both the mat a and mat A mating types were obtained by crossing heterokaryotic strains as males to wild-type strain 74A (Table 1; FGSC 987, mat A) using standard methods, with selection of progeny on sorbose plates [34] supplemented with hygromycin B. Genomic DNA was isolated from progeny and strain genotypes were verified by Southern analysis using the knockout cassette as a probe [38] or by diagnostic PCR using pairs of gene-specific and hph cassette-specific primers (Table S1; Figure S1).
Double mutants lacking an RGS gene and the Δmus-52::nat+ mutation were produced using sexual crosses between single mutants, with the first selection on medium containing hygromycin. Use of the Δmus-52::bar+ background results in a high frequency of homologous recombination in N. crassa [38] and was necessary for proper targeting of the RGS complementation constructs to the pan-2 locus (see below). Hygromycin-resistant progeny were spot-tested on medium containing nourseothricin, and nourseothricin-resistant strains selected for further analysis. DNA was isolated from progeny and diagnostic PCR performed as described above. Strains carrying both mutations were carried forward (Table 1).
Complementation constructs were made that would allow expression of each RGS gene in trans to the Δrgs knockout mutation. The vector backbone was pccg-1MCSV5bar-2, which targets DNA to (and deletes) the pan-2 locus, leading to pantothenate auxotrophy and resistance to phosphinothricin. pccg-1MCSV5bar-2 is based on pRS426PVG [39] and contains in order, the 1kb region 5′ to the pan-2 open reading frame (ORF), the ccg-1 promoter amplified from pMF272 [40], a multiple cloning site, 5xGlycine linker, V5 epitope tag, the bar gene conferring resistance to phosphinothricin, and the 1kb region 3′ to the pan-2 ORF. pccg-1MCSV5bar-2 is also a yeast-E. coli shuttle vector that confers uracil prototrophy to S. cerevisiae ura3 mutants and ampicillin resistance in E. coli. Primers were used to amplify the ORF of each RGS gene from N. crassa genomic DNA using PCR (Table S1). pccg-1MCSV5bar-2 was digested with PacI and transformed along with each amplified RGS ORF fragment into yeast strain FY834 to facilitate yeast recombinational cloning, as previously described [38]. The complementation constructs were transformed using electroporation into the appropriate Δrgs, Δmus-52::bar+ strain (Table 1). Transformants were plated on medium containing phosphinothricin and pantothenate. Genomic DNA was checked for replacement of the pan-2 gene with the RGS ORF using diagnostic PCR (Primers in Table S1; Figure S2). Selected strains used for experiments are noted in Table 1.

2.2. Growth and Developmental Phenotypic Assays

Phenotypic assays for basal hyphae growth rate, aerial hyphae height and macroconidia abundance were conducted as described [16]. Wild type strains (Table 1; FGSC 4200, mat a and FGSC 2489, mat A) were used as controls. Four biological replicates were used for basal hyphae growth rate calculations, six were used for quantitation of macroconidia amount and 12 were used to determine aerial hyphae height. For sexual development assays, strains were inoculated on slants containing synthetic crossing medium agar (SCM); [41] and incubated in constant light for one week at room temperature. Development of female reproductive structures (protoperithecia) was scored at 7 days after inoculation. Cultures were then fertilized using macroconidia from a wild type strain of opposite mating type and incubation continued under the same conditions. Formation of perithecia was scored one week after fertilization and ascospore ejection two weeks after fertilization.

2.3. Assessment of Gene Expression, Growth, Supernatant Protein, Cell Mass Protein and Cellulase Activity Measurements with Avicel as the Carbon Source

RNAseq data were obtained from [42] and used to extract expression levels for the Gα and RGS genes in wild type during growth on sucrose vs. Avicel as a carbon source. For visual inspection of growth in Avicel, macroconidia were inoculated into 25 mL VM-Avicel liquid cultures at a concentration of 1 × 10⁶ cells/mL. Cultures were grown at 25 °C in constant light with shaking at 200 RPM for 3 days. Cultures were collected and centrifuged as described [21]. The pellets containing hyphal mats and residual Avicel were photographed.
For measurement of cellulase activity, strains were cultured in VM-Avicel as the carbon source as described above. Cell-free culture filtrates were obtained by passing culture supernatants through a 0.45 μm filter. The filtrate was used for assay of glucose release (cellulase) activity from Avicel as described in [21], using a coupled enzyme assay. Protein was extracted from the cell pad using sodium dodecyl sulfate and heat as described [21]. The protein concentration in the cell pad extracts and cell-free supernatants was quantitated using the Pierce Bicinchoninic acid (BCA) protein assay (Thermo Fisher Scientific, Chino, CA, USA), with bovine serum albumin (BSA) as described in [21]. Cellulase activity was normalized to biomass protein. The final glucose release cellulase activity is expressed as nmole glucose/mL supernatant/mg of extracted biomass protein. For visualization of protein species in the samples, the cell-free supernatants were concentrated five-fold using centrifugal filter units and then equal volumes electrophoresed on 10% SDS-PAGE gels as described [21]. Gels were stained using Coomassie Brilliant Blue as described [13].

2.4. Statistical Analysis

Grubb’s Q test was utilized to detect and eliminate outliers for all studies [43]. For quantitative growth and developmental assays (basal hyphae growth rate, aerial hyphae height and macroconidia abundance), pairwise Student’s t-tests [44] were performed using base R with no pooling of standard deviations. Each comparison was an unpaired t-test and the p-values generated were adjusted using the Holm-Bonferroni method [45]. Bar graphs were made using ggplot2 [46] or Microsoft Excel (Microsoft, Redmond, WA, USA). For analysis of supernatant protein, cell mass protein and cellulase activity after growth in Avicel, bar graphs were created using Microsoft Excel and Student’s t-test [44] (paired, two-tailed) was performed using Microsoft Excel. For figures, p-value significance levels are denoted as * p < 0.05; ** p < 0.01, and *** p < 0.001.

3. Results

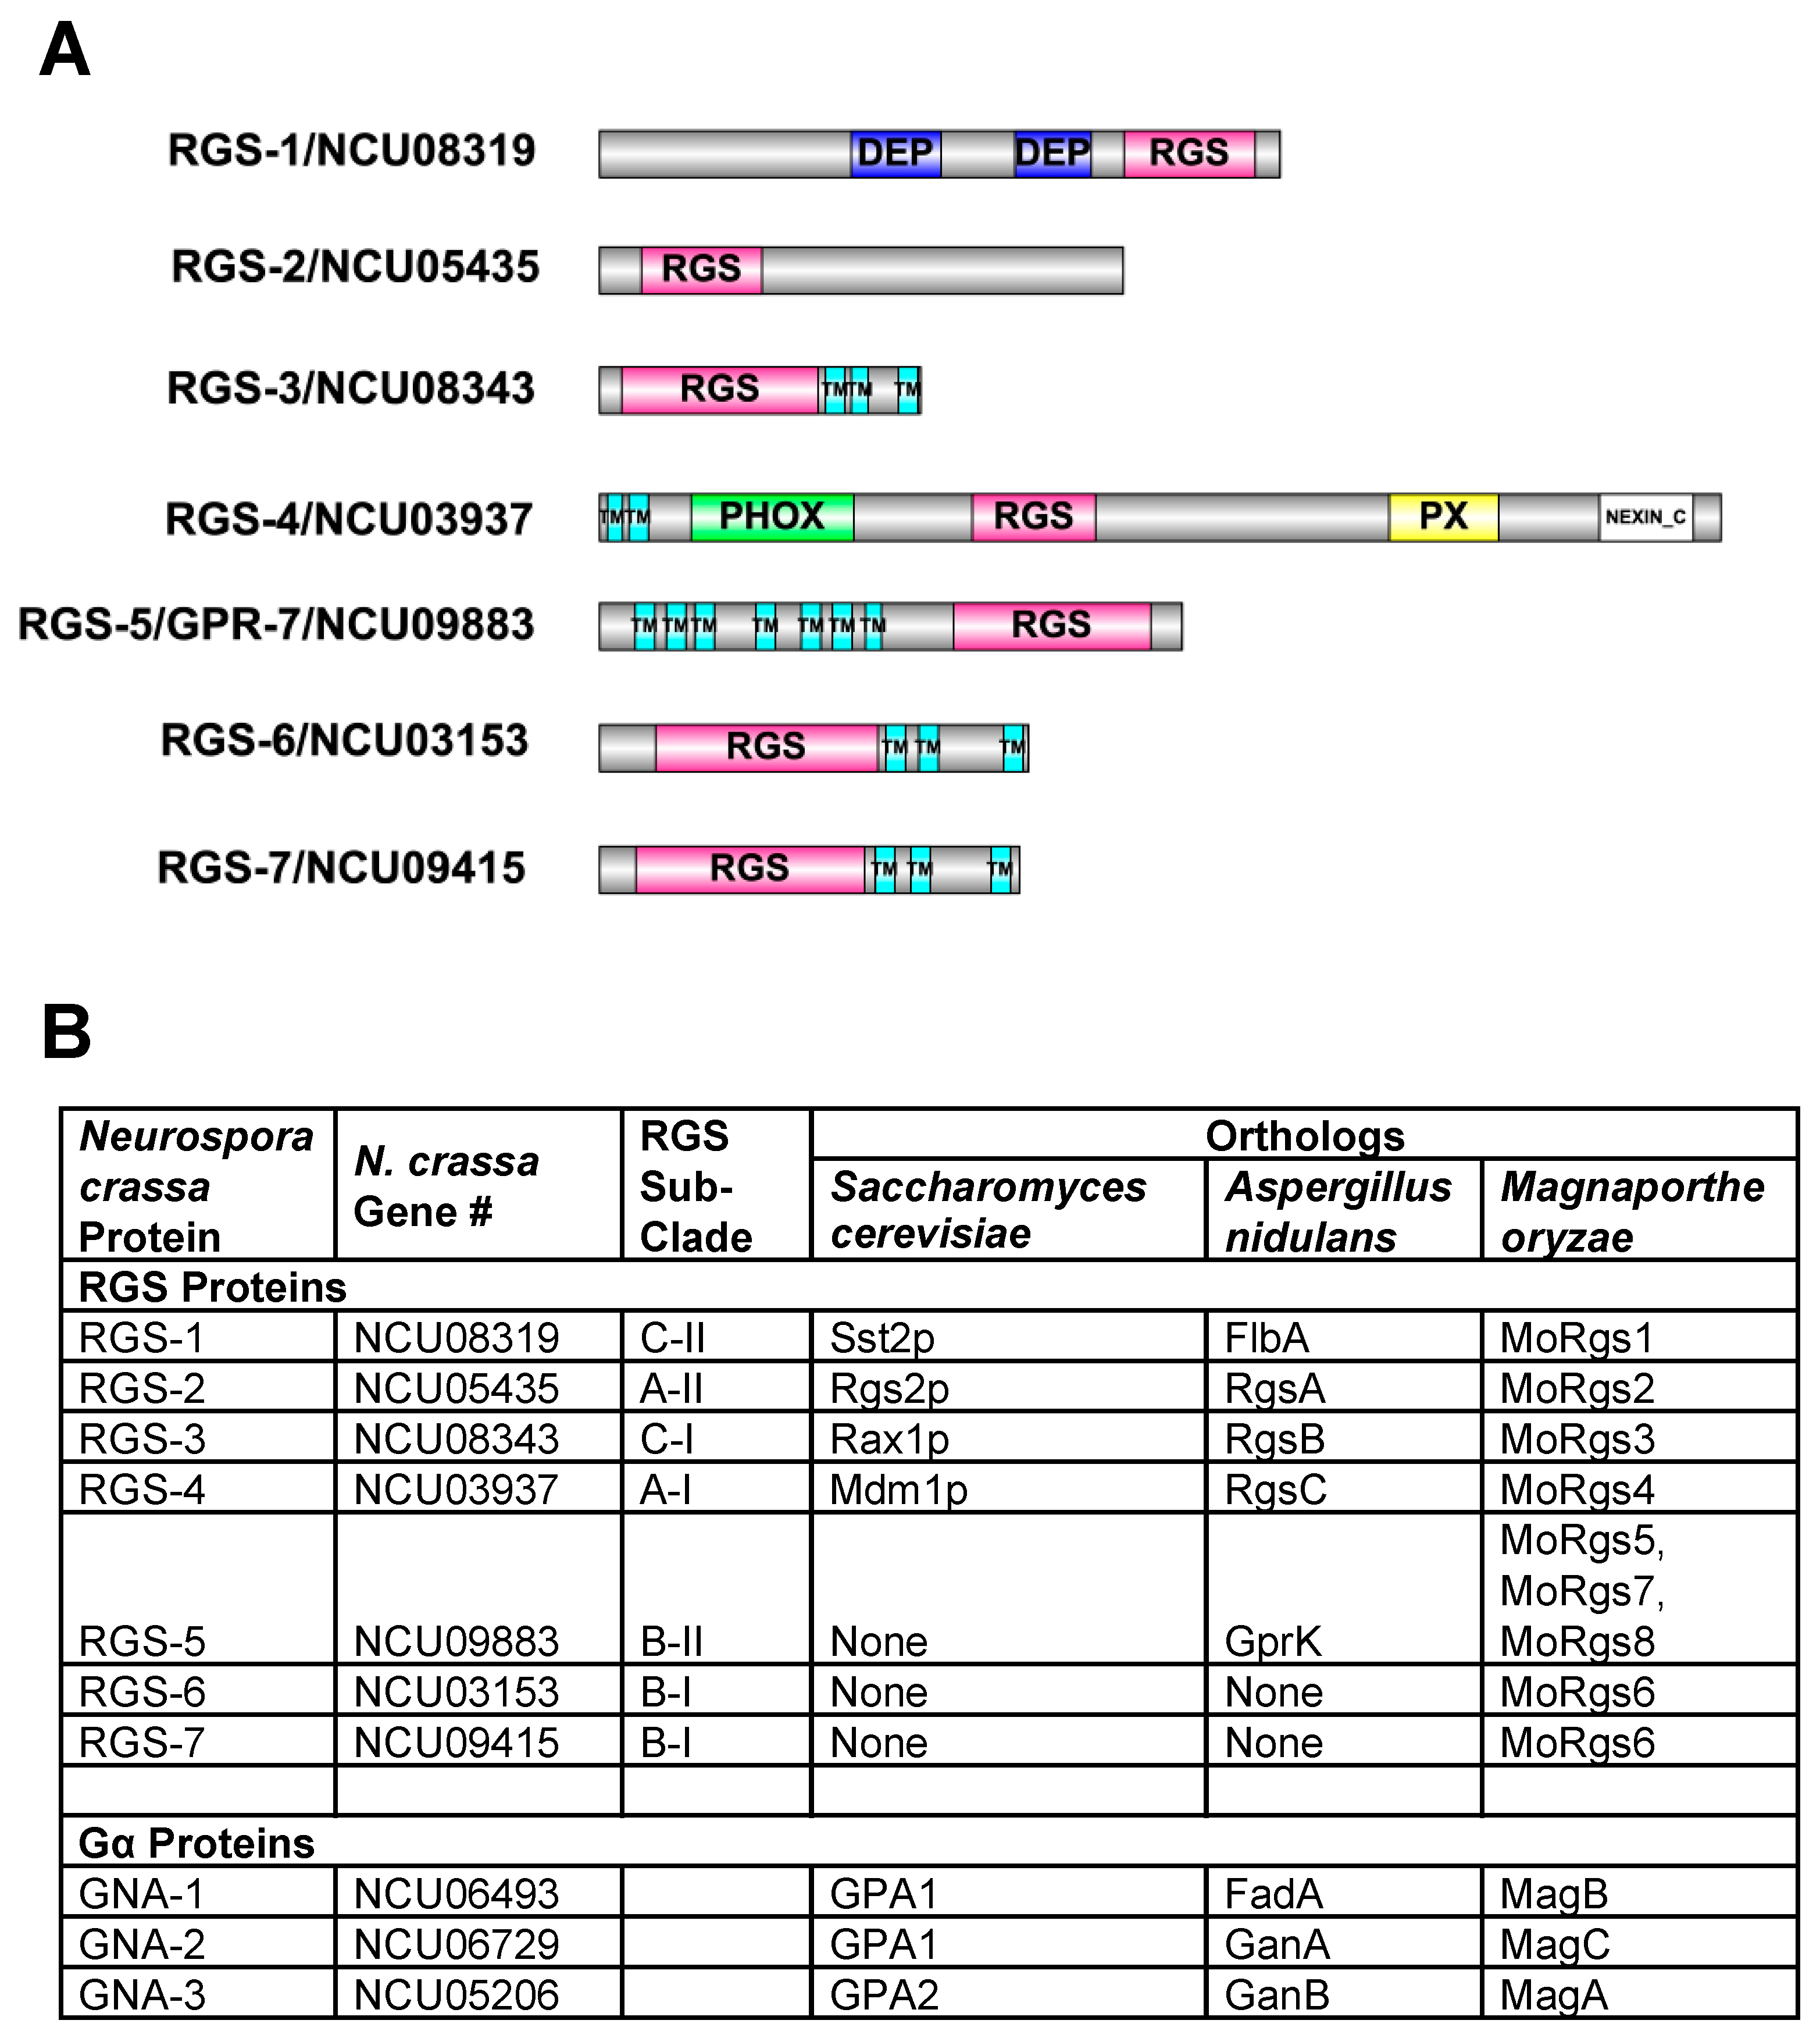
3.1. The N. crassa Genome Contains Seven Predicted RGS Genes

RGS genes have been identified in numerous fungal species, including Saccharomyces cerevisiae, Aspergillus nidulans and Magnaporthe oryzae (rev. in [26]). BLAST searches of the N. crassa genome sequence revealed evidence for seven genes encoding RGS proteins [26]; (this study). All seven N. crassa RGS proteins contain a highly conserved RGS box [47] (Figure 1A). RGS-3, RGS-4, RGS-6 and RGS-7 possess 2-3 transmembrane domains. RGS-5 contains seven transmembrane helices, similar to G Protein Coupled Receptors, and was previously characterized as GPR-7 in N. crassa [48]. RGS-1 possesses two Dishevelled/Egl-10/Pleckstrin (DEP) domains, implicated in membrane association and found in many proteins involved in spatial regulation of signal transduction [49]. In addition to its two transmembrane helices, RGS-4 contains PX, PHOX and NEXIN_C domains. These three domains are typically found on proteins involved in protein sorting/secretion. PX and PHOX mediate phosphoinositide binding [50,51], while the NEXIN_C (sorting Nexin, C-terminal) motif is found on proteins involved in endosomal sorting [52].
Using phylogenetic analysis, three major clades of RGS proteins were identified in fungi, and these were further divided into six sub-clades, termed A-I, A-II, B-I, B-II, C-I and C-II (Figure 1B) [26]. Using this organizational framework [26], we note that N. crassa has at least one ortholog in all six sub-clades, with two in the B-I class (RGS-6 and RGS-7). In contrast, S. cerevisiae has only four of the sub-clades and A. nidulans lacks the sub-clade with two N. crassa members (B-I; Figure 1B). M. oryzae has at least one member in the six sub-clades, with three in B-II ([26]; Figure 1B; although M. oryzae RGS-5 lacks transmembrane domains). In spite of the observation that N. crassa RGS-3, RGS-6 and RGS-7 have a similar protein domain structure (Figure 1A), RGS-3 is well-separated in a sub-clade distinct from RGS-6 and RGS-7 in the phylogenetic tree [26]. Regarding Gα subunits, N. crassa, A. nidulans and M. oryzae all share three conserved proteins, while the yeast S. cerevisiae has two Gα proteins (Figure 1B).

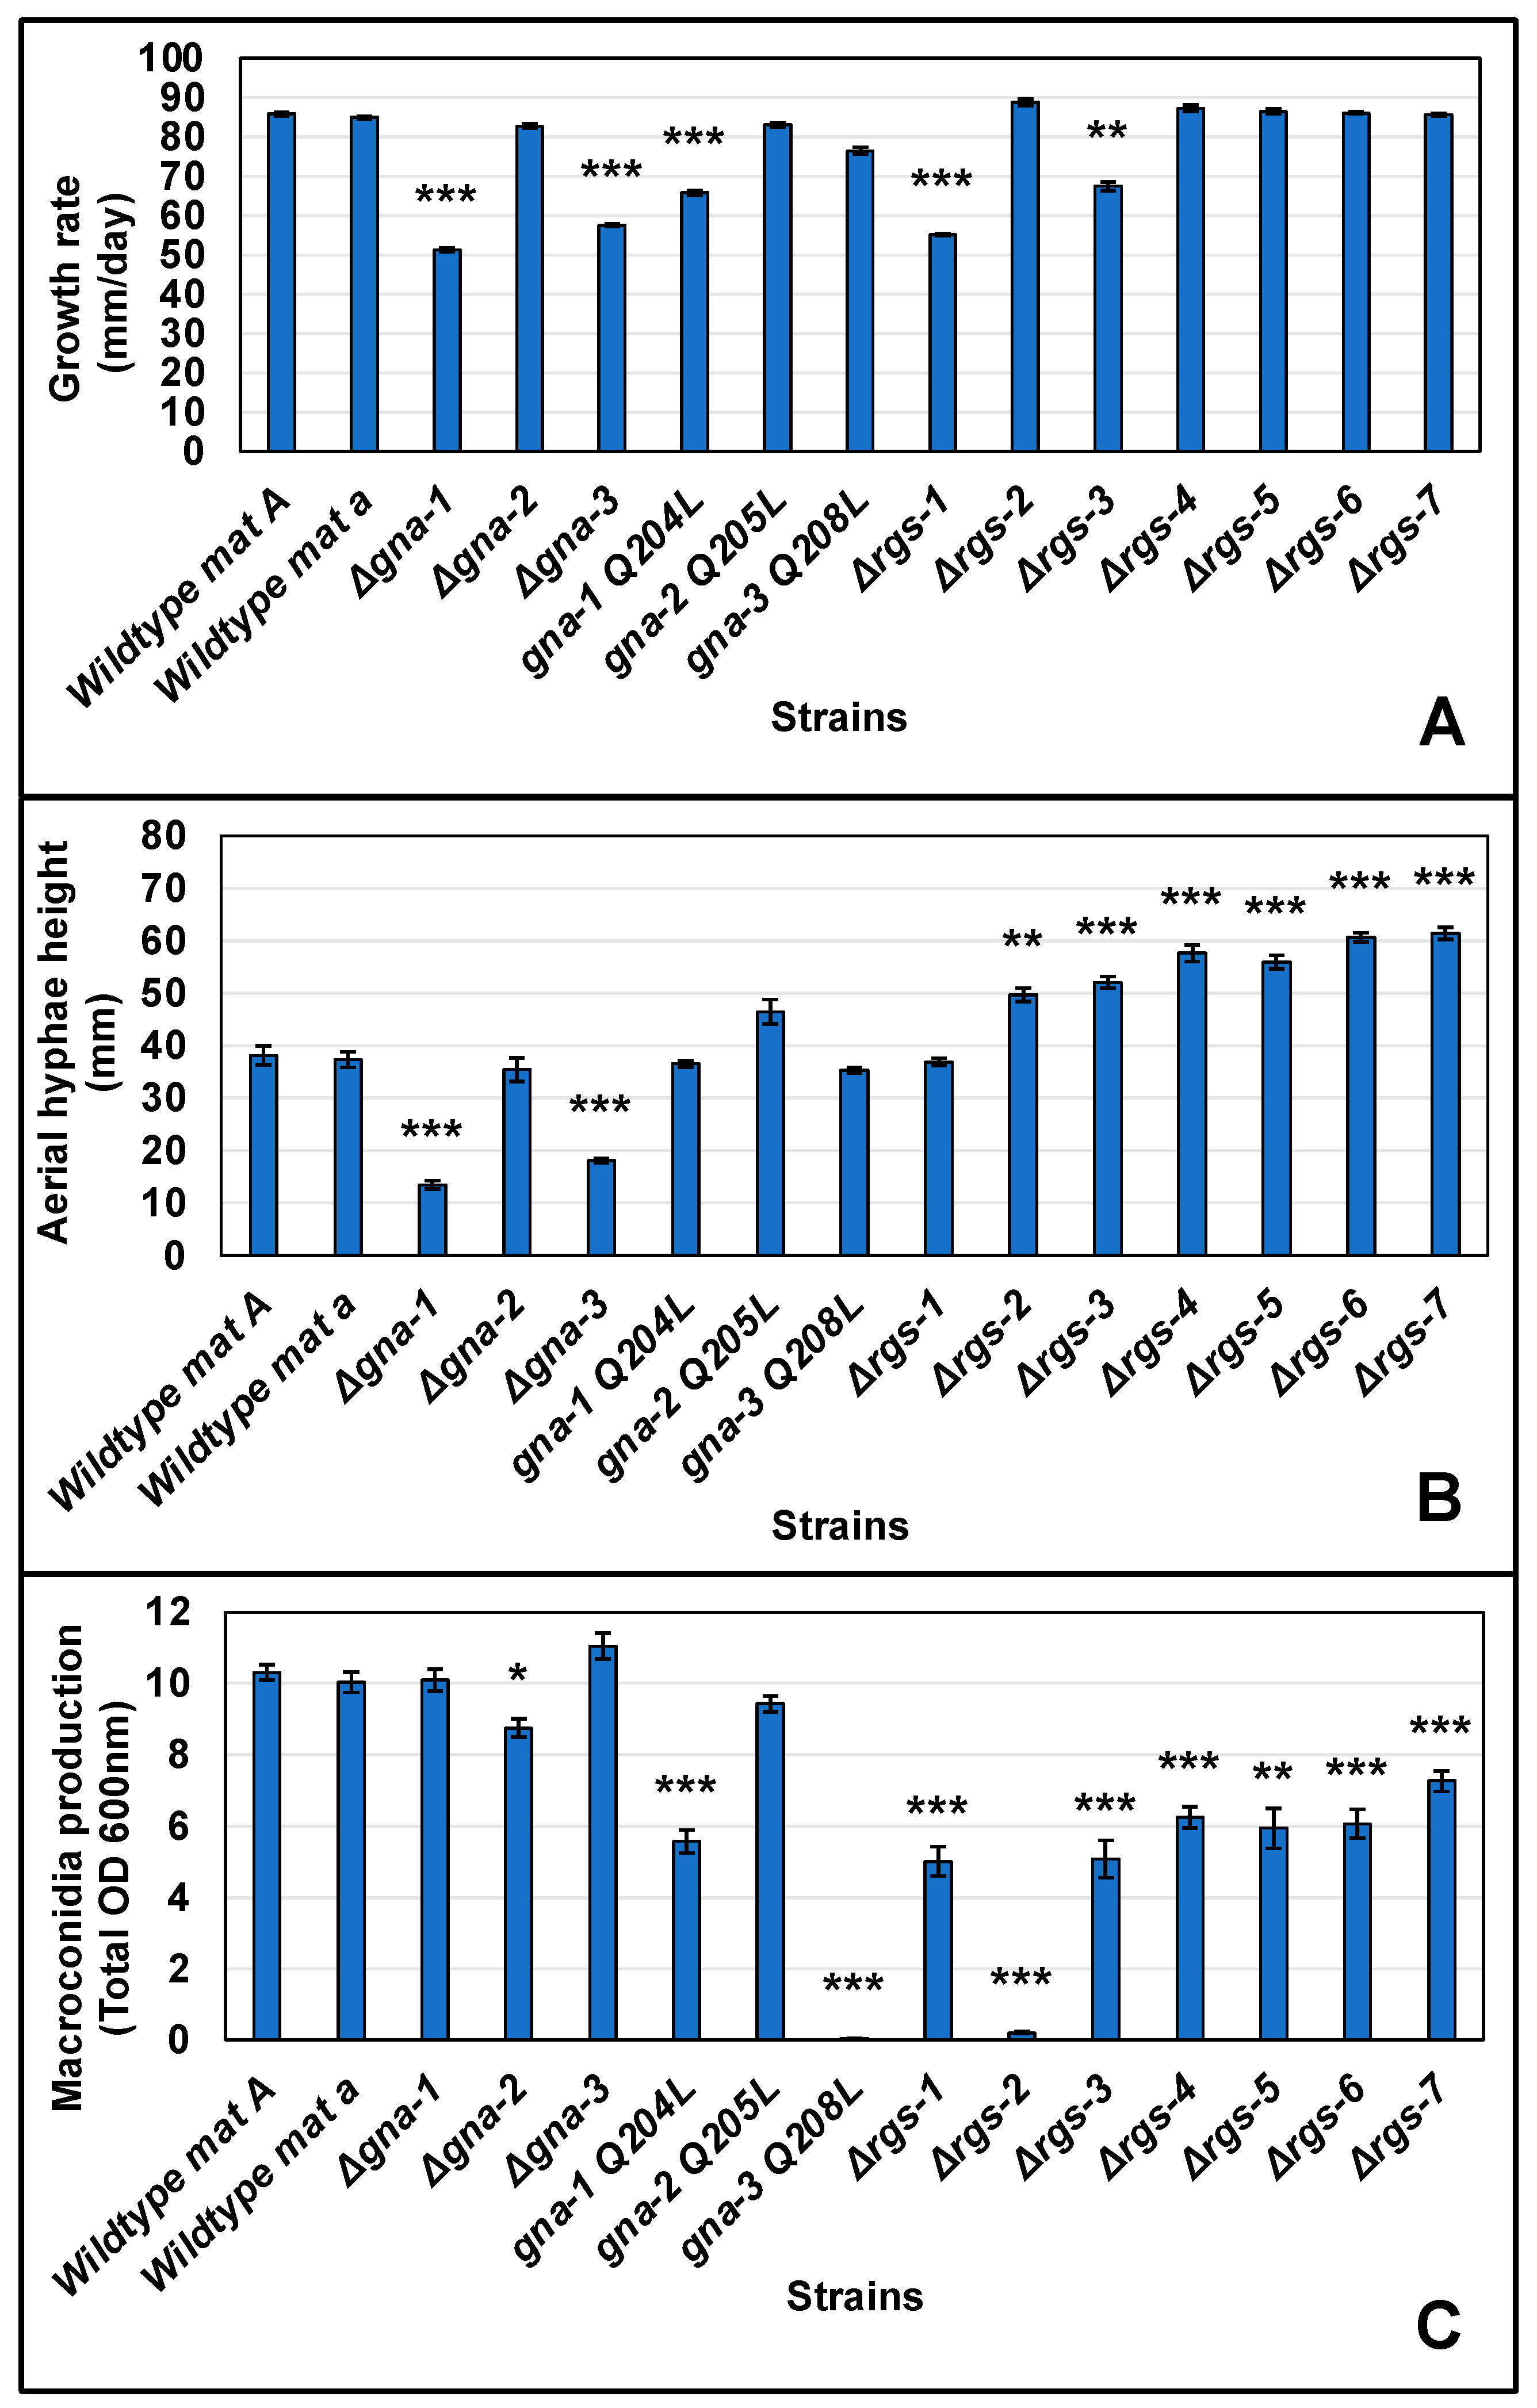
3.2. Assessment of Quantitative Phenotypes in Strains with Mutations in RGS or Gα Subunit Genes during Growth and Asexual Development

Previous research has shown that the three Gα protein subunits have important functions during growth and development in N. crassa, with GNA-2 often serving a compensatory role to GNA-1 and GNA-3 [11,12,13,19,20]. In this study, we investigated roles for the seven RGS genes during the N. crassa life cycle. We analyzed single mutants lacking an RGS or Gα gene and strains expressing a constitutively active, GTPase-deficient Gα allele (gna-1Q204L, gna-2Q205L or gna-3Q208L). Since RGS proteins function as negative regulators of Gα proteins, we expect that if a particular RGS regulates a specific Gα subunit, we would observe similar phenotypes in strains deleted for the RGS gene and those that express a constitutively active Gα gene allele. In order to ensure that phenotypes in the rgs mutants resulted from loss of the rgs gene, we also analyzed rgs deletion mutants expressing a pan-2 targeted version of the RGS gene in trans (see Section 2 and Table 1). These complemented strains exhibited significant or complete complementation of phenotypes during the lifecycle, including hyphal growth rate, aerial hyphae height, macroconidiation, and female fertility during sexual development (Figure S3).
We first assessed the effects of mutations in the RGS and Gα genes on the growth rate of basal hyphae when N. crassa is cultured on solid medium (Figure 2A and Figure S4). Consistent with results from previous studies, of the three Gα subunit mutants, those lacking gna-1 or gna-3 had significantly slower growth rates relative to wild type [11,13]. Strains carrying the gna-1Q204L allele also had significantly slower growth rates than wild type mat A. Of the RGS mutants, Δrgs-1 and Δrgs-3 strains were significantly slower than wild type (~64% of wild type mat A). Based on these results, it is plausible that rgs-1 and/or rgs-3 have a genetic interaction with gna-1, as the gna-1Q204L and Δrgs-1 and Δrgs-3 strains all grow more slowly than wild type. In particular, the gna-1Q204L and Δrgs-3 strains are indistinguishable from one another (Figure S4). However, this interpretation is complicated by the observation of slower growth in strains with null or activating mutations in gna-1.
We next explored phenotypes during asexual sporulation (macroconidiation). Regarding the height of aerial hyphae, six of the RGS deletion mutants (Δrgs-2, Δrgs-3, Δrgs-4, Δrgs-5, Δrgs-6 and Δrgs-7) possessed significantly taller aerial hyphae than wild type (Figure 2B and Figure S5). In contrast, mutants lacking the gna-1 or gna-3 genes had significantly shorter aerial hyphae than wild type. However, the absence of a phenotype in any strain expressing a constitutively activated Gα allele prevents proposing a genetic interaction between a Gα gene and any of the six RGS genes during formation of aerial hyphae. More evidence for epistasis was obtained for quantitation of macroconidia production in agar cultures (Figure 2C and Figure S6). In opposition to the results for aerial hyphae height, all seven RGS knockout mutants produced significantly less macroconidia than wild type during growth on agar medium, with effects most severe in Δrgs-2 strains (Figure 2C and Figure S6). Of the three Gα deletion mutants, only Δgna-2 differed significantly from wild type, and only from one mating type. However, strains expressing activated versions of gna-1 or gna-3 produced significantly less macroconidia than wild type, with gna-3Q208L being most affected. The gna-1Q204L strain only differs significantly from Δrgs-2, suggesting a possible genetic interaction with the other six rgs genes. In contrast, gna-3Q208L macroconidia production is most similar to that of Δrgs-2 mutants, supporting a genetic interaction between rgs-2 and gna-3 during control of macroconidia production on solid medium.
We have previously demonstrated that strains lacking gna-3 inappropriately produce macroconidia in submerged cultures at a relatively low inoculation density of 5 × 10⁵ or 1 × 10⁶ cells/mL [13,53]. In contrast, Δgna-1 mutants only produce macroconidia at a higher inoculation density (3 × 10⁶ cells/mL; [53,54]). In the current study, we assessed macroconidiation in submerged cultures inoculated at the low density of 1 × 10⁶ cells/mL. Consistent with our earlier results, Δgna-3 mutants produced macroconidia in submerged liquid cultures. No macroconidia were produced in any of the other Gα or rgs deletion mutants, or in strains expressing constitutively activated Gα alleles.

3.3. rgs-1 and rgs-2 Exhibit Epistatic Interactions with gna-1 or gna-3 during the Sexual Cycle

We analyzed the strains for three major events during sexual development: the production of protoperithecia, perithecia and ascospores. The findings confirmed published results for the three Gα mutants [11,12,13,19,20], with Δgna-2 being like wild type, Δgna-1 producing abnormal perithecia and no ascospores, and Δgna-3 forming fewer protoperithecia and perithecia than wild type (Table 2). Consistent with previous findings, strains carrying the gna-1Q204L allele produced fewer perithecia and ascospores than wild type [11,19], while gna-2Q205L strains were normal [12]. In this study, we also observed that gna-3Q208L strains did not produce protoperithecia, perithecia or ascospores (Table 2). The female fertility of Δrgs-3, Δrgs-4, Δrgs-5, Δrgs-6 and Δrgs-7 strains was similar to wild type. In contrast, Δrgs-1 mutants did not produce protoperithecia, perithecia or ascospores, while Δrgs-2 mutants formed protoperithecia, but reduced numbers of perithecia and ascospores (Table 2). From the phenotypes, it is plausible that gna-3 shares an epistatic relationship with rgs-1 during sexual development, in that Δrgs-1 and gna-3Q208L strains share the same severe sexual cycle phenotypes. In contrast, gna-1Q204L strains are most similar to Δrgs-2 mutants, consistent with an epistatic relationship between the two genes (Table 2). Thus, it appears that the genetic interactions with gna-1 and gna-3 are switched for rgs-1 and rgs-2 during asexual vs. sexual development.

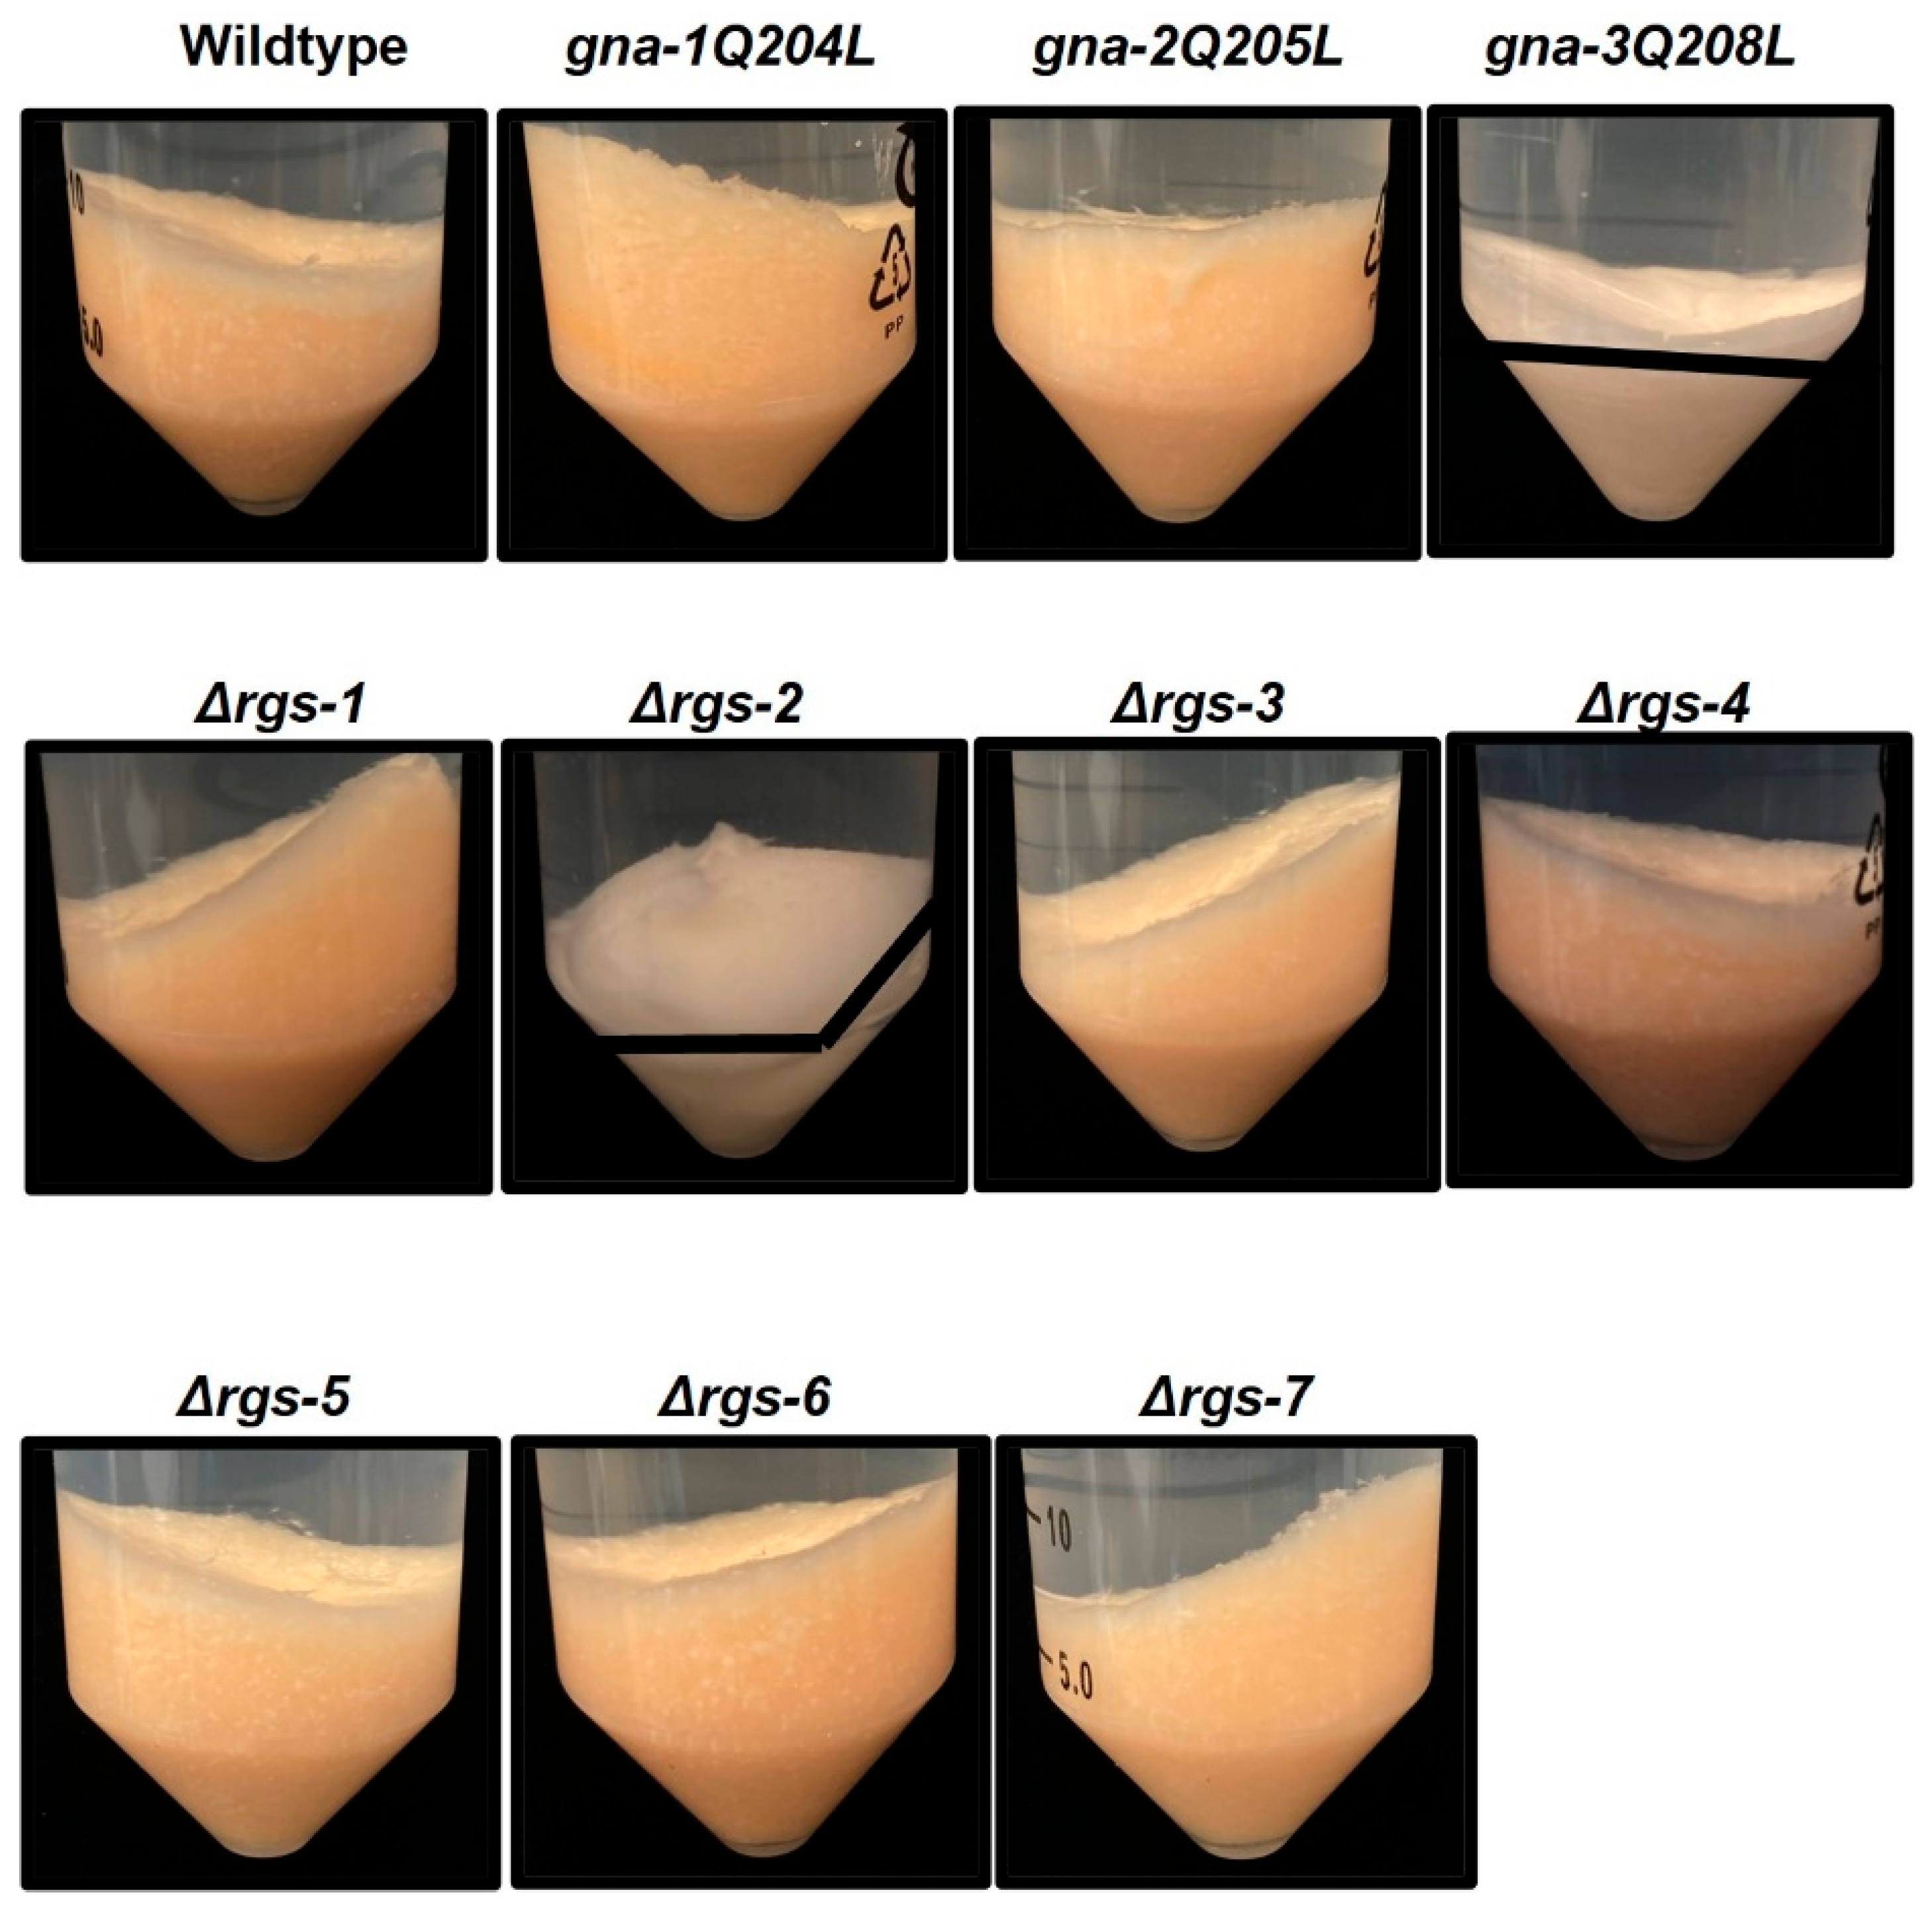
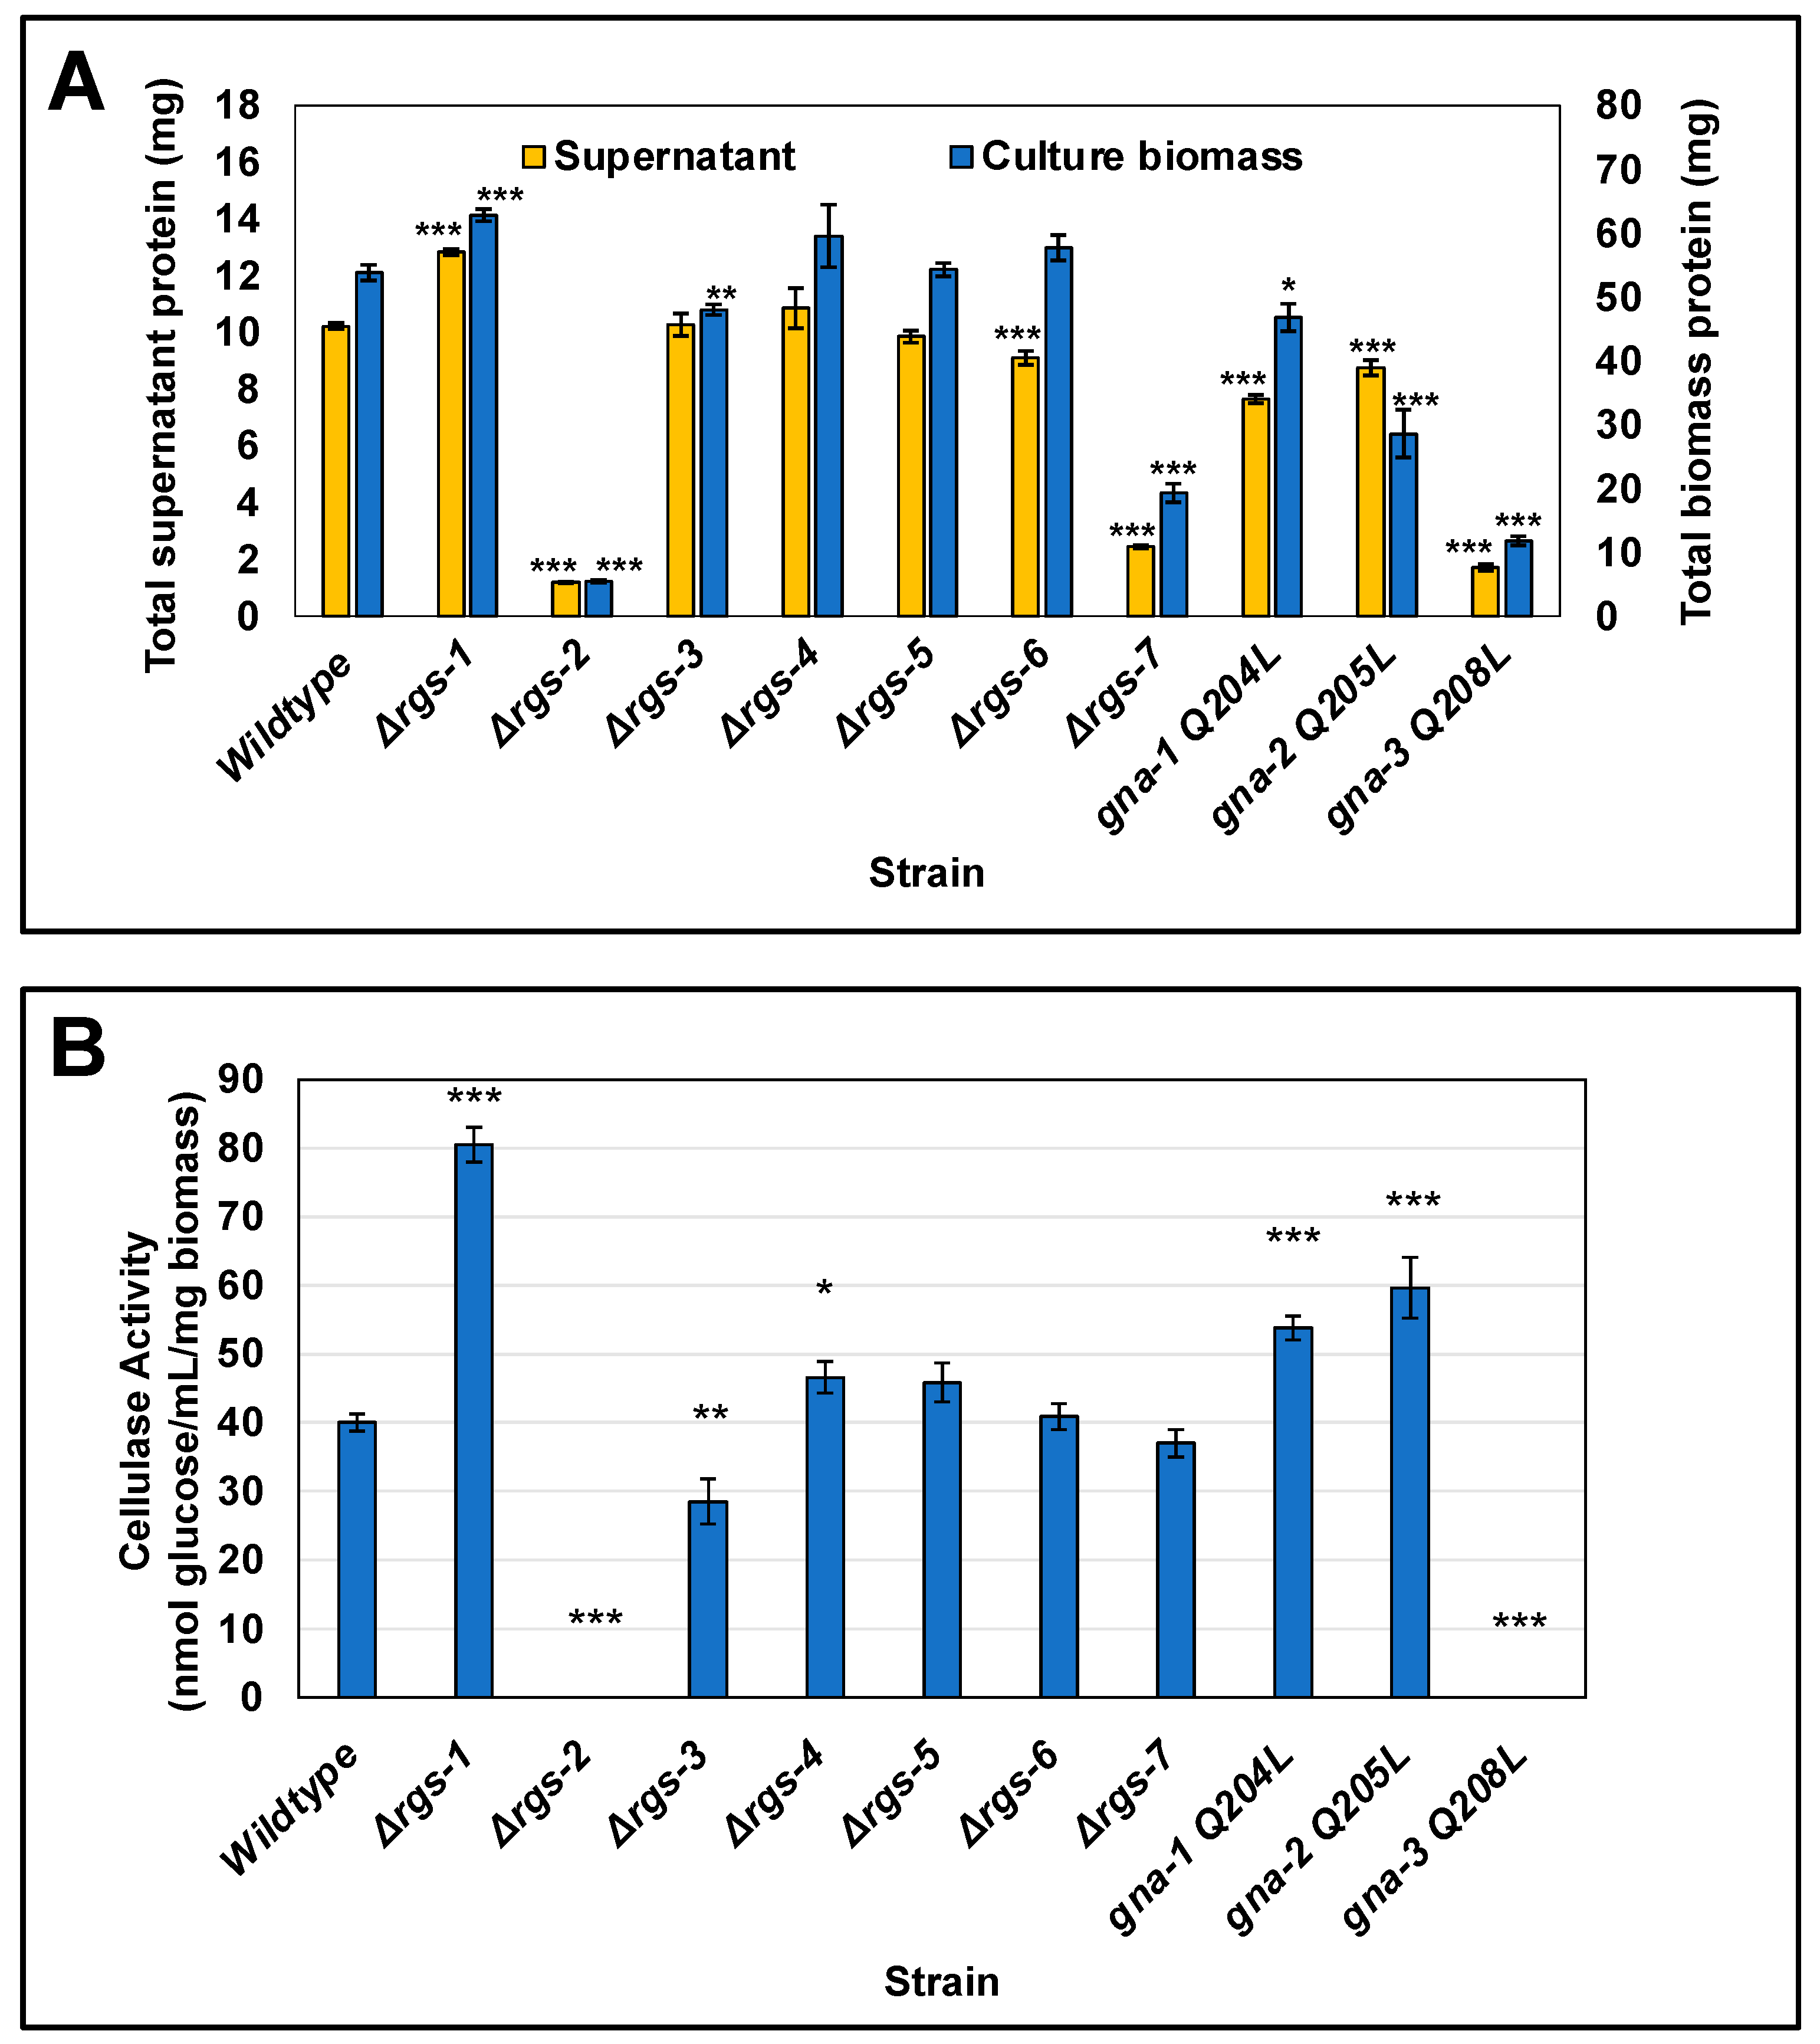
3.4. Five of the RGS Gene Deletion Mutants Have Phenotypes during Growth on Cellulose and/or in Extracellular Cellulase Activity

The analysis presented above suggests that RGS proteins work in concert with Gα subunits to regulate some aspects of growth and development on medium with sucrose as the carbon source. We next asked whether additional roles for RGS proteins might be observed during growth with cellulose as the sole carbon source. Like other filamentous fungi, N. crassa degrades lignocellulosic biomass to generate soluble sugars to use as carbon sources [55]. Cellulose, the most abundant plant polymer in nature, can be degraded to produce glucose monomers (so-called glucose release activity) by a cocktail of secreted enzymes in N. crassa [55]. We previously assessed glucose release cellulase activity in cell-free supernatants from G protein mutants by growing cultures on glucose overnight and then transferring to Avicel (crystalline cellulose) for 3 days prior to collecting supernatants for analysis [21]. The results showed that mutants lacking the Gα genes gna-1 or gna-3 or components of the Gβγ dimer (gnb-1, cpc-2 or gng-1) do not possess detectable glucose release activity [21]. Of interest, strains expressing the gna-3Q208L allele do not produce glucose release activity unless the gnb-1 gene is deleted; this result suggested that a positive role for GNA-3 in regulating cellulase activity is masked by the presence of the Gβ subunit GNB-1 [21]. In contrast to the results for gna-3, constitutive activation of gna-1 or gna-2 does not lead to reduced cellulase activity [21].
We began our analysis by assessing relative levels of expression for Gα subunits and the seven rgs genes in wild type during growth on sucrose vs. cellulose (Avicel). For this work, we took advantage of a publicly available RNAseq dataset [42] (Figure S7). The results showed that gna-1 is the most highly expressed of the 10 genes during growth on sucrose. Of interest, mRNA levels of gna-2, rgs-3, rgs-4 and rgs-6 are all significantly higher on Avicel vs. sucrose medium, consistent with possible functions during growth on cellulose.
We next explored a role for RGS genes in cellulose degradation using a method we used previously [21]. We inoculated macroconidia into medium with Avicel as the carbon source and then grew the cultures with shaking for 3 days. Because the white Avicel is insoluble, we were able to assess the relative amount of residual Avicel in cultures after centrifugation (Figure 3). After three days, no visible Avicel remained in cultures of the wild-type, gna-1Q204L, gna-2Q205L, Δrgs-1, Δrgs-3, Δrgs-4, Δrgs-5 and Δrgs-6 strains. The results for the gna-1Q204L and gna-2Q205L strains correlate with our previous observations of normal cellulase activity in these genetic backgrounds [21]. In contrast, gna-3Q208L, Δrgs-2 and Δrgs-7 cultures contained some residual Avicel (Avicel was distributed throughout the hyphae in the Δrgs-7 mutant). These results suggest that these two RGS genes are required for complete degradation of cellulose into soluble cellodextrins in N. crassa. The observation that the gna-3Q208L strain is unable to efficiently utilize Avicel is consistent with our previous result demonstrating that this strain lacks detectable glucose release cellulase activity [21].
Our second approach to assess possible functions for RGS genes in cellulose degradation was to measure levels of protein and cellulase activity (glucose release from Avicel) in culture supernatants, as well as total protein in the mycelial mat from the seven RGS mutants and wild type grown as described for Figure 3. Levels of supernatant protein were similar to wild type in Δrgs-3, Δrgs-4 and Δrgs-5 strains, were elevated in Δrgs-1 strains and reduced in Δrgs-2, Δrgs-6, Δrgs-7, gna-1Q204L, gna-2Q205L and gna-3Q208L strains (Figure 4A and Figure S8). For biomass protein, levels in the Δrgs-4, Δrgs-5 and Δrgs-6 strains were normal, but were increased in Δrgs-1 and gna-1Q204L strains and decreased in Δrgs-2, Δrgs-3, Δrgs-7, gna-2Q205L and gna-3Q208L strains (Figure 4A and Figure S9). The Δrgs-1 mutant is the only strain with significantly higher levels for both secreted and biomass protein than wild type (Figure 4A and Figures S8 and S9). In contrast, protein levels in the Δrgs-2 and Δrgs-7 mutants and the gna-3Q208L strain are less than 50% of those observed in wild type (Figure 4A), suggesting a possible regulatory interaction between gna-3 and rgs-2 and/or rgs-7 in control of biomass accumulation and secreted protein levels during growth on cellulose. The observation of reduced biomass protein levels in the gna-3Q208L, Δrgs-2 and Δrgs-7 strains is consistent with the presence of residual Avicel in these cultures after three days (Figure 3).
Glucose release cellulase activity in Δrgs-5, Δrgs-6 and Δrgs-7 mutants is similar to wild type (Figure 4B and Figure S10). Of note, Δrgs-1 mutants have significantly greater activity than wild type (~two-fold increased; Figure 4B and Figure S10). The only other RGS mutant with significantly elevated (p < 0.05; Figure S10) activity relative to wild type is Δrgs-4. Elevated cellulase activity is also observed in the gna-1Q204L and gna-2Q205L strains (Figure 4B and Figure S10), consistent with a possible epistatic relationship between rgs-1 and/or rgs-4 and gna-1 and/or gna-2. In contrast, Δrgs-3 mutants had significantly reduced activity relative to wild type and cellulase activity could not be detected in Δrgs-2 mutants and gna-3Q208L strains (Figure 4B). These results suggest possible epistasis between gna-3 and rgs-2 and/or rgs-3.
We previously showed that cell-free supernatants from G protein mutants with reduced cellulase activity exhibited altered protein banding patterns after SDS-PAGE [21]. By loading equal volumes (not protein) of supernatant on the gel, differences in protein concentration and the protein banding patterns of each strain are highlighted; the SDS-PAGE gel gives a visual representation of the data obtained for supernatant protein concentration (analogous to Figure 4A). In order to investigate these parameters for the RGS mutants, we subjected equal volumes of concentrated cell-free supernatants to SDS-PAGE (Figure 5). As in our earlier study, several major bands were observed in wild type, with the most abundant at ~70 kDa. This band corresponds to the migration position of many cellulase enzymes [56]. We previously demonstrated via single-band proteomics that the most abundant protein in the ~70kDa band in wild type is cellobiohydrolase CBH-1 (NCU07340), at 41% of the total [21]. Other proteins found in lesser amounts in this band were the β-glucosidase gh3-4 (13% ± 0%), the cellobiose dehydrogenase CDH-1 (4% ± 1%), and the cellobiohydrolase gh6-2 (otherwise known as CBH-2; 2% ± 1%) [21]. Inspection of the stained SDS-PAGE gel in the current study revealed that levels of the 70-kDa band were greatly reduced in Δrgs-2, Δrgs-7 and gna-3Q208L strains (Figure 5), consistent with reduced or non-detectable cellulase activity (Figure 4B). In contrast, levels of the 70kDa band were clearly elevated in the Δrgs-1 mutant, in keeping with the significantly higher cellulase activity observed in this strain relative to wild type.

4. Discussion

In this study, we characterized phenotypes for mutants lacking the seven RGS genes and compared them to those of strains carrying constitutively activated alleles for each of the three Gα genes (see Table 3 for summary). Our results revealed the strongest support for epistatic relationships between Gα and RGS genes during asexual and sexual development and in regulation of secreted cellulase activity. Strains expressing gna-1Q204L or lacking gna-1, rgs-1 or rgs-3 have significantly slower hyphal growth rates than wild type, suggesting possible genetic interactions between gna-1 and rgs-1 and/or rgs-3 during hyphal growth. RGS-1 and RGS-3 orthologs are required for hyphal growth in other fungi in which they have been studied. For example, RGS-1 orthologs regulate hyphal growth in A. nidulans, A. fumigatus and M. oryzae [26,57,58]. MoRgs3 is required for spore germination and germ tube growth, along with appressorium formation and virulence in M. oryzae [58]. In A. fumigatus, mutation of the rgs-3 ortholog rax1 leads to slower growth and decreased conidiation relative to wild type [28]. In S. cerevisiae the RGS-3 ortholog Rax1p is necessary for bipolar budding and cell proliferation [59].
We obtained strong evidence for an epistatic relationship between gna-3 and rgs-2 during control of macroconidiation. In the case of gna-1, the results supported a possible interaction with the other six RGS genes. These findings can be compared with those from A. nidulans, where the orthologs of RGS-1 (FlbA) and RGS-2 (RgsA) were predicted to act on those for GNA-1 (FadA) and GNA-3 (GanB), respectively, to control asexual sporulation [57,60]. However, these earlier reports did not include the additional RGS genes later identified in A. nidulans. In a study performed using A. flavus, mutants lacking all six RGS genes and a strain expressing mutationally activated fadA allele were analyzed [31]. The results showed that activation of fadA or loss of the RGS genes rgsA, rgsC or rgsD (orthologs of N. crassa rgs-2, rgs-4 and rgs-5, respectively) results in increased conidia production relative to wild type, suggesting possible epistasis between fadA and these three RGS genes. In contrast, loss of flbA (N. crassa rgs-1 ortholog) led to greatly reduced conidia production [31]. Thus, the GNA-1 ortholog possesses an epistatic interaction with different RGS genes in two different Aspergillus species during control of asexual sporulation.
In previous studies, we have noted an inverse relationship between aerial hyphae height and macroconidia abundance/premature macroconidiation for G protein signaling mutants in N. crassa. Examples are strains with constitutive activation of gna-1 or loss of gna-1, gna-3, gnb-1, gng-1 or cr-1 [11,13,17,20,54]. Our new results for the gna-3Q208L allele break this paradigm, as the strain has very short aerial hyphae and also produces few macroconidia. We have previously demonstrated an antagonistic role for GNB-1 towards GNA-3 during control of extracellular cellulase activity [21]. Our findings of decreased aerial hyphae and macroconidia formation in gna-3Q208L strains may point to a more general role for GNB-1 in antagonizing signaling by GNA-3 in N. crassa.
It is noteworthy that RGS-1 appears to regulate GNA-3, while RGS-2 controls GNA-1 during sexual differentiation, which is in opposition to the epistatic relationships noted during asexual growth and development and cellulase activity. In M. oryzae, evidence indicates that MoRgs1 and MoRgs4 are required for perithecia formation and mating, and that MoRgs1 acts through regulation of the N. crassa GNA-1 ortholog MoMagB [58]. Although the GNA-1 ortholog FadA is required for sexual development (cleistothecia formation and ascospore production) in A. nidulans [61], roles for RGS proteins during sexual differentiation have not yet been reported in this species [26].
We previously hypothesized that cycling of GDP and GTP on the Gα subunit GNA-1 is necessary for female fertility in N. crassa, since introduction of a GTPase-deficient form of the gna-1 Gα gene into a mutant lacking the coupled pheromone receptor did not rescue its female sterility [62]. In this study, we demonstrate that loss of rgs-2 leads to similar sexual cycle defects as constitutive activation of gna-1, in keeping with a role for RGS-2 in activating the GTPase activity of GNA-1. Our results for gna-3Q208L strain showed that constitutive activation of gna-3 blocks the very earliest step of female fertility—formation of protoperithecia—consistent with a requirement for GDP/GTP cycling on GNA-3 during sexual development. Thus, the sexual cycle defects newly observed in gna-3Q208L, Δrgs-1 and Δrgs-2 mutants in our current study not only support our earlier hypothesis based on GNA-1, but also extend the proposed model to GNA-3.
Our finding of altered cellulase activity in four of the seven RGS knockout mutants further enlarges the number of G protein signaling-related components that are required for cellulase production in N. crassa. Activation of gna-1 or gna-2 did not lead to higher cellulase activity relative to wild type in our earlier study, which involved growth of strains in glucose overnight followed by transfer to Avicel medium for three days prior to collection [21]. This contrasts with our current results obtained using strains inoculated directly into medium containing Avicel. Under these conditions, we observed highly significant (p < 0.001) and elevated cellulase activity in gna-1Q204L and gna-2Q205L strains and the Δrgs-1 mutant. These new results suggest that RGS-1 may function as a GAP for GNA-1 and/or GNA-2 during regulation of cellulase activity. In contrast, the complete absence of detectable cellulase activity in the gna-3Q208L strain observed here and in our previous study [21], and for Δrgs-2 in this work (p < 0.001), supports a model in which RGS-2 acts as a GAP for GNA-3 during regulation of cellulase activity in N. crassa.

Supplementary Materials

The following supporting information can be downloaded at: https://www.mdpi.com/article/10.3390/jof8101076/s1, Figure S1: Genotyping of RGS knockout deletion mutants using PCR.; Figure S2: Genotyping of RGS complemented strains using PCR; Figure S3: Representative phenotypes of complemented Δrgs mutants; Figure S4: Significance testing for basal hyphae growth rate measurements; Figure S5: Significance testing for aerial hyphae height measurements; Figure S6: Significance testing for macroconidia measurements; Figure S7: Expression of RGS and Gα subunit genes on Avicel and sucrose; Figure S8: Significance testing for supernatant protein measurements; Figure S9: Significance testing for biomass protein measurements; Figure S10: Significance testing for glucose release cellulase activity measurements; Table S1: Primers used in this study.

Author Contributions

Conceptualization, K.A.B.; Data curation, I.E.C., Y.O., A.J.C. and L.A.C.; Formal analysis, I.E.C. and L.A.C.; Funding acquisition, K.A.B.; Investigation, Y.O., S.J.W. and L.L.; Methodology, I.E.C., A.J.C., L.A.C., S.J.W. and L.L.; Project administration, K.A.B.; Writing—original draft, I.E.C.; Writing—review and editing, Y.O., A.J.C., L.A.C. and K.A.B. All authors have read and agreed to the published version of the manuscript.

Funding

Ilva E. Cabrera was supported by an NSF IGERT Video Bioinformatics Grant DGE 0903667. This work was partially supported by National Institutes of Health grants GM068087 and GM086565 and National Institute of Food and Agriculture Hatch Project #CA-R-PPA-6980-H to Katherine A. Borkovich.

Institutional Review Board Statement

Not applicable.

Informed Consent Statement

Not applicable.

Data Availability Statement

All data reported in this paper are available in the main text or the Supplementary Materials.

Acknowledgments

We thank Hyojeong Kim for construction of the Δ1gna-1* strain and Caleb Hubbard for assistance with microscopy. We acknowledge the Fungal Genetics Stock Center for providing Neurospora crassa strains.

Conflicts of Interest

The authors declare no conflict of interest.

References

  1. Borkovich, K.A.; Alex, L.A.; Yarden, O.; Freitag, M.; Turner, G.E.; Read, N.D.; Seiler, S.; Bell-Pedersen, D.; Paietta, J.; Plesofsky, N.; et al. Lessons from the genome sequence of Neurospora crassa: Tracing the path from genomic blueprint to multicellular organism. Microbiol. Mol. Biol. Rev. 2004, 68, 1–108. [Google Scholar] [CrossRef] [PubMed] [Green Version]
  2. Selker, E.U. Neurospora. Curr. Biol. 2011, 21, R139–R140. [Google Scholar] [CrossRef] [PubMed] [Green Version]
  3. Davis, R.H.; Perkins, D.D. Timeline: Neurospora: A model of model microbes. Nat. Rev. Genet. 2002, 3, 397–403. [Google Scholar] [CrossRef] [PubMed]
  4. Harris, S.D. Septum formation in Aspergillus nidulans. Curr. Opin. Microbiol. 2001, 4, 736–739. [Google Scholar] [CrossRef]
  5. Fleissner, A.; Serrano, A. The Art of Networking: Vegetative Hyphal Fusion in Filamentous Ascomycete Fungi. In The Mycota: Growth, Differentiation and Sexuality; Wendland, J., Ed.; Springer: Berlin/Heidelberg, Germany, 2016; Volume 1, pp. 133–153. [Google Scholar]
  6. Springer, M.L. Genetic control of fungal differentiation: The three sporulation pathways of Neurospora crassa. Bioessays 1993, 15, 365–374. [Google Scholar] [CrossRef]
  7. Raju, N.B. Neurospora as a model fungus for studies in cytogenetics and sexual biology at Stanford. J. Biosci. 2009, 34, 139–159. [Google Scholar] [CrossRef]
  8. Barratt, R.W.; Garnjobst, L. Genetics of a Colonial Microconidiating Mutant Strain of Neurospora crassa. Genetics 1949, 34, 351–369. [Google Scholar] [CrossRef]
  9. Li, L.; Wright, S.J.; Krystofova, S.; Park, G.; Borkovich, K.A. Heterotrimeric G protein signaling in filamentous fungi. Annu. Rev. Microbiol. 2007, 61, 423–452. [Google Scholar] [CrossRef]
  10. Turner, G.E.; Borkovich, K.A. Identification of a G protein alpha subunit from Neurospora crassa that is a member of the Gi family. J. Biol. Chem. 1993, 268, 14805–14811. [Google Scholar] [CrossRef]
  11. Ivey, F.D.; Hodge, P.N.; Turner, G.E.; Borkovich, K.A. The G alpha i homologue gna-1 controls multiple differentiation pathways in Neurospora crassa. Mol. Biol. Cell 1996, 7, 1283–1297. [Google Scholar] [CrossRef]
  12. Baasiri, R.A.; Lu, X.; Rowley, P.S.; Turner, G.E.; Borkovich, K.A. Overlapping functions for two G protein alpha subunits in Neurospora crassa. Genetics 1997, 147, 137–145. [Google Scholar] [CrossRef]
  13. Kays, A.M.; Rowley, P.S.; Baasiri, R.A.; Borkovich, K.A. Regulation of conidiation and adenylyl cyclase levels by the Galpha protein GNA-3 in Neurospora crassa. Mol. Cell Biol. 2000, 20, 7693–7705. [Google Scholar] [CrossRef] [Green Version]
  14. Yang, Q.; Poole, S.I.; Borkovich, K.A. A G-protein beta subunit required for sexual and vegetative development and maintenance of normal G alpha protein levels in Neurospora crassa. Eukaryot. Cell 2002, 1, 378–390. [Google Scholar] [CrossRef] [Green Version]
  15. Muller, F.; Kruger, D.; Sattlegger, E.; Hoffmann, B.; Ballario, P.; Kanaan, M.; Barthelmess, I.B. The cpc-2 gene of Neurospora crassa encodes a protein entirely composed of WD-repeat segments that is involved in general amino acid control and female fertility. Mol. Gen. Genet. MGG 1995, 248, 162–173. [Google Scholar] [CrossRef]
  16. Garud, A.; Carrillo, A.J.; Collier, L.A.; Ghosh, A.; Kim, J.D.; Lopez-Lopez, B.; Ouyang, S.; Borkovich, K.A. Genetic relationships between the RACK1 homolog cpc-2 and heterotrimeric G protein subunit genes in Neurospora crassa. PLoS ONE 2019, 14, e0223334. [Google Scholar] [CrossRef] [Green Version]
  17. Krystofova, S.; Borkovich, K.A. The heterotrimeric G-protein subunits GNG-1 and GNB-1 form a Gbetagamma dimer required for normal female fertility, asexual development, and galpha protein levels in Neurospora crassa. Eukaryot. Cell 2005, 4, 365–378. [Google Scholar] [CrossRef] [Green Version]
  18. Ivey, F.D.; Yang, Q.; Borkovich, K.A. Positive regulation of adenylyl cyclase activity by a galphai homolog in Neurospora crassa. Fungal Genet. Biol. 1999, 26, 48–61. [Google Scholar] [CrossRef]
  19. Yang, Q.; Borkovich, K.A. Mutational activation of a Galphai causes uncontrolled proliferation of aerial hyphae and increased sensitivity to heat and oxidative stress in Neurospora crassa. Genetics 1999, 151, 107–117. [Google Scholar] [CrossRef]
  20. Kays, A.M.; Borkovich, K.A. Severe impairment of growth and differentiation in a Neurospora crassa mutant lacking all heterotrimeric G alpha proteins. Genetics 2004, 166, 1229–1240. [Google Scholar] [CrossRef] [Green Version]
  21. Collier, L.A.; Ghosh, A.; Borkovich, K.A. Heterotrimeric G-Protein Signaling Is Required for Cellulose Degradation in Neurospora crassa. Mbio 2020, 11, e02419-20. [Google Scholar] [CrossRef]
  22. Alqinyah, M.; Hooks, S.B. Regulating the regulators: Epigenetic, transcriptional, and post-translational regulation of RGS proteins. Cell Signal. 2018, 42, 77–87. [Google Scholar] [CrossRef]
  23. Ross, E.M.; Wilkie, T.M. GTPase-activating proteins for heterotrimeric G proteins: Regulators of G protein signaling (RGS) and RGS-like proteins. Annu. Rev. Biochem. 2000, 69, 795–827. [Google Scholar] [CrossRef] [Green Version]
  24. Koelle, M.R. A new family of G-protein regulators—The RGS proteins. Curr. Opin. Cell Biol. 1997, 9, 143–147. [Google Scholar] [CrossRef]
  25. Watson, N.; Linder, M.E.; Druey, K.M.; Kehrl, J.H.; Blumer, K.J. RGS family members: GTPase-activating proteins for heterotrimeric G-protein alpha-subunits. Nature 1996, 383, 172–175. [Google Scholar] [CrossRef]
  26. Wang, Y.; Geng, Z.; Jiang, D.; Long, F.; Zhao, Y.; Su, H.; Zhang, K.Q.; Yang, J. Characterizations and functions of regulator of G protein signaling (RGS) in fungi. Appl. Microbiol. Biotechnol. 2013, 97, 7977–7987. [Google Scholar] [CrossRef]
  27. Jung, M.G.; Kim, S.S.; Yu, J.H.; Shin, K.S. Characterization of gprK Encoding a Putative Hybrid G-Protein-Coupled Receptor in Aspergillus fumigatus. PLoS ONE 2016, 11, e0161312. [Google Scholar] [CrossRef] [Green Version]
  28. Igbalajobi, O.A.; Yu, J.H.; Shin, K.S. Characterization of the rax1 gene encoding a putative regulator of G protein signaling in Aspergillus fumigatus. Biochem. Biophys. Res. Commun. 2017, 487, 426–432. [Google Scholar] [CrossRef]
  29. Kim, Y.; Heo, I.B.; Yu, J.H.; Shin, K.S. Characteristics of a Regulator of G-Protein Signaling (RGS) rgsC in Aspergillus fumigatus. Front. Microbiol. 2017, 8, 2058. [Google Scholar] [CrossRef]
  30. Kim, Y.; Lee, M.W.; Jun, S.C.; Choi, Y.H.; Yu, J.H.; Shin, K.S. RgsD negatively controls development, toxigenesis, stress response, and virulence in Aspergillus fumigatus. Sci. Rep. 2019, 9, 811. [Google Scholar] [CrossRef] [Green Version]
  31. Xie, R.; Yang, K.; Tumukunde, E.; Guo, Z.; Zhang, B.; Liu, Y.; Zhuang, Z.; Yuan, J.; Wang, S. Regulator of G Protein Signaling Contributes to the Development and Aflatoxin Biosynthesis in Aspergillus flavus through the Regulation of Galpha Activity. Appl. Environ. Microbiol. 2022, 88, e0024422. [Google Scholar] [CrossRef]
  32. Bosnjak, N.; Smith, K.M.; Asaria, I.; Lahola-Chomiak, A.; Kishore, N.; Todd, A.T.; Freitag, M.; Nargang, F.E. Involvement of a G Protein Regulatory Circuit in Alternative Oxidase Production in Neurospora crassa. G3 Genes Genomes Genet. 2019, 9, 3453–3465. [Google Scholar] [CrossRef] [Green Version]
  33. Vogel, H.J. Distribution of lysine pathways among fungi: Evolutionary implications. Am. Nat. 1964, 98, 435–446. [Google Scholar] [CrossRef]
  34. Davis, R.H.; de Serres, F.J. Genetic and microbiological research techniques for Neurospora crassa. Methods Enzymol. 1970, 17, 79–143. [Google Scholar]
  35. Kuck, U.; Hoff, B. Application of the nourseothricin acetyltransferase gene (nat1) as dominant marker for the transformation of filamentous fungi. Fungal Genet. Newsl. 2006, 53, 9–11. [Google Scholar] [CrossRef] [Green Version]
  36. Hays, S.; Selker, E.U. Making the selectable marker bar tighter and more economical. Fungal Genet. Rep. 2000, 47, 25. [Google Scholar] [CrossRef] [Green Version]
  37. Metzenberg, R.L.; Jacobson, D.J.; Bertrand, H. Making the selective agent for the bar plasmids, phoshoinothricin (glufosinate) affordable for routine use. Fungal Genet. Rep. 2000, 47, 13. [Google Scholar] [CrossRef] [Green Version]
  38. Colot, H.V.; Park, G.; Turner, G.E.; Ringelberg, C.; Crew, C.M.; Litvinkova, L.; Weiss, R.L.; Borkovich, K.A.; Dunlap, J.C. A high-throughput gene knockout procedure for Neurospora reveals functions for multiple transcription factors. Proc. Natl. Acad. Sci. USA 2006, 103, 10352–10357. [Google Scholar] [CrossRef] [Green Version]
  39. Ouyang, S.; Beecher, C.N.; Wang, K.; Larive, C.K.; Borkovich, K.A. Metabolic Impacts of Using Nitrogen and Copper-Regulated Promoters to Regulate Gene Expression in Neurospora crassa. G3 Genes Genomes Genet. 2015, 5, 1899–1908. [Google Scholar] [CrossRef] [Green Version]
  40. Freitag, M.; Hickey, P.C.; Raju, N.B.; Selker, E.U.; Read, N.D. GFP as a tool to analyze the organization, dynamics and function of nuclei and microtubules in Neurospora crassa. Fungal Genet. Biol. 2004, 41, 897–910. [Google Scholar] [CrossRef]
  41. Westergaard, M.; Mitchell, H.K.; Neurospora, V. A synthetic medium favoring sexual reproduction. Am. J. Bot. 1947, 34, 573–577. [Google Scholar] [CrossRef]
  42. Coradetti, S.T.; Craig, J.P.; Xiong, Y.; Shock, T.; Tian, C.; Glass, N.L. Conserved and essential transcription factors for cellulase gene expression in ascomycete fungi. Proc. Natl. Acad. Sci. USA 2012, 109, 7397–7402. [Google Scholar] [CrossRef]
  43. Grubbs, F. Procedures for detecting outlying observations in samples. Tecnometrics 1969, 11, 1–21. [Google Scholar] [CrossRef]
  44. Student. The probable error of a mean. Biometrika 1908, 6, 1–25. [Google Scholar] [CrossRef]
  45. Holm, S. A simple sequentially rejective multiple test procedure. Scand. J. Stat. 1979, 6, 65–70. [Google Scholar]
  46. Wickham, H. ggplot2: Elegant Graphics for Data Analysis. (Use R); Springer: Berlin/Heidelberg, Germany, 2016. [Google Scholar] [CrossRef]
  47. Soundararajan, M.; Willard, F.S.; Kimple, A.J.; Turnbull, A.P.; Ball, L.J.; Schoch, G.A.; Gileadi, C.; Fedorov, O.Y.; Dowler, E.F.; Higman, V.A.; et al. Structural diversity in the RGS domain and its interaction with heterotrimeric G protein alpha-subunits. Proc. Natl. Acad. Sci. USA 2008, 105, 6457–6462. [Google Scholar] [CrossRef] [Green Version]
  48. Cabrera, I.E.; Pacentine, I.V.; Lim, A.; Guerrero, N.; Krystofova, S.; Li, L.; Michkov, A.V.; Servin, J.A.; Ahrendt, S.R.; Carrillo, A.J.; et al. Global Analysis of Predicted G Protein-Coupled Receptor Genes in the Filamentous Fungus, Neurospora crassa. G3 Genes Genomes Genet. 2015, 5, 2729–2743. [Google Scholar] [CrossRef] [Green Version]
  49. Consonni, S.V.; Maurice, M.M.; Bos, J.L. DEP domains: Structurally similar but functionally different. Nat. Rev. Mol. Cell Biol 2014, 15, 357–362. [Google Scholar] [CrossRef] [PubMed]
  50. Yu, J.W.; Lemmon, M.A. All phox homology (PX) domains from Saccharomyces cerevisiae specifically recognize phosphatidylinositol 3-phosphate. J. Biol. Chem. 2001, 276, 44179–44184. [Google Scholar] [CrossRef] [PubMed] [Green Version]
  51. Hosomi, A.; Kawanishi, Y.Y.; Tanaka, N.; Takegawa, K. PXA domain-containing protein Pxa1 is required for normal vacuole function and morphology in Schizosaccharomyces pombe. Biosci. Biotechnol. Biochem. 2008, 72, 548–556. [Google Scholar] [CrossRef] [Green Version]
  52. Teasdale, R.D.; Loci, D.; Houghton, F.; Karlsson, L.; Gleeson, P.A. A large family of endosome-localized proteins related to sorting nexin 1. Biochem. J. 2001, 358, 7–16. [Google Scholar] [CrossRef]
  53. Wright, S.J.; Inchausti, R.; Eaton, C.J.; Krystofova, S.; Borkovich, K.A. RIC8 is a guanine-nucleotide exchange factor for Galpha subunits that regulates growth and development in Neurospora crassa. Genetics 2011, 189, 165–176. [Google Scholar] [CrossRef]
  54. Ivey, F.D.; Kays, A.M.; Borkovich, K.A. Shared and independent roles for a Galpha(i) protein and adenylyl cyclase in regulating development and stress responses in Neurospora crassa. Eukaryot. Cell 2002, 1, 634–642. [Google Scholar] [CrossRef] [Green Version]
  55. Glass, N.L.; Schmoll, M.; Cate, J.H.; Coradetti, S. Plant cell wall deconstruction by ascomycete fungi. Annu. Rev. Microbiol. 2013, 67, 477–498. [Google Scholar] [CrossRef]
  56. Tian, C.; Beeson, W.T.; Iavarone, A.T.; Sun, J.; Marletta, M.A.; Cate, J.H.; Glass, N.L. Systems analysis of plant cell wall degradation by the model filamentous fungus Neurospora crassa. Proc. Natl. Acad. Sci. USA 2009, 106, 22157–22162. [Google Scholar] [CrossRef] [PubMed] [Green Version]
  57. Yu, J.H.; Wieser, J.; Adams, T.H. The Aspergillus FlbA RGS domain protein antagonizes G protein signaling to block proliferation and allow development. EMBO J. 1996, 15, 5184–5190. [Google Scholar] [CrossRef] [PubMed]
  58. Zhang, H.; Tang, W.; Liu, K.; Huang, Q.; Zhang, X.; Yan, X.; Chen, Y.; Wang, J.; Qi, Z.; Wang, Z.; et al. Eight RGS and RGS-like proteins orchestrate growth, differentiation, and pathogenicity of Magnaporthe oryzae. PLoS Pathog. 2011, 7, e1002450. [Google Scholar] [CrossRef] [PubMed] [Green Version]
  59. Lafuente, M.J.; Gancedo, C. Disruption and basic functional analysis of six novel ORFs of chromosome XV from Saccharomyces cerevisiae. Yeast 1999, 15, 935–943. [Google Scholar] [CrossRef]
  60. Han, K.H.; Seo, J.A.; Yu, J.H. Regulators of G-protein signalling in Aspergillus nidulans: RgsA downregulates stress response and stimulates asexual sporulation through attenuation of GanB (Galpha) signalling. Mol. Microbiol. 2004, 53, 529–540. [Google Scholar] [CrossRef]
  61. Rosen, S.; Yu, J.H.; Adams, T.H. The Aspergillus nidulans sfaD gene encodes a G protein beta subunit that is required for normal growth and repression of sporulation. EMBO J. 1999, 18, 5592–5600. [Google Scholar] [CrossRef] [Green Version]
  62. Kim, H.; Borkovich, K.A. A pheromone receptor gene, pre-1, is essential for mating type-specific directional growth and fusion of trichogynes and female fertility in Neurospora crassa. Mol. Microbiol. 2004, 52, 1781–1798. [Google Scholar] [CrossRef]
Figure 1. RGS protein domain structures and orthologs in other fungi. (A) Protein domains of the seven RGS proteins. Gene names and numbers are shown to the left of each protein cartoon. The protein domains in each RGS protein were determined using Interpro. Domains: RGS = Regulator of G protein Signaling domain; DEP = Dishevelled, Egl-10 and Pleckstrin domain; PX = Phosphoinositide binding domain; PHOX = Phagocytic Oxidase domain; TM = Transmembrane domain; NEXIN_C = Sorting Nexin C-terminal domain; (B) RGS and Gα protein orthologs in selected fungi. Features of fungal orthologs of the seven RGS and three Gα proteins from N. crassa are presented. RGS subclades are taken from reference [26].
Jof 08 01076 g001
Figure 2. Quantitative phenotypes during growth and development. (A) Growth rate of basal hyphae. VM agar race tubes with sucrose as the carbon source (VM-sucrose) were inoculated with the indicated strains (see Table 1 for genotypes) and then incubated at 25 °C in constant darkness. Linear growth rates were determined using at least four biological replicates. Error was calculated as the Standard Error. A pair-wise Student’s t-test was performed between all strains (See Figure S4), but this graph only shows comparisons to the wildtype mat A strain. p-value thresholds are indicated as * p < 0.05, ** p < 0.01, and *** p < 0.001; (B) Aerial hyphae height measurements. Culture tubes containing liquid VM-sucrose medium were inoculated with the indicated strains and then incubated statically in constant darkness for three days at room temperature. The distance grown by aerial hyphae above the liquid interface was then measured in mm. Values are the average of 12 replicates. Error calculations and Student’s t-test were performed as described in (A). A summary of all pair-wise comparisons can be found in Figure S5; (C) Macroconidia production. Slant tubes containing VM-sucrose agar medium were inoculated with the indicated strains and then cultured for three days at 30 °C in constant darkness, followed by four days in constant light at room temperature. Macroconidia were harvested from the cultures using water and filtered through Handiwipes™ to remove basal and aerial hyphae. Macroconidia in the filtrate were then pelleted using centrifugation and brought to a known volume using water. The OD600 nm (proportional to macroconidia/mL) was determined for 1 mL of suspension and used to calculate total OD600 nm. Values represent six biological replicates. Error calculations and Student’s t-test were performed as described in (A). A summary of all pair-wise comparisons can be found in Figure S6.
Jof 08 01076 g002
Figure 3. Growth of strains after direct inoculation into Avicel medium. Liquid cultures containing 25mL of VM-Avicel were inoculated with macroconidia at a concentration of 1 × 10⁶ macroconidia/mL and grown with shaking for three days at 25 °C in constant light. After centrifugation, strains that did not completely degrade Avicel into soluble glucose or glucose oligomers have residual Avicel (white powder) remaining in the bottom of the tube. The black line marks the differentiation between the mycelial mat (above the line) and residual Avicel (below the line). Residual Avicel was present in cultures from gna-3Q208L, Δrgs-2 and Δrgs-7 strains; because the remaining Avicel was dispersed throughout the hyphae in the Δrgs-7 strain, it cannot be shown with a black line.
Jof 08 01076 g003
Figure 4. Glucose release cellulase activity and protein amount in culture supernatants and extracted biomass after growth in VM-Avicel for three days. Strains were cultured in VM-Avicel as described in the legend for Figure 3 and grown for three days prior to centrifugation. A sample of each culture supernatant was withdrawn and passed through a 0.45-micron filter. Total protein was extracted from the cell pads of each culture as described in the Materials and Methods. A minimum of three replicates were used for all assays, and errors are expressed as the standard error. Statistical significance relative to wild-type mat A was determined using a two-tailed Student’s t-test, and strains with protein levels or cellulase activity significantly different from that of the wild type are indicated as * p < 0.05, ** p < 0.01, and *** p < 0.001. (A) Total protein. Protein levels in the cell-free supernatants and the extracted cell pads were determined using the BCA protein assay. The total amount of protein (mg) was calculated using the total volume of the supernatant or the extracted biomass. A summary of all pair-wise statistical comparisons can be found in Figures S8 and S9; (B) Glucose release cellulase activity. Glucose release from Avicel activity in the cell-free supernatant was measured as described [21]. Values were normalized to the extracted biomass protein. Units are expressed as nmol glucose/mL culture supernatant/mg biomass protein. A summary of all pair-wise statistical comparisons can be found in Figure S10.
Jof 08 01076 g004
Figure 5. SDS-PAGE analysis of Avicel culture supernatants. One mL of cell-free culture supernatant obtained as described in the legend to Figure 4 was concentrated 5-fold as described [21]. A volume containing 20 μL was subjected to SDS-PAGE using a 10% resolving gel. The positions of the molecular weight markers are shown along the left side of the figure. Note the prominent band at ~70 kDa in the wild type strain, which corresponds to several cellulase enzymes.
Jof 08 01076 g005
Table 1. Strains used in this study.
Relevant GenotypeStrain NameDetailed GenotypeNCU NumberSource
Wild type74-OR23-1AWild type, mat ANA 2FGSC2489 1
Wild typeOR8-1aWild type mat aNAFGSC4200
∆gna-13b10∆gna-1:hph, mat aNCU06493Ivey et al., 1999 [18]
∆gna-2gna-2 a∆gna-2:hph, mat aNCU06729FGSC12377
∆gna-331c2∆gna-3:hph, mat ANCU05206Kays et al., 2000 [13]
gna-1*∆1gna-1*∆gna-1:hph, gna-1Q204L:his-3+, mat ANACollier et al., 2020 [21]
gna-2*G2-7pccg-1::gna-2Q205L::his-3+, mat ANACollier et al., 2020 [21]
gna-3*gna3Q208Lpccg-1::gna-3Q208L::his-3+, mat ANACollier et al., 2020 [21]
∆rgs-1rgs-1-2a∆rgs-1::hph, mat aNCU08319This Study
∆rgs-2rgs-2-7a∆rgs-2::hph, mat aNCU05435This Study
∆rgs-3rgs-3-2a∆rgs-3::hph, mat aNCU08343This Study
∆rgs-4rgs-4-7A∆rgs-4::hph, mat ANCU03937This Study
∆rgs-5rgs-5-3∆rgs-5::hph, mat aNCU09883This Study
∆rgs-6rgs-6-a∆rgs-6::hph, mat aNCU03153FGSC14041
∆rgs-7rgs-7-A∆rgs-7::hph, mat ANCU09415FGSC15515
∆rgs-1, ∆mus-52rgs1m7∆rgs-1::hph, ∆mus-52::nat, mat aNAThis Study
∆rgs-2, ∆mus-52rgs2m2∆rgs-2::hph, ∆mus-52::nat, mat aNAThis Study
∆rgs-3, ∆mus-52rgs3m1∆rgs-3::hph, ∆mus-52::nat, mat aNAThis Study
∆rgs-4, ∆mus-52rgs4m5∆rgs-4::hph, ∆mus-52::nat, mat aNAThis Study
∆rgs-5, ∆mus-52rgs5m4∆rgs-5::hph, ∆mus-52::nat, mat ANAThis Study
∆rgs-6, ∆mus-52rgs6m1∆rgs-6::hph, ∆mus-52::nat, mat aNAThis Study
∆rgs-6, ∆mus-52rgs6m5∆rgs-6::hph, ∆mus-52::nat, mat aNAThis Study
∆rgs-7, ∆mus-52rgs7m1∆rgs-7::hph, ∆mus-52::nat, mat aNAThis Study
∆rgs-1, rgs-1+rgs1m7-c2∆rgs-1::hph, ∆mus-52::nat, pccg-1::rgs-1+::pan-2, mat aNAThis Study
∆rgs-2, rgs-2+rgs2m2-c2∆rgs-2::hph, ∆mus-52::nat, pccg-1::rgs-2+::pan-2, mat aNAThis Study
∆rgs-3, rgs-3+rgs3m1-c5∆rgs-3::hph, ∆mus-52::nat, pccg-1::rgs-3+::pan-2, mat aNAThis Study
∆rgs-4, rgs-4+rgs4m4-c1∆rgs-4::hph, ∆mus-52::nat, pccg-1::rgs-4+::pan-2, mat aNAThis Study
∆rgs-5, rgs-5+rgs5m4-c8∆rgs-5::hph, ∆mus-52::nat, pccg-1::rgs-5+::pan-2, mat ANAThis Study
∆rgs-6, rgs-6+rgs6m1-c3∆rgs-6::hph, ∆mus-52::nat, pccg-1::rgs-6+::pan-2, mat aNAThis Study
∆rgs-7, rgs-7+rgs7m1-c1∆rgs-7::hph, ∆mus-52::nat, pccg-1::rgs-7+::pan-2, mat aNAThis Study
1 FGSC, Fungal Genetics Stock Center. 2 NA, Not applicable.
Table 2. Sexual cycle phenotype summary.
Strain NameRelevant Genotype 1ProtoperitheciaPeritheciaAscospores
74-OR23-1AWild type, mat ANormalNormalNormal
OR8-1aWild type, mat aNormalNormalNormal
3b10∆gna-1NormalAbnormalNot Formed
gna-2 a∆gna-2NormalNormalNormal
31c2∆gna-3ReducedReducedNormal
∆1gna-1*gna-1Q204LReducedReducedReduced
G2-7gna-2Q205LNormalNormalNormal
gna3Q208Lgna-3Q208LNot FormedNot FormedNot Formed
rgs-1-2a∆rgs-1Not FormedNot FormedNot Formed
rgs-2-7a∆rgs-2NormalReducedReduced
rgs-3-2a∆rgs-3NormalNormalNormal
rgs-4-7A∆rgs-4NormalNormalNormal
rgs-5-3∆rgs-5NormalNormalNormal
rgs-6-a∆rgs-6NormalNormalNormal
rgs-7-A∆rgs-7NormalNormalNormal
1 Refer to Table 1 for detailed genotypes.
Table 3. Phenotype Summary for RGS Mutants.
FunctionRGS Protein
Regulation Type/Possible Gα Partner(s)
Strongly Supported Partners Are Underlined. —; No Effect due to Mutation of RGS
RGS-1RGS-2RGS-3RGS-4RGS-5RGS-6RGS-7
Growth RatePositive/GNA-1Positive/GNA-1
Aerial Hyphae HeightNegativeNegativeNegativeNegativeNegativeNegative
Macroconidia AbundancePositive/GNA-1Positive/GNA-3Positive/GNA-1Positive/GNA-1Positive/GNA-1Positive/GNA-1Positive/GNA-1
Sexual DevelopmentPositive/GNA-3Positive/GNA-1
Avicel Utilization (2 days)Positive/GNA-3Positive/GNA-3Positive/GNA-3Positive/GNA-3Positive/GNA-3
Culture Biomass in Avicel (3 days)NegativePositive/GNA-3Positive/GNA-3Positive/GNA-3
Glucose Release Cellulase ActivityNegative/GNA-1
GNA-2
Positive/GNA-3Positive/GNA-3Negative/GNA-1
GNA-2
Publisher’s Note: MDPI stays neutral with regard to jurisdictional claims in published maps and institutional affiliations.

