Article

Space and Vine Cultivar Interact to Determine the Arbuscular Mycorrhizal Fungal Community Composition

1
Department of Animal Biology, Plant Biology and Ecology, Universidad de Jaén, E23071 Jaén, Spain
2
Department of Biology, Universitat de les Illes Balears, E07122 Palma de Mallorca, Spain
*
Authors to whom correspondence should be addressed.
J. Fungi 2020, 6(4), 317; https://doi.org/10.3390/jof6040317
Submission received: 30 September 2020 / Revised: 24 November 2020 / Accepted: 24 November 2020 / Published: 27 November 2020
(This article belongs to the Special Issue Fungal Endophytes in Agriculture and Ecosystems)

Abstract

:
The interest in the use of microbes as biofertilizers is increasing in recent years as the demands for sustainable cropping systems become more pressing. Although very widely used as biofertilizers, arbuscular mycorrhizal (AM) fungal associations with specific crops have received little attention and knowledge is limited, especially in the case of vineyards. In this study, the AM fungal community associated with soil and roots of a vineyard on Mallorca Island, Spain was characterized by DNA sequencing to resolve the relative importance of grape variety on their diversity and composition. Overall, soil contained a wider AM fungal diversity than plant roots, and this was found at both taxonomic and phylogenetic levels. The major effect on community composition was associated with sample type, either root or soil material, with a significant effect for the variety of the grape. This effect interacted with the spatial distribution of the plants. Such an interaction revealed a hierarchical effect of abiotic and biotic factors in shaping the composition of AM fungal communities. Our results have direct implications for the understanding of plant-fungal assemblages and the potential functional differences across plants in vineyard cropping.

1. Introduction

Arbuscular mycorrhizal (AM) fungi are an important component of the plant soil microbiome. AM fungi are a low diversity monophyletic group of fungi living in close association with many terrestrial plant species [1]. The intimate association between plant and fungi occurs at the root level, and the main benefit consists of the exchange of inorganic nutrients from soil, provided by the fungus, with carbon fixed during the plant photosynthesis [2]. In addition, the symbiosis provides further advantages for the plants, allowing them to better tolerate biotic and abiotic stresses [3], thus increasing fruit yield and quality (e.g., [4,5,6]).
Due to the low diversity of AM fungi (ca. 300 described species [1]) able to colonize 80% of terrestrial plant species, the symbiosis has been considered as low specific. However, findings point towards non-random association patterns in plant-AM fungal identities [7], and the wide functional diversity exhibited by fungal taxa [8] highlights the importance of the knowledge of plant-fungal partner identity when optimizing agricultural production systems. Furthermore, it has been shown that different varieties of the same crop can respond differently to the same AM fungal isolates [9,10]. Other authors have found differences in the composition of AM fungal communities associated with different varieties, even when initially exposed to the same AM fungal community. For example, Taylor et al. [11] found that different onion genotypes displayed subtly different preferences for AM fungi from a mixed community, suggesting a selection process controlled by the plant and/or fungi (see also [12,13]).
Vitis vinifera is one of the most important crops in modern agriculture. Its economic and cultural impact is undeniable [14,15], especially in the Mediterranean region which harbors 40% of the world total vineyard area [16]. The availability of water for Mediterranean agriculture is a persistent and growing problem due to climate change, representing a limitation and a threat to the future of our primary sector [17]. As shown when associated with other plants, AM fungi provide multiple functions to grapes and therefore to vineyards that can help overcome current restrictions to their cultivation: They increase grape uptake of N [18,19], reduce soil Cu toxicity [20], improve plant drought resistance [21], and protect against pests [22] (but see [23]). Moreover, it has been suggested that the whole microbiome and, particularly, AM fungi can alter the biochemical composition of grapevines [24,25], which is a key factor in the commercial market of grapevine subproducts. Despite this importance, there are few studies addressing the composition of associated AM fungal communities with vineyards. The scarce evidence suggests that AM fungal assemblages in vineyards are strongly influenced by soil type [26,27] and, at a lesser extent, by host plant [28] and management practices [29,30,31] presenting low phenological variation [28,32]. The cultivation of vineyards is done through the grafting of different cultivars onto target rootstock resistant to Phylloxera; therefore, several cultivars are supported by genetically identical rootstocks. However, none has focused on potential differences of grafted cultivars even when it has been demonstrated that rootstocks differ in their response to AM fungi [21].
Here, we focus on analyzing the AM fungal community associated with two cultivars grafted onto the same rootstock, a local cultivar name Callet and a widely-distributed one, Merlot. The use of cultivars locally adapted can be one of the major adaptation practices to face climate change as they have been described as physiologically better adapted to deficient irrigation, particularly with regard to water use efficiency [33,34]. In fact, a recent work pointed out that under similar water-deficit stress, Callet (and other local cultivars) displayed a better physiological performance compared to the widespread ones [35]. In this frame, we particularly aim to resolve the following questions:
(i)
Quantify the diversity of AM fungi associated with the vineyard, both those directly colonizing roots and those present at the agroecosystem level (surrounding soil);
(ii)
Investigate the AM fungal community composition associated with each vineyard cultivar;
(iii)
Quantify the relative importance of environmental/spatial factors in the distribution of AM fungal communities.
The obtained information will help to determine which characteristics of the crop may be decisive when selecting the most related AM fungal species, and also will help inform who directs the establishment of the symbiosis: Plant or fungus. If fungi drive the symbiotic relationship, the AM fungal community composition will be primarily determined by environmental/spatial factors and not by the vine cultivar. On the contrary, if the vine cultivars select their community composition, the symbiosis would be more likely driven by the plant.

2. Materials and Methods

The experiment was carried out in the commercial vineyard Can Axartell in Pollença (UTM: 31S 501616.434, 4409438.756, Mallorca Island, Spain) under the appellation Vi de la Terra Mallorca, and it is organic certified. The experimental plot comprised 2.4 ha with Merlot (clone 181) and Callet (local red cultivar) cultivars, both grafted on SO4 rootstock (clone 5). The plantation was settled down in 1999 with a training system maintained as organically certified, and has a density of 3200 plants per ha (2.5 between rows and 1.25 m within rows). A drip irrigation system is available with one drip per plant (2.3 L/m2). The irrigation system allows adjustment according to demand, watering only in the driest months of July and August on a weekly basis.
The soil in the area comes from marls and limestone-marls of the Late Jurassic and Cretaceous periods. Quaternary sedimentary materials are also found in the area. According to Reference Soil Groups [36] the dominant soil is Calcaric Regosol. The soil is of chalky nature with a high-water retention capacity, high clay content (USDA, sand 17%, silt 31%, clay 52%), alkaline (pH 8.30), total organic carbon of 20.7 g/Kg, total nitrogen of 1.6 g/Kg, C/N ratio of 7.50, and cation exchange capacity CEC of 259.7 meq/Kg.
The climatic conditions are typically Mediterranean, with mild winters and hot dry summers. However, as the property is located quite close to the sea (7 km), the conditions are milder than expected, both in winter and summer. Average annual rainfall is approximately 700 mm with a mean temperature of 16.5 °C.
Regarding the management of the soil in the vineyard, a spontaneous green cover is maintained in alternate rows (one not tilled, another tilled) in the alleys between vine rows (inter-rows). The cover is maintained in the central part of the inter-rows, while the vegetation between vine plants in the same row is removed several times a year by shallow cultivation in a strip about 1 m wide. In the alley, the green cover is mowed and added to the soil as a green organic fertilizer in spring. In this way, the height of the green cover manages to control the water stress in the vine plants during the end of spring and summer. The green cover is changed every several years from one row to the next, tilling the entire plot. At the time of sampling, all sampled plants were kept weed-free by shallow cultivation at the row and mowed the alleys.

2.1. Sampling and DNA Extraction

Soil sampling was performed 10 July 2018, during fruit development stage. Eight plants of each cultivar (either Callet or Merlot) were sampled and their spatial coordinates inside the studied plot recorded. Using a retro-scaler, a hole 40 cm in diameter was made as close as possible to the plant in the alley orientated to the north. Roots and 1 kg of soil were collected at 0–30 cm depth. Only the roots near the sampled plant were collected. The absence of surrounding weeds assured that the roots belonged to the vine. Samples were immediately placed in sterile bags and transported on ice for laboratory analyses.
Once in the laboratory, the thinnest roots were collected, discarding the thickest and oldest ones. The soil was sieved through 5.0 mm mesh, homogenized, and 20 g per sample kept at −20 °C. The roots were washed several times with abundant water until no soil was left and rinsed with distilled water. They were then cut into 0.5 cm pieces, homogenized, and stored in two 100 mg aliquots frozen at −80 °C.
Total soil DNA was extracted from samples of 0.25 g of sieved soil using the DNeasy® PowerSoil® Kit (Qiagen Inc., Mississauga, ON, Canada) in accordance with the manufacturer’s instructions. The quality of the extracts was assessed using NanoDrop spectrophotometer (Thermo Fisher Scientific, Delaware City, DE, USA) and then stored at −80 °C for further analysis.
Frozen roots were taken out of the freezer and quickly ground to a fine powder under liquid nitrogen using a mortar and pestle. Two genomic DNA extractions per root sample were performed (100 mg each) using the DNeasy Plant Mini Kit (Qiagen Inc., Mississauga, ON, Canada), following the manufacturer’s instructions.

2.2. DNA Amplification and Sequencing

Extracted DNA was processed to identify AM fungal taxa by Illumina Miseq-sequencing of the 18S rRNA gene using the Glomeromycota-specific primers NS31 [37] and AML2 [38]. Library preparation and Illumina sequencing were carried out at the IPBLN Genomics Facility (CSIC, Granada, Spain). Amplicon libraries were generated through a two-step PCR strategy. The first step was carried out in a final volume of 10 µL, containing 1× KAPA HiFi HotStart ReadyMix DNA polymerase (Roche Diagnostics, West Sussex, UK), 0.2 µM forward and reverse primers, and 10 ng of the template DNA. Cycling conditions were: 95 °C 3 min, (95 °C 30 s, 58 °C 30 s, 72 °C 30 s) × 30, 72 °C 5 min. PCRs were triplicated and pooled together. A second PCR step attached dual combinatorial indices and Illumina sequencing adapters using Nextera XT v2 index kit. PCR conditions were: 95 °C 3 min, (95 °C 30 s, 55 °C 30 s, 72 °C 30 s) × 8, 72 °C 5 min. All PCRs were validated through visualization on 1.8 % (w/v) agarose gel and purified using the NucleoMag® NGS Clean-up and Size Select Kit (Macherey-Nagel, Düren, Germany). Concentrations were measured on a Qubit® fluorometer (Thermo). Amplicons were equimolarly pooled and a final library mix was run on a Bioanalyzer HS DNA chip (Agilent, Santa Clara, CA, USA) to verify quality and size distribution. The library pool was then diluted and denatured as recommended by the Illumina MiSeq library preparation guide. The 300 × 2 nt paired-end sequencing was conducted on a MiSeq sequencer. Samples were demultiplexed, and barcodes were removed and returned as individual per-sample fastq files from the sequencing facility.

2.3. Bioinformatic Analyses

The initial 4,617,181 MiSeq sequences were analyzed with the amplicon sequence variant (ASV, hereafter) analysis pipeline known as Divisive Amplicon Denoising Algorithm (DADA2 v. 1.8.; Ref. [39]). Briefly, forward and reverse sequences were trimmed to 295 and 290 bp, respectively. Primers were removed and a quality score set up to a minimum of 2. Sequences were dereplicated to keep unique sequences, and the error rate model inferred and used to implement the sample inference algorithm to remove Illumina sequencing errors. Forward and reverse reads were merged, and the sequence abundance table generated. Chimeric sequences based on the local dataset were removed (5.06% of quality filtered and merged reads). DADA2 gave 860 ASVs comprising 3,443,644 non-chimeric reads. The taxonomic assignment was determined for each ASV against the 16S/18S SILVA release 132 ([40] accessed 09/2018) using the RDP algorithm [41]. The SILVA database includes only a small set of representative sequences from Glomeromycota. Therefore, to improve taxonomic assignment, we amended the SILVA database with every classified sequence (i.e., those identified as a virtual taxa) in the Glomeromycotan specific database MaarjAM [42] (accessed January 2019). This database comprised 28,137 sequences including their taxonomic assignment. The taxonomic assignment was then reassessed against this combined database using RDP, and non-Glomeromycotan sequences were discarded, resulting in 636 ASVs that comprised 3,296,623 reads.
To remove further errors that were thought not to be removed by standard DADA2 pipelines, we then applied LULU algorithm [43] and obtained 240 corrected ASVs. Since DADA2-LULU infers unique original sequences in the DNA template, the result could correspond to an infra-specific level. Thus, the 240 ASVs were clustered by blasting against MaarjAM and named as the corresponding virtual taxa (VT, hereafter) when showing an identity higher than 97%. Those ASVs with low query cover (<90%) or low E-value during the blast were discarded (4/240). ASVs non-fitting at a minimum of 97% were aligned together with the rest of ASVs using MAFFT [44] and clustered at 97% using VSEARCH [45] implemented in MOTHUR [46]. Those ASVs clustering with VT-named ASVs were added to the existing cluster and those clustering alone were considered as new VTs. With 3,295,222 reads, we finally obtained 56 VT, five of which were defined as new VT non-included in MaarjAM database. The bioinformatic pipeline is available as supplementary material (Supplementary Material, Methods S1).
Data were deposited and are available in the Sequence Read Archive under Bioproject ID PRJNA679172. Representative sequences of the detected VT were deposited in GenBank under the accession numbers MW285643-MW285698. Processed raw data is available as Supplementary Material, Data S1.

2.4. Statistical Analyses

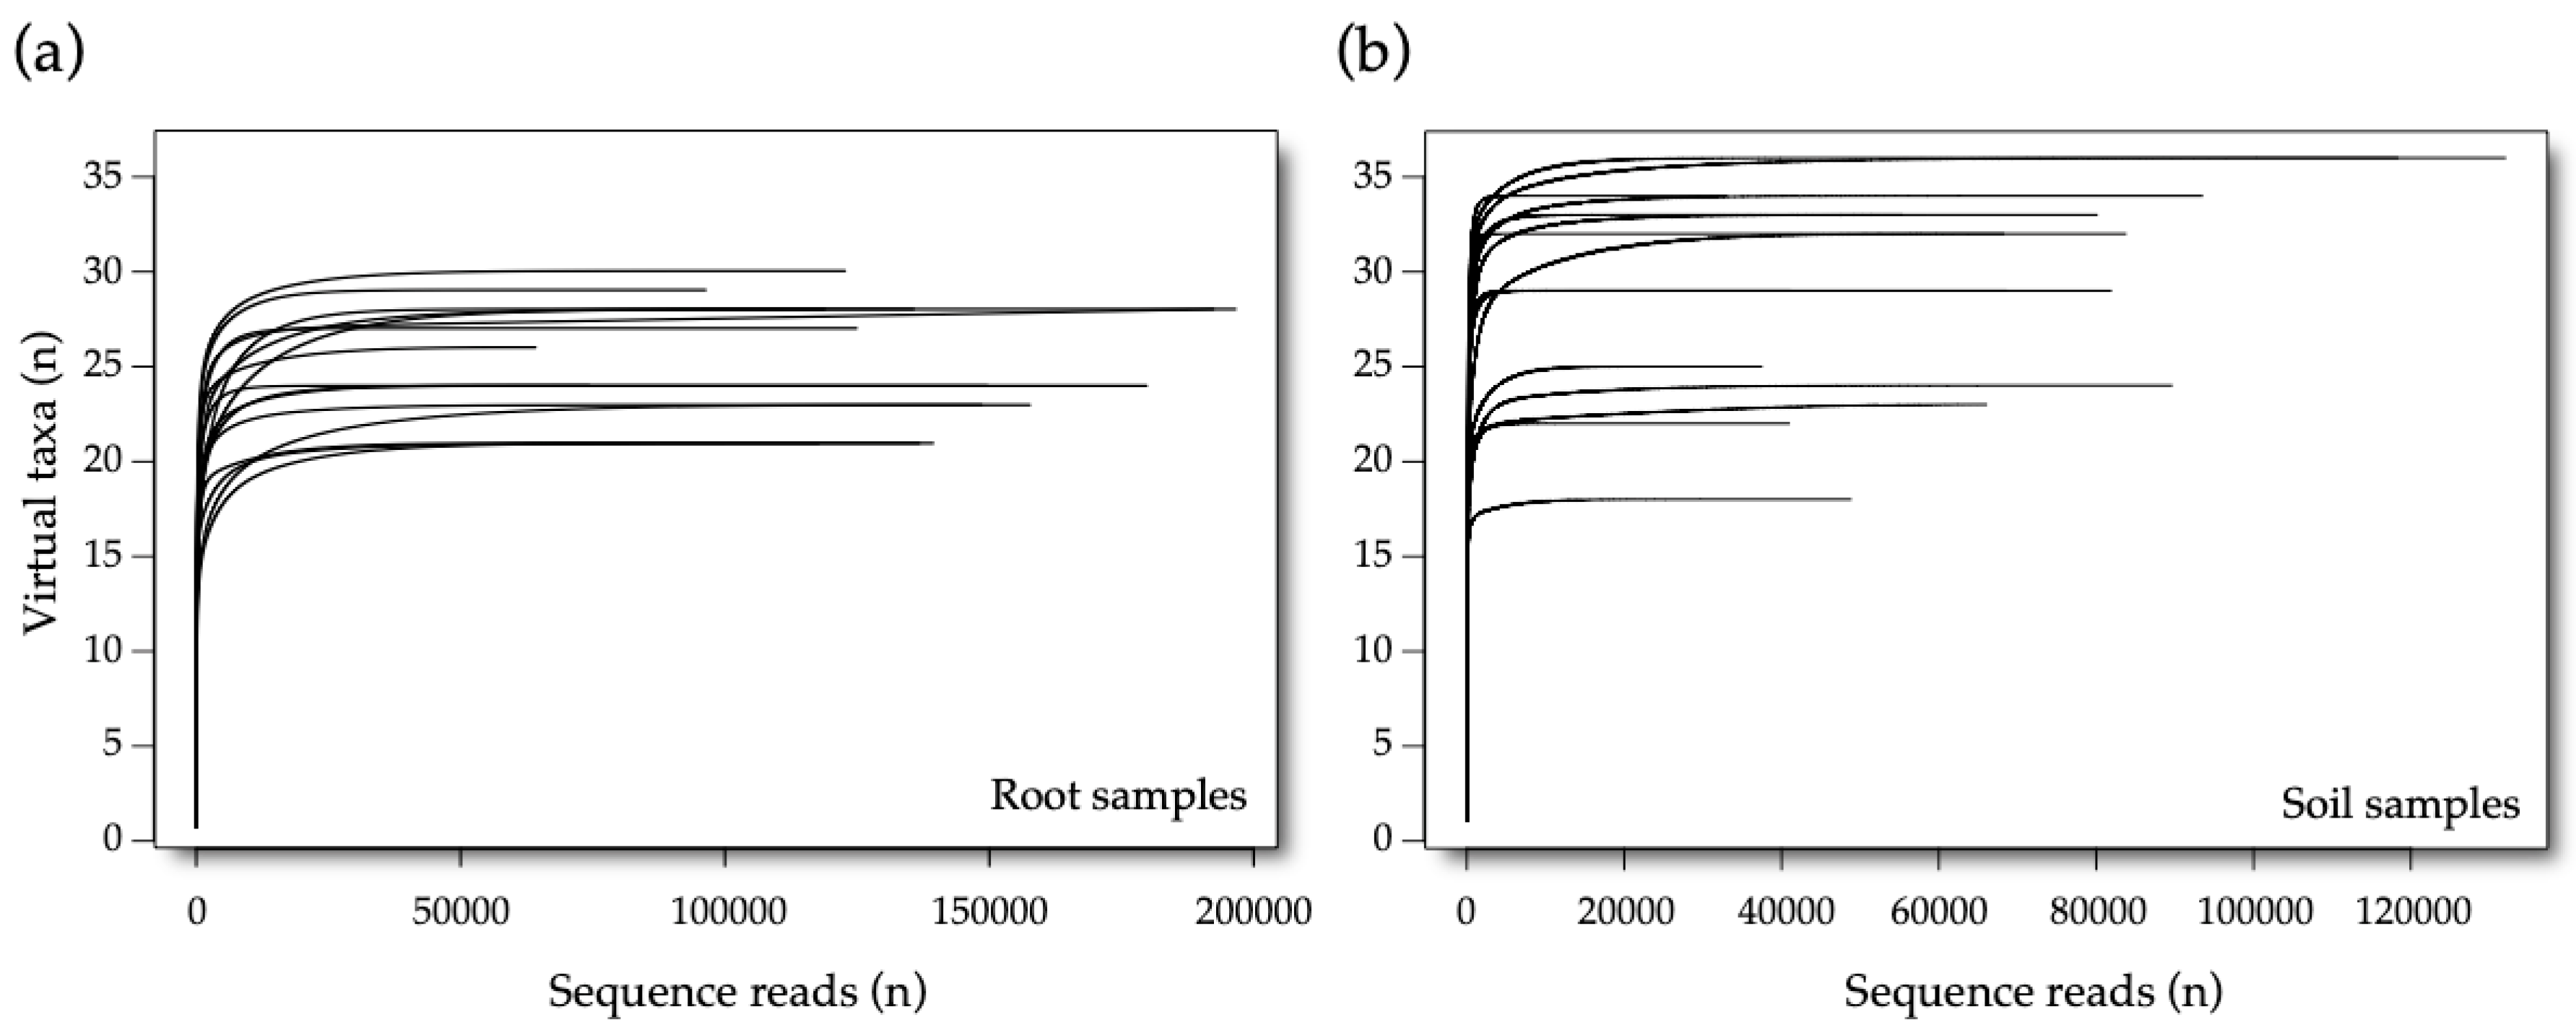
Prior to subsequent analyses, the sequencing information of the two subreplicates per root sample were pooled into a unique sample. The diversity coverage of the sequencing was checked by visualizing rarefaction curves by means of the rarecurve function (vegan R package [47]).
To build the VT abundance matrix, read counts per VT and sample were used as a proxy of abundance. The VT abundance matrix was subjected to Hellinger transformation for subsequent analyses [48].
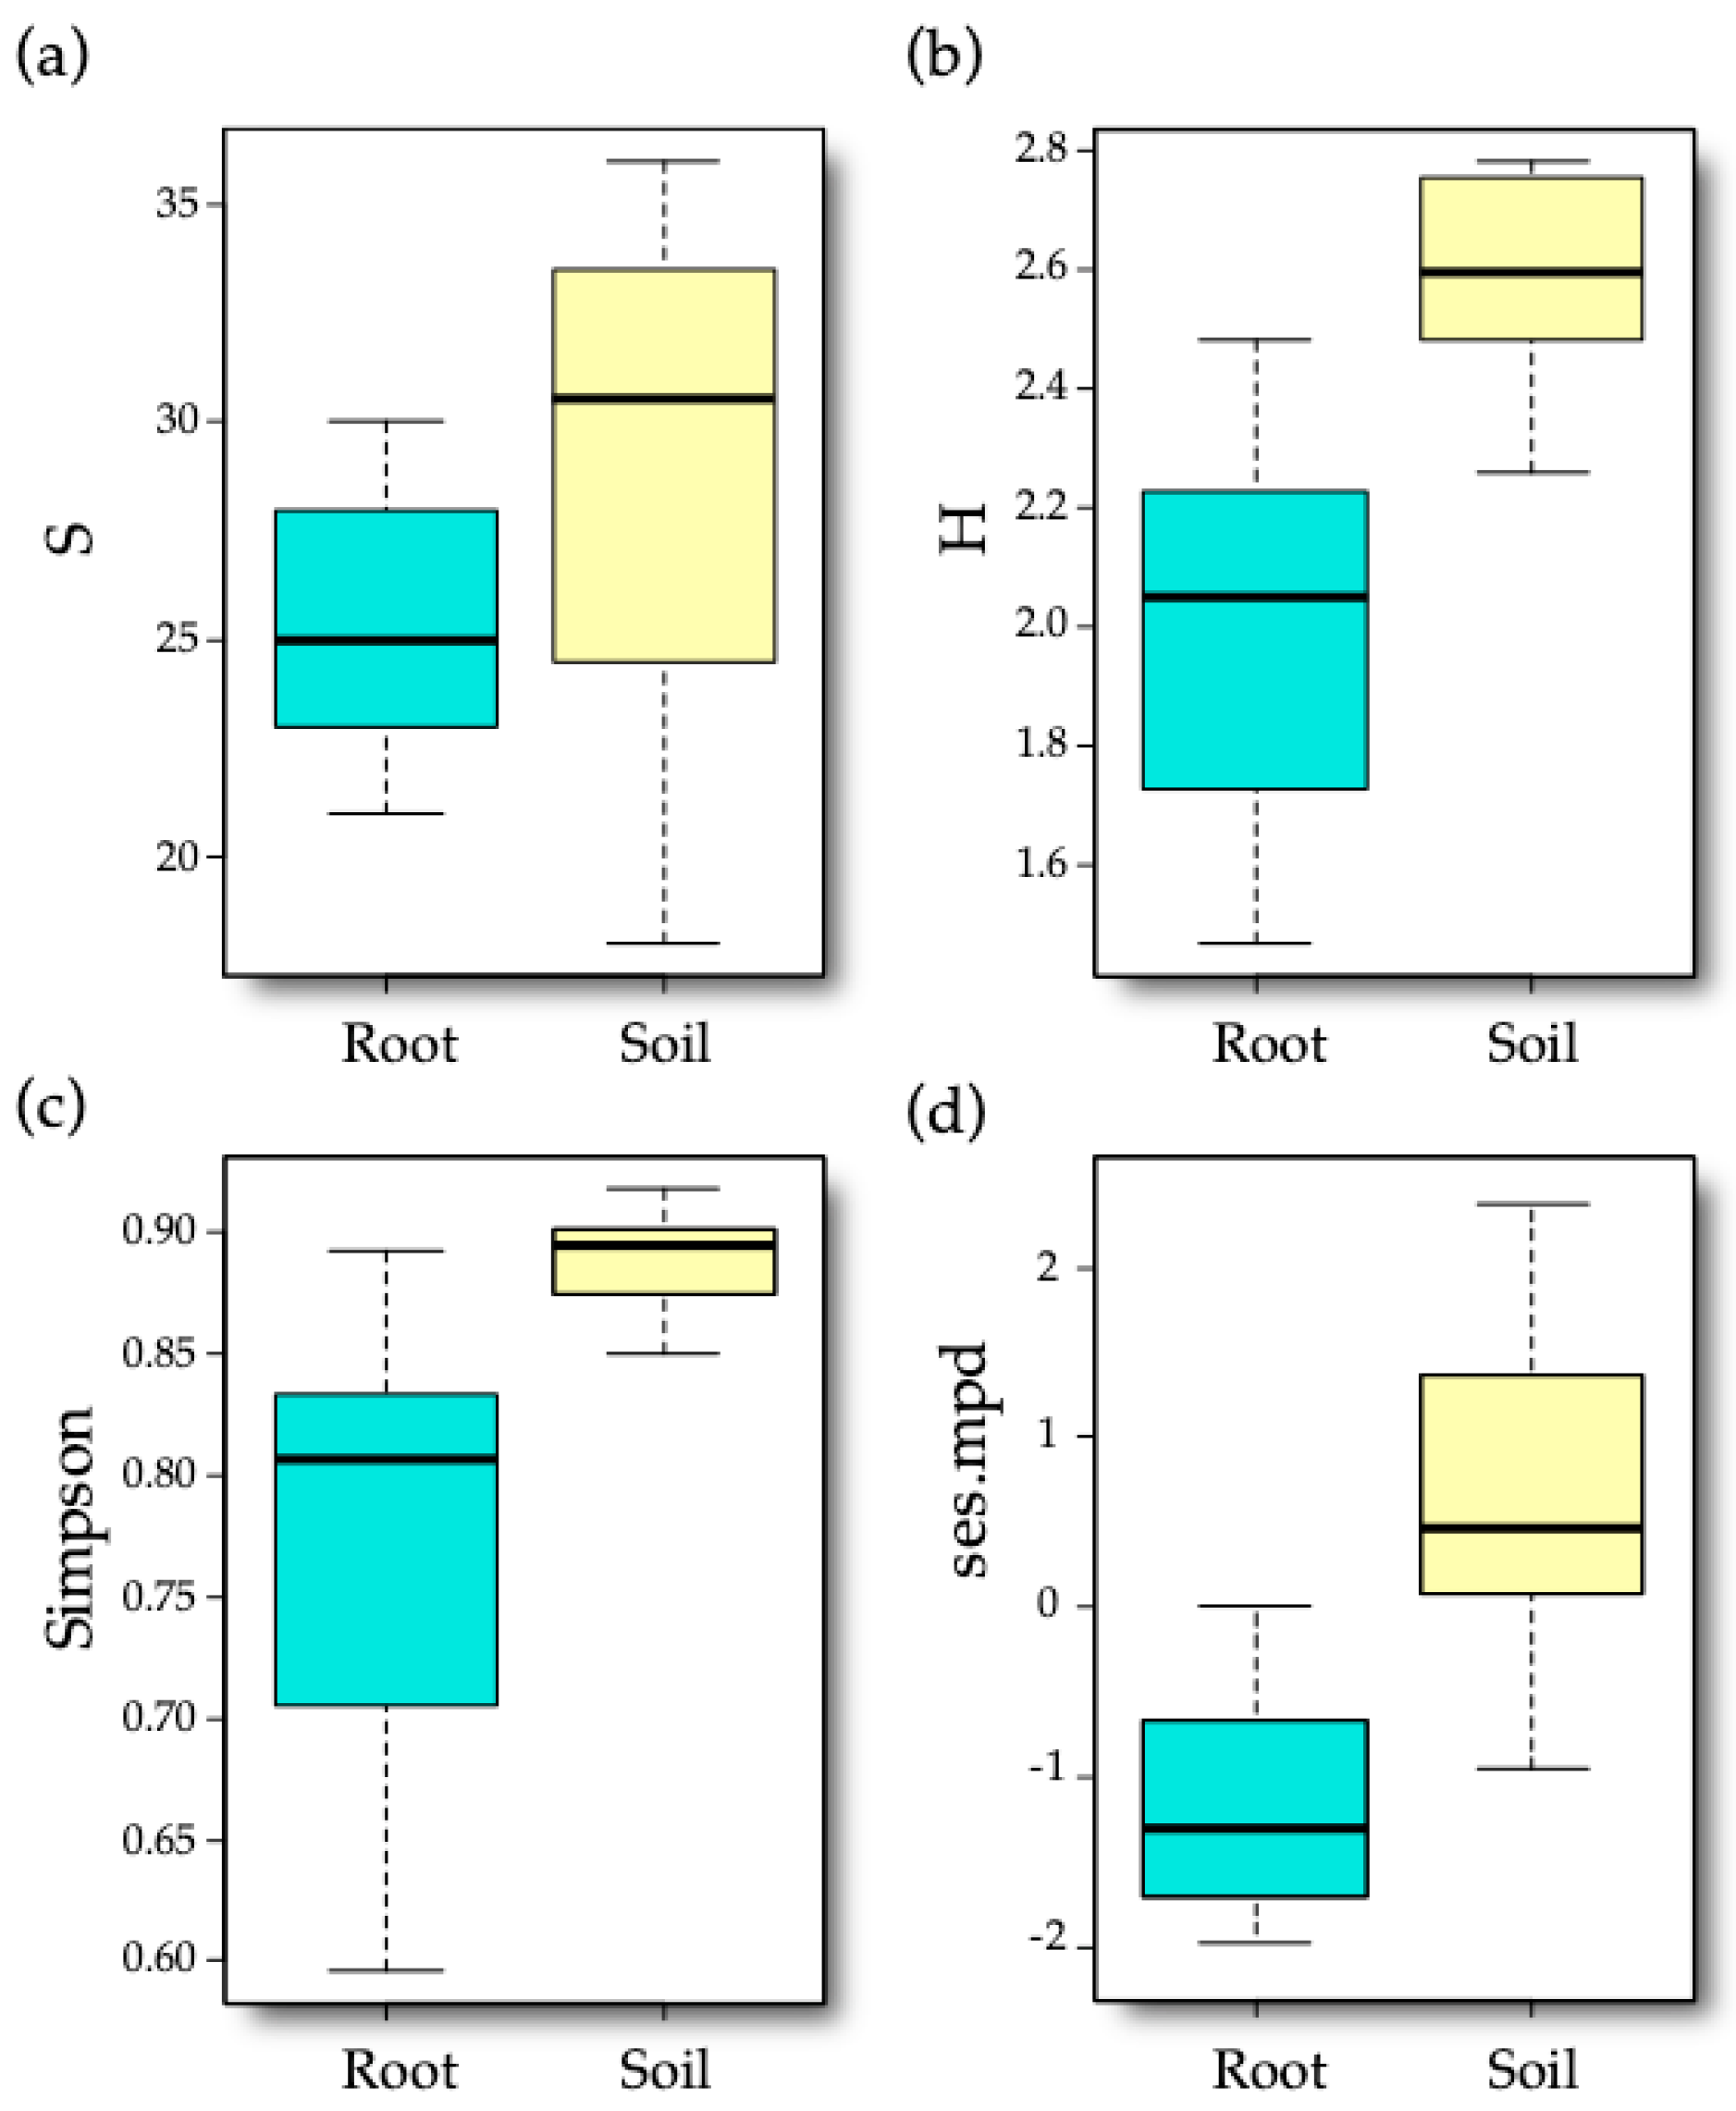
The VT abundance matrix was relativized to total row sums and used to obtain VT richness, Simpson (1-D) dominance, and Shannon indices at a sample level. The phylogenetic diversity was obtained by calculating the standardized effect size of the mean pairwise phylogenetic distance (ses.mpd) of AM fungal communities [49]. For that, the most abundant ASV per VT was selected as representative sequences and aligned using MAFFT 7.0. The Tamura-Nei nucleotide substitution model with a discrete gamma distribution was found to be the best fitted using MEGA X [50], and it was used to correct the evolutionary distance matrix between aligned sequences. The ses.mpd was calculated using the VT abundance matrix plus the evolutionary distance matrix of the VTs in each sample and compared to 999 null communities obtained using the independent swap algorithm which maintains species occurrence frequency and sample species richness (ses.mpd function, picante R package [51]). The mean values of ses.mpd per treatment were then used to judge the clustering or segregation against null communities. Significance of the calculated index was assessed with a t-test.
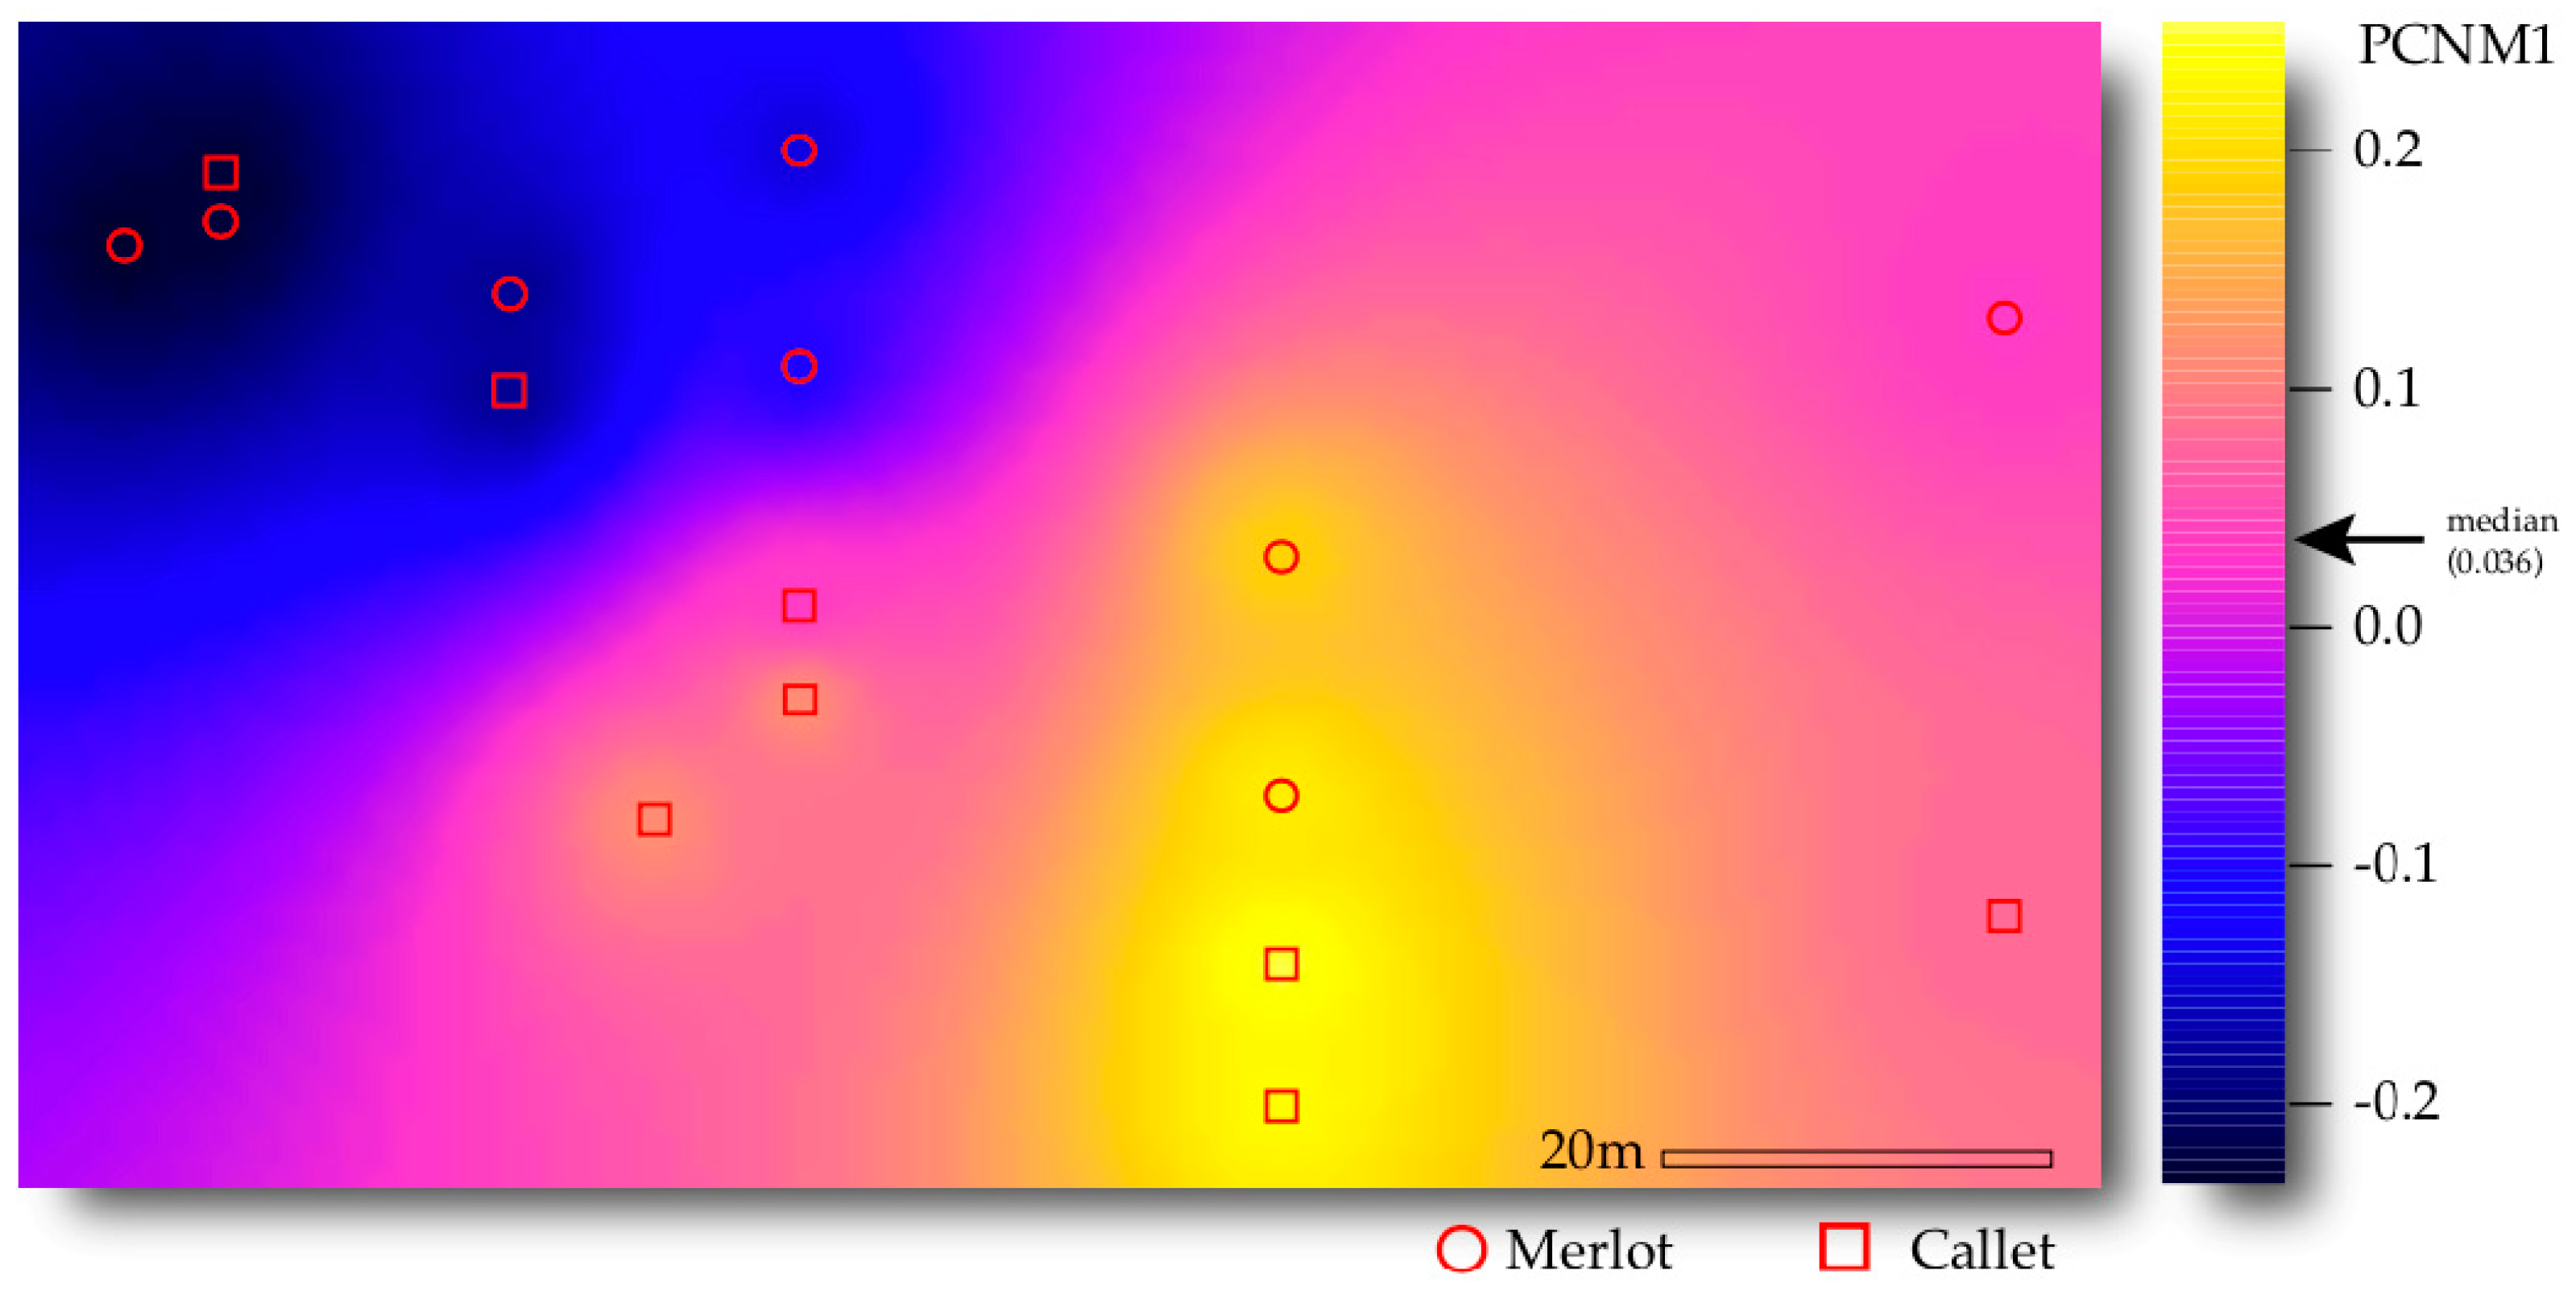
The spatial distribution of samples was decomposed via principal coordinates of neighbor matrices (PCNM). The significance of PCNM axes with positive eigenvalues on VT abundance distribution was evaluated by means of permutational multivariate analysis of variance (PERMANOVA, McArdle and Anderson 2001, adonis function, vegan R package [47]), using 999 permutations and Euclidean distance as measures of dissimilarity. This dissimilarity, as the abundance matrix was Hellinger-transformed, must be considered a Hellinger-based dissimilarity [48]. Those non-significant axes were discarded from further analyses.
The impact of vineyard cultivar, sample type (either soil or root), and their interaction on the mentioned diversity indices was tested via generalized least-squares models (gls function, nlme R package [52]), with variance structures applied for the sample type using the varIdent function to account for heteroscedastic variance in the model residual [53]. The models were also tested including spatial autocorrelation as covariate, both the x and y coordinates, and the selected first axis of PCNM decomposition.
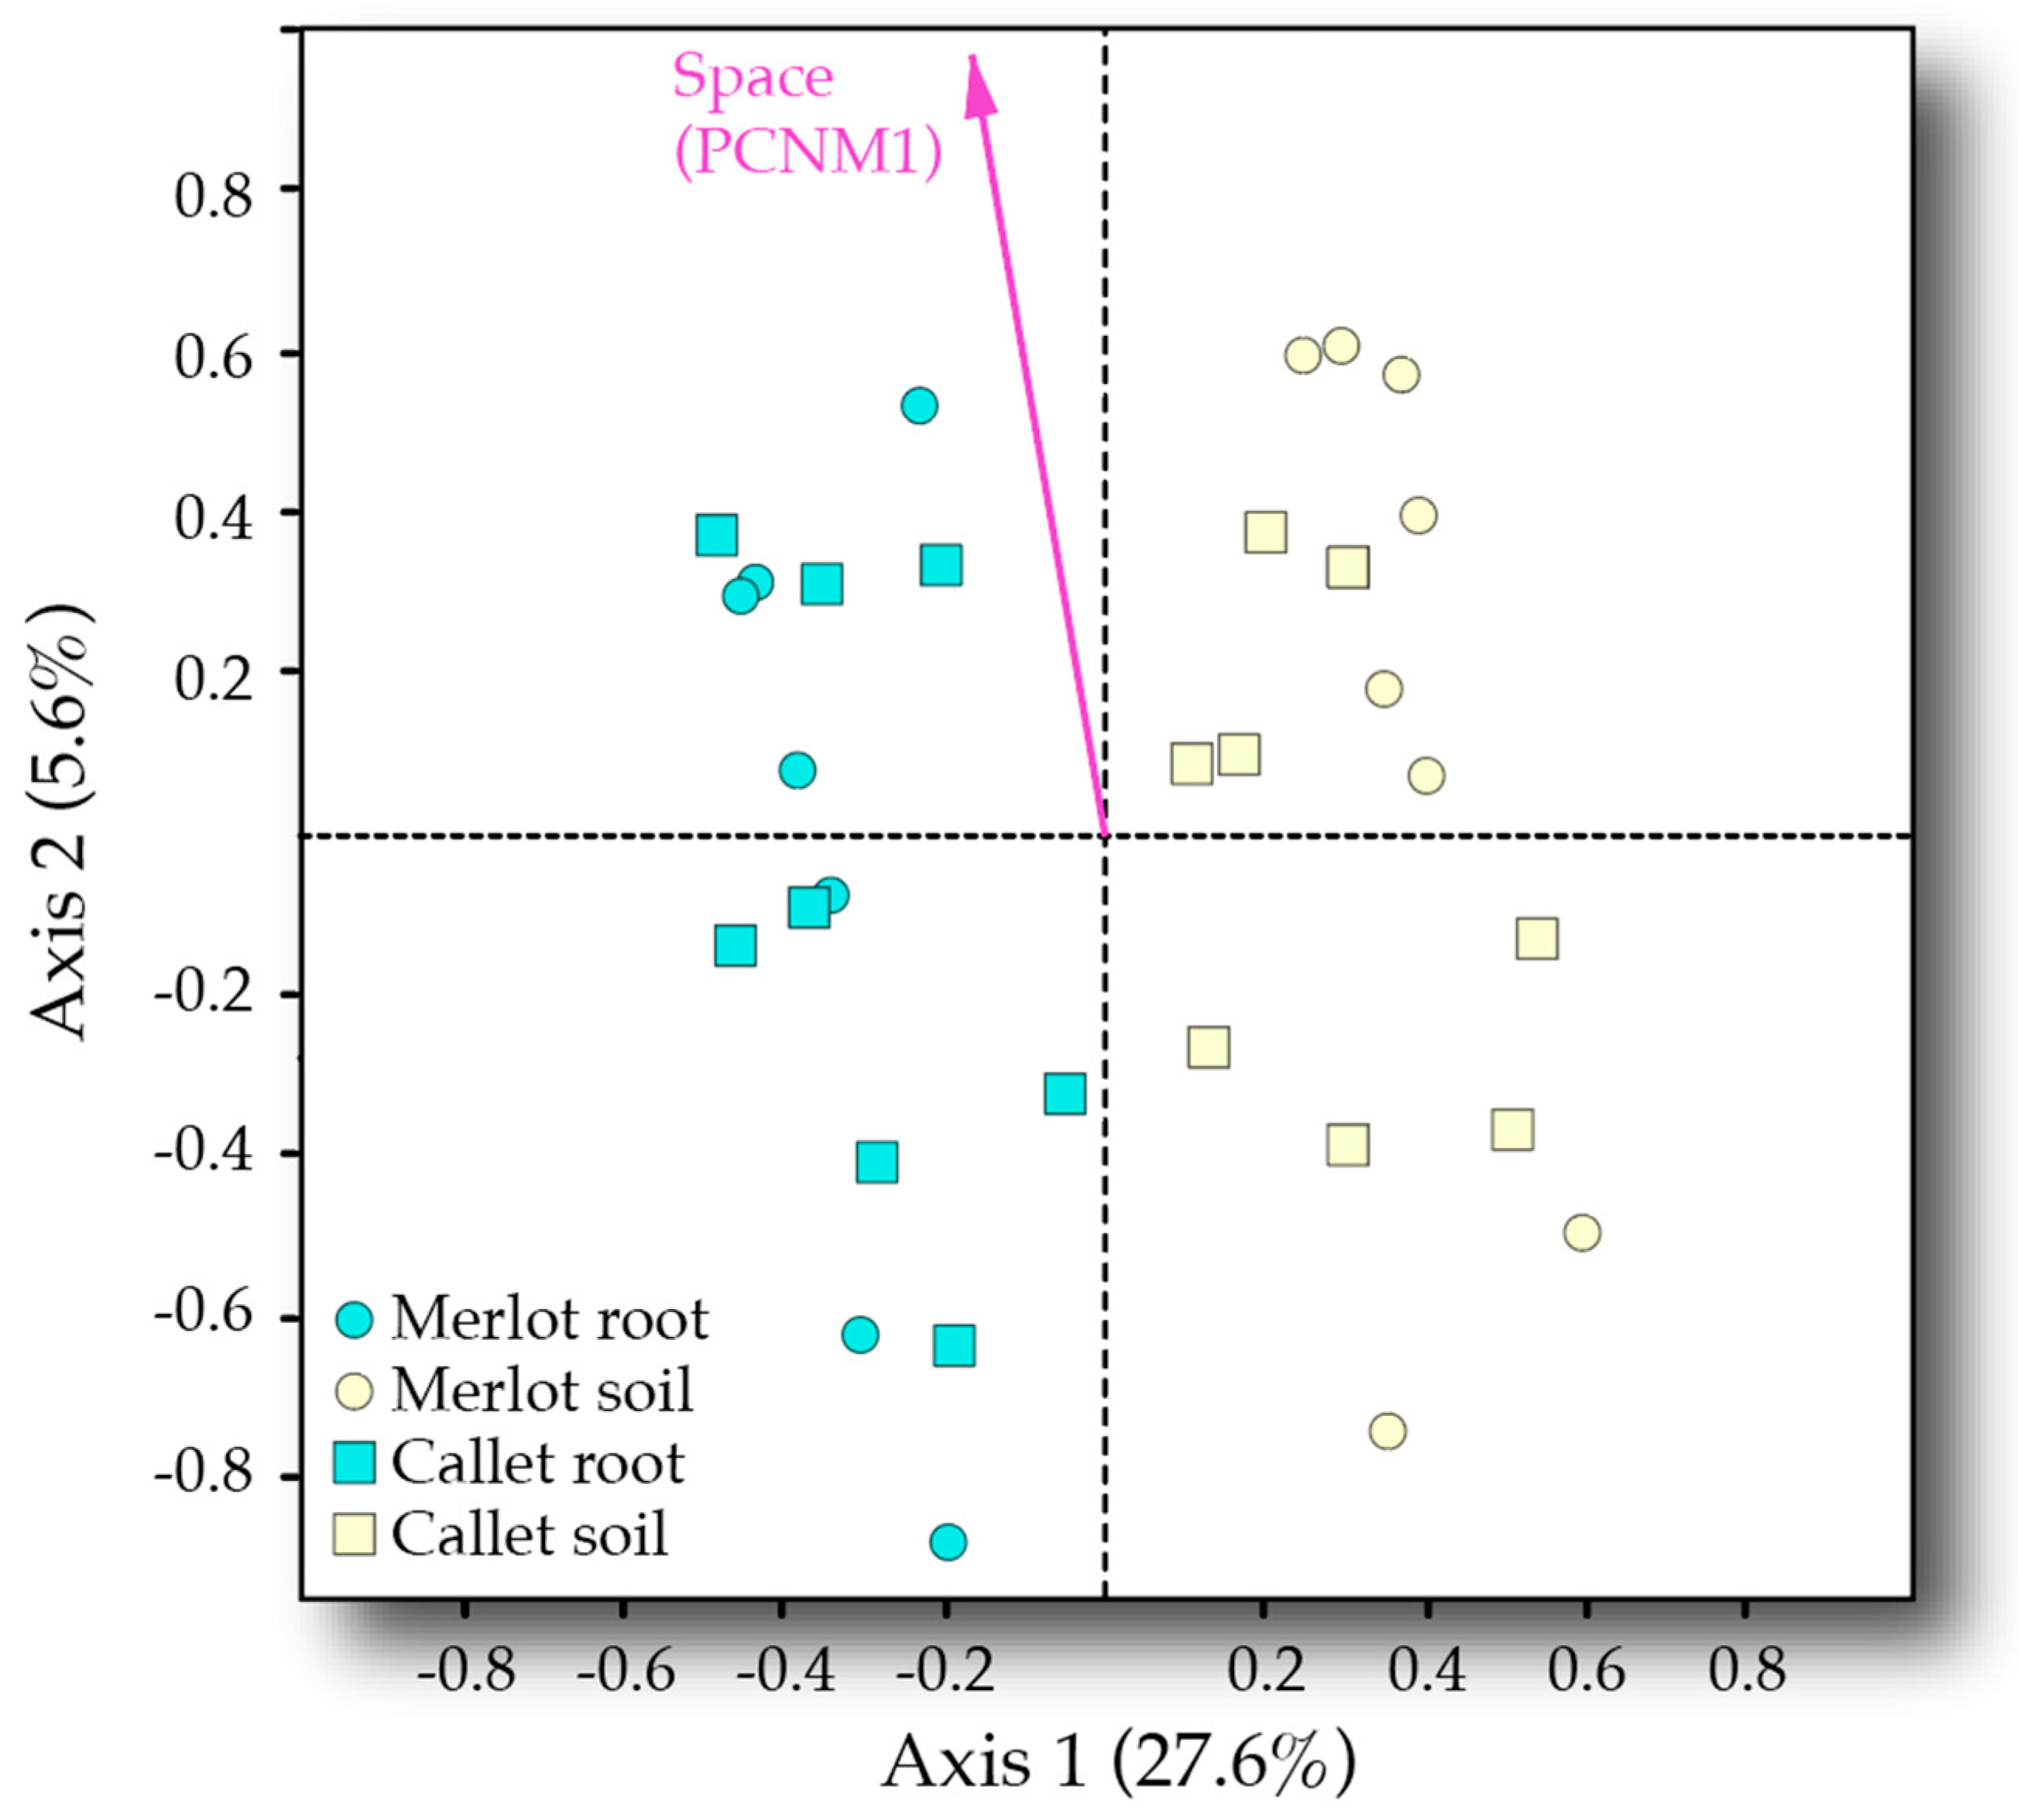
The effects of the experimental variables: Cultivar, sample type, and spatial position (PCNM axes), and their interaction on community composition was addressed by means of PERMANOVA (999 permutations, Euclidean distance). As PERMANOVA is sensitive to changes in multivariate dispersion among samples, the betadisper function (vegan R package) was used to assess differences in multivariate dispersion across factor levels. When finding significant interactions across explanatory variables, partial PERMANOVAs were run for each factor level. In the case of PCNM axes, their values were split in quartiles and analyzed in four different PERMANOVAs. To visualize the found patterns, we used a redundancy analysis (RDA) [54] ordination plot constraining by the mentioned experimental variables (rda function, vegan R package).
AM fungal VT indicative of particular groups of samples were identified using Dufrêne-Legendre indicator species analysis [55], implemented by the indval() function (labdsv R package [56]).
The R script containing the applied statistical analysis is available as supplementary material (Supplementary Material, Methods S2).

3. Results

3.1. Sequencing Data

From the initial 4,617,181 raw reads, 3,295,222 reads passed the quality filters and were found to belong to Glomeromycota. They were assigned to 56 VT, including five novel VTs not included in the MaarjAM database (see the phylogenetic tree, Figure S1): Two Paraglomeraceae and three Glomeraceae. The 56 virtual taxa belonged to eight Glomeromycotan families, Glomeraceae being the most abundant (88.94% of the reads), followed by Claroideoglomeraceae (6.86%), Paraglomeraceae (2.83%), Diversisporaceae (1.01%), Archaeosporaceae (0.33%), Acaulosporaceae (0.02%), and Gigasporaceae and Ambisporaceae (both of them with <0.01%) (Table A1). Glomeraceae was dominant both in soil and root samples; however, this family reached up to 97.43% of reads in the latter while the abundance across families was more spread in soil samples (72.89% for Glomeraceae in that case). For all samples, the sampling effort curve showed a saturation of VTs with an increasing number of sequences (see rarefaction curves, Appendix A Figure A1), ensuring that the sequencing effort captured the AM fungal diversity of the samples.

3.2. AM Fungal Diversity

Only sample type between the explanatory variables was found to affect the taxonomic and phylogenetic diversity indices (Table 1), in general showing an increase in the samples with a soil-borne origin (Figure 1). Implementation of spatial autocorrelation in the models did not improve the explanatory power of the diversity indices (analyses not shown).
On average, we found 27.25 (±0.85 S.E.) VT per sample (29.31 ± 0.96 for soil and 25.18 ± 0.53 for root), ranging between a minimum of 18 and a maximum of 36. In the case of Shannon and Simpson (1-D) indices, soil and root samples showed similar patterns being higher and less variable in the case of soil (Shannon 2.58 ± 0.03; Simpson 0.89 ± 0.00) than in roots (2.00 ± 0.05 and 0.78 ± 0.02, respectively). Regarding the ses.mpd index, root samples had on average smaller and more negative values than soil samples (−1.21 ± 0.11 versus 0.63 ± 0.17) and they were found to be significantly different from the generated null values (t = −7.694, p < 0.001). This means that the AM fungal communities associated with roots exhibited a significant phylogenetic clustering. Conversely, the positive values shown by soil samples also differed from null expectations (t = 2.654, p = 0.018), indicating phylogenetic overdispersion.

3.3. Drivers of AM Fungal Community Composition

Between the generated PCNM axes, only PCNM1 was found to impact AM fungal community composition (F = 1.996, R2 = 0.061, p = 0.048; Table A2) and hence was fed into the subsequent analyses. This means that the AM fungal communities tended to vary at the roughest calculated spatial scale in the studied area as far as the PCNM decomposition advanced from the widest to the smallest scale (see Figure 2; Ref. [57]).
The PERMANOVA model showed a significant effect on AM fungal community composition of the sample type (F = 11.971, R2 = 0.269, p < 0.001; Table 2). No difference in multivariate dispersion was found across sample types. This pattern was easily visualized in the RDA ordination plot (RDA model F = 5.403, p = 0.001; Figure 3) where the first axis (explaining ca. 30% of AM fungal community variance) clearly separated root from soil samples. In agreement, a series of AM fungal VT were recorded as indicators of soil and root samples (16 and 5 out of 56 recorded VT, respectively, Table A3). It is noteworthy that the five VT tied to roots belonged to Glomeraceae family; meanwhile, the 16 tied to soil were spread across Archaeosporaceae, Claroideoglomeraceae, Diversisporaceae, Glomeraceae, and Paraglomeraceae.
Space showed an impact on AM fungal community composition alone and by interacting with the cultivar (F = 2.787, R2 = 0.063, p = 0.011 and F = 2.086, R2 = 0.047, p = 0.034, respectively). The effect of space can also be seen in the RDA ordination as far as PCNM1 aligns well with the second axis of the ordination (5.6% explained variance). The cultivar was not significant, apart from its interaction with space. Nevertheless, the species indicator analyses detected four VT tied to either Callet or Merlot cultivars (Table A3). When PERMANOVA was run separately by cultivar, space (PCNM1) was found to significantly influence AM fungal community composition in both cases, Caller and Merlot (Table 3a). Alternatively, when the analysis was run on the highest and lowest values of PCNM1 separately, the cultivar only drove the AM fungal community in the case of values over the median (Table 3b): i.e., yellowish positions in Figure 2. No differences in multivariate dispersion were detected in these analyses.

4. Discussion

4.1. Diversity of Vineyard Associated AMF

The VT richness found in the present study was similar to that found in other previous studies of AM fungi using massive sequencing approaches, either in Mediterranean natural ecosystems [58,59] or in vineyards [27,29]. However, comparisons across studies of vineyards are difficult due to the scarcity and diversity of molecular analyses on AM fungi developed until now. As far as we know, only one publication uses Illumina MiSeq technology, incorporating the most widely used ribosomal region (18S) (see [42,60] for the analysis of AM fungi). The distribution of AM fungal families found in our results resembles the one found by Vukicevich et al. [31] and that found using 454-pyrosequencing in other ribosomal regions [61]. This distribution is based on the dominance of the Glomeraceae family, followed by Claroideoglomeraceae, and the rest of the families in a more marginal abundance. It is noteworthy that the wide diversity of AM fungi found in our study (up to eight families) was high in the vineyard system, in contrast with previous studies, e.g., [61]. The relationship between phylogeny and symbiotic functioning of AM fungal groups has been widely observed and linked to the functional traits they exhibit [8,62,63]. In this regard, functional differences have been mainly investigated across four main families: Glomeraceae, Gigasporaceae, Acaulosporaceae, and Claroideoglomeraceae. Glomeraceae members are identified as wide root colonizers with improved ability to confer resistance against pathogens and drought, but smaller P uptake for the plant (in comparison with Gigasporaceae) [63,64]. However, the functionality within Glomeraceae still deserves to be studied due to the wide number of species it harbors and the found contradictory results (e.g., Yang et al. [64] found increased P uptake for Glomeraceae). Gigasporaceae is characterized by producing extensive hyphae into the soil, benefitting soil aggregation and P uptake, but showing a smaller capacity of hyphal healing [65]. The latter characteristic probably makes them more likely to disappear when environmental conditions are not optimal [66]. Acaulosporaceae has been linked to stress-tolerant strategies showing poor colonization ability, both in soil and roots [67], and Claroideoglomeraceae has shown increased capacity to provide resistance against nematodes [64].
Despite the scarcity of knowledge on functionality of other glomeromycotan families, the high phylogenetic diversity found in our study indicates that this vineyard agrosystem presents a considerable functional diversity that can be translated into the provision of multiple ecosystem services by AM fungi. Indeed, we found representatives of eight out of ten accepted glomeromycotan families in the MaarjAM database belonging to the four described orders [42]. It is generally accepted that agrosystems usually harbor a decreased AM fungal diversity, often lacking important members of the AM fungal phylogeny and being composed primarily of Glomeraceae (see [66,68]). In our case, it seems the system harbors a representation of the full phylogenetic diversity of AM fungi. This wider phylogenetic diversity associated with plants with long lifespans and higher competitor abilities, as a vine is in comparison with annual crops, has been proposed and demonstrated before [59]. In agreement, another study found no differences in the diversity levels of AM fungal communities in vineyards when comparing with adjacent natural areas [69].
We detected five AM fungal virtual taxa out of 56 non-previously recorded in the MaarjAM database. This value does not differ from those found in other studies in South Spain: [59] found four novel VT out of 84, and [58] found 31 out of 96. It is possible that the insularity of our study site affected the diversity, increasing the degree of endemism. However, we should have recorded more new VT than has been found in other Mediterranean natural areas. Our results confirm the found lack of island biogeography in the diversity of the AM fungal groups on Mallorca [70].

4.2. Effect of Sample Type

We found a marked difference between the recorded AM fungal community composition and diversity in roots of vines and the surrounding soil. This was expected due to the previous knowledge about life history strategies of AM fungi, which states that members of the Glomeraceae family primarily colonize the inner root in comparison with other AM fungal families (e.g., Acaulosporaceae and Gigasporaceae [62]). This agrees with the fact that AM fungal phylogenetic diversity in the same system is usually higher in soil than in roots [58,71] and this has also been found in vineyard studies when comparing vine roots and the spore community [28].
Nevertheless, we cannot ignore that our increased phylogenetic diversity in the soil is the result of the presence of accompanying spontaneous vegetation. Although weeds were not present at the time of sampling, soil management on the farm under study allows the growth of spontaneous vegetation during part of the year. Due to the partner preferences in the AM symbiosis, higher plant diversities usually support higher diverse AM fungal communities (e.g., [7,72]). In the particular case of cover crops, their role has been highlighted as a way to recruit higher soil microbial diversity to increase the stability and functional properties of the system [73]. Indeed, some studies in vineyards have pointed out that herbaceous weed species are supporters and providers of higher AM fungal diversities [27,74,75]. In fact, the diversity of AMF determined by pyrosequencing was greater in a covered vineyard than in a tilled vineyard [29]. Our data show that it is not necessary a continuous maintenance of the cover. The maintenance of green cover during periods of time that limit its competition with the vineyard would also allow high levels of AMF diversity in the soil of the agroecosystem to be maintained. Moreover, the organic management of the vineyard may have contributed to the increased phylogenetic diversity of AM fungi.

4.3. Interactive Effect of Cultivar and Space

The most interesting result of the current study was the finding that the vine cultivar, even when grafted onto the same rootstock, drove the community composition of AM fungi. Previous studies that have found effects of the plant species genotype on the associated soil microbial communities (e.g., [76,77,78]) attribute differences to the rhizodeposits released by the plants, even at the genotype level of the same species [79]. Regarding vine, some previous studies have stated differences in soil microbial communities associated with different rootstock genotypes [80,81]. In the particular case of AM fungi, no effect of vine cultivar has been found either at rootstock [61] or cultivar [27]. We did find differences between cultivars in agreement with other studies reporting differences in AM fungal communities associated with other plant species genotypes (e.g., [11,82]). In our case, the found explained variation was relatively low (ca. 5%). However, when comparing with other studies looking for differences in AM fungal community composition across plant species, the magnitude seems similar: e.g., Varela–Cervero et al. [58] reported 8% of variation attributed to plant species, and Sepp et al. [7] 16%. Nevertheless, it has also been argued that the effect of host genotype on the composition of rhizosphere microbial communities is usually smaller in agricultural systems than in ecosystems with long-term coevolution of plant-microbial interactions, i.e., natural systems [79].
We found a significant portion of variance explained by the spatial position of the samples. In the context of ecological community assembly, spatial autocorrelation can be interpreted as an effect of dispersal events [83]. However, these patterns can be confounded with unmeasured environmental variables [84]. Although we did not record soil variables in the current study, the existence of a background soil environmental gradient seems very likely. AM fungal communities are usually shaped by soil variables such as pH, organic matter content or soil phosphorus [30,85]. Hence, a spatially autocorrelated soil environmental gradient could explain why vine cultivar interacted with space to shape the AM fungal community. In this sense, the soil gradient could imply a strong environmental filtering in one extreme, limiting the diversity of AM fungi and impeding vine cultivars to select for different AM fungal communities. Alternatively, we could record differences between cultivars in the other extreme of the gradient as we found. The hierarchy of assembly mechanisms of biological communities is a well-stated fact that locate environmental filtering at a broader spatial scales and biological interactions (as partner selection in symbiosis) at a finer level [86,87], as we found.

5. Conclusions

As agricultural practices advance towards more sustainable production, study and interest in the role and functions of plant-associated microbiomes have increased [88,89]. Soil is a pivotal component of the ecosystem and generally acts as a microbial reservoir for plants [90,91]. We have revealed interesting patterns in the AM fungal communities associated with an economically valuable crop. On one hand, we recorded a high microbial diversity that should be considered when evaluating ecosystem services associated with this crop. Moreover, the reasons behind this trend should be studied in depth to better assess the most beneficial crop management, for example in the case of cover vegetation. On the other hand, we revealed differences in the AM fungi associated with the different vine cultivars. Given that even small host genotype-mediated effects on microbiome composition can have large effects on host health [92], this pattern needs to be further evaluated, perhaps to dig into potential functional differences on the microbiota-extended plant phenotypes.

Supplementary Materials

The following are available online at https://www.mdpi.com/2309-608X/6/4/317/s1, Figure S1: Phylogenetic tree of AM fungi, Supplementary Material Methods S1: Bioinformatic pipeline (R script), Supplementary Material Methods S2: Statistical pipeline (R script).

Author Contributions

Conceptualization, E.B. and J.B.; methodology, Á.L.-G., J.A.J.-R., J.B., and E.B.; validation, Á.L.-G. and E.B.; formal analysis, Á.L.-G. and E.B.; writing—original draft preparation, Á.L.-G.; writing—review and editing, J.A.J.-R., J.C., J.B., and E.B.; funding acquisition, J.B. and J.C. All authors have read and agreed to the published version of the manuscript.

Funding

This research was co-funded by INIA Ministerio de Ciencia y Educación (Spain) and EU European Regional Development Program, grant number RTA2013-00068-C03-03. Á.L.-G. was supported by Acción 6, University of Jaén.

Acknowledgments

The authors are grateful to Miquel Llompart (UIB) for his technical support during soil sampling and DNA extractions, to Rosa Pons (Finca Can Axartell) for her support at field level during the experiment, to Alicia Barroso for support in sequencing facilities, and to Carmen V. Ozuna and Camilla M.R. Pereira for their collaboration in bioinformatic analyses. Special thanks to Jennifer A. Krumins for careful reading and comments on the use of language. Additionally, we would like to thank the two anonymous reviewers for their time and comments to improve the manuscript.

Conflicts of Interest

The authors of this paper declare no conflict of interest.

Appendix A

Figure A1. Rarefaction curves showing the relationship between sequencing depth and the number of found Virtual Taxa per sample. (a) Root samples. (b) Soil samples.
Jof 06 00317 g0a1
Table A1. Abundance of Glomeromycotan families (% of reads in the Illumina run) for the whole study and for soil and root sample separately.
FamilyAll SamplesSoil SamplesRoot Samples
Glomeraceae88.9472.8997.43
Claroideoglomeraceae6.8618.430.74
Paraglomeraceae2.835.091.64
Diversisporaceae1.012.580.17
Archaeosporaceae0.330.94<0.01
Acaulosporaceae0.020.040.00
Gigasporaceae<0.010.00<0.01
Ambisporaceae<0.01<0.01<0.01
Table A2. Significance of PCNM axes on AM fungal community composition measured via PERMANOVA (999 permutations and Euclidean distance as measure of dissimilarity). Significant p-values are highlighted in bold.
Spatial AxisDfSSMSFR2p
PCNM110.7760.7761.9960.0610.048
PCNM210.3240.3240.8330.0260.589
PCNM310.4870.4871.2540.0390.205
PCNM410.5760.5761.4820.0460.144
PCNM510.3680.3680.9460.0290.438
PCNM610.3240.3240.8340.0260.559
PCNM710.4430.4431.1410.0350.282
PCNM810.3300.3300.8490.0260.584
PCNM910.4700.4701.2100.0370.226
Residuals228.5500.389 0.676
Total3112.648 1.000
Table A3. Indicator AM fungal VT tied to different levels of sample type: Soil vs. root; and vine cultivar: Callet vs. Merlot.
Factor LevelVirtual TaxaFamilyIndicator Indexp
RootVTX113Glomeraceae0.8920.001
VTX069Glomeraceae0.8880.001
VTX214Glomeraceae0.7800.007
VTX114Glomeraceae0.6710.004
VTX100Glomeraceae0.5660.023
SoilVTX005Archaeosporaceae0.3750.025
VTX245Archaeosporaceae0.3130.043
VTX338Archaeosporaceae0.4360.006
VTX055Claroideoglomeraceae0.8960.002
VTX056Claroideoglomeraceae0.8520.001
VTX193Claroideoglomeraceae0.7490.001
VTX054Diversisporaceae0.4380.006
VTX356Diversisporaceae0.8580.001
VTX065Glomeraceae0.5000.014
VTX154Glomeraceae0.4340.014
VTX153Glomeraceae0.7810.001
VTX392Glomeraceae0.8710.002
VTX293Glomeraceae0.6460.039
VTX419Glomeraceae0.7760.002
VTX191Glomeraceae0.6380.016
VTX001aParaglomeraceae0.6250.001
CalletVTX100Claroideoglomeraceae0.5630.021
VTX072Glomeraceae0.7210.010
MerlotVTX055Glomeraceae0.7230.047
VTX114Glomeraceae0.5980.012

References

  1. Van Der Heijden, M.G.A.; Martin, F.M.; Selosse, M.-A.; Sanders, I.R. Mycorrhizal ecology and evolution: The past, the present, and the future. New Phytol. 2015, 205, 1406–1423. [Google Scholar] [CrossRef]
  2. Smith, S.E.; Read, D.J. Mycorrhizal Symbiosis, 3rd ed.; Elsevier Academic Press: New York, NY, USA, 2008; p. 800. [Google Scholar]
  3. Barea, J.M.; Palenzuela, J.; Cornejo, P.; Sánchez-Castro, I.; Navarro-Fernández, C.M.; Lopéz-García, A.; Estrada, B.; Azcón, R.; Ferrol, N.; Azcón-Aguilar, C. Ecological and functional roles of mycorrhizas in semi-arid ecosystems of Southeast Spain. J. Arid. Environ. 2011, 75, 1292–1301. [Google Scholar] [CrossRef]
  4. Bona, E.; Cantamessa, S.; Massa, N.; Manassero, P.; Marsano, F.; Copetta, A.; Lingua, G.; D’Agostino, G.; Gamalero, E.; Berta, G. Arbuscular mycorrhizal fungi and plant growth-promoting pseudomonads improve yield, quality and nutritional value of tomato: A field study. Mycorrhiza 2017, 27, 1–11. [Google Scholar] [CrossRef]
  5. Baslam, M.; Esteban, R.; García-Plazaola, J.I.; Goicoechea, N. Effectiveness of arbuscular mycorrhizal fungi (AMF) for inducing the accumulation of major carotenoids, chlorophylls and tocopherol in green and red leaf lettuces. Appl. Microbiol. Biotechnol. 2012, 97, 3119–3128. [Google Scholar] [CrossRef]
  6. Todeschini, V.; AitLahmidi, N.; Mazzucco, E.; Marsano, F.; Gosetti, F.; Robotti, E.; Bona, E.; Massa, N.; Bonneau, L.; Marengo, E.; et al. Impact of Beneficial Microorganisms on Strawberry Growth, Fruit Production, Nutritional Quality, and Volatilome. Front. Plant Sci. 2018, 9, 1611. [Google Scholar] [CrossRef]
  7. Sepp, S.K.; Davison, J.; Jairus, T.; Vasar, M.; Moora, M.; Zobel, M.; Öpik, M. Non-random association patterns in a plant–mycorrhizal fungal network reveal host–symbiont specificity. Mol. Ecol. 2019, 28, 365–378. [Google Scholar] [CrossRef]
  8. Powell, J.R.; Parrent, J.L.; Hart, M.M.; Klironomos, J.N.; Rillig, M.C.; Maherali, H. Phylogenetic trait conservatism and the evolution of functional trade-offs in arbuscular mycorrhizal fungi. Proc. R. Soc. B Biol. Sci. 2009, 276, 4237–4245. [Google Scholar] [CrossRef]
  9. Rohyadi, A.; Noviani, R.; Isnaini, M. Responses of Cowpea Genotypes to Arbuscular Mycorrhiza. AGRIVITA J. Agric. Sci. 2017, 39, 288–295. [Google Scholar] [CrossRef] [Green Version]
  10. Bazghaleh, N.; Hamel, C.; Gan, Y.; Tar’An, B.; Knight, J.D. Genotypic variation in the response of chickpea to arbuscular mycorrhizal fungi and non-mycorrhizal fungal endophytes. Can. J. Microbiol. 2018, 64, 265–275. [Google Scholar] [CrossRef]
  11. Taylor, A.; Pereira, N.; Thomas, B.; Pink, D.A.C.; Jones, J.E.; Bending, G.D. Growth and nutritional responses to arbuscular mycorrhizal fungi are dependent on onion genotype and fungal species. Biol. Fertil. Soils 2015, 51, 801–813. [Google Scholar] [CrossRef]
  12. Bever, J.D.; Richardson, S.C.; Lawrence, B.M.; Holmes, J.; Watson, M. Preferential allocation to beneficial symbiont with spatial structure maintains mycorrhizal mutualism. Ecol. Lett. 2009, 12, 13–21. [Google Scholar] [CrossRef]
  13. Kiers, E.T.; Duhamel, M.; Beesetty, Y.; Mensah, J.A.; Franken, O.; Verbruggen, E.; Fellbaum, C.R.; Kowalchuk, G.A.; Hart, M.M.; Bago, A.; et al. Reciprocal Rewards Stabilize Cooperation in the Mycorrhizal Symbiosis. Science 2011, 333, 880–882. [Google Scholar] [CrossRef] [Green Version]
  14. Mullins, M.G.; Bouquet, A.; Williams, L.E. Biology of the Grapevine; Cambridge University Press: Cambridge, UK, 1992. [Google Scholar]
  15. Pulvirenti, A.; Giugno, R.; Distefano, R.; Pigola, G.; Mongiovi’, M.; Giudice, G.; Vendramin, V.; Lombardo, A.; Cattonaro, F.; Ferro, A. A knowledge base for Vitis vinifera functional analysis. BMC Syst. Biol. 2015, 9, S5. [Google Scholar] [CrossRef] [Green Version]
  16. FAO. FAOSTAT. 2018. Available online: http://www.fao.org/faostat/en/#home (accessed on 12 October 2020).
  17. Hannah, L.; Roehrdanz, P.R.; Ikegami, M.; Shepard, A.V.; Shaw, M.R.; Tabor, G.; Zhi, L.; Marquet, P.A.; Hijmans, R.J. Climate change, wine, and conservation. Proc. Natl. Acad. Sci. USA 2013, 110, 6907–6912. [Google Scholar] [CrossRef] [Green Version]
  18. Cheng, X.; Baumgartner, K. Arbuscular mycorrhizal fungi-mediated nitrogen transfer from vineyard cover crops to grapevines. Biol. Fertil. Soils 2004, 40, 406–412. [Google Scholar] [CrossRef]
  19. Cheng, X.; Baumgartner, K. Effects of mycorrhizal roots and extraradical hyphae on 15N uptake from vineyard cover crop litter and the soil microbial community. Soil Biol. Biochem. 2006, 38, 2665–2675. [Google Scholar] [CrossRef]
  20. Brunetto, G.; Rosa, D.J.; Ambrosini, V.G.; Heinzen, J.; Ferreira, P.A.A.; Ceretta, C.A.; Soares, C.R.; Melo, G.W.; Soriani, H.H.; Nicoloso, F.T.; et al. Use of phosphorus fertilization and mycorrhization as strategies for reducing copper toxicity in young grapevines. Sci. Hortic. 2019, 248, 176–183. [Google Scholar] [CrossRef]
  21. Nikolaou, N.; Angelopoulos, K.; Karagiannidis, N. Effects of drought stress on mycorrhizal and non-mycorrhizal cabernet sauvignon grapevine, grafted onto various rootstocks. Exp. Agric. 2003, 39, 241–252. [Google Scholar] [CrossRef] [Green Version]
  22. Nogales, A.; Camprubi, A.; Estaun, V.; Marfa, V.; Calvet, C. In vitro interaction studies between Glomus intraradices and Armillaria mellea in vines. Span. J. Agric. Res. 2010, 8, 62. [Google Scholar] [CrossRef]
  23. Holland, T.; Bowen, P.; Kokkoris, V.; Urbez-Torres, J.R.; Hart, M.M. Does Inoculation with Arbuscular Mycorrhizal Fungi Reduce Trunk Disease in Grapevine Rootstocks? Horticulturae 2019, 5, 61. [Google Scholar] [CrossRef] [Green Version]
  24. Torres, N.; Hilbert, G.; Antolín, M.C.; Goicoechea, N. Aminoacids and Flavonoids Profiling in Tempranillo Berries Can Be Modulated by the Arbuscular Mycorrhizal Fungi. Plants 2019, 8, 400. [Google Scholar] [CrossRef] [PubMed] [Green Version]
  25. Antolín, M.C.; Izurdiaga, D.; Urmeneta, L.; Pascual, I.; Irigoyen, J.J.; Goicoechea, N. Dissimilar responses of ancient grapevines recovered in Navarra (Spain) to arbuscular mycorrhizal symbiosis in terms of berry quality. Agronomy 2020, 10, 473. [Google Scholar] [CrossRef] [Green Version]
  26. Likar, M.; Hančević, K.; Radić, T.; Regvar, M. Distribution and diversity of arbuscular mycorrhizal fungi in grapevines from production vineyards along the eastern Adriatic coast. Mycorrhiza 2013, 23, 209–219. [Google Scholar] [CrossRef] [PubMed]
  27. Holland, T.C.; Bowen, P.; Bogdanoff, C.; Hart, M.M. How distinct are arbuscular mycorrhizal fungal communities associating with grapevines? Biol. Fertil. Soils 2014, 50, 667–674. [Google Scholar] [CrossRef]
  28. Schreiner, R.P.; Mihara, K.L. The diversity of arbuscular mycorrhizal fungi amplified from grapevine roots (Vitis vinifera L.) in Oregon vineyards is seasonally stable and influenced by soil and vine age. Mycologia 2009, 101, 599–611. [Google Scholar] [CrossRef] [Green Version]
  29. Lumini, E.; Orgiazzi, A.; Borriello, R.; Bonfante, P.; Bianciotto, V. Disclosing arbuscular mycorrhizal fungal biodiversity in soil through a land-use gradient using a pyrosequencing approach. Environ. Microbiol. 2010, 12, 2165–2179. [Google Scholar] [CrossRef]
  30. Balestrini, R.; Magurno, F.; Walker, C.; Lumini, E.; Bianciotto, V. Cohorts of arbuscular mycorrhizal fungi (AMF) in Vitis vinifera, a typical Mediterranean fruit crop. Environ. Microbiol. Rep. 2010, 2, 594–604. [Google Scholar] [CrossRef]
  31. Vukicevich, E.; Lowery, D.T.; Eissenstat, D.; Hart, M. Changes in arbuscular mycorrhizal fungi between young and old Vitis roots. Symbiosis 2019, 78, 43–44. [Google Scholar] [CrossRef] [Green Version]
  32. Schreiner, R.P. Depth structures the community of arbuscular mycorrhizal fungi amplified from grapevine (Vitis vinifera L.) roots. Mycorrhiza 2020, 30, 149–160. [Google Scholar] [CrossRef]
  33. Bota, J.; Flexas, J.; Medrano, H. Genetic variability of photosynthesis and water use in Balearic grapevine cultivars. Ann. Appl. Biol. 2001, 138, 353–361. [Google Scholar] [CrossRef]
  34. Bota, J.; Tomás, M.; Flexas, J.; Medrano, H.; Escalona, J.M. Differences among grapevine cultivars in their stomatal behavior and water use efficiency under progressive water stress. Agric. Water Manag. 2016, 164, 91–99. [Google Scholar] [CrossRef]
  35. Florez-Sarasa, I.; Clemente-Moreno, M.J.; Cifre, J.; Capó, M.; Llompart, M.; Fernie, A.R.; Bota, J. Differences in Metabolic and Physiological Responses between Local and Widespread Grapevine Cultivars under Water Deficit Stress. Agronomy 2020, 10, 1052. [Google Scholar] [CrossRef]
  36. IUSS Working Group WRB. World Reference Base for Soil Resources 2014, update 2015. In International Soil Classification System for Naming Soils and Creating Legends for Soil Maps; World Soil Resources Reports No. 106; FAO: Rome, Italy, 2015. [Google Scholar]
  37. Simon, L.; Lalonde, M.; Bruns, T.D. Specifi amplification of 18S fungal ribosomal genes from vesicular-arbuscular endomycorrhizal fungi colonizing roots. Appl. Environ. Microbiol. 1992, 58, 291–295. [Google Scholar] [CrossRef] [PubMed] [Green Version]
  38. Lee, J.; Lee, S.; Young, J.P.W. Improved PCR primers for the detection and identification of arbuscular mycorrhizal fungi. FEMS Microbiol. Ecol. 2008, 65, 339–349. [Google Scholar] [CrossRef] [Green Version]
  39. Callahan, B.J.; McMurdie, P.J.; Rosen, M.J.; Han, A.W.; Johnson, A.J.A.; Holmes, S.P. DADA2: High-resolution sample inference from Illumina amplicon data. Nat. Methods 2016, 13, 581–583. [Google Scholar] [CrossRef] [Green Version]
  40. Quast, C.; Pruesse, E.; Yilmaz, P.; Gerken, J.; Schweer, T.; Yarza, P.; Peplies, J.; Glöckner, F.O. The silva ribosomal rna gene database project: Improved data processing and web-based tools. Nucleic Acids Res. 2013, 41, D590–D596. [Google Scholar] [CrossRef]
  41. Wang, Q.; Garrity, G.M.; Tiedje, J.M.; Cole, J.R. Naïve Bayesian Classifier for Rapid Assignment of rRNA Sequences into the New Bacterial Taxonomy. Appl. Environ. Microbiol. 2007, 73, 5261–5267. [Google Scholar] [CrossRef] [Green Version]
  42. Öpik, M.; Vanatoa, A.; Moora, M.; Davison, J.; Kalwij, J.M.; Reier, Ü.; Zobel, M. The online database MaarjAM reveals global and ecosystemic distribution patterns in arbuscular mycorrhizal fungi (Glomeromycota). New Phytol. 2010, 188, 223–241. [Google Scholar] [CrossRef]
  43. Frøslev, T.G.; Kjøller, R.; Bruun, H.H.; Ejrnæs, R.; Brunbjerg, A.K.; Pietroni, C.; Hansen, A.J. Algorithm for post-clustering curation of DNA amplicon data yields reliable biodiversity estimates. Nat. Commun. 2017, 8, 1–11. [Google Scholar] [CrossRef]
  44. Katoh, K.; Rozewicki, J.; Yamada, K.D. MAFFT online service: Multiple sequence alignment, interactive sequence choice and visualization. Briefings Bioinform. 2019, 20, 1160–1166. [Google Scholar] [CrossRef] [Green Version]
  45. Rognes, T.; Flouri, T.; Nichols, B.; Quince, C.; Mahé, F. VSEARCH: A versatile open source tool for metagenomics. PeerJ 2016, 4, e2584. [Google Scholar] [CrossRef]
  46. Schloss, P.D.; Westcott, S.L.; Ryabin, T.; Hall, J.R.; Hartmann, M.; Hollister, E.B.; Lesniewski, R.A.; Oakley, B.B.; Parks, D.H.; Robinson, C.J.; et al. Introducing mothur: Open-Source, Platform-Independent, Community-Supported Software for Describing and Comparing Microbial Communities. Appl. Environ. Microbiol. 2009, 75, 7537–7541. [Google Scholar] [CrossRef] [Green Version]
  47. Oksanen, J.; Blanchet, F.G.; Friendly, M.; Kindt, R.; Legendre, P.; McGlinn, D.; Minchin, P.R.; O’Hara, R.B.; Simpson, G.L.; Solymos, P.; et al. Vegan: Community Ecology Package; R Package Version 2.5-6; R Foundation for Statistical Computing: Vienna, Austria, 2019; Available online: https://cran.r-project.org/web/packages/vegan/index.html (accessed on 1 June 2020).
  48. Legendre, P.; Gallagher, E. Ecologically meaningful transformations for ordination of species data. Oecologia 2001, 129, 271–280. [Google Scholar] [CrossRef]
  49. Webb, C.O.; Ackerly, D.D.; McPeek, M.A.; Donoghue, M.J. Phylogenies and Community Ecology. Annu. Rev. Ecol. Syst. 2002, 33, 475–505. [Google Scholar] [CrossRef] [Green Version]
  50. Kumar, S.; Stecher, G.; Li, M.; Knyaz, C.; Tamura, K. MEGA X: Molecular Evolutionary Genetics Analysis across Computing Platforms. Mol. Biol. Evol. 2018, 35, 1547–1549. [Google Scholar] [CrossRef]
  51. Kembel, S.W.; Cowan, P.D.; Helmus, M.R.; Cornwell, W.K.; Morlon, H.; Ackerly, D.D.; Blomberg, S.P.; Webb, C.O. Picante: R tools for integrating phylogenies and ecology. Bioinformatics 2010, 26, 1463–1464. [Google Scholar] [CrossRef] [Green Version]
  52. Pinheiro, J.; Bates, D.; DebRoy, S.; Sarkar, D. Nlme: Linear and Nonlinear Mixed Effects Models; R Package Version 3.1-149; R Foundation for Statistical Computing: Vienna, Austria, 2020; Available online: https://CRAN.R-project.org/package=nlme (accessed on 1 June 2020).
  53. Zuur, A.F.; Ieno, E.N.; Walker, N.J.; Saveliev, A.A.; Smith, G.M. Mixed Effects Models and Extensions in Ecology with R; Springer: New York, NY, USA, 2009. [Google Scholar]
  54. Legendre, P.; Legendre, L. Numerical Ecology, 2nd ed.; Elsevier: Amsterdam, The Netherlands, 1998; ISBN 978-0444892508. [Google Scholar]
  55. Dufrêne, M.; Legendre, P. Species Assemblages and Indicator Species: The Need for a Flexible Asymmetrical Approach. Ecol. Monogr. 1997, 67, 345–366. [Google Scholar] [CrossRef]
  56. Roberts, D.W. Labdsv Package: Ordination and Multivariate Analysis for Ecology; R Package Version 2.0-1; R Foundation for Statistical Computing: Vienna, Austria, 2019; Available online: https://cran.r-project.org/web/packages/labdsv/index.html (accessed on 1 June 2020).
  57. Borcard, D.; Legendre, P. All-scale spatial analysis of ecological data by means of principal coordinates of neighbour matrices. Ecol. Model. 2002, 153, 51–68. [Google Scholar] [CrossRef]
  58. Varela-Cervero, S.; Vasar, M.; Davison, J.; Barea, J.M.; Öpik, M.; Azcón-Aguilar, C. The composition of arbuscular mycorrhizal fungal communities differs among the roots, spores and extraradical mycelia associated with five Mediterranean plant species. Environ. Microbiol. 2015, 17, 2882–2895. [Google Scholar] [CrossRef]
  59. López-García, Á.; Varela-Cervero, S.; Vasar, M.; Öpik, M.; Barea, J.M.; Azcón-Aguilar, C. Plant traits determine the phylogenetic structure of arbuscular mycorrhizal fungal communities. Mol. Ecol. 2017, 26, 6948–6959. [Google Scholar] [CrossRef]
  60. Hart, M.M.; Aleklett, K.; Chagnon, P.L.; Egan, C.; Ghignone, S.; Helgason, T.; Waller, L. Navigating the labyrinth: A guide to sequence-based, community ecology of arbuscular mycorrhizal fungi. New Phytol. 2015, 207, 235–247. [Google Scholar] [CrossRef]
  61. Bouffaud, M.-L.; Bernaud, E.; Colombet, A.; Van Tuinen, D.; Wipf, D.; Redecker, D. Regional-scale analysis of arbuscular mycorrhizal fungi: The case of Burgundy vineyards. J. Int. Sci. Vigne Vin 2016, 50, 1–8. [Google Scholar] [CrossRef]
  62. Hart, M.M.; Reader, R.J. Taxonomic basis for variation in the colonization strategy of arbuscular mycorrhizal fungi. New Phytol. 2002, 153, 335–344. [Google Scholar] [CrossRef]
  63. Maherali, H.; Klironomos, J.N. Influence of Phylogeny on Fungal Community Assembly and Ecosystem Functioning. Science 2007, 316, 1746–1748. [Google Scholar] [CrossRef] [Green Version]
  64. Yang, H.; Zhang, Q.; Koide, R.T.; Hoeksema, J.D.; Tang, J.; Bian, X.; Hu, S.; Chen, X. Taxonomic resolution is a determinant of biodiversity effects in arbuscular mycorrhizal fungal communities. J. Ecol. 2017, 105, 219–228. [Google Scholar] [CrossRef]
  65. Giovannini, L.; Palla, M.; Agnolucci, M.; Avio, L.; Sbrana, C.; Turrini, A.; Giovannetti, M. Arbuscular Mycorrhizal Fungi and Associated Microbiota as Plant Biostimulants: Research Strategies for the Selection of the Best Performing Inocula. Agronomy 2020, 10, 106. [Google Scholar] [CrossRef] [Green Version]
  66. Verbruggen, E.; Kiers, E.T. Evolutionary ecology of mycorrhizal functional diversity in agricultural systems. Evol. Appl. 2010, 3, 547–560. [Google Scholar] [CrossRef]
  67. Chagnon, P.-L.; Bradley, R.L.; Maherali, H.; Klironomos, J.N. A trait-based framework to understand life history of mycorrhizal fungi. Trends Plant Sci. 2013, 18, 484–491. [Google Scholar] [CrossRef]
  68. Rosendahl, S.; McGee, P.A.; Morton, J.B. Lack of global population genetic differentiation in the arbuscular mycorrhizal fungus Glomus mosseae suggests a recent range expansion which may have coincided with the spread of agriculture. Mol. Ecol. 2009, 18, 4316–4329. [Google Scholar] [CrossRef]
  69. Holland, T.C.; Bowen, P.A.; Bogdanoff, C.P.; Lowery, T.D.; Shaposhnikova, O.; Smith, S.M.; Hart, M.M. Evaluating the diversity of soil microbial communities in vineyards relative to adjacent native ecosystems. Appl. Soil Ecol. 2016, 100, 91–103. [Google Scholar] [CrossRef]
  70. Davison, J.; Moora, M.; Öpik, M.; Ainsaar, L.; Ducousso, M.; Hiiesalu, I.; Jairus, T.; Johnson, N.; Jourand, P.; Kalamees, R.; et al. Microbial island biogeography: Isolation shapes the life history characteristics but not diversity of root-symbiotic fungal communities. ISME J. 2018, 12, 2211–2224. [Google Scholar] [CrossRef] [PubMed]
  71. Hempel, S.; Renker, C.; Buscot, F. Differences in the species composition of arbuscular mycorrhizal fungi in spore, root and soil communities in a grassland ecosystem. Environ. Microbiol. 2007, 9, 1930–1938. [Google Scholar] [CrossRef] [PubMed]
  72. Van Der Heijden, M.G.A.; Klironomos, J.N.; Ursic, M.; Moutoglis, P.; Streitwolf-Engel, R.; Boller, T.; Wiemken, A.; Sanders, I.R. Mycorrhizal fungal diversity determines plant biodiversity, ecosystem variability and productivity. Nat. Cell Biol. 1998, 396, 69–72. [Google Scholar] [CrossRef]
  73. Richards, A.; Estaki, M.; Urbez-Torres, J.R.; Bowen, P.; Lowery, T.; Hart, M. Cover Crop Diversity as a Tool to Mitigate Vine Decline and Reduce Pathogens in Vineyard Soils. Diversity 2020, 12, 128. [Google Scholar] [CrossRef] [Green Version]
  74. Radić, T.; Hančević, K.; Likar, M.; Protega, I.; Jug-Dujaković, M.; Bogdanović, I. Neighbouring weeds influence the formation of arbuscular mycorrhiza in grapevine. Symbiosis 2012, 56, 111–120. [Google Scholar] [CrossRef]
  75. Massa, N.; Bona, E.; Novello, G.; Todeschini, V.; Boatti, L.; Mignone, F.; Gamalero, E.; Lingua, G.; Berta, G.; Cesaro, P. AMF communities associated to Vitis vinifera in an Italian vineyard subjected to integrated pest management at two different phenological stages. Sci. Rep. 2020, 10, 1–12. [Google Scholar] [CrossRef]
  76. Peiffer, J.A.; Spor, A.; Koren, O.; Jin, Z.; Tringe, S.G.; Dangl, J.L.; Buckler, E.S.; Ley, R.E. Diversity and heritability of the maize rhizosphere microbiome under field conditions. Proc. Natl. Acad. Sci. USA 2013, 110, 6548–6553. [Google Scholar] [CrossRef] [Green Version]
  77. Edwards, J.; Johnson, C.; Santos-Medellín, C.; Lurie, E.; Podishetty, N.K.; Bhatnagar, S.; Eisen, J.A.; Sundaresan, V. Structure, variation, and assembly of the root-associated microbiomes of rice. Proc. Natl. Acad. Sci. USA 2015, 112, E911–E920. [Google Scholar] [CrossRef] [Green Version]
  78. Jiang, Y.; Li, S.; Li, R.; Zhang, J.; Liu, Y.; Lv, L.; Zhu, H.; Wu, W.; Li, W. Plant cultivars imprint the rhizosphere bacterial community composition and association networks. Soil Biol. Biochem. 2017, 109, 145–155. [Google Scholar] [CrossRef]
  79. Philippot, L.; Raaijmakers, J.M.; Lemanceau, P.; Van Der Putten, W.H. Going back to the roots: The microbial ecology of the rhizosphere. Nat. Rev. Genet. 2013, 11, 789–799. [Google Scholar] [CrossRef]
  80. Marasco, R.; Rolli, E.; Fusi, M.; Michoud, G.; Daffonchio, D. Grapevine rootstocks shape underground bacterial microbiome and networking but not potential functionality. Microbiome 2018, 6, 1–17. [Google Scholar] [CrossRef]
  81. Berlanas, C.; Berbegal, M.; Elena, G.; Laidani, M.; Cibriain, J.F.; Sagües, A.; Gramaje, D. The Fungal and Bacterial Rhizosphere Microbiome Associated with Grapevine Rootstock Genotypes in Mature and Young Vineyards. Front. Microbiol. 2019, 10, 1142. [Google Scholar] [CrossRef] [PubMed]
  82. Ellouze, W.; Hamel, C.; Vujanovic, V.; Gan, Y.; Bouzid, S.; St-Arnaud, M. Chickpea genotypes shape the soil microbiome and affect the establishment of the subsequent durum wheat crop in the semiarid North American Great Plains. Soil Biol. Biochem. 2013, 63, 129–141. [Google Scholar] [CrossRef]
  83. Götzenberger, L.; De Bello, F.; Bråthen, K.A.; Davison, J.; Dubuis, A.; Guisan, A.; Lepš, J.; Lindborg, R.; Moora, M.; Pärtel, M.; et al. Ecological assembly rules in plant communities-approaches, patterns and prospects. Biol. Rev. 2011, 87, 111–127. [Google Scholar] [CrossRef] [PubMed]
  84. Chang, L.W.; Zeleny, D.; Li, C.F.; Chiu, S.T.; Hsieh, C.F. Better environmental data may reverse conclusions about niche- and dispersal-based processes in community assembly. Ecology 2013, 94, 2145–2151. [Google Scholar] [CrossRef] [PubMed]
  85. Jansa, J.; Erb, A.; Oberholzer, H.R.; Šmilauer, P.; Egli, S. Soil and geography are more important determinants of indigenous arbuscular mycorrhizal communities than management practices in Swiss agricultural soils. Mol. Ecol. 2014, 23, 2118–2135. [Google Scholar] [CrossRef] [PubMed]
  86. Vályi, K.; Mardhiah, U.; Rillig, M.C.; Hempel, S. Community assembly and coexistence in communities of arbuscular mycorrhizal fungi. ISME J. 2016, 10, 2341–2351. [Google Scholar] [CrossRef] [Green Version]
  87. Davison, J.; Moora, M.; Jairus, T.; Vasar, M.; Öpik, M.; Zobel, M. Hierarchical assembly rules in arbuscular mycorrhizal (AM) fungal communities. Soil Biol. Biochem. 2016, 97, 63–70. [Google Scholar] [CrossRef]
  88. Berg, G.; Rybakova, D.; Grube, M.; Köberl, M. The plant microbiome explored: Implications for experimental botany. J. Exp. Bot. 2016, 67, 995–1002. [Google Scholar] [CrossRef]
  89. Pieterse, C.M.J.; De Jonge, R.; Berendsen, R.L. The Soil-Borne Supremacy. Trends Plant Sci. 2016, 21, 171–173. [Google Scholar] [CrossRef]
  90. Corneo, P.E.; Pellegrini, A.; Cappellin, L.; Roncador, M.; Chierici, M.; Gessler, C.; Pertot, I. Microbial community structure in vineyard soils across altitudinal gradients and in different seasons. FEMS Microbiol. Ecol. 2013, 84, 588–602. [Google Scholar] [CrossRef]
  91. Mezzasalma, V.; Sandionigi, A.; Guzzetti, L.; Galimberti, A.; Grando, M.S.; Tardaguila, J.; Labra, M. Geographical and Cultivar Features Differentiate Grape Microbiota in Northern Italy and Spain Vineyards. Front. Microbiol. 2018, 9, 946. [Google Scholar] [CrossRef]
  92. Haney, C.H.; Samuel, B.S.; Bush, J.; Ausubel, F.M. Associations with rhizosphere bacteria can confer an adaptive advantage to plants. Nat. Plants 2015, 1, 1–9. [Google Scholar] [CrossRef] [Green Version]
Figure 1. Boxplots showing the distribution of diversity indices by sample type. (a) VT richness (S). (b) Shannon diversity index (H). (c) Simpson (1-D) diversity index. (d) Standardized effect size of mean pairwise phylogenetic distance (ses.mpd).
Jof 06 00317 g001
Figure 2. Spatial distribution of the first axis of the principal coordinates of neighbor matrices’ (PCNM) spatial decomposition over the studied plot. The values were interpolated across sampled points. The colored scale indicates the PCNM values.
Jof 06 00317 g002
Figure 3. RDA ordination of AM fungal communities constrained by space (PCNM first axis), sample type (root or soil), and cultivar.
Jof 06 00317 g003
Table 1. Linear models showing the effect of sample type (soil vs. root), cultivar, and their interaction on diversity indices of the arbuscular mycorrhizal (AM) fungal communities. F values and degrees of freedom (as subscripts) are shown. Bold letters indicate significant variables: * p < 0.05; *** p < 0.001.
Diversity IndexSample TypeCultivarSample Type × Cultivar
VT richness6.8031,28 *0.6191,280.7561,28
Shannon46.3481,28 ***2.7191,280.3641,28
Simpson27.2401,28 ***1.981,281.431,28
Ses.mpd43.9681,28 ***0.7211,282.1731,28
Table 2. Effect of sample type (soil vs. root), cultivar, spatial position (PCNM first axis), and their interactions with AM fungal community composition (permutational multivariate analysis of variance (PERMANOVA) 999 permutations and Euclidean distance as measure of dissimilarity). Bold values indicate significance.
VariableDfSSMSFR2p
Sample type13.4013.40111.9710.269<0.001
Cultivar10.4440.4441.5640.0350.117
Space (PCNM1)10.7920.7922.7870.0630.011
Sample type × Cultivar10.2220.2220.7820.0180.617
Sample type × Space (PCNM1)10.2340.2340.8240.0190.559
Cultivar × Space (PCNM1)10.5930.5932.0860.0470.034
Sample type × Cultivar × Space10.1430.1430.5020.0110.942
Residuals246.8190.284 0.539
Total3112.648 1.000
Table 3. Separate PERMANOVAs for cultivar (a) or PCNM1 values above and below the median value (b); 999 permutations and Euclidean distance as measure of dissimilarity. Bold values indicate significance.
(a)
Data subset
VariableDfSSMSFR2p
CalletSpace (PCNM1)10.5980.5981.9470.1010.043
Sample type11.4211.4214.6270.2390.001
PCNM × Sample type10.2360.2360.7680.0400.677
Residuals123.6860.307 0.620
Total155.942 1.000
MerlotSpace (PCNM1)10.7860.7863.0120.1260.016
Sample type12.2022.2028.4360.3520.001
PCNM × Sample type10.1410.1410.5390.0220.851
Residuals123.1330.261 0.500
Total156.262 1.000
(b)
PCNM1 >0.036Cultivar10.5900.5902.2100.1020.031
Sample type 11.8081.8086.7740.3140.001
Sample type × Cultivar10.1580.1580.5920.0270.816
Residuals123.2030.267 0.556
Total155.759 1.000
PCNM1 <0.036Cultivar10.3080.3080.9470.0500.441
Sample type 11.7581.7585.4020.2870.002
Sample type × Cultivar10.1540.1540.4720.0250.948
Residuals123.9050.325 0.638
Total156.124 1
Publisher’s Note: MDPI stays neutral with regard to jurisdictional claims in published maps and institutional affiliations.

