3.1. Temperature Dependence of Growth and Xylindein Production of Chlorociboria aeruginascens
Each organism has a tolerance range for optimal growth parameters and, consequently, also for temperature. In general, wood populating fungi are mesophilic organisms and prefer temperatures in the range of 20 to 40 °C [
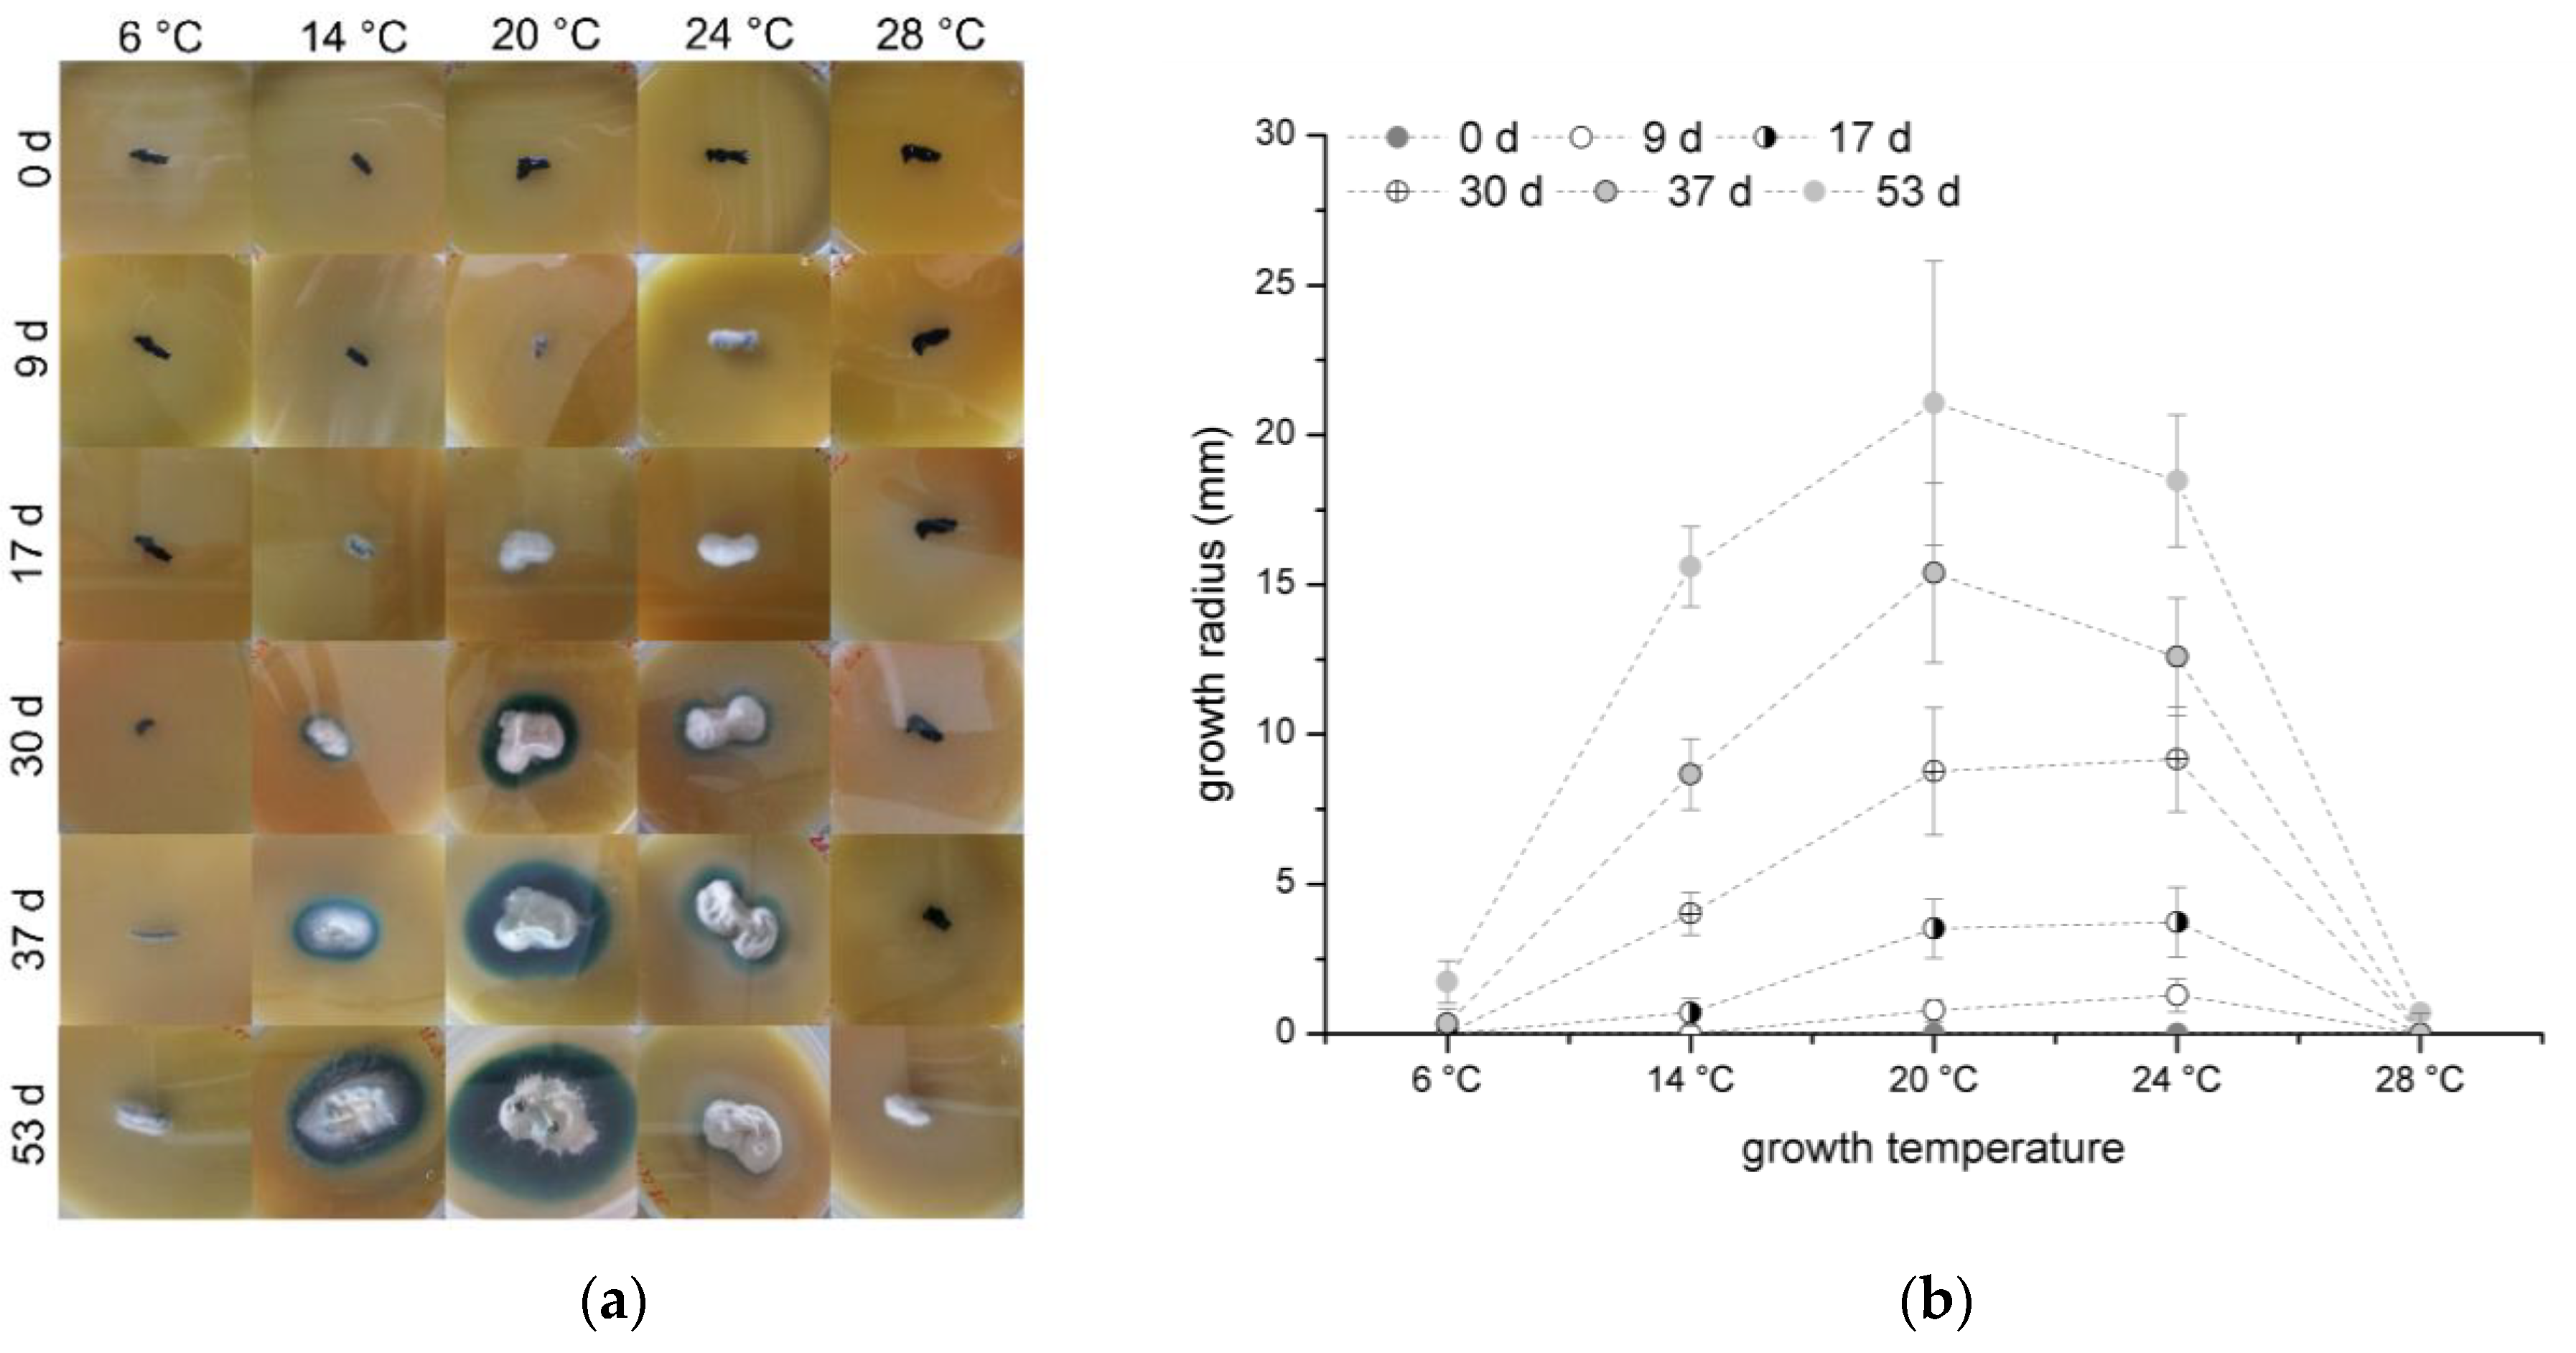
13]. In the work presented here, a temperature range from 6 to 28 °C was tested over 53 days. For the test,
C. aeruginascens was cultivated on orange juice agar and the growth radius was measured once a week. The results are presented in
Figure 1a colony appearance and
Figure 1b growth radius over the time.
In general, the fungus was able to grow at each tested temperature, but the growth rate differed. While fungal growth started with the formation of white mycelium with a light blue–green haze as surface hyphae, which transforms to a blue–green surface mycelium over time, the substrate hyphae of the whole colony created the typical blue–green color, which is caused by xylindein production.
In the experiments, 20 °C was determined as the preferable growth temperature for
C. aeruginascens as shown in
Figure 1b. Also, Richter and Glaeser determined that 22–24 °C is an optimal growth temperature [
18]. In addition, in 1928, Frenzel [
19] prepared similar experiments with the fungus
Chlorociboria aeruginosum. He observed not only a dependency of growth rate but also on the color appearances of the mycelia at different temperatures in the range of 7 to 38 °C on different growth media. He found that the optimal growth temperature was 19 °C.
While the optimal growth temperature can be confirmed, the various color appearances depending on the temperature were not observed on orange juice agar. The different behavior of the cultures in Frenzel’s experiments and the ones presented here can be due to using different fungal strains and therewith caused by biological diversity. Also, the usage of different growth media, which have a high influence on xylindein production [
10], can be the cause of differences.
Furthermore, Frenzel [
18] reported that the fungus had the same growth radius at 14 °C as it did at 25 °C. In our own experiments, the growth radius at 14 °C is smaller than at 24 °C for the cultivation on orange juice agar over time as shown in
Figure 1b. Of particular note is the different sizes of the pigmented zone. The intensified pigmentation at 14 °C could be the reason for a higher spore concentration in the orange juice agar.
C. aeruginascens belongs to the class of ascomycetes and, consequently, they are able to produce spores as mycelium cultures. From studying other fungi, it is known that lower temperatures, for example 14 °C, induce the formation of fruit bodies because it simulates the colder temperatures in fall, where fungi strive for reproduction [
13]. As a result, the higher pigmentation of
C. aeruginascens might be a reaction to the lower temperature by releasing blue–green spores.
C. aeruginascens started to grow after 37 days at 6 °C and 53 days at 28 °C. The metabolism and the growth were inhibited by the either too low or rather too high temperatures. The late growth can be explained by the mechanism of survival.
In summary, the optimal growth temperature for C. aeruginascens was determined at 20 °C and the growth is limited at a temperature lower than 6 °C and higher than 28 °C.
3.3. Xylindein Production by Chlorociboria aeruginascens Depending on Disolved Oxygen in the Liquid Growth Medium
As many wood-colonizing fungi,
Chlorociboria sp. is an aerobic organism. Thus, oxygen availability is essential for survival and growth. As already described in [
10,
22], limitations can also switch on certain metabolic pathways. Hence, in this experiment, whether oxygen limitation as a stress factor has a positive effect on xylindein production was investigated. The cultivation of
C. aeruginascens in our experiments was performed both with and without air transfer. Frenzel [
18] described an experiment with
Chlorociboria aeruginosum, where he tried to cultivate the fungus without oxygen in different agar media but because of his preparation technique, the fungus was not in a completely air-tight environment for all replicates.
He found that the colonies of fungi with more oxygen had a bigger size in diameter than colonies with less available oxygen. Frenzel did not give information about the influence of oxygen on pigment production. In his results, Frenzel described that the fungus needs oxygen and if the oxygen concentration lowers, the growth reduces. Furthermore, if the fungus is under exclusion of air for short periods, there is no damage to the fungal culture [
18].
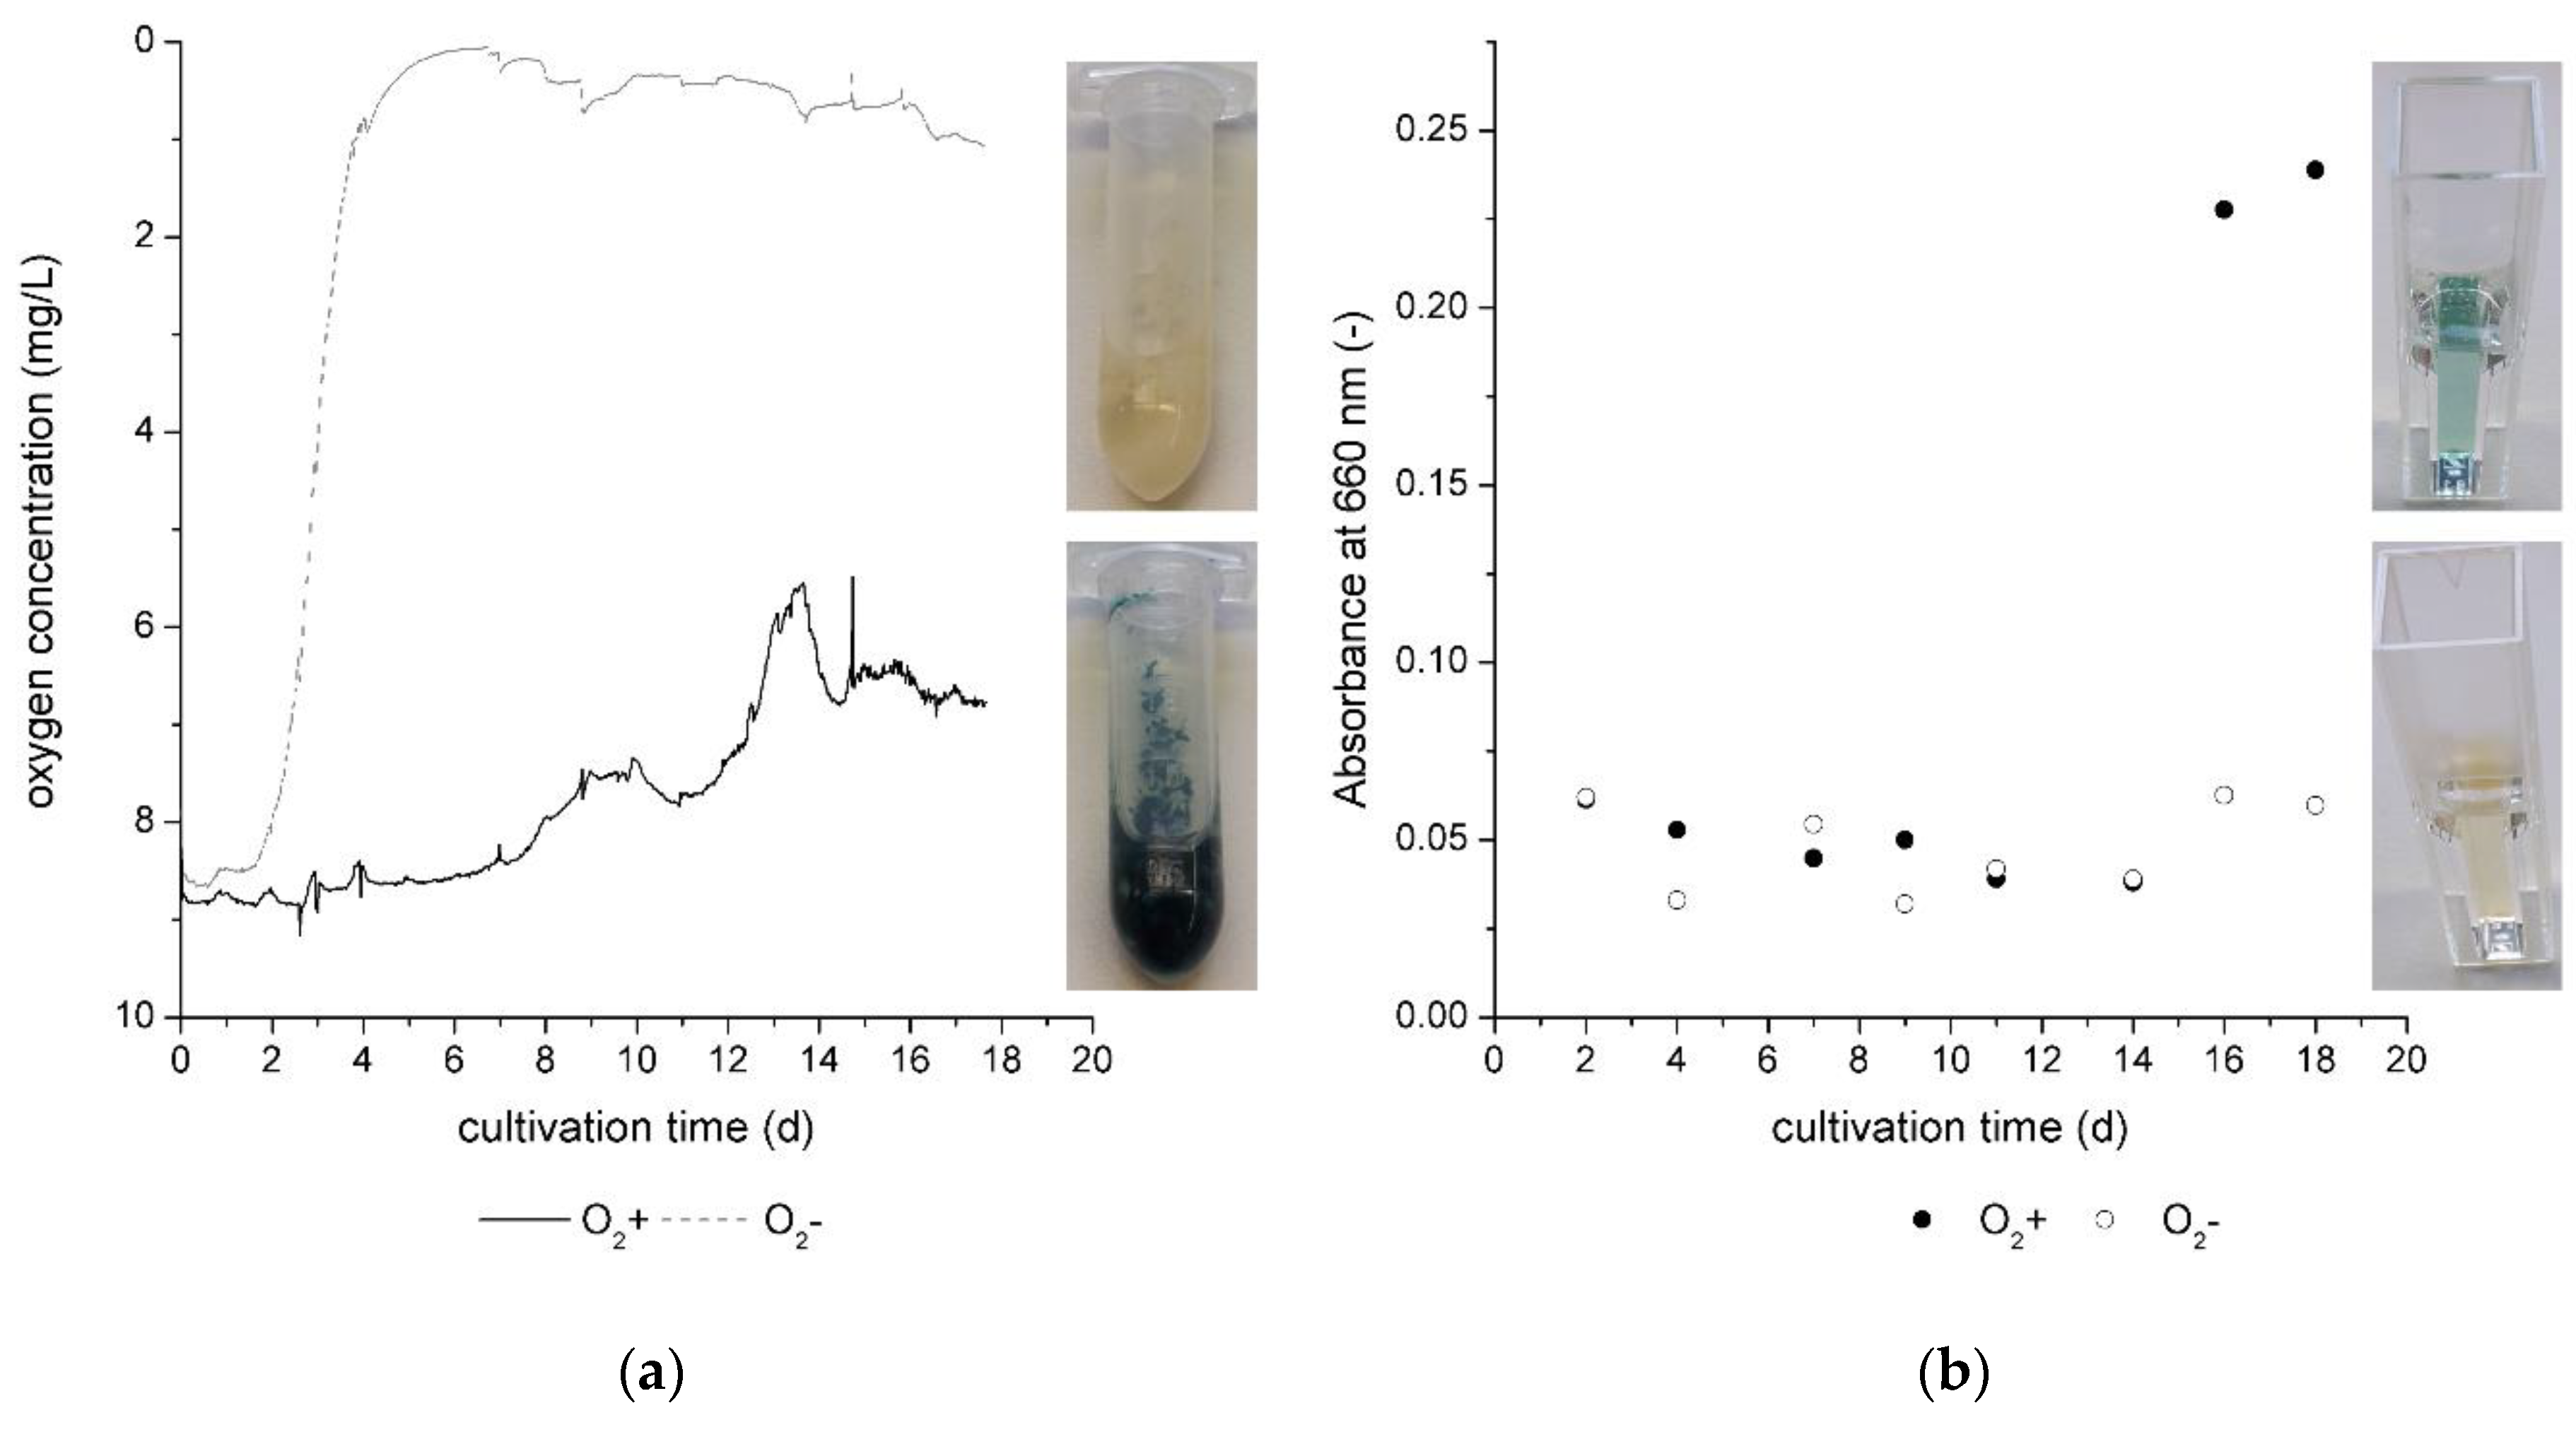
In
Figure 4a, the oxygen concentration is given over the cultivation time for cultivation without oxygen limitation (O
2+ ) and with oxygen limitation (O
2−). The oxygen level decreased approximately to 0 mg/L in the first 6 cultivation days in the cultivation without continuous air transfer. Hence, the fungus consumed the total dissolved oxygen from the nutrient broth.
For O
2+ cultivations, the oxygen concentration decreased slowly in the beginning of the cultivation. Oxygen consumption is a sign of the beginning of biomass growth and, as of day 6, the oxygen concentration decreased with a higher slope. At this point of the cultivation, the exponential growth phase started. At the same time, in the O
2- cultivation, the oxygen concentration slightly increased. This was noticed in the sampling on days 2, 4, 7 9, 11, 14, 16, and 18 of the cultivation. While the cultivation system was closed and the oxygen level was controlled during cultivation, it was shortly opened for sampling. The cultivation jars for O
2− cultivation were not flushed with nitrogen or another inert gas. Hence, it was possible that the oxygen level increased slightly in the jars during sampling. The effect is also given by
Figure 4a, indicated by small peaks on the day of sampling.
The curve shape of the oxygen concentration during the O
2+ cultivation allows us to assume that the fungal growth is separated into two different nutrient sources as observed and also mentioned in 3.4. for the light dependency cultivation. On day 11 of the O
2+ cultivation, the biomass started to change from a white to blue–green color. On the same day, the oxygen consumption in the culture medium started to rise again with a higher slope. Hence, the metabolism changed for the benefit of xylindein production. For this cultivation phase (from 11), the oxygen consumption was higher than for the first cultivation phase (day 6 to day 11). As illustrated in [
10] acetyl-CoA is the initial molecule for the polyketide pathway, which can be used by
C. aeruginascens for the production of xylindein [
4]. Aerobic organisms utilize oxygen for the production of acetyl-CoA by the oxidative decarboxylation of pyruvate from glycolysis and keto acids from protein catabolism as well as the β-oxidation of the lipid metabolism.
Xylindein is verifiable in the liquid growth medium on day 16 of the cultivation as given by
Figure 4b. At this point, the oxygen concentration did not change significantly in the culture medium, which was seen in the stationary growth phase of the fungus. The measured pigment in the liquid culture medium also did not increase significantly, which supports the statement about the stationary growth phase of the fungus.
In summary, oxygen limitation has no positive effect on pigment production in biomass or liquid media (
Figure 4b) by
C. aeruginascens. Instead, a sufficient supply of oxygen is necessary.
3.4. Light Intensity Dependency of the Growth of Chlorociboria aeruginascens
Fungal mycelia practice cell respiration. The oxygen transfer rate (OTR) and carbon dioxide transfer rate (CTR), as well as the respiratory quotient (RQ), are useful parameters to determine the growth habits of different organism during cultivation [
16,
17].
The light dependency investigation was performed in a Respiration Activity MOnitoring System (RAMOS®). The growth habits of the fungus represented by the OTR, CTR, and RQ were determined as online measurements during cultivation. The cultivation system gives the opportunity to cultivate one reference flask for each measuring flask. The reference flask was used to determine xylindein production in the growth media, while the measuring flask was only used for the online measurement of the OTR, CTR, and RQ.
As given by
Figure 5, the growth of
C. aeruginascens and also xylindein production is significantly influenced by light.
Figure 5a presents the OTR progression during cultivation for all three different tested light conditions.
Figure 5b shows the mean absorption at 660 nm of the liquid culture medium of the reference flasks over the cultivation time.
The experiment was prepared twice with the same set-up (two replicates per run), only the age of the pre-culture was different. The curve shapes, as well as the pigmentation results, were reproduced in both replicates and runs. The exponential growth started slightly earlier than in the second cultivation with the mycelium which was 3 weeks older only during the first cultivation, where the younger mycelium was used. This is a common effect which is already known in other microorganisms [
23]. However, the time lapse between the different beginnings of the exponential growth phase also depends on light intensity (difference between first and second cultivation without light accounts for 1 d; for low light intensity, accounts for 2 d; for high light intensity, accounts for 5 d). The results presented in
Figure 5a,b are descended from the first run.
A small difference between the flasks with the same light conditions was also determined, which is also presented in
Figure 5b, where the absorbance of the liquid culture media on day 23 varied between the measuring (23-M) and reference flask (23-Ref). This effect is attributed to the light source itself. For the experiment, LEDs were used. It is well known that LEDs have a certain lifetime. Hence, the light intensity, which was measured in the beginning of the experiment, is only a rough estimation for high light intensities and low light intensities, because different LED spots were used for each flask. To minimize the LED lifetime influence on both replicates of cultivation, the same flask position or LED spot was used for the same light intensity in both the first and second cultivation. As such, the quality of the data was secured.
In bioprocess engineering, the OTR is a parameter that is often used. It describes the oxygen consumption of organisms and therewith verifiable statements can be derived for biomass growth during a cultivation process. As shown in
Figure 5a, the beginning of biomass growth given by the exponential growth phase started in dark flasks earlier than in lighted flasks. Therefore, the light intensity has a significant influence. While the difference between the beginning of the exponential growth phase of the flasks with low light intensity and without light is smaller than the difference between the beginning of the exponential growth phase of the flasks with low light intensity and high light intensity, the exponential growth phase started for high light intensities when the experimental time ended. The cultivation was aborted because the assertion regarding the light intensity dependence of biomass growth and pigment production was shown at this time.
Furthermore, the curve shape of the dark cultivation represents a typical two-parted metabolism for
C. aeruginascens as investigated by Stange et al. [
10]. Here, the biomass increases in a first growth phase by using available sugars such as glucose and the nitrogen source in the orange juice. On day 11 of the cultivation, the OTR achieved its maximum, which means the biomass growth had its maximum slope. Between day 11 and 13 of the cultivation, the OTR decreased. This means that biomass growth slowed down. When the OTR increased, the metabolic activity started again. During this phase, the fungus rearranges its metabolism and passes over into the second part of the growth. On day 12 of the cultivation, the biomass started to change from a white to blue–green color. By Stange et al. [
10], it was observed that the biomass changes its color under nitrogen limitation. When
C. aeruginascens produces xylindein, it has to change its metabolism from a nitrogen-available growth to a nitrogen-limited growth. The nitrogen limitation and the rearrangement of the metabolism for the benefit of xylindein production were presented by this typical curve shape.
Figure 5b shows the absorbance at 660 nm of the liquid culture medium to evaluate the release of fungal pigments from the mycelia pellets. It was observed that the release of the pigments also depended on the applied light conditions. While the biomass of
C. aeruginascens changed from a white to blue–green color on day 12 of the dark cultivation, the pigment xylindein was firstly determined in the liquid growth media from day 19 of cultivation as given by
Figure 5b. Arguably, the balance of xylindein and biomass, which is primarily created by metabolizing the nitrogen and carbohydrate sources, is shifted to xylindein production. For instance, on day 19 of cultivation, the saturation of the biomass with pigment was reached and the fungus delivered the pigment into its environment.
The divided growth behavior, which
C. aeruginascens shows during cultivation without light, is not obviously shown during cultivation with less light intensity. While the exponential growth phase started later here than for the cultivation without light, the pigmentation of biomass started at the same time (day 12) with a much higher saturation of xylindein. As illustrated in
Figure 5b, the pigment can be documented in the liquid culture medium here on the same day (in biomass: day 12; in culture medium: day 12), which is much earlier than in dark cultivation (in biomass: day 12; in culture medium: day 19). That means that the metabolism of the first and second cultivation phases during light exposure does not take place one after the other but rather is superposed.
With a high light intensity (approx. 1300 µmol/(m2s)), biomass growth was very low, and the exponential growth phase started on day 20. At the same time, pigment production began. The biomass showed a high saturation, far higher than the biomass of dark cultivation. On the same day, xylindein can be determined with the spectrometer in the liquid culture medium.
The terms high intensity and low light intensity are relative in this case. The mean light intensity on the earth’s surface amounts to approx. 1560 µmol/(m
2s) and the light intensity at the equator on a day without clouds amounts to approx. 4700 µmol/(m
2s) [
17].
Summarizing, it was possible to prove the relation between light intensity, growth, and xylindein production of C. aeruginascens. In general, it can be stated that the lower the light intensity, the earlier the exponential growth of the fungus starts. In addition, if the culture is exposed to light, the xylindein yield is higher.
Because fungi are heterotrophic organisms, their metabolism is usually not dependent on light. However, Schmidt [
13] reports that fungal mycelium is able to respond to light by the production of spores. Light with short wavelengths (like blue light) supports this effect, while light with long wavelengths inhibits this effect. The LEDs used were covering a spectrum from 420 to 760 nm with a small amount of blue light [
17].
C. aeruginascens belongs to the class of ascomycetes and therewith they are able to produce spores as mycelium culture. A blue–green-discolored liquid culture medium was examined by light microscopy. One part of the pigment xylindein is bound to the biomass of the filamentous fungus. It was observed that another part of the pigment was bound to blue–green spores, which were spread into the liquid media. The blue–green spores can also be filtrated by ultrafiltration, with a clear yellowish medium as filtrate.
Schmidt [
13] also reports on the microbial pigment production of, for instance,
Aspergillus niger, as protection against irradiation. The pigment xylindein is known in restoration for its great UV-stable properties [
3,
13,
14,
15,
24]. Even intarsia from the 15
th century shows great colorfastness and lightfastness [
1,
15]. It might bring the relation of the UV stability of the pigment xylindein to light-dependent growth and pigment production behavior, which is presented in this work. It was observed that the biomass and pigment production, and there with the metabolism, of
C. aeruginascens is affected by light and light intensity. One might argue that light is a stress factor for
C. aeruginascens and, therefore, a trigger to change the metabolism from biomass growth to pigment production assisted by a lower growth metabolism conceivably as UV protection. Thus, light limits growth metabolism but promotes xylindein metabolism.
Chlorociboria sp. is often found on wood located under fallen leaves. This fact confirms an optimal growth in dark or lower light intensities.


