
Association of Lower Extremity Muscle Strength and Function with Renal Resistive Index in Individuals with and without Chronic Kidney Disease
 ,
,
Abstract
:1. Introduction
2. Materials and Methods
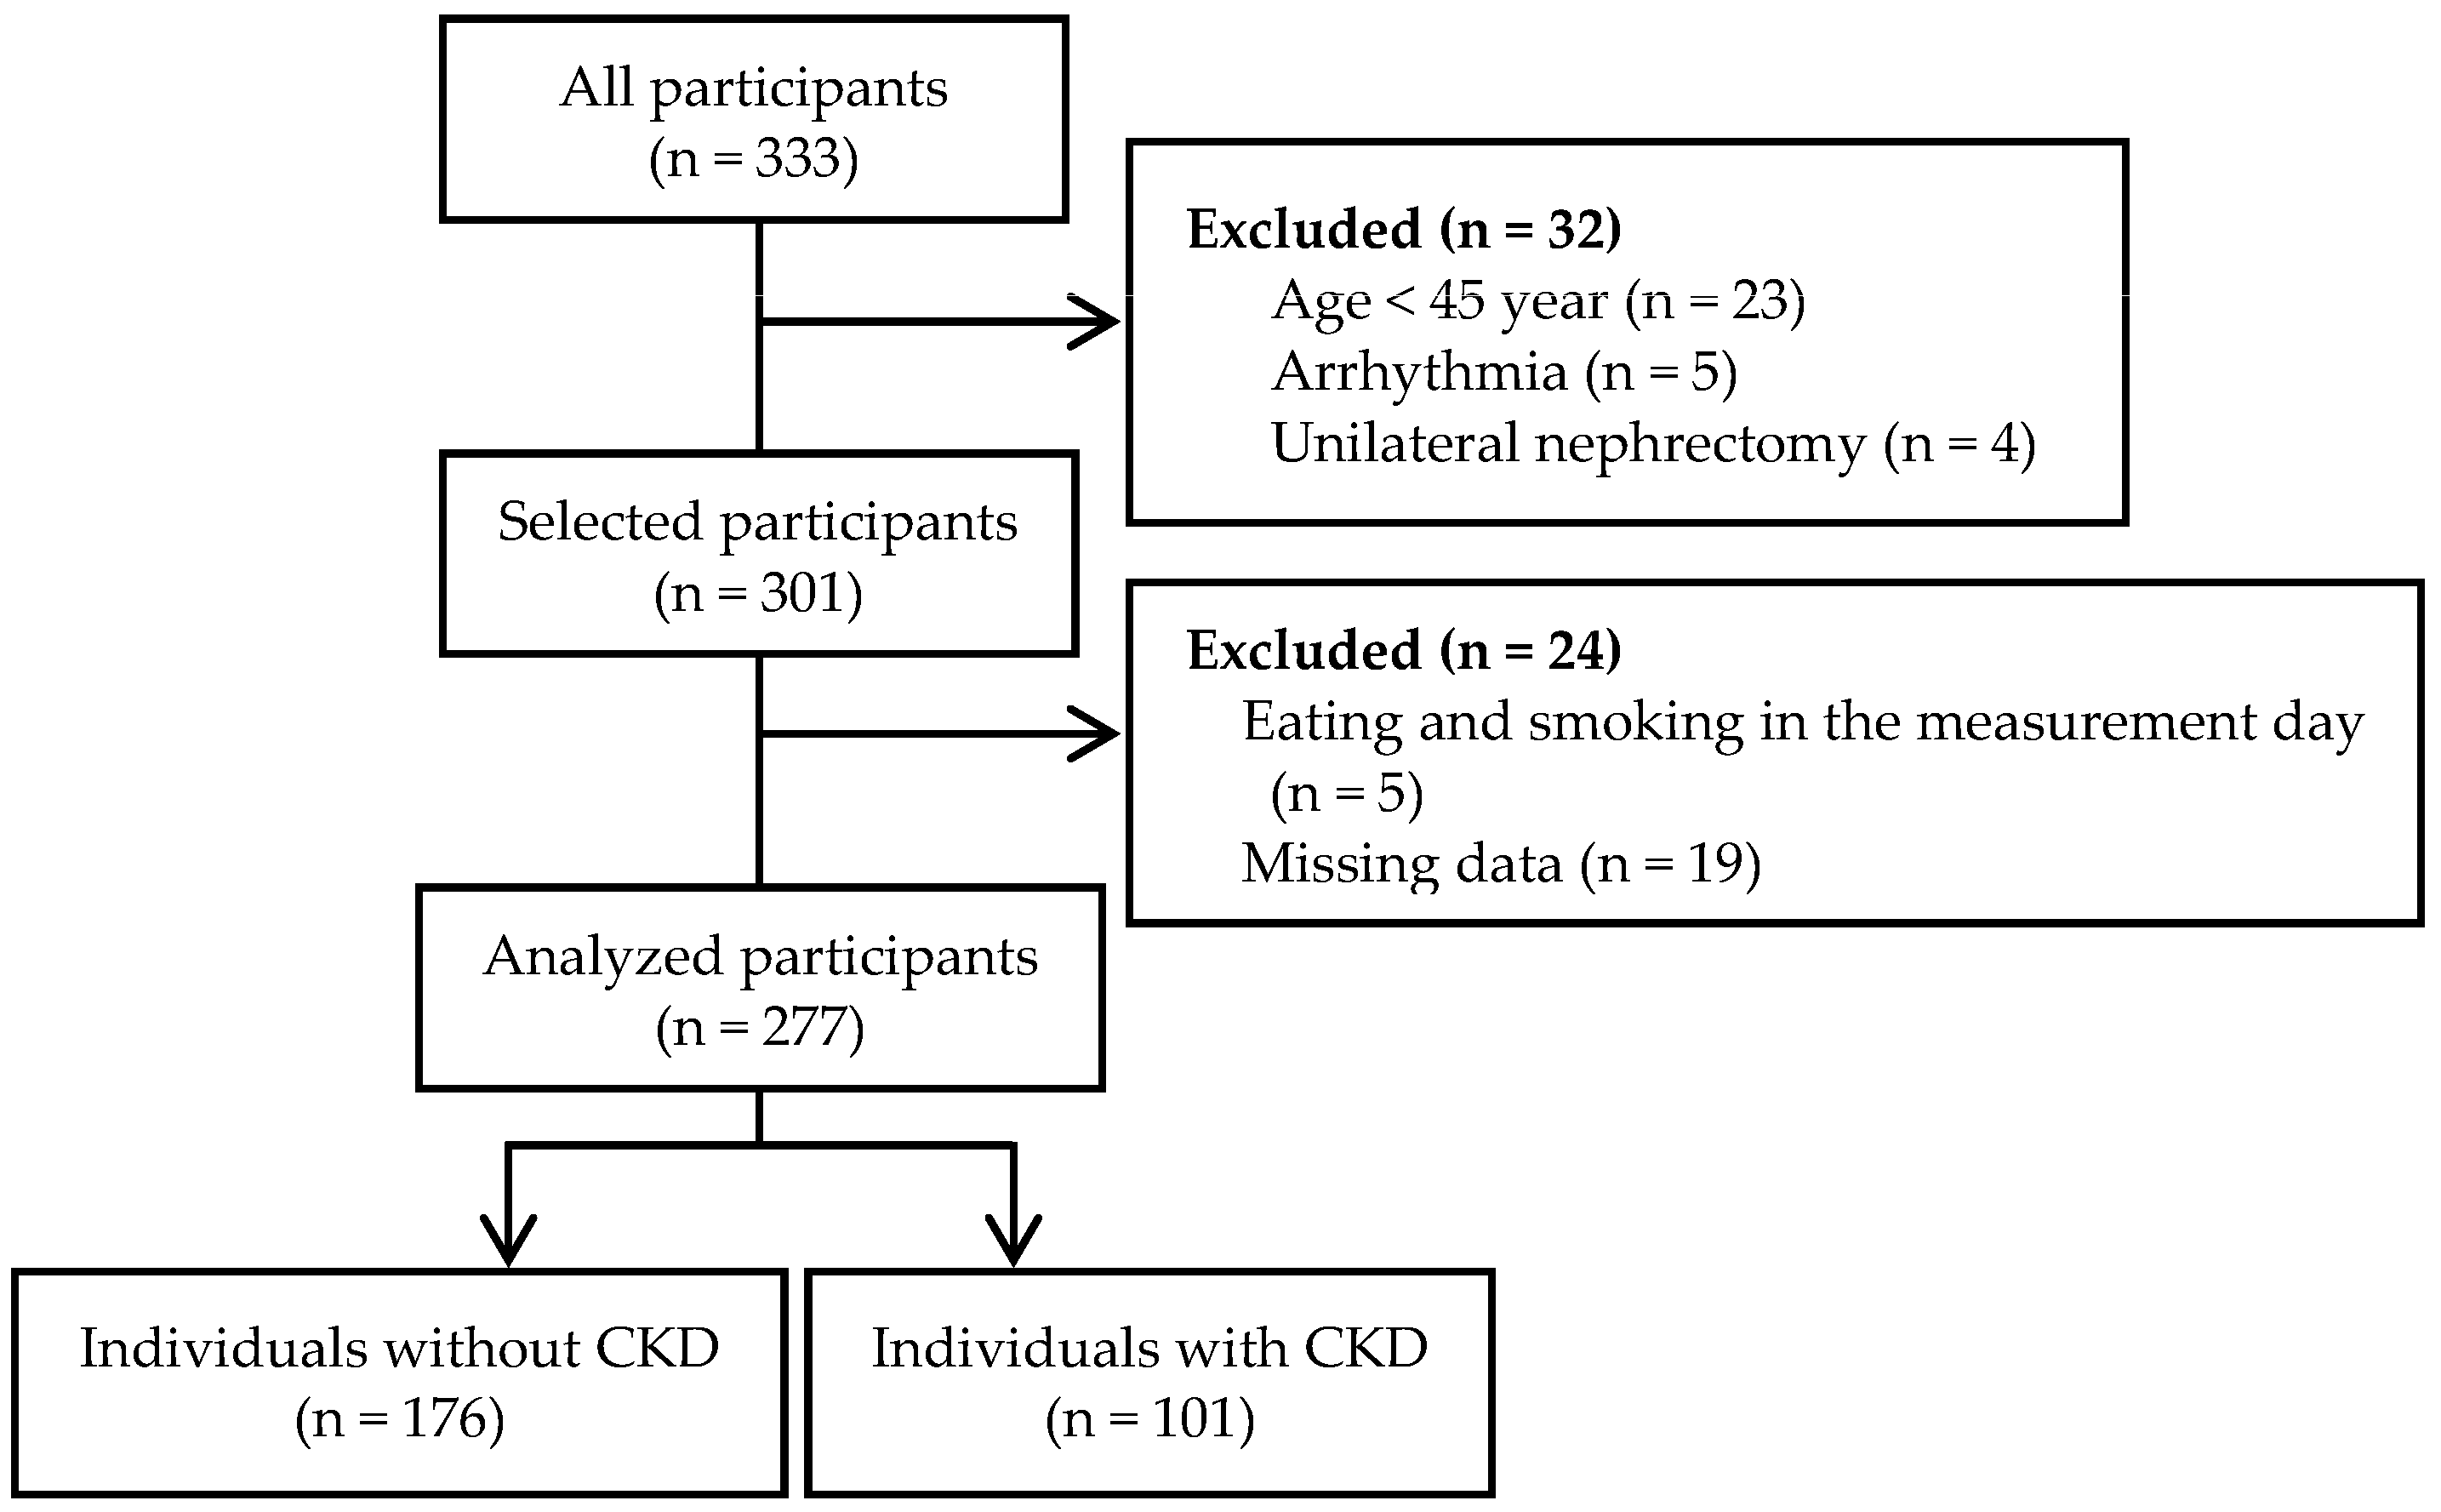
2.1. Participants
2.2. Measurements
2.2.1. Renal Doppler Ultrasound
2.2.2. Lower Extremity Muscle Strength and Function
2.2.3. Biochemical Measurements
2.2.4. Covariates
2.3. Statistical Analysis
3. Results
4. Discussion
5. Conclusions
Author Contributions
Funding
Institutional Review Board Statement
Informed Consent Statement
Data Availability Statement
Acknowledgments
Conflicts of Interest
References
- Laughlin, M.H.; Davis, M.J.; Secher, N.H.; van Lieshout, J.J.; Arce-Esquivel, A.A.; Simmons, G.H.; Bender, S.B.; Padilla, J.; Bache, R.J.; Merkus, D.; et al. Peripheral circulation. Compr. Physiol. 2012, 2, 321–447. [Google Scholar]
- Ito, S.; Nagasawa, T.; Abe, M.; Mori, T. Strain vessel hypothesis: A viewpoint for linkage of albuminuria and cerebro-cardiovascular risk. Hypertens. Res. 2009, 32, 115–121. [Google Scholar] [CrossRef]
- O’Rourke, M.F.; Hashimoto, J. Mechanical factors in arterial aging: A clinical perspective. J. Am. Coll. Cardiol. 2007, 50, 1–13. [Google Scholar] [CrossRef]
- Martin, J.E.; Sheaff, M.T. Renal ageing. J. Pathol. 2007, 211, 198–205. [Google Scholar] [CrossRef]
- Zhou, X.J.; Rakheja, D.; Yu, X.; Saxena, R.; Vaziri, N.D.; Silva, F.G. The aging kidney. Kidney Int. 2008, 74, 710–720. [Google Scholar] [CrossRef]
- O’Neill, W.C. Renal resistive index: A case of mistaken identity. Hypertension 2014, 64, 915–917. [Google Scholar] [CrossRef]
- Ikee, R.; Kobayashi, S.; Hemmi, N.; Imakiire, T.; Kikuchi, Y.; Moriya, H.; Suzuki, S.; Miura, S. Correlation between the resistive index by Doppler ultrasound and kidney function and histology. Am. J. Kidney Dis. 2005, 46, 603–609. [Google Scholar] [CrossRef]
- Parolini, C.; Noce, A.; Staffolani, E.; Giarrizzo, G.F.; Costanzi, S.; Splendiani, G. Renal resistive index and long-term outcome in chronic nephropathies. Radiology 2009, 252, 888–896. [Google Scholar] [CrossRef]
- Doi, Y.; Iwashima, Y.; Yoshihara, F.; Kamide, K.; Hayashi, S.; Kubota, Y.; Nakamura, S.; Horio, T.; Kawano, Y. Renal resistive index and cardiovascular and renal outcomes in essential hypertension. Hypertension 2012, 60, 770–777. [Google Scholar] [CrossRef]
- Toledo, C.; Thomas, G.; Schold, J.D.; Arrigain, S.; Gornik, H.L.; Nally, J.V.; Navaneethan, S.D. Renal resistive index and mortality in chronic kidney disease. Hypertension 2015, 66, 382–388. [Google Scholar] [CrossRef]
- Boddi, M.; Bonizzoli, M.; Chiostri, M.; Begliomini, D.; Molinaro, A.; Tadini Buoninsegni, L.; Gensini, G.F.; Peris, A. Renal Resistive Index and mortality in critical patients with acute kidney injury. Eur. J. Clin. Investig. 2016, 46, 242–251. [Google Scholar] [CrossRef]
- Afsar, B.; Elsurer, R. Increased renal resistive index in type 2 diabetes: Clinical relevance, mechanisms and future directions. Diabetes Metab. Syndr. 2017, 11, 291–296. [Google Scholar] [CrossRef]
- Kosaki, K.; Tarumi, T.; Sugawara, J.; Tanahashi, K.; Kumagai, H.; Matsui, M.; Sugaya, T.; Osuka, Y.; Tanaka, K.; Kuro-o, M.; et al. Renal hemodynamics across the adult lifespan: Relevance of flow pulsatility to chronic kidney disease. Exp. Gerontol. 2021, 152, 111459. [Google Scholar] [CrossRef]
- Hashimoto, J.; Ito, S. Central pulse pressure and aortic stiffness determine renal hemodynamics: Pathophysiological implication for microalbuminuria in hypertension. Hypertension 2011, 58, 839–846. [Google Scholar] [CrossRef]
- Kosaki, K.; Kamijo-Ikemori, A.; Sugaya, T.; Tanahashi, K.; Kumagai, H.; Sawano, Y.; Osuka, Y.; Tanaka, K.; Kimura, K.; Shibagaki, Y.; et al. Association between muscular strength and intrarenal vascular resistance in middle-aged and older individuals. Exp. Gerontol. 2017, 91, 72–78. [Google Scholar] [CrossRef]
- Artero, E.G.; Lee, D.C.; Lavie, C.J.; España-Romero, V.; Sui, X.; Church, T.S.; Blair, S.N. Effects of muscular strength on cardiovascular risk factors and prognosis. J. Cardiopulm. Rehabil. Prev. 2012, 32, 351–358. [Google Scholar] [CrossRef]
- Levey, A.S.; de Jong, P.E.; Coresh, J.; El Nahas, M.; Astor, B.C.; Matsushita, K.; Gansevoort, R.T.; Kasiske, B.L.; Eckardt, K.U. The definition, classification, and prognosis of chronic kidney disease: A KDIGO Controversies Conference report. Kidney Int. 2011, 80, 17–28. [Google Scholar] [CrossRef]
- Woodard, T.; Sigurdsson, S.; Gotal, J.D.; Torjesen, A.A.; Inker, L.A.; Aspelund, T.; Eiriksdottir, G.; Gudnason, V.; Harris, T.B.; Launer, L.J.; et al. Mediation analysis of aortic stiffness and renal microvascular function. J. Am. Soc. Nephrol. 2015, 26, 1181–1187. [Google Scholar] [CrossRef]
- Platt, J.F.; Ellis, J.H.; Rubin, J.M.; DiPietro, M.A.; Sedman, A.B. Intrarenal arterial Doppler sonography in patients with nonobstructive renal disease: Correlation of resistive index with biopsy findings. Am. J. Roentgenol. 1990, 154, 1223–1227. [Google Scholar] [CrossRef]
- Bohannon, R.W. Comfortable and maximum walking speed of adults aged 20–79 years: Reference values and determinants. Age Ageing 1997, 26, 15–19. [Google Scholar] [CrossRef]
- Cruz-Jentoft, A.J.; Bahat, G.; Bauer, J.; Boirie, Y.; Bruyère, O.; Cederholm, T.; Cooper, C.; Landi, F.; Rolland, Y.; Sayer, A.A.; et al. Sarcopenia: Revised European consensus on definition and diagnosis. Age Ageing 2019, 48, 601. [Google Scholar] [CrossRef]
- Alcazar, J.; Kamper, R.S.; Aagaard, P.; Haddock, B.; Prescott, E.; Ara, I.; Suetta, C. Relation between leg extension power and 30-s sit-to-stand muscle power in older adults: Validation and translation to functional performance. Sci. Rep. 2020, 10, 16337. [Google Scholar] [CrossRef]
- Kis, O.; Buch, A.; Eldor, R.; Rubin, A.; Dunsky, A.; Stern, N.; Moran, D.S. Should knee extension strength testing be implemented as a screening test for identifying probable and confirmed sarcopenia in older T2DM patients? Eur. Rev. Aging Phys. Act. 2022, 19, 5. [Google Scholar] [CrossRef]
- Hiraki, K.; Yasuda, T.; Hotta, C.; Izawa, K.P.; Morio, Y.; Watanabe, S.; Sakurada, T.; Shibagaki, Y.; Kimura, K. Decreased physical function in pre-dialysis patients with chronic kidney disease. Clin. Exp. Nephrol. 2013, 17, 225–231. [Google Scholar] [CrossRef]
- Matsuzawa, R.; Matsunaga, A.; Wang, G.; Yamamoto, S.; Kutsuna, T.; Ishii, A.; Abe, Y.; Yoneki, K.; Yoshida, A.; Takahira, N. Relationship between lower extremity muscle strength and all-cause mortality in Japanese patients undergoing dialysis. Phys. Ther. 2014, 94, 947–956. [Google Scholar] [CrossRef]
- Katoh, M.; Yamasaki, H. Comparison of reliability of isometric leg muscle strength measurements made using a hand-held dynamometer with and without a restraining belt. J. Phys. Ther. Sci. 2009, 21, 37–42. [Google Scholar] [CrossRef]
- Studenski, S.; Perera, S.; Patel, K.; Rosano, C.; Faulkner, K.; Inzitari, M.; Brach, J.; Chandler, J.; Cawthon, P.; Connor, E.B.; et al. Gait speed and survival in older adults. JAMA 2011, 305, 50–58. [Google Scholar] [CrossRef]
- Jones, C.; Rikli, R.; Beam, W. A 30-s chair-stand test as a measure of lower body strength in community-residing older adults. Res. Q. Exerc. Sport 1999, 70, 113–119. [Google Scholar] [CrossRef]
- Yoshioka, M.; Kosaki, K.; Matsui, M.; Takahashi, K.; Shibata, A.; Oka, K.; Kuro-o, M.; Saito, C.; Yamagata, K.; Maeda, S. Physical activity, sedentary behavior, and skeletal muscle strength in patients with chronic kidney disease: An isotemporal substitution approach. Phys. Ther. 2021, 101, pzab101. [Google Scholar] [CrossRef]
- Matsuo, S.; Imai, E.; Horio, M.; Yasuda, Y.; Tomita, K.; Nitta, K.; Yamagata, K.; Tomino, Y.; Yokoyama, H.; Hishida, A.; et al. Revised equations for estimated GFR from serum creatinine in Japan. Am. J. Kidney Dis. 2009, 53, 982–992. [Google Scholar] [CrossRef]
- Horio, M.; Imai, E.; Yasuda, Y.; Watanabe, T.; Matsuo, S.; Collaborators Developing the Japanese Equation for Estimated GFR. GFR estimation using standardized serum cystatin C in Japan. Am. J. Kidney Dis. 2013, 61, 197–203. [Google Scholar] [CrossRef]
- Horio, M.; Imai, E.; Yasuda, Y.; Watanabe, T.; Matsuo, S. Performance of GFR equations in Japanese subjects. Clin. Exp. Nephrol. 2013, 17, 352–358. [Google Scholar] [CrossRef]
- Sugawara, J.; Hayashi, K.; Tanaka, H. Distal shift of arterial pressure wave reflection sites with aging. Hypertension 2010, 56, 920–925. [Google Scholar] [CrossRef]
- Sugawara, J.; Hayashi, K.; Yokoi, T.; Tanaka, H. Age-associated elongation of the ascending aorta in adults. JACC Cardiovasc. Imaging 2008, 1, 739–748. [Google Scholar] [CrossRef]
- Craig, C.L.; Marshall, A.L.; Sjöström, M.; Bauman, A.E.; Booth, M.L.; Ainsworth, B.E.; Pratt, M.; Ekelund, U.; Yngve, A.; Sallis, J.F.; et al. International physical activity questionnaire: 12-country reliability and validity. Med. Sci. Sports Exerc. 2003, 35, 1381–1395. [Google Scholar] [CrossRef]
- Calabia, J.; Torguet, P.; Garcia, I.; Martin, N.; Mate, G.; Marin, A.; Molina, C.; Valles, M. The relationship between renal resistive index, arterial stiffness, and atherosclerotic burden: The link between macrocirculation and microcirculation. J. Clin. Hypertens. 2014, 16, 186–191. [Google Scholar] [CrossRef]
- Kim, J.K.; Choi, S.R.; Choi, M.J.; Kim, S.G.; Lee, Y.K.; Noh, J.W.; Kim, H.J.; Song, Y.R. Prevalence of and factors associated with sarcopenia in elderly patients with end-stage renal disease. Clin. Nutr. 2014, 33, 64–68. [Google Scholar] [CrossRef]
- Tabibi, H.; As’habi, A.; Najafi, I.; Hedayati, M. Prevalence of dynapenic obesity and sarcopenic obesity and their associations with cardiovascular disease risk factors in peritoneal dialysis patients. Kidney Res. Clin. Pract. 2018, 37, 404–413. [Google Scholar] [CrossRef]
- Tap, L.; Kirkham, F.A.; Mattace-Raso, F.; Joly, L.; Rajkumar, C.; Benetos, A. Unraveling the links underlying arterial stiffness, bone demineralization, and muscle loss. Hypertension 2020, 76, 629–639. [Google Scholar] [CrossRef]
- Piotrowicz, K.; Klich-Rączka, A.; Skalska, A.; Gryglewska, B.; Grodzicki, T.; Gąsowski, J. Pulse wave velocity and sarcopenia in older persons—A systematic review and meta-analysis. Int. J. Environ. Res. Public Health 2022, 19, 6477. [Google Scholar] [CrossRef]
- Fujie, S.; Sato, K.; Miyamoto-Mikami, E.; Hasegawa, N.; Fujita, S.; Sanada, K.; Hamaoka, T.; Iemitsu, M. Reduction of arterial stiffness by exercise training is associated with increasing plasma apelin level in middle-aged and older adults. PLoS ONE 2014, 9, e93545. [Google Scholar] [CrossRef]
- Inoue, K.; Fujie, S.; Hasegawa, N.; Horii, N.; Uchida, M.; Iemitsu, K.; Sanada, K.; Hamaoka, T.; Iemitsu, M. Aerobic exercise training-induced irisin secretion is associated with the reduction of arterial stiffness via nitric oxide production in adults with obesity. Appl. Physiol. Nutr. Metab. 2020, 45, 715–722. [Google Scholar] [CrossRef]
- Hanatani, S.; Izumiya, Y.; Araki, S.; Rokutanda, T.; Kimura, Y.; Walsh, K.; Ogawa, H. Akt1-mediated fast/glycolytic skeletal muscle growth attenuates renal damage in experimental kidney disease. J. Am. Soc. Nephrol. 2014, 25, 2800–2811. [Google Scholar] [CrossRef]
- Roshanravan, B.; Robinson-Cohen, C.; Patel, K.V.; Ayers, E.; Littman, A.J.; de Boer, I.H.; Ikizler, T.A.; Himmelfarb, J.; Katzel, L.I.; Kestenbaum, B.; et al. Association between physical performance and all-cause mortality in CKD. J. Am. Soc. Nephrol. 2013, 24, 822–830. [Google Scholar] [CrossRef]
- Watson, E.L.; Greening, N.J.; Viana, J.L.; Aulakh, J.; Bodicoat, D.H.; Barratt, J.; Feehally, J.; Smith, A.C. Progressive resistance exercise training in CKD: A feasibility study. Am. J. Kidney Dis. 2015, 66, 249–257. [Google Scholar] [CrossRef]
- Straight, C.R.; Lindheimer, J.B.; Brady, A.O.; Dishman, R.K.; Evans, E.M. Effects of resistance training on lower-extremity muscle power in middle-aged and older adults: A systematic review and meta-analysis of randomized controlled trials. Sports Med. 2016, 46, 353–364. [Google Scholar] [CrossRef]
- Castaneda, C.; Gordon, P.L.; Uhlin, K.L.; Levey, A.S.; Kehayias, J.J.; Dwyer, J.T.; Fielding, R.A.; Roubenoff, R.; Singh, M.F. Resistance training to counteract the catabolism of a low-protein diet in patients with chronic renal insufficiency. A randomized, controlled trial. Ann. Intern. Med. 2001, 135, 965–976. [Google Scholar] [CrossRef]
- Suzuki, M.; Yamada, S.; Inamura, A.; Omori, Y.; Kirimoto, H.; Sugimura, S.; Miyamoto, M. Reliability and validity of measurements of knee extension strength obtained from nursing home residents with dementia. Am. J. Phys. Med. Rehabil. 2009, 88, 924–933. [Google Scholar] [CrossRef]


| Variable | All (n = 277) | Non-CKD (n = 176) | CKD (n = 101) | p |
|---|---|---|---|---|
| Age, years | 64 ± 9 | 63 ± 9 | 66 ± 8 | 0.005 |
| Women, n (%) | 184 (66) | 132 (75) | 52 (51) | <0.001 |
| Height, cm | 159.2 ± 8.4 | 158.7 ± 7.9 | 160.0 ± 9.2 | 0.255 |
| Body mass, kg | 57.1 ± 10.9 | 55.8 ± 10.2 | 59.3 ± 11.9 | 0.014 |
| BMI, kg/m2 | 22.4 ± 3.3 | 22.1 ± 3.0 | 23.1 ± 3.8 | 0.052 |
| eGFR, mL/min/1.73 m2 | 82 [64–95] | 90 [81–97] | 57 [45–74] | <0.001 |
| Urinary ACR, mg/g | 14 [7–38] | 9 [6–14] | 76 [32–446] | <0.001 |
| Heart rate, bpm | 60 [54–65] | 59 [54–63] | 60 [54–65] | 0.002 |
| Brachial systolic blood pressure, mmHg | 122 ± 15 | 119 ± 14 | 128 ± 15 | <0.001 |
| Brachial diastolic blood pressure, mmHg | 73 ± 10 | 71 ± 10 | 77 ± 10 | <0.001 |
| Mean arterial pressure, mmHg | 90 ± 11 | 87 ± 11 | 94 ± 11 | <0.001 |
| Aortic pulse pressure, mmHg | 38 ± 8 | 37 ± 8 | 40 ± 8 | 0.001 |
| Carotid-femoral PWV, cm/s | 900 [786–1029] | 851 [759–956] | 1007 [904–1161] | <0.001 |
| Renal RI | 0.63 ± 0.06 | 0.61 ± 0.05 | 0.65 ± 0.06 | <0.001 |
| Renal RI ≥ 0.70, n (%) | 21 (8) | 5 (3) | 16 (16) | <0.001 |
| Knee extensor muscle strength, kgf/kg | 0.60 ± 0.17 | 0.59 ± 0.16 | 0.60 ± 0.19 | 0.662 |
| Gait speed, m/s | 2.35 ± 0.45 | 2.42 ± 0.45 | 2.23 ± 0.44 | <0.001 |
| 30 s chair stand test, repetitions | 20 ± 5 * | 21 ± 5 † | 18 ± 5 | <0.001 |
| Physical activity, METs- hour/week | 1386 [594–2772] | 1386 [588–2772] | 1386 [594–2772] | 0.971 |
| GFR stages | <0.001 | |||
| eGFR stage 1 (eGFR: ≥90 mL/min/1.73 m2), n (%) | 101 (37) | 90 (51) | 11 (11) | |
| eGFR stage 2 (eGFR: 60–89 mL/min/1.73 m2), n (%) | 117 (42) | 86 (49) | 31 (31) | |
| eGFR stage 3 (eGFR: 30–59 mL/min/1.73 m2), n (%) | 50 (18) | 0 (0) | 50 (49) | |
| eGFR stage 4 (eGFR: 15–29 mL/min/1.73 m2), n (%) | 9 (3) | 0 (0) | 9 (9) | |
| Albuminuria stages | <0.001 | |||
| Normoalbuminuria (urinary ACR: <30 mg/g), n (%) | 194 (70) | 176 (0) | 18 (18) | |
| Microalbuminuria (urinary ACR: 30–299 mg/g), n (%) | 51 (18) | 0 (0) | 51 (50) | |
| Macroalbuminuria (urinary ACR: ≥300 mg/g), n (%) | 32 (12) | 0 (0) | 32 (32) | |
| Antihypertensive medicine, n (%) | 89 (32) | 25 (14) | 64 (63) | <0.001 |
| Hypoglycemic medicine, n (%) | 19 (7) | 4 (2) | 15 (15) | <0.001 |
| Antidyslipidemic medicine, n (%) | 70 (25) | 25 (14) | 45 (45) | <0.001 |
| Hypertension, n (%) | 108 (39) | 36 (20) | 72 (71) | <0.001 |
| Diabetes, n (%) | 63 (23) | 27 (15) | 36 (36) | <0.001 |
| Dyslipidemia, n (%) | 150 (54) | 89 (51) | 61 (60) | 0.114 |
| Non-CKD | CKD | p | |
|---|---|---|---|
| eGFR stage 1 (Non-CKD, n = 90; CKD, n = 11) | |||
| Renal RI | 0.60 ± 0.04 | 0.64 ± 0.05 | 0.032 |
| eGFR stage 2 (Non-CKD, n = 86; CKD, n = 31) | |||
| Renal RI | 0.63 ± 0.05 | 0.64 ± 0.05 | 0.161 |
| All | Non-CKD | CKD | ||||
|---|---|---|---|---|---|---|
| r | p | r | p | r | p | |
| Age | 0.484 | <0.001 | 0.562 | <0.001 | 0.325 | <0.001 |
| BMI | 0.182 | 0.002 | 0.060 | 0.426 | 0.234 | 0.019 |
| eGFR | −0.422 | <0.001 | −0.278 | <0.001 | −0.272 | 0.006 |
| Urinary ACR | 0.308 | <0.001 | 0.286 | <0.001 | 0.245 | 0.014 |
| Heart rate | −0.007 | 0.911 | −0.066 | 0.384 | −0.101 | 0.313 |
| Brachial SBP | 0.298 | <0.001 | 0.248 | <0.001 | 0.166 | 0.097 |
| Brachial DBP | −0.052 | 0.392 | −0.085 | 0.261 | −0.288 | 0.004 |
| Mean arterial pressure | 0.104 | 0.085 | 0.060 | 0.430 | −0.100 | 0.321 |
| Aortic pulse pressure | 0.566 | <0.001 | 0.527 | <0.001 | 0.561 | <0.001 |
| Carotid-femoral PWV | 0.457 | <0.001 | 0.327 | <0.001 | 0.424 | <0.001 |
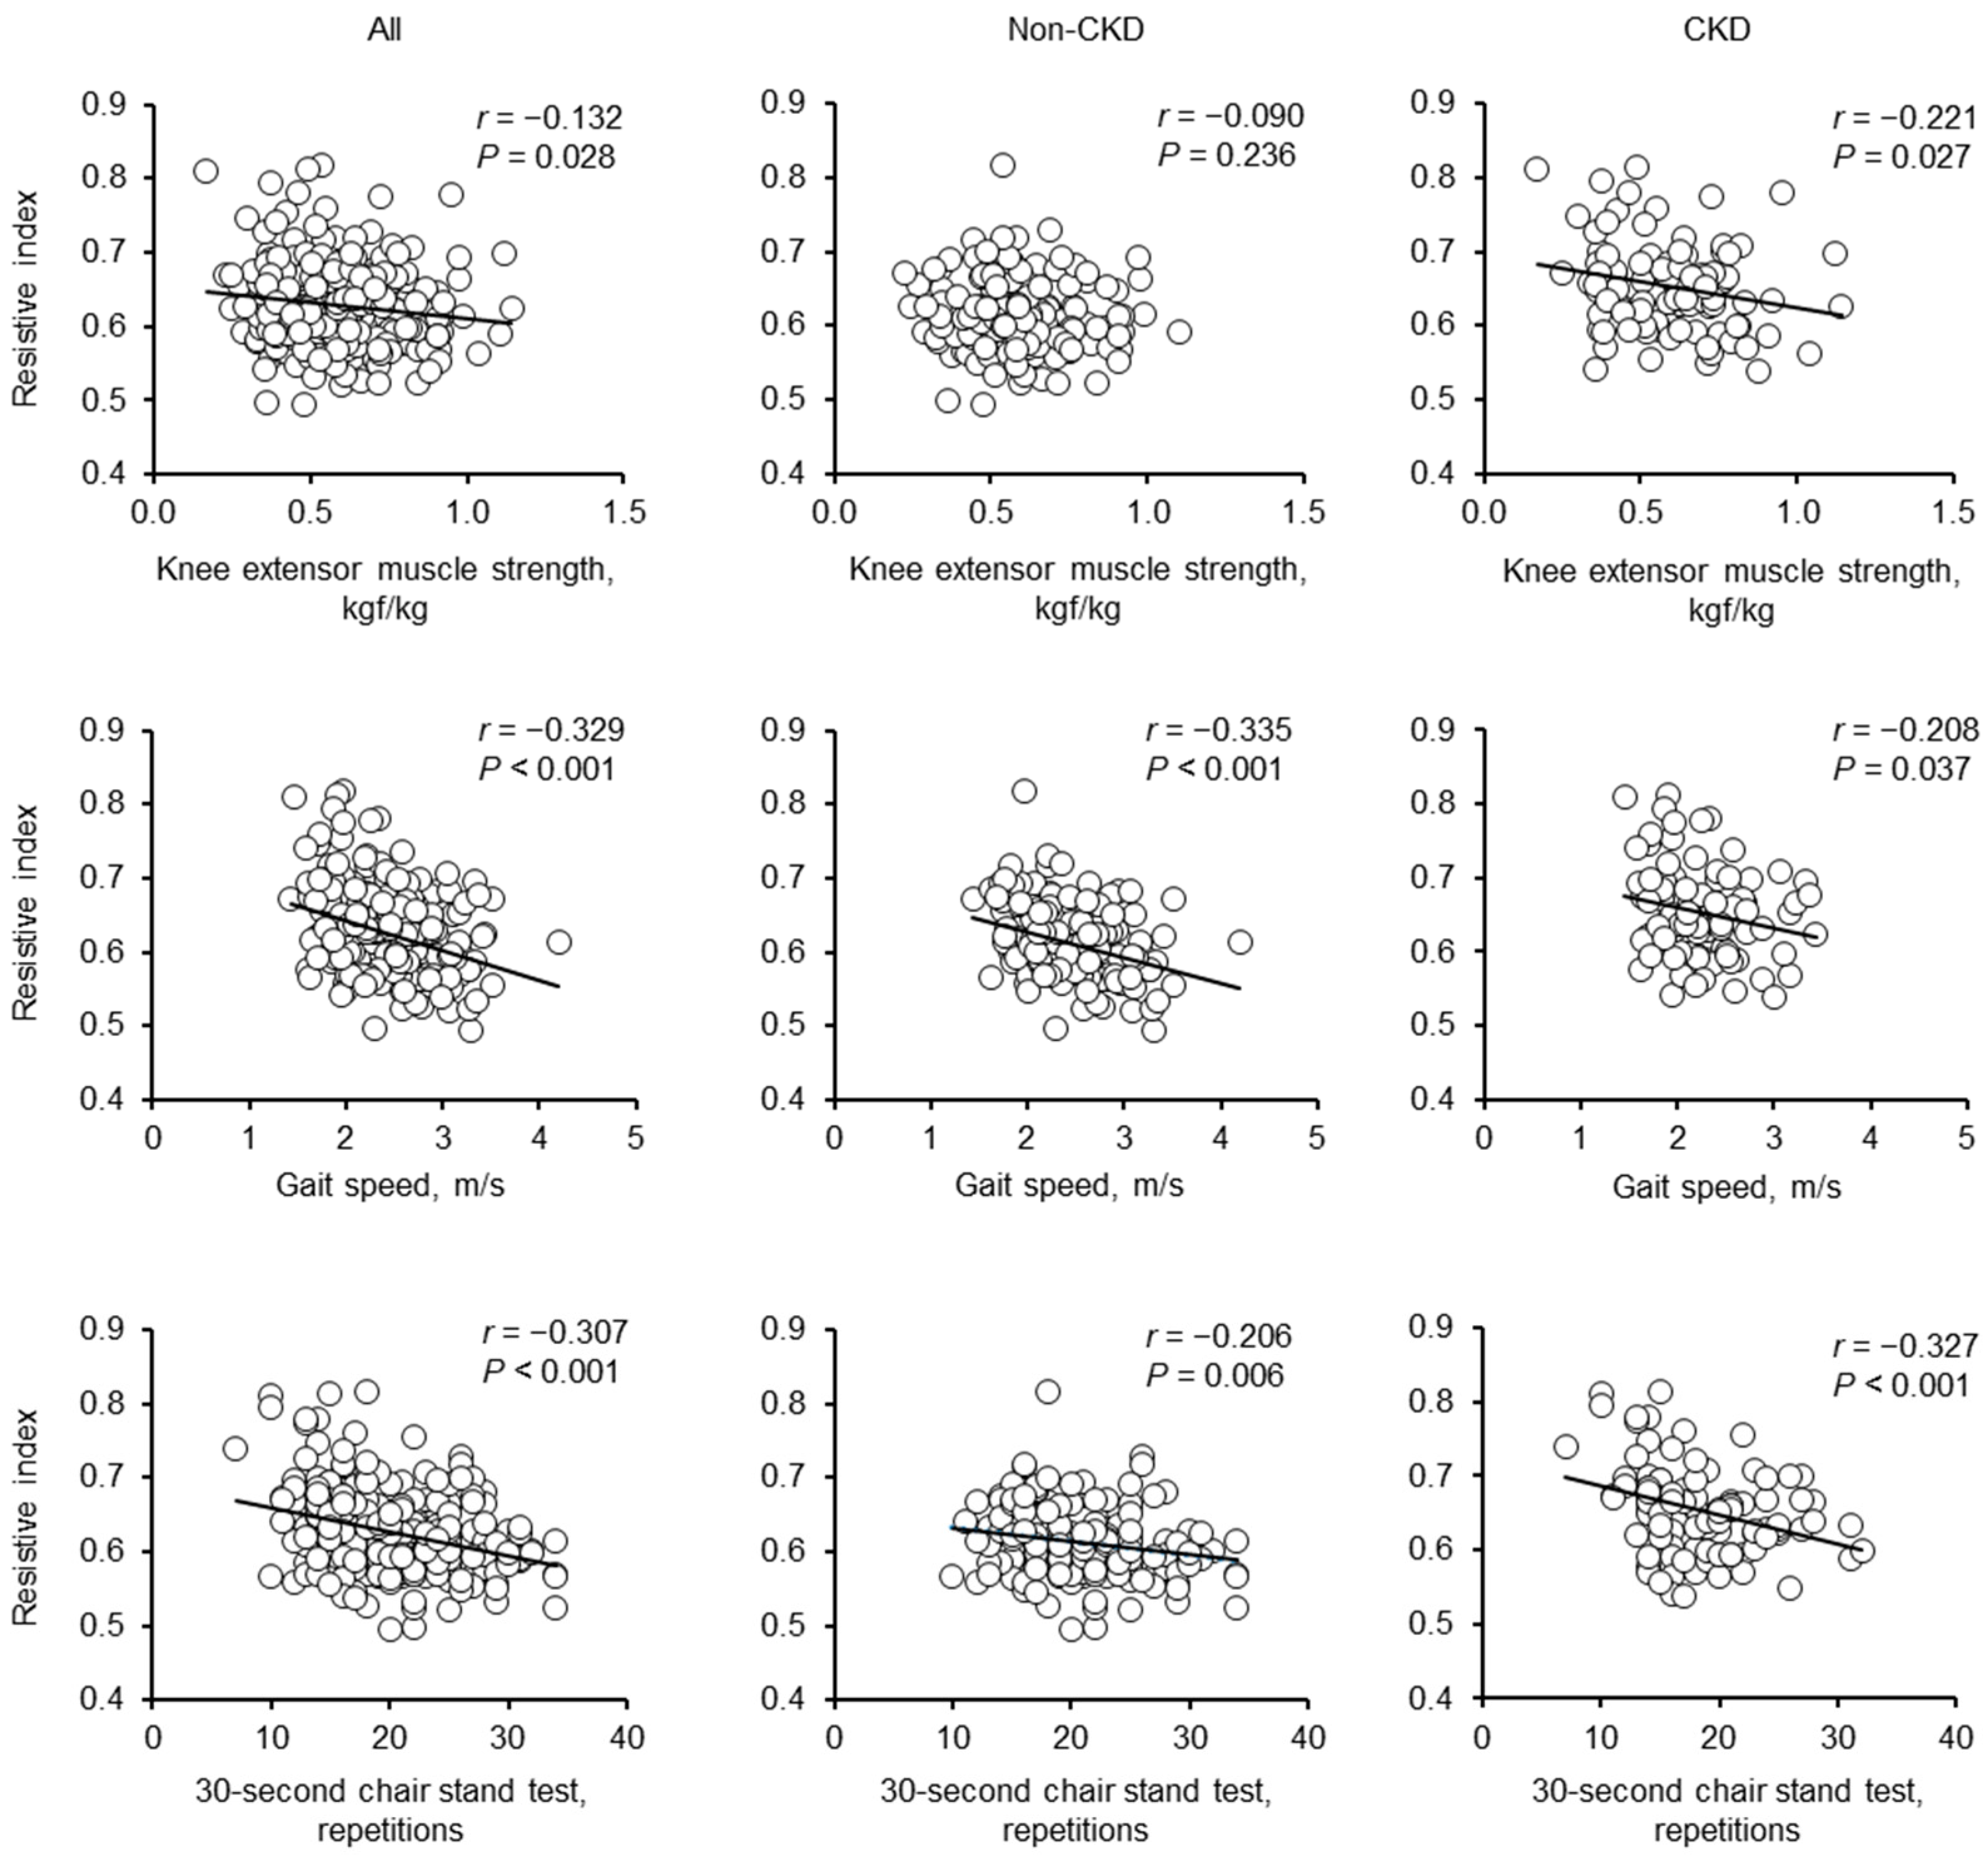
| KES | −0.132 | 0.028 | −0.090 | 0.236 | −0.221 | 0.027 |
| GS | −0.329 | <0.001 | −0.335 | <0.001 | −0.208 | 0.037 |
| 30s-CST * † | −0.307 | <0.001 | −0.206 | 0.006 | −0.327 | <0.001 |
| Physical activity | 0.023 | 0.702 | −0.044 | 0.564 | 0.157 | 0.116 |
| Model 1 | Model 2 | Model 3 * | ||||
|---|---|---|---|---|---|---|
| (R2 = 0.558, p < 0.001) | (R2 = 0.569, p < 0.001) | (R2 = 0.578, p < 0.001) | ||||
| β | p | β | p | β | p | |
| KES, kgf/kg | −0.003 | 0.952 | − | − | − | − |
| GS, m/s | − | − | −0.115 | 0.012 | − | − |
| 30s-CST, repetitions | − | − | − | − | −0.153 | <0.001 |
| Age, years | 0.281 | <0.001 | 0.248 | <0.001 | 0.273 | <0.001 |
| Sex (1: women) | 0.009 | 0.863 | −0.024 | 0.640 | 0.005 | 0.913 |
| BMI, kg/m2 | 0.044 | 0.353 | 0.031 | 0.505 | 0.021 | 0.652 |
| eGFR, mL/min/1.73 m2 | −0.227 | <0.001 | −0.215 | <0.001 | −0.191 | 0.001 |
| Urinary ACR, mg/g | 0.096 | 0.067 | 0.086 | 0.101 | 0.108 | 0.037 |
| Hypertension (1: yes) | −0.073 | 0.162 | −0.068 | 0.188 | −0.063 | 0.218 |
| Diabetes (1: yes) | 0.215 | <0.001 | 0.216 | <0.001 | 0.224 | <0.001 |
| Dyslipidemia (1: yes) | −0.007 | 0.877 | −0.004 | 0.926 | −0.015 | 0.738 |
| Physical activity, METs-hour/week | −0.058 | 0.172 | −0.055 | 0.192 | −0.045 | 0.285 |
| Heart rate, bpm | −0.021 | 0.665 | −0.028 | 0.566 | −0.043 | 0.369 |
| Aortic pulse pressure, mmHg | 0.383 | <0.001 | 0.368 | <0.001 | 0.360 | <0.001 |
| Carotid-femoral PWV, cm/s | 0.028 | 0.633 | 0.030 | 0.597 | 0.029 | 0.608 |
| Model 1 | Model 2 | Model 3 † | ||||
|---|---|---|---|---|---|---|
| (R2 = 0.485, p < 0.001) | (R2 = 0.491, p < 0.001) | (R2 = 0.491, p < 0.001) | ||||
| β | p | β | p | β | p | |
| KES, kgf/kg | 0.097 | 0.129 | − | − | − | − |
| GS, m/s | − | − | −0.133 | 0.042 | − | − |
| 30s-CST, repetitions | − | − | − | − | −0.124 | 0.046 |
| Age, years | 0.412 | <0.001 | 0.363 | <0.001 | 0.391 | <0.001 |
| Sex (1: women) | −0.011 | 0.876 | −0.059 | 0.420 | −0.035 | 0.623 |
| BMI, kg/m2 | 0.092 | 0.178 | 0.038 | 0.566 | 0.027 | 0.687 |
| eGFR, mL/min/1.73 m2 | −0.058 | 0.416 | −0.092 | 0.191 | −0.074 | 0.291 |
| Urinary ACR, mg/g | 0.064 | 0.351 | 0.034 | 0.612 | 0.038 | 0.575 |
| Hypertension (1: yes) | −0.103 | 0.126 | −0.077 | 0.255 | −0.080 | 0.236 |
| Diabetes (1: yes) | 0.074 | 0.223 | 0.072 | 0.234 | 0.077 | 0.204 |
| Dyslipidemia (1: yes) | 0.045 | 0.461 | 0.039 | 0.527 | 0.033 | 0.592 |
| Physical activity, METs- hour/week | −0.110 | 0.067 | −0.098 | 0.097 | −0.091 | 0.124 |
| Heart rate, bpm | −0.047 | 0.481 | −0.042 | 0.534 | −0.071 | 0.301 |
| Aortic pulse pressure, mmHg | 0.371 | <0.001 | 0.342 | <0.001 | 0.347 | <0.001 |
| Carotid-femoral PWV, cm/s | −0.001 | 0.988 | −0.016 | 0.835 | 0.001 | 0.992 |
| Model 1 | Model 2 | Model 3 | ||||
|---|---|---|---|---|---|---|
| (R2 = 0.596, p < 0.001) | (R2 = 0.605, p < 0.001) | (R2 = 0.630, p < 0.001) | ||||
| β | p | β | p | β | p | |
| KES, kgf/kg | −0.093 | 0.235 | − | − | − | − |
| GS, m/s | − | − | −0.149 | 0.069 | − | − |
| 30s-CST, repetitions | − | − | − | − | −0.222 | 0.003 |
| Age, years | 0.228 | 0.005 | 0.186 | 0.028 | 0.202 | 0.010 |
| Sex (1: women) | −0.033 | 0.715 | −0.049 | 0.579 | 0.024 | 0.767 |
| BMI, kg/m2 | 0.019 | 0.816 | 0.005 | 0.949 | 0.026 | 0.741 |
| eGFR, mL/min/1.73 m2 | −0.230 | 0.019 | −0.198 | 0.047 | −0.164 | 0.088 |
| Urinary ACR, mg/g | 0.062 | 0.479 | 0.066 | 0.442 | 0.118 | 0.168 |
| Hypertension (1: yes) | 0.002 | 0.985 | 0.019 | 0.811 | 0.017 | 0.823 |
| Diabetes (1: yes) | 0.349 | <0.001 | 0.377 | <0.001 | 0.370 | <0.001 |
| Dyslipidemia (1: yes) | −0.046 | 0.569 | −0.037 | 0.643 | −0.078 | 0.306 |
| Physical activity, METs- hour/week | −0.009 | 0.909 | −0.021 | 0.780 | 0.003 | 0.962 |
| Heart rate, bpm | −0.008 | 0.923 | −0.028 | 0.738 | −0.017 | 0.833 |
| Aortic pulse pressure, mmHg | 0.439 | <0.001 | 0.429 | <0.001 | 0.400 | <0.001 |
| Carotid-femoral PWV, cm/s | 0.043 | 0.641 | 0.069 | 0.460 | 0.052 | 0.557 |
Disclaimer/Publisher’s Note: The statements, opinions and data contained in all publications are solely those of the individual author(s) and contributor(s) and not of MDPI and/or the editor(s). MDPI and/or the editor(s) disclaim responsibility for any injury to people or property resulting from any ideas, methods, instructions or products referred to in the content. |
© 2023 by the authors. Licensee MDPI, Basel, Switzerland. This article is an open access article distributed under the terms and conditions of the Creative Commons Attribution (CC BY) license (https://creativecommons.org/licenses/by/4.0/).
Share and Cite
Nishitani, N.; Kosaki, K.; Mori, S.; Matsui, M.; Sugaya, T.; Kuro-o, M.; Saito, C.; Yamagata, K.; Maeda, S. Association of Lower Extremity Muscle Strength and Function with Renal Resistive Index in Individuals with and without Chronic Kidney Disease. Geriatrics 2023, 8, 118. https://doi.org/10.3390/geriatrics8060118
Nishitani N, Kosaki K, Mori S, Matsui M, Sugaya T, Kuro-o M, Saito C, Yamagata K, Maeda S. Association of Lower Extremity Muscle Strength and Function with Renal Resistive Index in Individuals with and without Chronic Kidney Disease. Geriatrics. 2023; 8(6):118. https://doi.org/10.3390/geriatrics8060118
Chicago/Turabian StyleNishitani, Natsumi, Keisei Kosaki, Shoya Mori, Masahiro Matsui, Takeshi Sugaya, Makoto Kuro-o, Chie Saito, Kunihiro Yamagata, and Seiji Maeda. 2023. "Association of Lower Extremity Muscle Strength and Function with Renal Resistive Index in Individuals with and without Chronic Kidney Disease" Geriatrics 8, no. 6: 118. https://doi.org/10.3390/geriatrics8060118