
Prediction of In-Hospital Falls Using NRS, PACD Score and FallRS: A Retrospective Cohort Study
 , , and
Abstract
:1. Background
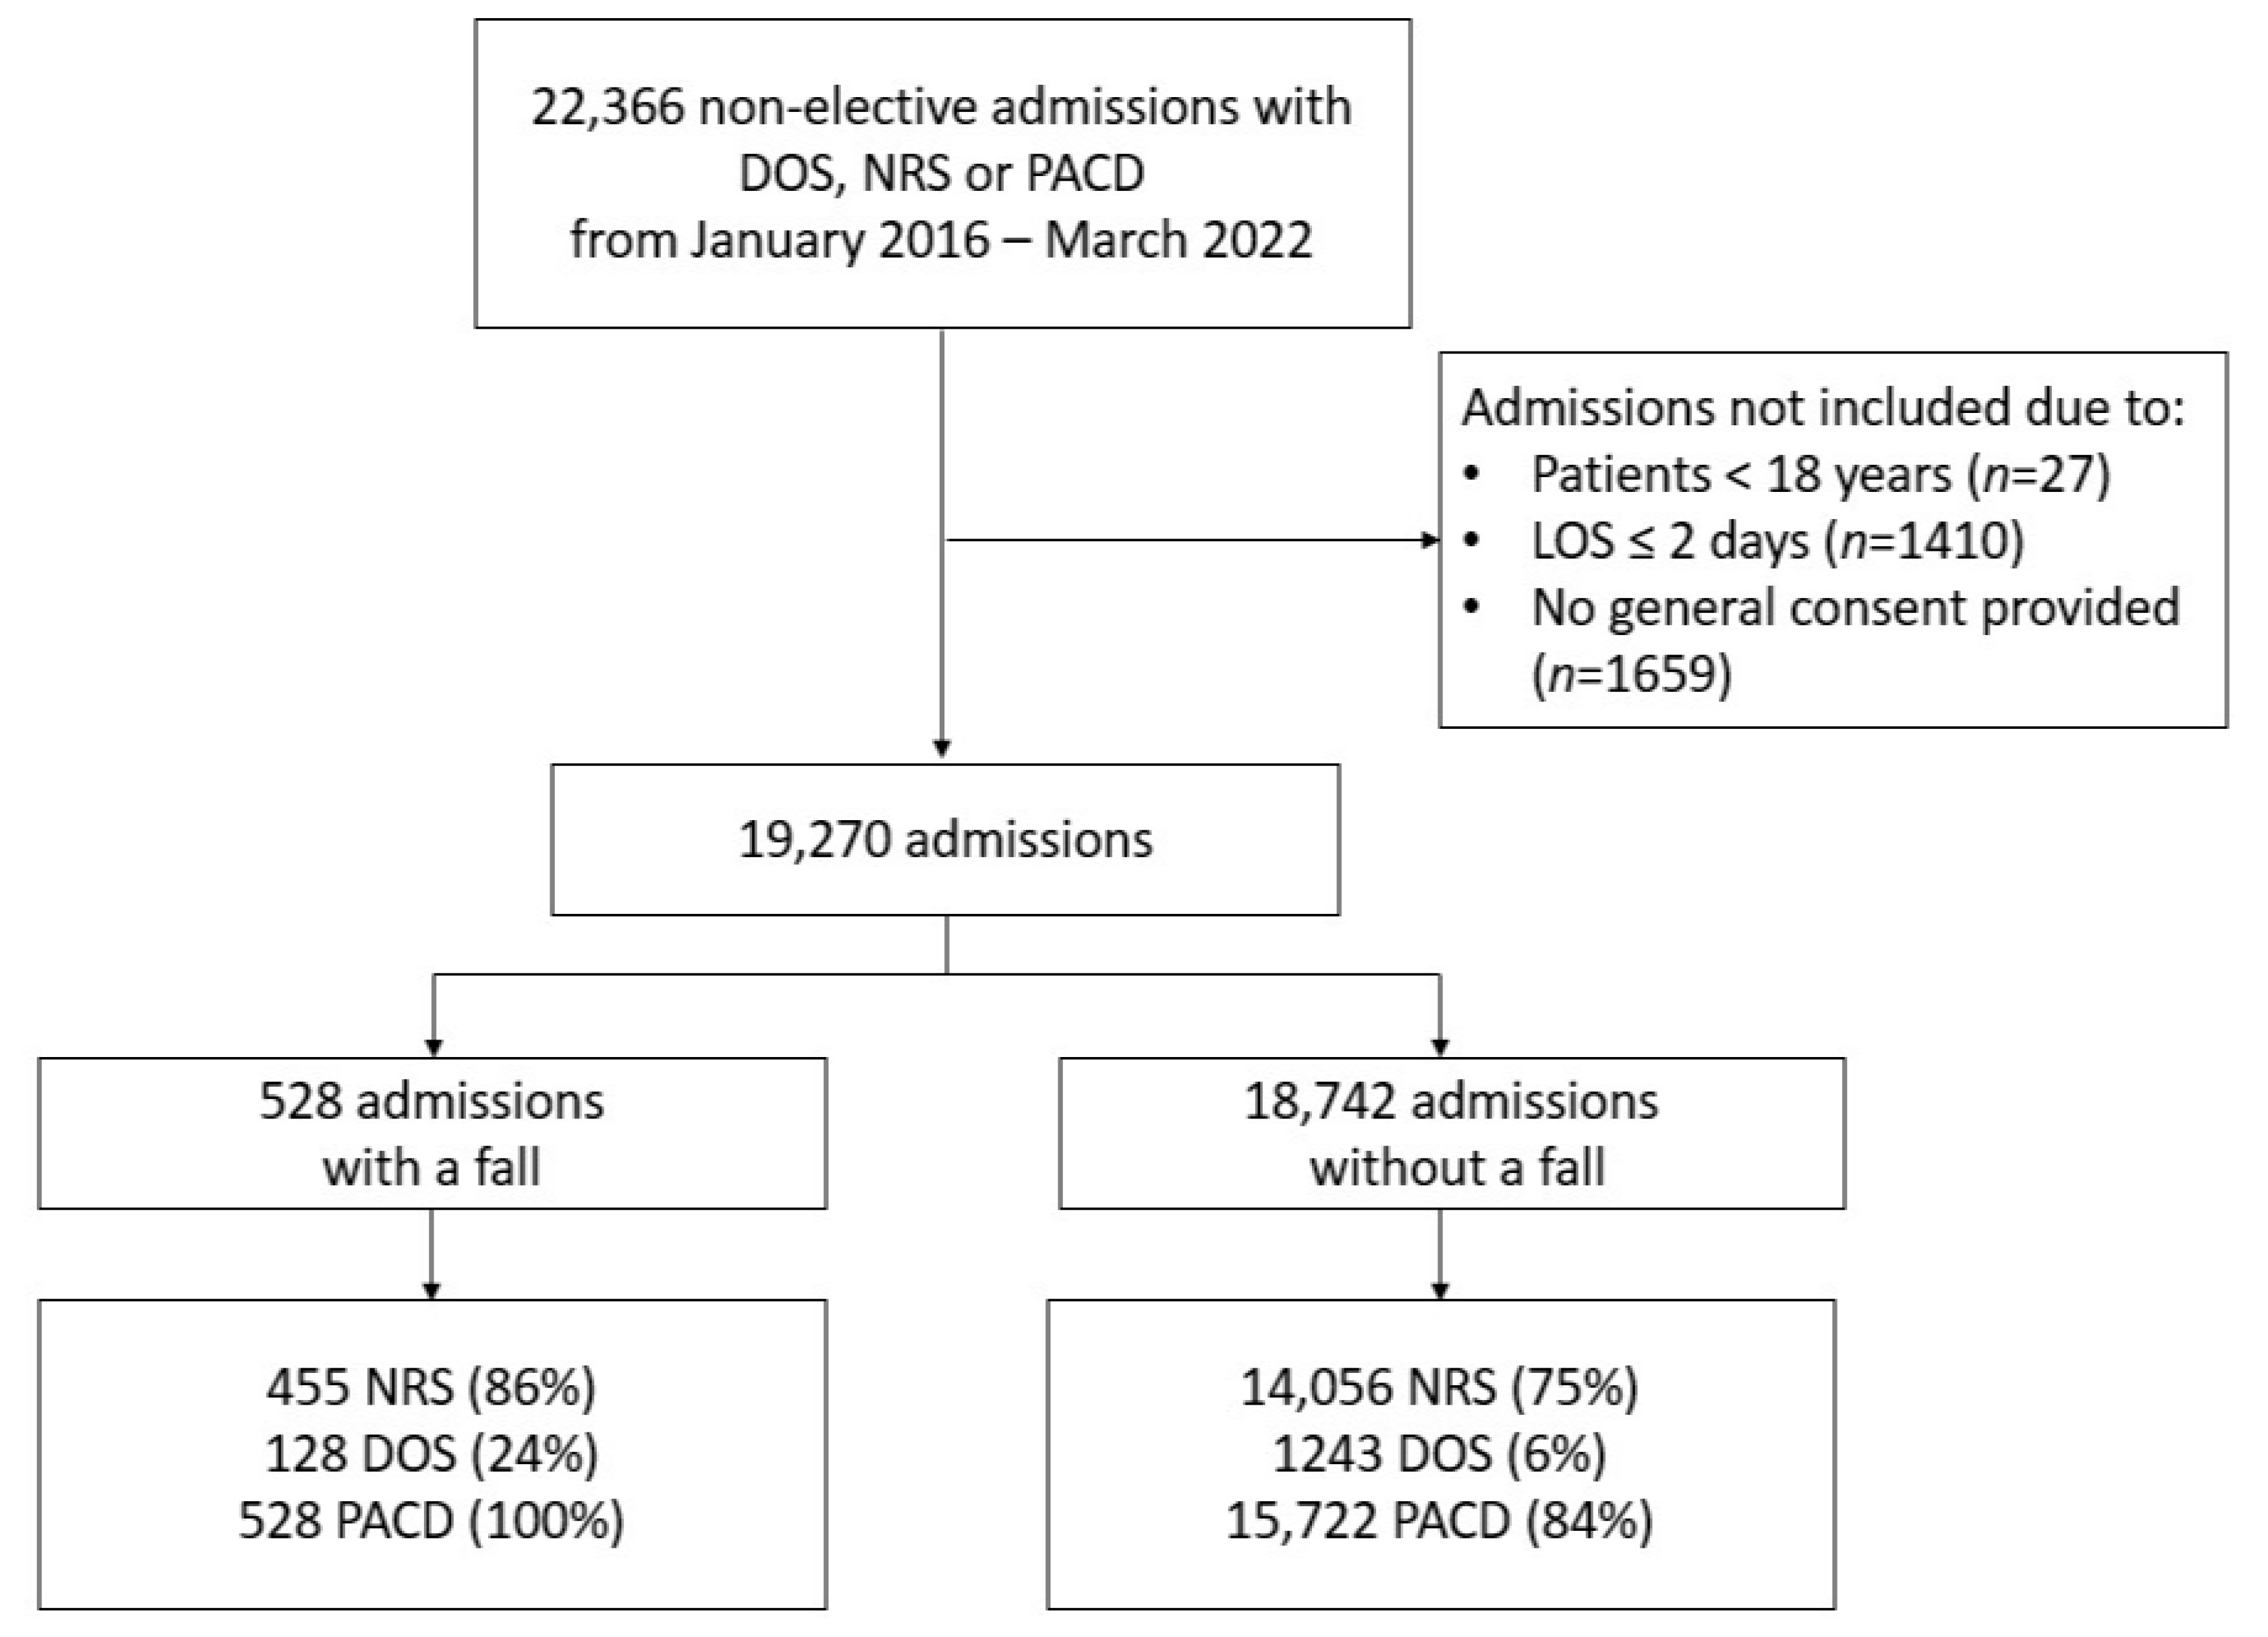
2. Methods
2.1. Outcome
2.2. Instruments
2.3. Statistics, Sample Size and Missing Data
3. Results
3.1. Calibration
3.2. Discrimination
4. Discussion
Strengths and Limitations
5. Conclusions
Supplementary Materials
Author Contributions
Funding
Institutional Review Board Statement
Informed Consent Statement
Data Availability Statement
Acknowledgments
Conflicts of Interest
Abbreviations
| ADL | Activities of daily living |
| AUC | Area under curve |
| CI | Confidence interval |
| DOS | Delirium observation screening scale |
| EHR | Electronic health records |
| EKNZ | Institutional Review Board of Northwestern Switzerland |
| FallRS | Fall risk score |
| MFS | Morse fall scale |
| NRS | Nutritional risk screening score |
| PACD | Post-acute care discharge |
| SNSF | Swiss National Science Foundation |
| TUG | Timed up and go test |
References
- Hars, M.; Audet, M.C.; Herrmann, F.; De Chassey, J.; Rizzoli, R.; Reny, J.L.; Gold, G.; Ferrari, S.; Trombetti, A. Functional Performances on Admission Predict In-Hospital Falls, Injurious Falls, and Fractures in Older Patients: A Prospective Study. J. Bone Min. Miner. Res. 2018, 33, 852–859. [Google Scholar] [CrossRef] [PubMed]
- Schwendimann, R.; Buhler, H.; De Geest, S.; Milisen, K. Falls and consequent injuries in hospitalized patients: Effects of an interdisciplinary falls prevention program. BMC Health Serv. Res. 2006, 6, 69. [Google Scholar] [CrossRef] [PubMed]
- Oliver, D.; Healey, F.; Haines, T.P. Preventing falls and fall-related injuries in hospitals. Clin. Geriatr. Med. 2010, 26, 645–692. [Google Scholar] [CrossRef]
- Rob Morris, S.O.R. Prevention of falls in hospital. Clin. Med. 2017, 17, 360–362. [Google Scholar] [CrossRef] [PubMed]
- Podsiadlo, D. The timed “Up & Go”: A test of basic functional mobility for frail elderly persons. J. Am. Geriatr. Soc. 1991, 39, 142–148. [Google Scholar]
- Barry, E.; Galvin, R.; Keogh, C.; Horgan, F.; Fahey, T. Is the Timed Up and Go test a useful predictor of risk of falls in community dwelling older adults: A systematic review and meta- analysis. BMC Geriatr. 2014, 14, 14. [Google Scholar] [CrossRef]
- Hsu, Y.C.; Weng, H.H.; Kuo, C.Y.; Chu, T.P.; Tsai, Y.H. Prediction of fall events during admission using eXtreme gradient boosting: A comparative validation study. Sci. Rep. 2020, 10, 16777. [Google Scholar] [CrossRef]
- Ishida, Y.; Maeda, K.; Nonogaki, T.; Shimizu, A.; Yamanaka, Y.; Matsuyama, R.; Kato, R.; Mori, N. Malnutrition at Admission Predicts In-Hospital Falls in Hospitalized Older Adults. Nutrients 2020, 12, 541. [Google Scholar] [CrossRef]
- Eglseer, D.; Hoedl, M.; Schoberer, D. Malnutrition risk and hospital-acquired falls in older adults: A cross-sectional, multicenter study. Geriatr. Gerontol. Int. 2020, 20, 348–353. [Google Scholar] [CrossRef]
- Kondrup, J. Nutritional risk screening (NRS 2002): A new method based on an analysis of controlled clinical trials. Clin. Nutr. 2003, 22, 321–336. [Google Scholar] [CrossRef]
- Louis Simonet, M.; Kossovsky, M.P.; Chopard, P.; Sigaud, P.; Perneger, T.V.; Gaspoz, J.M. A predictive score to identify hospitalized patients’ risk of discharge to a post-acute care facility. BMC Health Serv. Res. 2008, 8, 154. [Google Scholar] [CrossRef] [PubMed]
- Montero-Odasso, M.; van der Velde, N.; Martin, F.C.; Petrovic, M.; Tan, M.P.; Ryg, J.; Aguilar-Navarro, S.; Alexander, N.B.; Becker, C.; Blain, H.; et al. World guidelines for falls prevention and management for older adults: A global initiative. Age Ageing 2022, 51, afac205. [Google Scholar] [CrossRef]
- Mahoney, F.I.; Barthel, D.W. Functional evaluation: The Barthel Index: A simple index of independence useful in scoring improvement in the rehabilitation of the chronically ill. Md. State Med. J. 1965, 14, 5. [Google Scholar]
- Collins, G.S.; Reitsma, J.B.; Altman, D.G.; Moons, K.G. Transparent reporting of a multivariable prediction model for individual prognosis or diagnosis (TRIPOD): The TRIPOD statement. BMJ 2015, 350, g7594. [Google Scholar] [CrossRef] [PubMed]
- Gibson, M.J.; Isaacs, B.; Radebaugh, T.; Worm-Peterse, J. The prevention of falls in later life. A report of the Kellogg International Work Group on the Prevention of Falls by the Elderly. Dan. Med. Bull. 1987, 34 (Suppl. 4), 1–24. [Google Scholar]
- Conca, A.; Gabele, A.; Reutlinger, B.; Schuetz, P.; Kutz, A.; Haubitz, S.; Faessler, L.; Batschwaroff, M.; Schild, U.; Caldara, Z.; et al. Prediction of post-acute care demand in medical and neurological inpatients: Diagnostic assessment of the post-acute discharge score—A prospective cohort study. BMC Health Serv. Res. 2018, 18, 111. [Google Scholar] [CrossRef] [PubMed]
- Koch, D.; Schuetz, P.; Haubitz, S.; Kutz, A.; Mueller, B.; Weber, H.; Regez, K.; Conca, A.; Triage Study, G. Improving the post-acute care discharge score (PACD) by adding patients' self-care abilities: A prospective cohort study. PLoS ONE 2019, 14, e0214194. [Google Scholar] [CrossRef] [PubMed]
- Conca, A. OPTIMA—Optimierter Patienten Transfer durch innovatives multidisziplinäres Assessment. Pflegewissenschaft 2012, 5, 291–298. [Google Scholar] [CrossRef]
- Jorgensen, S.M.; Carnahan, R.M.; Weckmann, M.T. Validity of the Delirium Observation Screening Scale in Identifying Delirium in Home Hospice Patients. Am. J. Hosp. Palliat. Care 2017, 34, 744–747. [Google Scholar] [CrossRef]
- Schuurmans, M.J.; Shortridge-Baggett, L.M.; Duursma, S.A. The Delirium Observation Screening Scale: A screening instrument for delirium. Res. Theory Nurs. Pract. 2003, 17, 31–50. [Google Scholar] [CrossRef]
- Gavinski, K.; Carnahan, R.; Weckmann, M. Validation of the delirium observation screening scale in a hospitalized older population. J. Hosp. Med. 2016, 11, 494–497. [Google Scholar] [CrossRef] [PubMed]
- Elixhauser, A.S.C.; Harris, D.R.; Coffey, R.M. Comorbidity measures for use with administrative data. Med. Care. 1998, 36, 8–27. [Google Scholar] [CrossRef] [PubMed]
- Rockwood, K.; Song, X.; MacKnight, C.; Bergman, H.; Hogan, D.B.; McDowell, I.; Mitnitski, A. A global clinical measure of fitness and frailty in elderly people. CMAJ 2005, 173, 489–495. [Google Scholar] [CrossRef]
- Conca, A.; Koch, D.; Regez, K.; Kutz, A.; Bächli, C.; Haubitz, S.; Schuetz, P.; Mueller, B.; Spirig, R.; Petry, H. Self-Care Index and Post-Acute Care Discharge Score to Predict Discharge Destination of Adult Medical Inpatients: Protocol for a Multicenter Validation Study. JMIR Res. Protoc. 2021, 10, e21447. [Google Scholar] [CrossRef] [PubMed]
- Speranza, E.; Santarpia, L.; Marra, M.; Di Vincenzo, O.; Naccarato, M.; De Caprio, C.; Morlino, D.; D’Onofrio, G.; Contaldo, F.; Pasanisi, F. Nutritional Screening and Anthropometry in Patients Admitted From the Emergency Department. Front. Nutr. 2022, 9. [Google Scholar] [CrossRef]


| Scores | Total | No Fall | Fall | p-Value | |
|---|---|---|---|---|---|
| N = 19,270 | N = 18,742 | N = 528 | |||
| NRS | 2 (1–3) | 2 (1–3) | 3 (2–4) | <0.001 | |
| PACD score | 5 (3–10) | 5 (3–10) | 10 (5–14) | <0.001 | |
| DOS | 0 (0–1) | 0 (0–1) | 1 (0–3) | <0.001 | |
| FallRS | 8 (5–12) | 8 (4–12) | 12 (8–17) | <0.001 | |
| Sociodemographics | |||||
| Age | 71 (58–80) | 71 (58–80) | 76 (68–83) | <0.001 | |
| Female | 8337 (43.3%) | 8120 (43.3%) | 217 (41.1%) | 0.31 | |
| Length of stay | 6 (4–10) | 6 (4–10) | 12 (8–19) | <0.001 | |
| Number of ICD-10 diagnoses | 8 (5–12) | 8 (5–12) | 13 (10–18) | <0.001 | |
| Elixhauser comorbidity index | 2 (1–4) | 2 (1–4) | 4 (3–5) | <0.001 | |
| Frailty score | 2.7 (0.8–5.5) | 2.6 (0.8–5.4) | 5.8 (3.45–8.75) | <0.001 | |
| Frailty Score | Low < 5 | 13,776 (71.5%) | 13,561 (72.4%) | 215 (40.7%) | <0.001 |
| Intermediate 5–15 | 5226 (27.1%) | 4936 (26.3%) | 290 (54.9%) | ||
| High > 15 | 268 (1.4%) | 245 (1.3%) | 23 (4.4%) | ||
| Health insurance | |||||
| Supplementary private | 3448 (17.9%) | 3344 (17.8%) | 104 (19.7%) | 0.31 | |
| Mandatory basic only | 15,821 (82.1%) | 15,397 (82.2%) | 424 (80.3%) | ||
| Discipline | |||||
| Internal Medicine | 6677 (34.6%) | 6473 (34.5%) | 204 (38.6%) | ||
| Cardiology | 4059 (21.1%) | 3996 (21.3%) | 63 (11.9%) | ||
| Oncology | 2646 (13.7%) | 2536 (13.5%) | 110 (20.8%) | ||
| Neurology | 1863 (9.7%) | 1812 (9.7%) | 51 (9.7%) | ||
| Gastroenterology | 1617 (8.4%) | 1578 (8.4%) | 39 (7.4%) | <0.001 | |
| Pneumology | 1148 (6.0%) | 1121 (6.0%) | 27 (5.1%) | ||
| Nephrology | 788 (4.1%) | 760 (4.1%) | 28 (5.3%) | ||
| Rheumatology | 472 (2.4%) | 466 (2.5%) | 6 (1.1%) | ||
| Place before admission | |||||
| Home | 14,864 (77.1%) | 14,502 (77.4%) | 362 (68.6%) | <0.001 | |
| Other hospital | 1563 (8.1%) | 1521 (8.1%) | 42 (8.0%) | ||
| Nursing home | 1152 (6.0%) | 1104 (5.9%) | 48 (9.1%) | ||
| Other institutions | 971 (5.0%) | 927 (4.9%) | 44 (8.3%) | ||
| Home with nursing assistance | 716 (3.7%) | 684 (3.6%) | 32 (6.1%) | ||
| Place after discharge | |||||
| Home | 12,456 (64.6%) | 12,297 (65.6%) | 159 (30.1%) | ||
| Rehabilitation | 4485 (23.3%) | 4213 (22.5%) | 272 (51.5%) | ||
| Death in hospital | 1079 (5.6%) | 1017 (5.4%) | 62 (11.7%) | <0.001 | |
| Home with nursing assistance | 799 (4.1%) | 770 (4.1%) | 29 (5.5%) | ||
| Missing and others | 451 (2.4%) | 451 (2.4%) | 6 (1.1%) | ||
| Consequences of fall | |||||
| No injury | 366 (1.9%) | N/A | 366 (69.3%) | ||
| Minimal injury | 133 (0.7%) | N/A | 133 (25.2%) | ||
| Moderate injury | 19 (0.1%) | N/A | 19 (3.6%) | ||
| Severe injury | 10 (0.1%) | N/A | 10 (1.9%) | ||
| Scores | Derivation 2016–2019 AUC (95% CI) | N | Validation 2020–2022 AUC (95% CI) | N | p-Value |
|---|---|---|---|---|---|
| NRS | 0.65 (0.61–0.68) | 7005 | 0.61 (0.55–0.66) | 2156 | <0.001 |
| PACD | 0.69 (0.66–0.72) | 7005 | 0.69 (0.64–0.75) | 2156 | 0.81 |
| FallRS | 0.71 (0.68–0.74) | 7005 | 0.70 (0.65–0.75) | 2156 | 0.32 |
| Score, Points | Sensitivity (95% CI, %) | Specificity (95% CI, %) | AUC (95% CI, %) |
|---|---|---|---|
| NRS 3 | 54.2 (48.4–60.0) | 67.4 (66.4–68.4) | 0.61 (0.58–0.64) |
| NRS 4 | 29.6 (24.5–35.2) | 83.2 (82.4–84.0) | 0.56 (0.54–0.59) |
| PACD 10 | 50.5 (44.7–56.3) | 75.1 (74.5–76.0) | 0.63 (0.60–0.66) |
| PACD 11 | 43.4 (37.7–49.3) | 79.4 (78.5–80.2) | 0.61 (0.59–0.64) |
| FallRS 12 | 54.9 (49.0–60.6) | 72.3 (71.4–73.3) | 0.64 (0.61–0.67) |
| FallRS 13 | 49.2 (43.3–55.0) | 76.7 (75.8–77.6) | 0.63 (0.60–0.66) |
| Probability of No Injury (%) (95% CI) | Probability of Minimal Injury (%) (95% CI) | Probability of Moderate Injury (%) (95% CI) | Probability of Severe Injury (%) (95% CI) | |
|---|---|---|---|---|
| NRS 0 | 44.3 (22.1–66.5) | 22.9 (14.1–31.6) | 3.2 (0.8–5.6) | 1.4 (0–2.9) |
| NRS 2 | 70.2 (64.4–76.1) | 24.6 (19.4–29.9) | 3.5 (1.4–5.7) | 1.6 (0.2–3.0) |
| NRS 7 | 64.2 (46.5–81.8) | 29.1 (15.9–42.4) | 4.6 (0.5–8.7) | 2.1 (0–4.5) |
| PACD 0 | 48.7 (29.3–68.0) | 42.0 (27.5–56.5) | 6.4 (0–13.0) | 2.9 (0–7.3) |
| PACD 5 | 55.6 (43.3–67.8) | 37.3 (26.6–48.0) | 5.0 (0.5–9.4) | 2.2 (0–5.2) |
| PACD 25 | 79.1 (62.0–96.3) | 18.6 (3.8–33.4) | 1.6 (0–3.9) | 0.6 (0–1.8) |
| FallRS 0 | 44.3 (22.1–66.5) | 44.8 (29.3–60.3) | 7.5 (0–15.5) | 3.5 (0–8.9) |
| FallRS 8 | 55.6 (44.0–67.3) | 37.3 (26.9–47.7) | 4.9 (0.6–9.3) | 2.1 (0–5.1) |
| FallRS 30 | 80.6 (63.9–97.3) | 17.4 (2.9– 31.9) | 1.5 (0–3.5) | 0.6 (0–1.6) |
Disclaimer/Publisher’s Note: The statements, opinions and data contained in all publications are solely those of the individual author(s) and contributor(s) and not of MDPI and/or the editor(s). MDPI and/or the editor(s) disclaim responsibility for any injury to people or property resulting from any ideas, methods, instructions or products referred to in the content. |
© 2023 by the authors. Licensee MDPI, Basel, Switzerland. This article is an open access article distributed under the terms and conditions of the Creative Commons Attribution (CC BY) license (https://creativecommons.org/licenses/by/4.0/).
Share and Cite
Siegwart, J.; Spennato, U.; Lerjen, N.; Mueller, B.; Schuetz, P.; Koch, D.; Struja, T. Prediction of In-Hospital Falls Using NRS, PACD Score and FallRS: A Retrospective Cohort Study. Geriatrics 2023, 8, 60. https://doi.org/10.3390/geriatrics8030060
Siegwart J, Spennato U, Lerjen N, Mueller B, Schuetz P, Koch D, Struja T. Prediction of In-Hospital Falls Using NRS, PACD Score and FallRS: A Retrospective Cohort Study. Geriatrics. 2023; 8(3):60. https://doi.org/10.3390/geriatrics8030060
Chicago/Turabian StyleSiegwart, Jennifer, Umberto Spennato, Nathalie Lerjen, Beat Mueller, Philipp Schuetz, Daniel Koch, and Tristan Struja. 2023. "Prediction of In-Hospital Falls Using NRS, PACD Score and FallRS: A Retrospective Cohort Study" Geriatrics 8, no. 3: 60. https://doi.org/10.3390/geriatrics8030060