Review

Artificial Intelligence in Veterinary Imaging: An Overview

by
Ana Inês Pereira
1,†,
Pedro Franco-Gonçalo
1,2,3,†,
Pedro Leite
4,
Alexandrine Ribeiro
4,
Maria Sofia Alves-Pimenta
2,3,5,
Bruno Colaço
2,3,5,
Cátia Loureiro
6,7,
Lio Gonçalves
6,7,8,
Vítor Filipe
6,7,8 and
Mário Ginja
1,2,3,*
1
Department of Veterinary Science, University of Trás-os-Montes and Alto Douro (UTAD), 5000-801 Vila Real, Portugal
2
Veterinary and Animal Research Centre (CECAV), University of Trás-os-Montes and Alto Douro (UTAD), 5000-801 Vila Real, Portugal
3
Associate Laboratory for Animal and Veterinary Sciences (AL4AnimalS), 5000-801 Vila Real, Portugal
4
Neadvance Machine Vision SA, 4705-002 Braga, Portugal
5
Department of Animal Science, University of Trás-os-Montes and Alto Douro (UTAD), 5000-801 Vila Real, Portugal
6
School of Science and Technology, University of Trás-os-Montes and Alto Douro (UTAD), 5000-801 Vila Real, Portugal
7
Department of Engineering, University of Trás-os-Montes and Alto Douro (UTAD), 5000-801 Vila Real, Portugal
8
Institute for Systems and Computer Engineering (INESC-TEC), Technology and Science, 4200-465 Porto, Portugal
*
Author to whom correspondence should be addressed.
These authors contributed equally to this work.
Vet. Sci. 2023, 10(5), 320; https://doi.org/10.3390/vetsci10050320
Submission received: 6 March 2023 / Revised: 21 April 2023 / Accepted: 25 April 2023 / Published: 28 April 2023
(This article belongs to the Section Veterinary Surgery)

Abstract

:

Simple Summary

Artificial intelligence is emerging in the field of veterinary medical imaging. The development of this area in medicine has introduced new concepts and scientific terminologies that professionals must be able to have some understanding of, such as the following: machine learning, deep learning, convolutional neural networks, and transfer learning. This paper offers veterinary professionals an overview of artificial intelligence, machine learning, and deep learning focused on imaging diagnosis. A review is provided of the existing literature on artificial intelligence in veterinary imaging of small animals, together with a brief conclusion.

Abstract

Artificial intelligence and machine learning have been increasingly used in the medical imaging field in the past few years. The evaluation of medical images is very subjective and complex, and therefore the application of artificial intelligence and deep learning methods to automatize the analysis process would be very beneficial. A lot of researchers have been applying these methods to image analysis diagnosis, developing software capable of assisting veterinary doctors or radiologists in their daily practice. This article details the main methodologies used to develop software applications on machine learning and how veterinarians with an interest in this field can benefit from such methodologies. The main goal of this study is to offer veterinary professionals a simple guide to enable them to understand the basics of artificial intelligence and machine learning and the concepts such as deep learning, convolutional neural networks, transfer learning, and the performance evaluation method. The language is adapted for medical technicians, and the work already published in this field is reviewed for application in the imaging diagnosis of different animal body systems: musculoskeletal, thoracic, nervous, and abdominal.

1. Introduction

Artificial intelligence is a branch of computer science dedicated to the creation of systems capable of performing tasks that generally require human intelligence. It is composed of a great number of subfields and techniques, one of them being machine learning [1]. Artificial neural networks have been used for decades, but only recent advances in the image-processing machine learning field, such as access to greater computer power and larger quantities of labeled images, have led to great progress in the study of medical image analysis [2,3,4]. Alex Krizhevsky et al. (2012) entered an annual international image classification competition using a deep convolutional network, and achieved a performance in image classification that had never been seen before when using traditional computer techniques [5]. Since then, multiple studies have been conducted in this area, leading to improvements in tasks such as image classification, object detection, and image segmentation [1].
The evaluation of medical images is very subjective and complex; therefore, the application of artificial intelligence and deep learning methods to automatize the analysis process would be of great value. Many developments have occurred in the field of human medical image analysis over the past few years; however, in the veterinary field, progress is also starting to happen [6,7].
This article aims to provide veterinarians with an interest in this field with definitions and information on machine learning and its components, including deep learning, convolutional neural networks, transfer learning, and performance evaluation methods in a simple way and using a language adapted to medical technicians, followed by a review of machine learning in the small animal imaging field.

2. Machine Learning

Machine learning (ML) is a field of artificial intelligence (AI) used for the analysis and prediction of data [1,6]. Instead of using explicit programming, the computer recognizes patterns in the given data in order to develop an algorithm with which to execute tasks [1].
There are two major types of machine learning: unsupervised and supervised learning [6,8]. In unsupervised learning, the data are not labeled; only the input data are presented to the computer, and the AI learns patterns in these data to determine the output. The computer uses techniques such as clustering to group similar patterns in images [9,10]. However, this model has some limitations, such as unpredictability since it does not receive previous patterns to guide it through the learning process, and good results are difficult to obtain [1]. In supervised learning, the computer is given labeled data (images with landmark annotations by expert humans in the field), known as “ground truth data”, to train the model [8,11]. The computer then learns a mathematical function that maps inputs to outputs based on the dataset pairs provided [12]. In the medical imaging field, the most common type of ML used is supervised learning [7].
This section introduces a classical type of machine learning model, artificial neural networks, as a way of illustrating the fundamentals of machine learning. The issue of overfitting is explored, highlighting its basis and some solutions. Following this, other models and techniques of machine learning aimed more at image analysis are presented, such as convolutional neural networks, transfer learning, object detection, and segmentation. Lastly, some ways of evaluating the model’s performance are described.

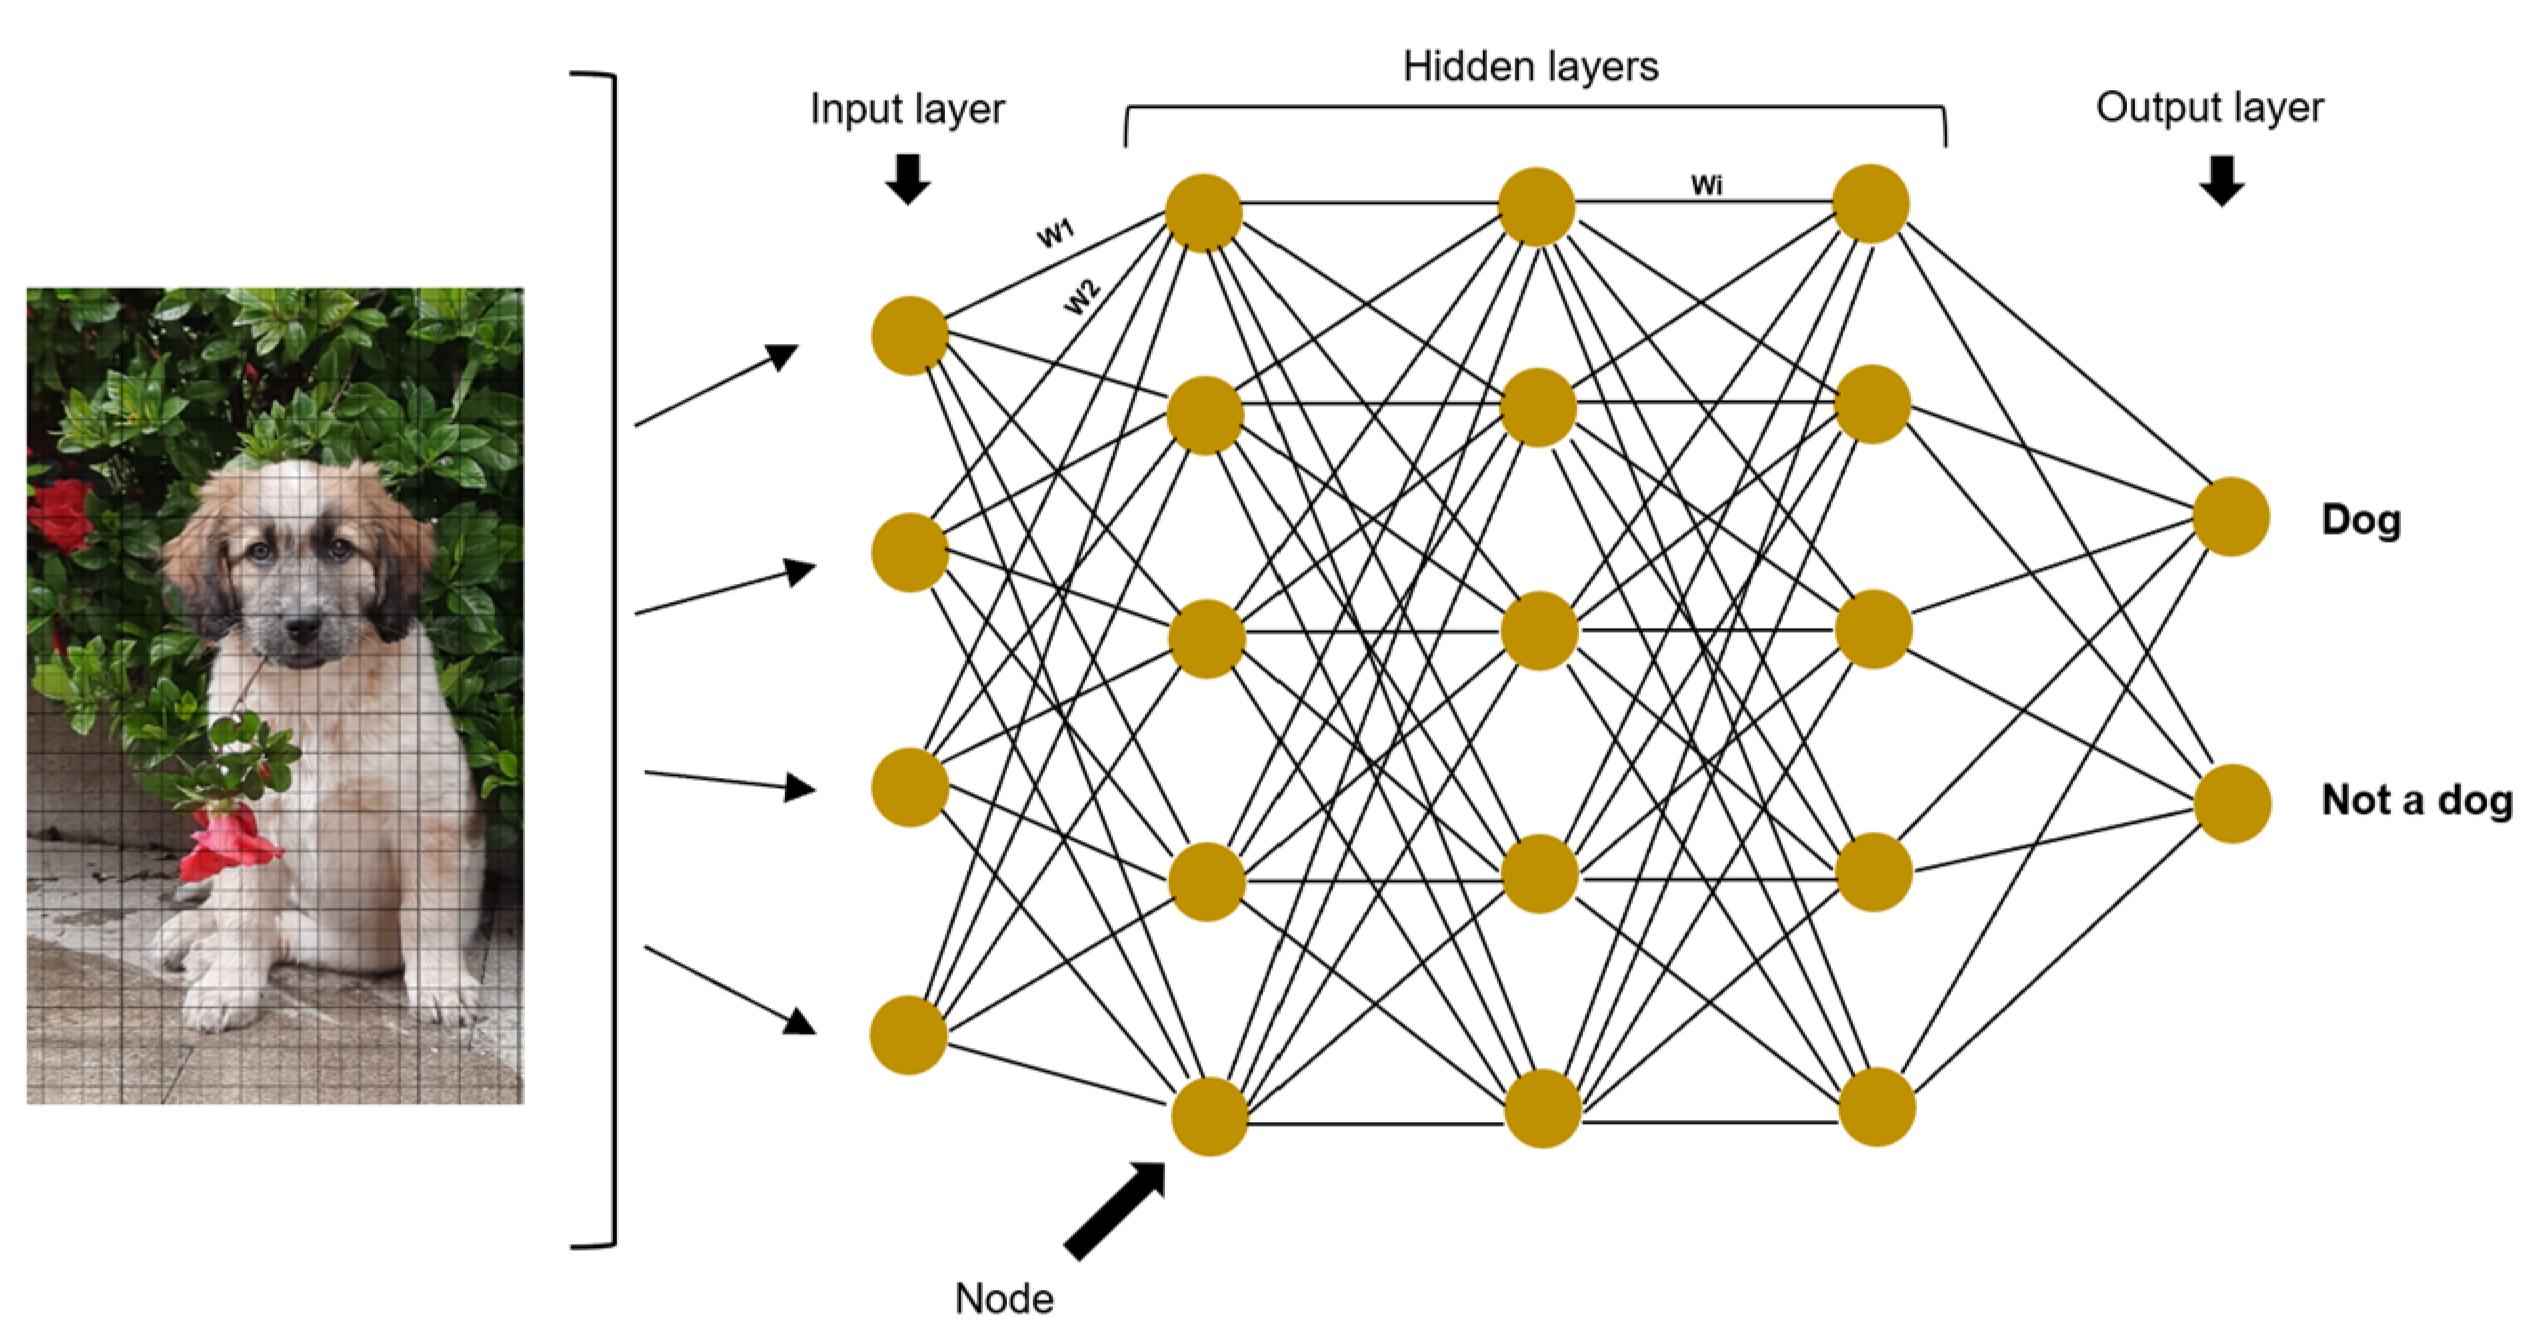
2.1. Artificial Neural Networks and Deep Learning

Artificial neural networks (ANNs) are a mathematical model used for machine learning, generally associated with supervised learning and inspired by the human nervous system [7,13]. They are formed by two principal components: the architecture and the weights [2]. This architecture is composed of nodes or neurons (the ANN’s basic units), which are arranged in vertical node layers. The layers are joined by connections so that each node has a connection with all the nodes in the following layer [8,14,15]. The first layer is the input layer, which receives the data to be analyzed, the last layer is the output layer, and between these two, there are hidden layers [9]. These layers are called hidden because neither the user nor the software has access to the results computed in them [7]. Each node in the hidden layers learns a different feature (i.e., curves, lines, brightness in a given image) [9]. The weights are numbers, usually randomly assigned and multiplied by each node, which are then adjusted in the process of network training [1,12]. Their purpose is to demonstrate the strength of one node’s influence on its neighboring nodes [7]. Then, the information passes through an activation function, and in the end, all the data are combined together to determine the final output [9]. For example, consider a network whose goal is to identify dogs in images: the input node would be the digital images; the hidden layers would be composed of nodes that consider different dog features such as typical lines or curves in the nose, eyes, ears, and fur; the weights would give different importance to each feature for the classification; and finally the output nodes would be “dog” or “not dog” (Figure 1).
Complex decisions require multilayer neural networks [14]. Neural networks with multiple hidden layers result in deep neural networks, that is, deep learning models [16]. The features learned by each layer are not determined by a human engineer, but determined by the model itself. The data scientist only needs to define the input layer, the number of hidden layers and nodes in each hidden layer, as well as the number of repetitions of the training [2]. Therefore, deep learning does not require much programming by humans and recognizing patterns in multi-dimensional data through examples [17,18]. However, increasing the number of hidden layers in deep learning means more computing power, and this makes it harder to understand the logic and interpretation of features used by the computer to achieve the output. This is called a black box problem [19]. Each node in the first hidden layer searches for something specific in the input layer but, entering deeper layers, the components become more and more abstract and complex than what a human would use to describe the same data [13].
The process of finding the weights that best fit the neural network is called optimization [9]. Forward propagation is the process of the AI reaching the predicted values, passing the input data through the model using an activation function, while backpropagation is the process of adjusting the parameters to minimize the loss function [15]. The loss function evaluates the difference between the ground truth and the model’s predicted values. The goal of the optimization is to minimize the loss function [15].
Gradient descent is one of the algorithms used to train neural networks to minimize the loss function [19,20,21,22]. Returning to the example of dog identification in images, this entails training the network to search for the best combination of weights (parameters) by presenting a set of images with and without dogs in order to obtain a final output of “dog” or “not dog”, respectively. This training has to be repeated a number of times and using the number of images necessary so that the identification error is minimized to a predefined acceptable error level.

2.2. Overfitting

Overfitting is a problem encountered in machine learning when a model fits too closely to a particular set of data and cannot be generalized to new data [10]. This happens when the model also fits the noise in the training data and lacks performance when presented with a new dataset [23]. To avoid overfitting, several measures can be considered when building a model: a large dataset, dropout, dividing the dataset, and stopping the train early (i.e., avoiding having too many iterations).
As large a dataset as possible should be collected to train the model, since reduced datasets can lead to overfitting [1,23]. Augmentation techniques can be performed to artificially increase data, transforming the dataset while keeping the same label. For this, the images can be blurred, rotated, zoomed, cropped, filtered, or the contrast can be modified, for example [15,24]. Active learning identifies the most useful data for the learning process to be annotated or labeled by an expert. It can therefore be helpful to maximize the model’s performance while using the least amount of data [25].
Dropout consists of removing a random percentage of the nodes on each training repetition [14]. This will prevent over-reliance on certain units and enable the system to be more robust even in the absence of certain nodes, allowing it to function in a more generalized way [21].
Dividing the dataset into training data (from which the model will learn) and testing data is also important in order to avoid overfitting and to assess whether the model can predict correct outputs when presented with different data [10]. The training data can be further divided into a training set and a validation set, where the validation set is a dataset used to evaluate and optimize the training [1]. The test data are used to evaluate the functioning of the model after the training sessions [10]. With this division, the model is trained to generalize, and not only to predict the data on which it was trained [15,23].
Stopping the training early is also important because while repeating it is necessary to reduce the error, too many iterations can lead to overfitting the model [9,26].

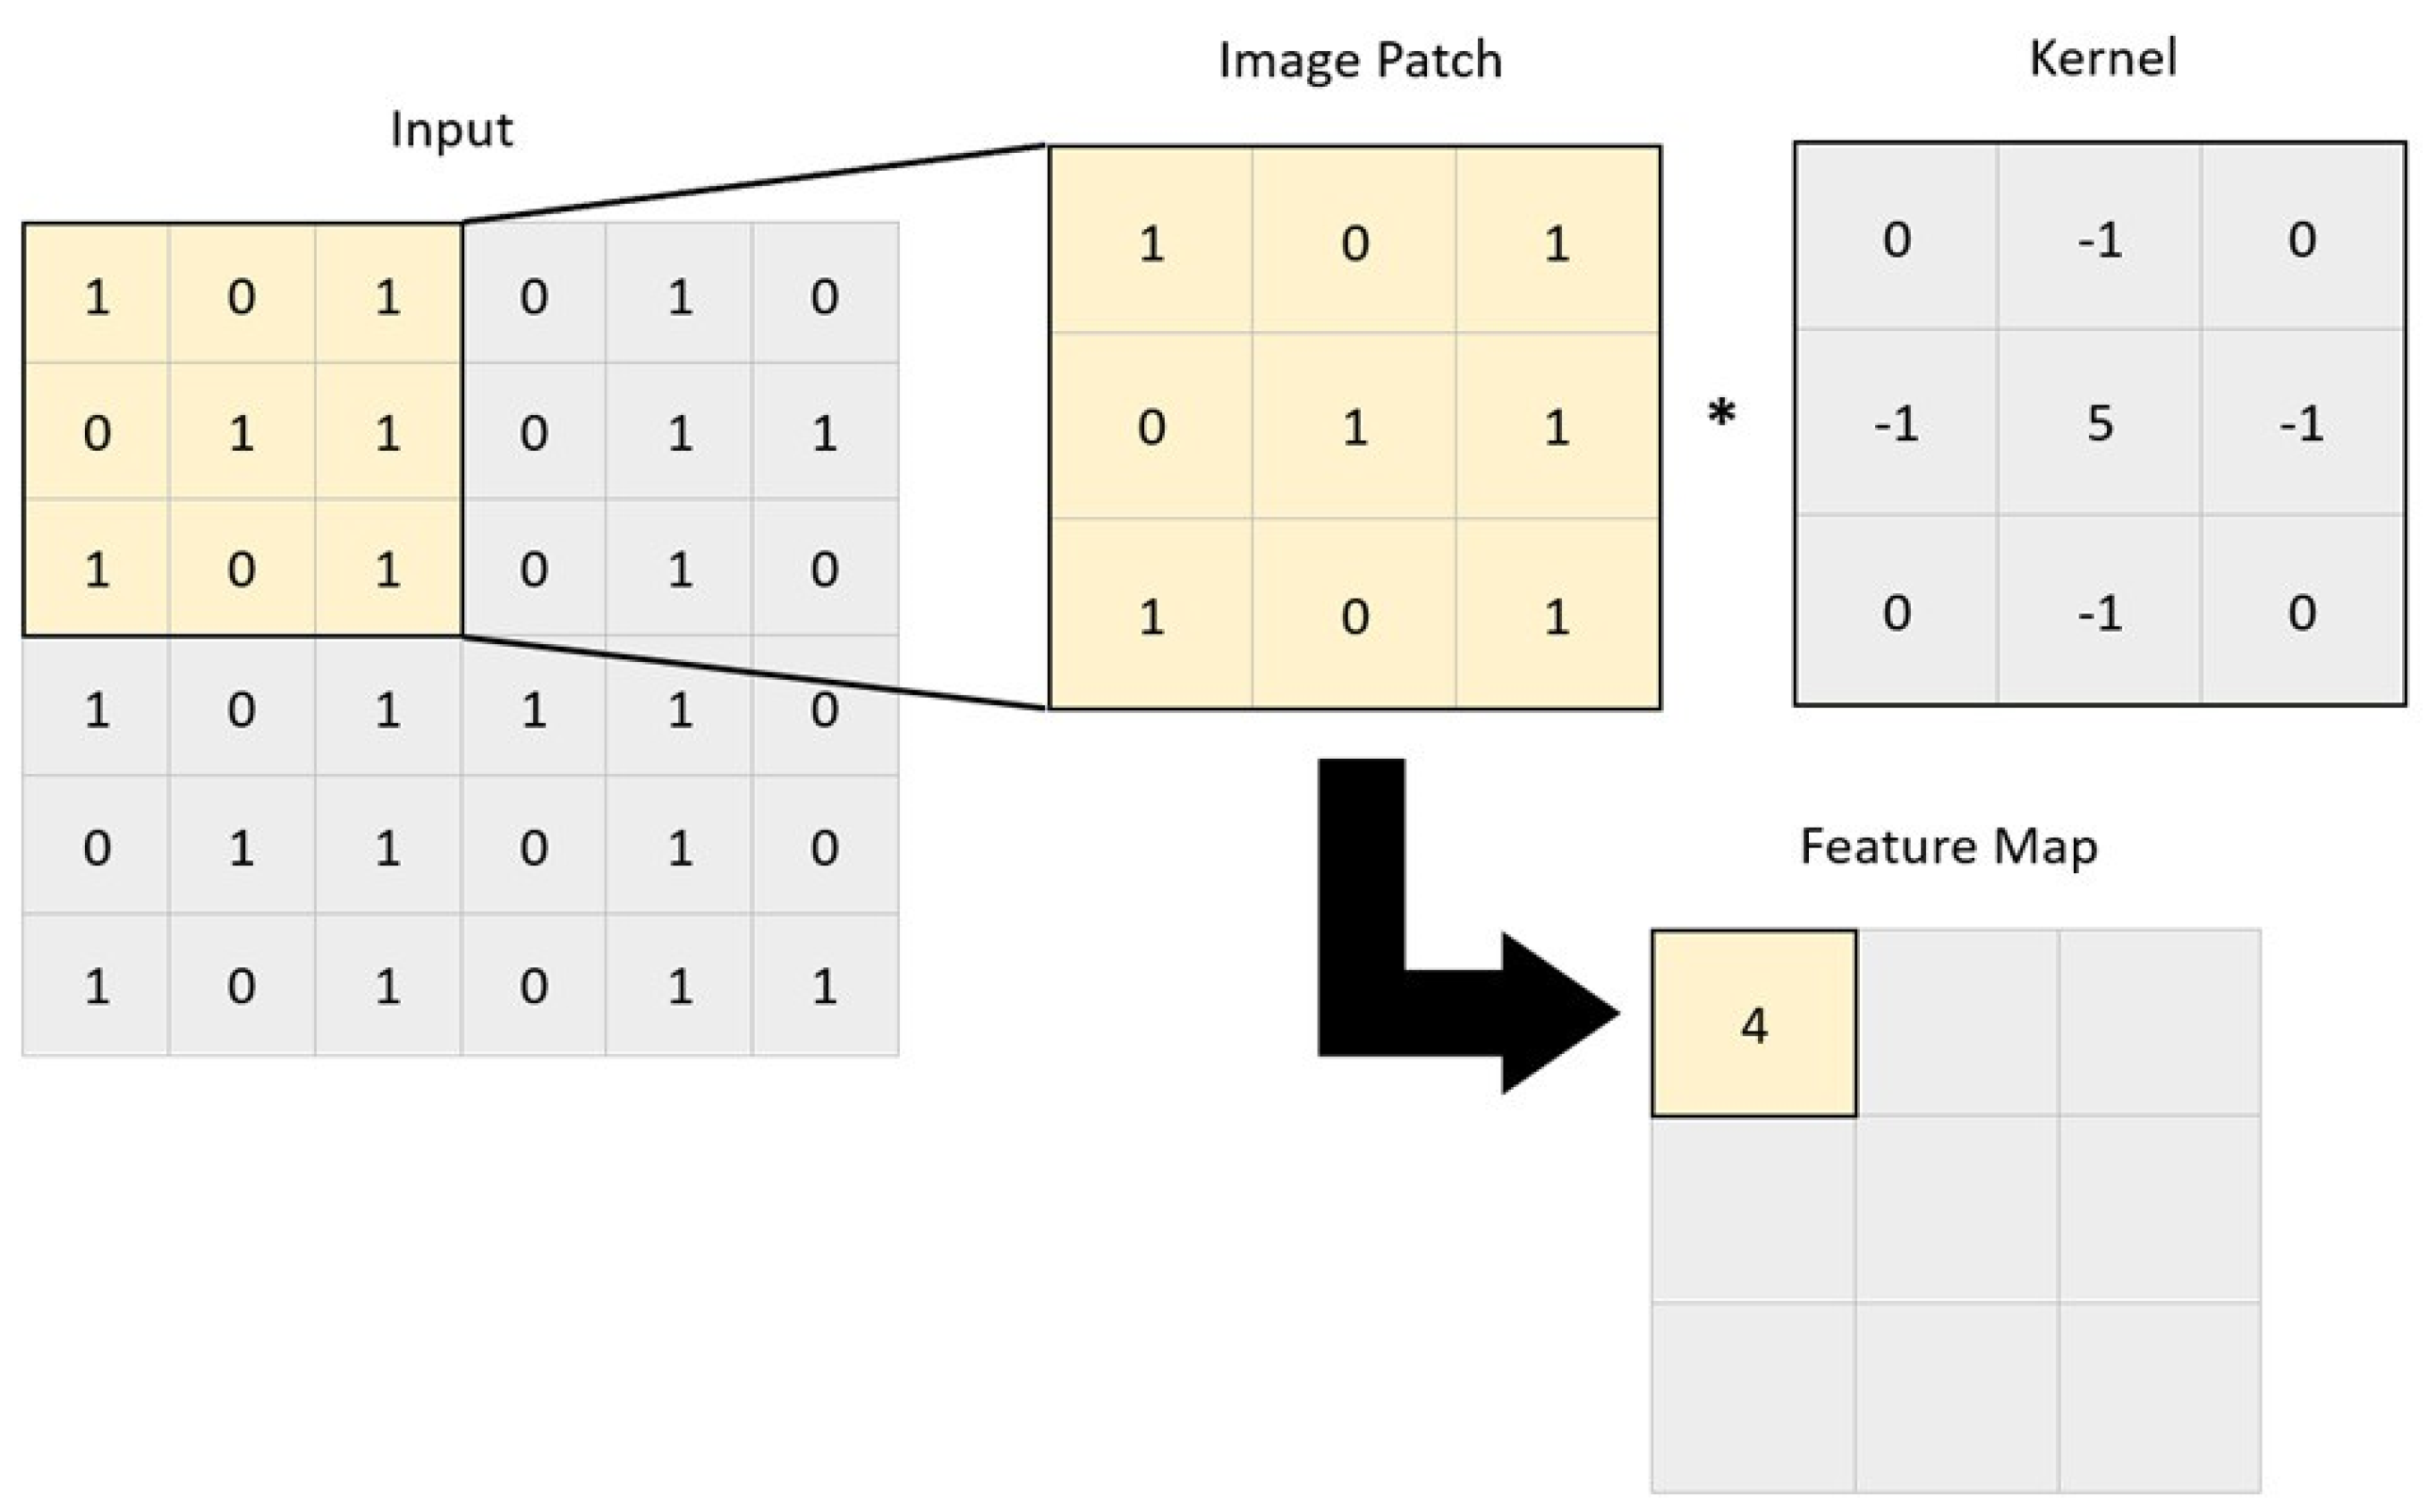
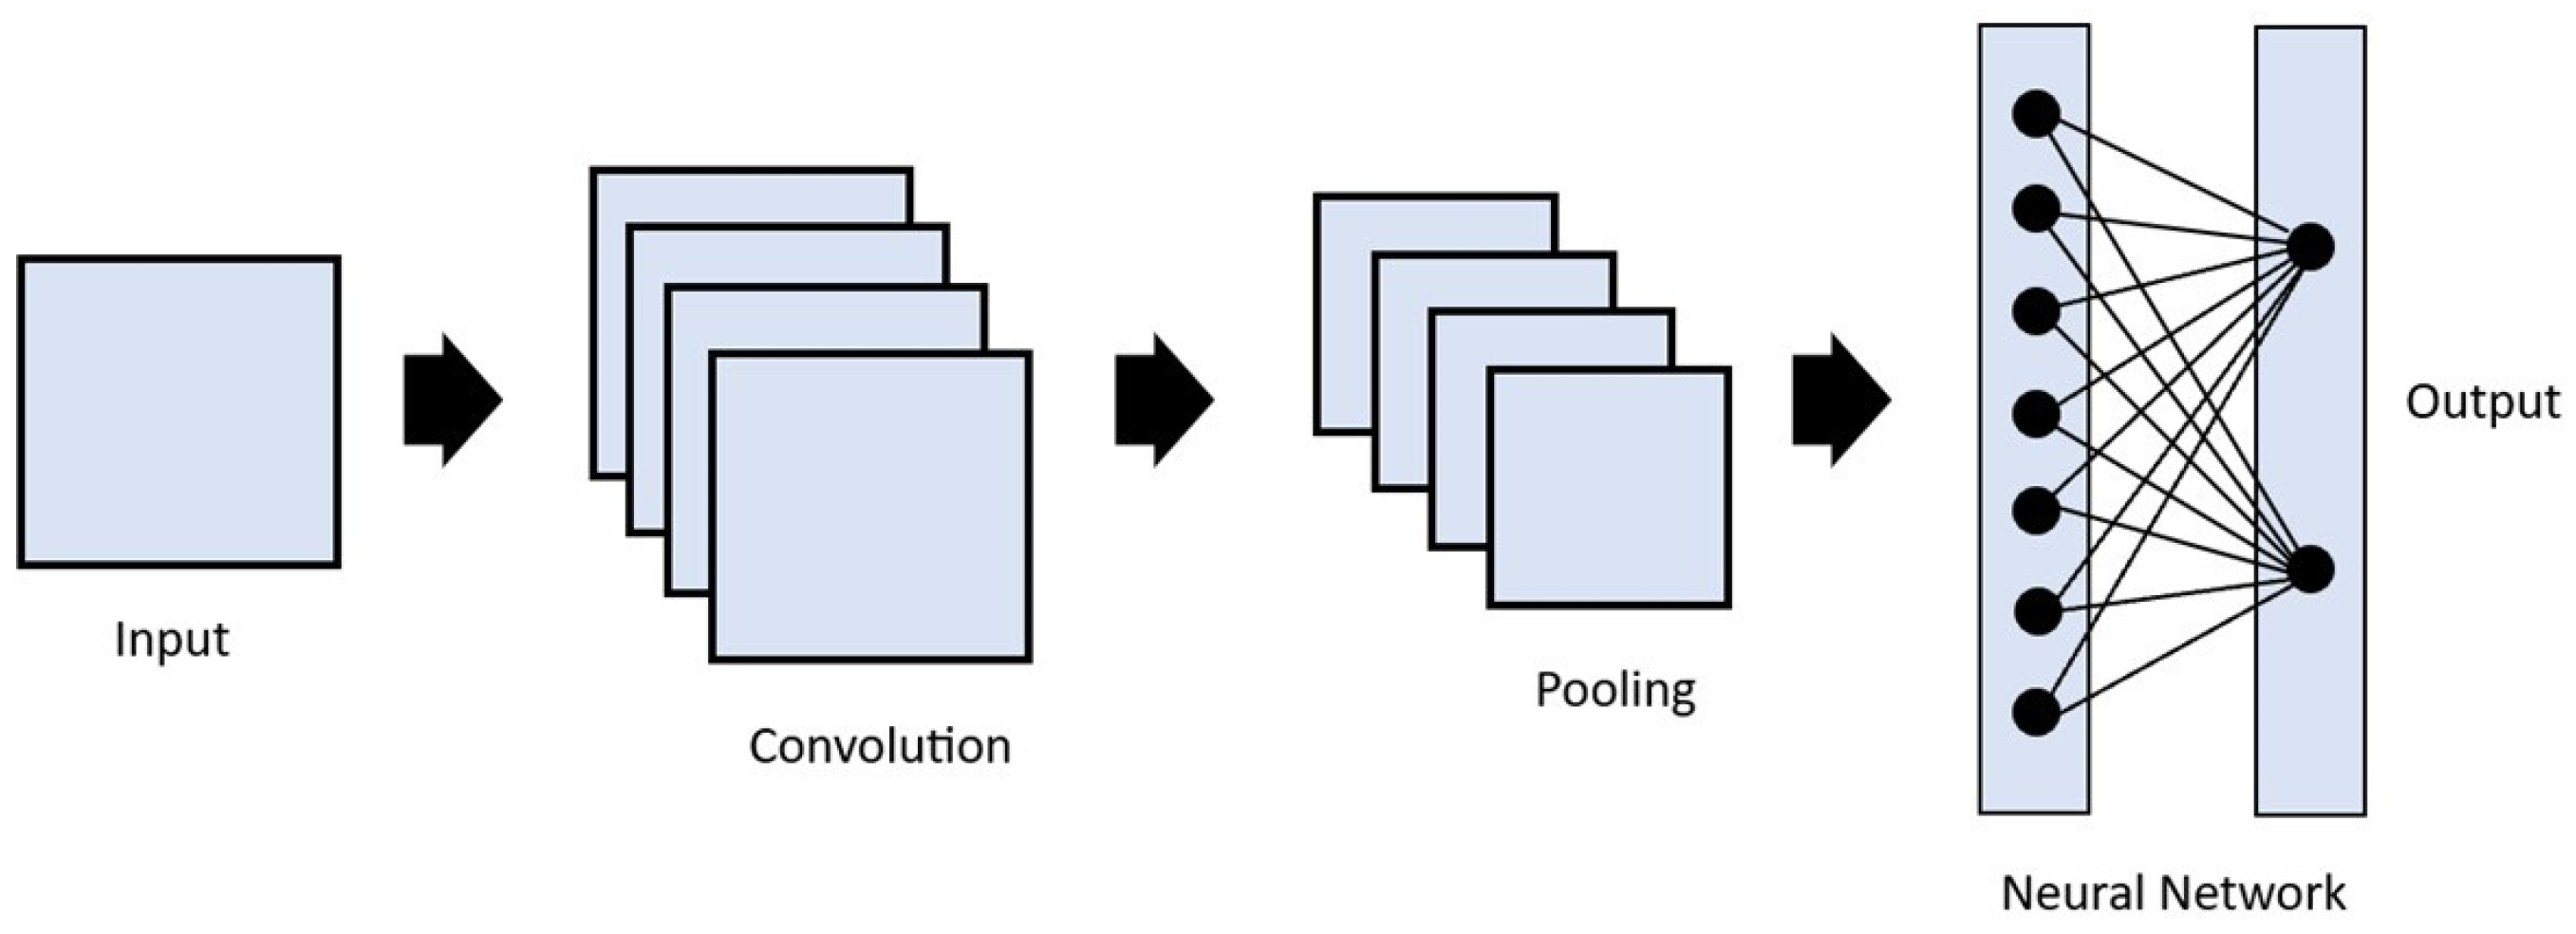
2.3. Convolutional Neural Networks

Convolutional neural networks (CNNs) are a type of deep learning model used mostly for image analysis [6]. They are generally composed of three types of layers: convolution, pooling, and fully connected [15,22].
Image convolution is a technique in which filters are applied to extract useful features in an image [9]. This is performed by applying a mathematical operation between a kernel matrix and an image patch (a section of the digital image). Each pixel in the patch region is multiplied by the values of the matrix, and then it is all summed up (Figure 2) [12]. This enables the image to be changed and emphasizes the relevant features, such as edges, different shapes, and blurred areas, enabling the model to transform the initial data into patterns that can be more easily identified by the AI [15,18]. The end result is a feature map resulting from the multiplications and additions, which passes through an activation function. The idea is that when a pixel is similar to neighboring pixels, they cancel each other out, leading to lower values appearing on the feature map, and if they are different, higher values appear in the feature map. The filters can be adjusted by altering the kernel matrix values based on the output error [12,18]. Entire image processing in a neural network is computationally expensive due to the great number of pixels used as input. The reduction in image size by sampling from regions in the input is thus a necessary step. This is called pooling or downsampling. The most commonly used form of pooling is max polling, where the pixel with the highest value is selected to represent a whole area [7,12,15]. There is also average pooling, in which the mean value of the pixels is used [7,15]. These two steps, convolution and pooling, are generally repeated multiple times, with each convolution layer being followed by a pooling layer. After this process, the resulting feature maps are flattened to reduce their dimensions and become a traditional neural network, which can have multiple hidden layers until the final output layer is reached (Figure 3). This final layer can function as a classifier, mapping the extracted features into outputs [12,15,21,22].

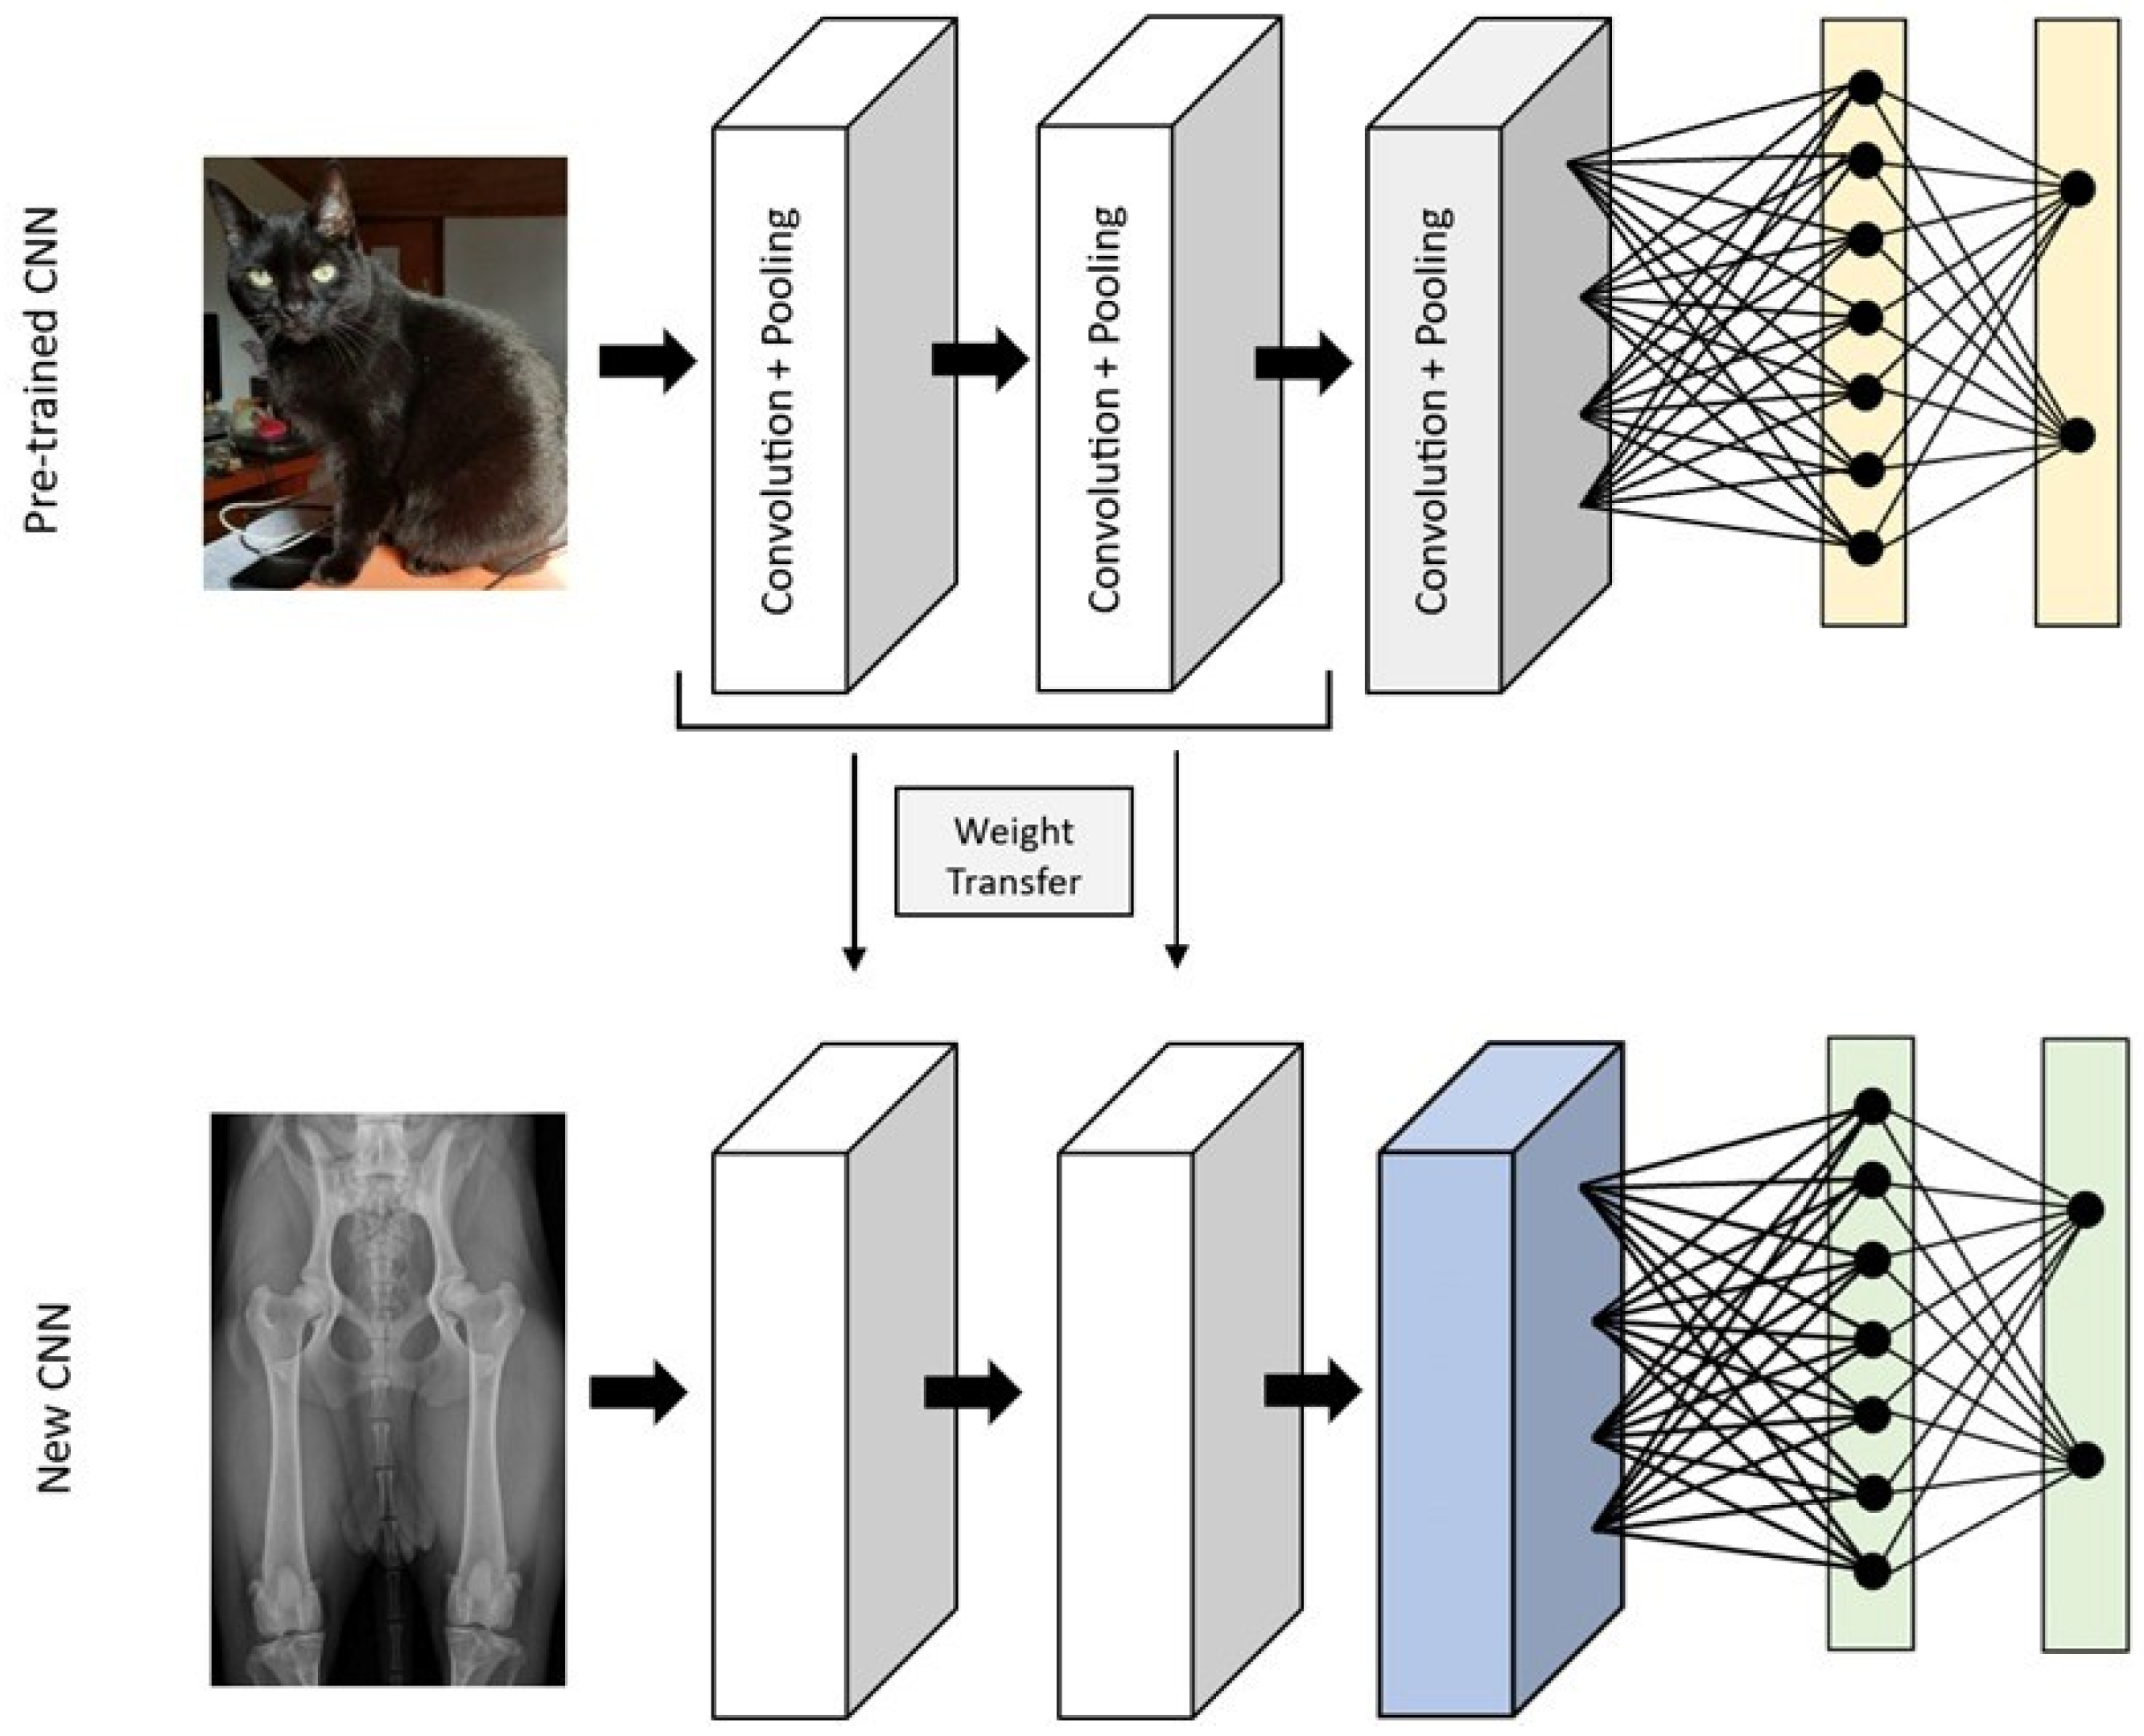
2.4. Transfer Learning

Transfer learning can be employed to overcome the problem of small datasets when using a CNN. Large datasets with thousands of images are necessary for effectively training deep learning models. However, obtaining such datasets in the field of medical imaging is exceedingly challenging [1,11]. This is both because there is a limited number of these images available to the public, and also because labeled data require annotations by experienced professionals, and therefore labeled data is even scarcer [3,17]. In transfer learning, a convolutional neural network model is pre-trained with other images in which the final layers are removed and replaced by the appropriate layers for the model [9,15]. Frequently, the model used is the ImageNet database if the network is fine-tuned with general images (such as images of animals, everyday objects, landscapes, and cars), but the network can also be pre-trained with medical images that were used for different classifications or tasks [9,15,27]. By using pre-trained networks, instead of starting the training with random weights, the weights of a similar model are transferred, which has been proven to obtain better performance and reduce the training time (Figure 4) [17,27]. The pre-trained model is already adjusted to detect features such as corners and shapes. Since these components are similar in all types of images, this already-created initial part of the model can be used and trained with the intended dataset, and the final part is adapted to our needs [15].

2.5. Object Detection and Segmentation Tasks

Object detection refers to the task of estimating the concept and localization of an object of interest within the images [28]. YOLO–You Only Look Once–is a recent open-source unified model for object detection. It localizes the region of interest in an image, that is, the region with the detail of an image that needs to be detected for a certain task. Previously described methods repurposed classifiers or localizers to perform object detection, applying the model to an image at multiple locations and scales. On the other hand, YOLO uses only a single convolutional neural network, processing the whole image at one forward propagation to obtain the classification and location simultaneously. YOLO divides the image into regions, predicting bounding boxes with an associated probability. By looking only once at the image, the network works much faster and is able to generalize better than other detection methods, because it understands the global context [29].
Image segmentation, also called pixel-based classification, is used to delimitate the boundaries of an area of interest [19]. The most commonly used deep learning architecture for this medical imaging segmentation is the U-Net. U-Net is a symmetrical, u-shaped network with a structure that consists of two parts: the first is called the encoder or contracting path, which functions as a standard CNN, with convolution and pooling layers to down-sample the images. The second part is called the decoder or expansive path, which uses deconvolutional operations to up-sample the images [19,30]. Between every encoder and decoder path, there are skip connections that link high-level features with low-level features, using a copy and crop operator, and resolving problems of special loss. This enables the network to increase the output’s resolution while learning localized classification [30].

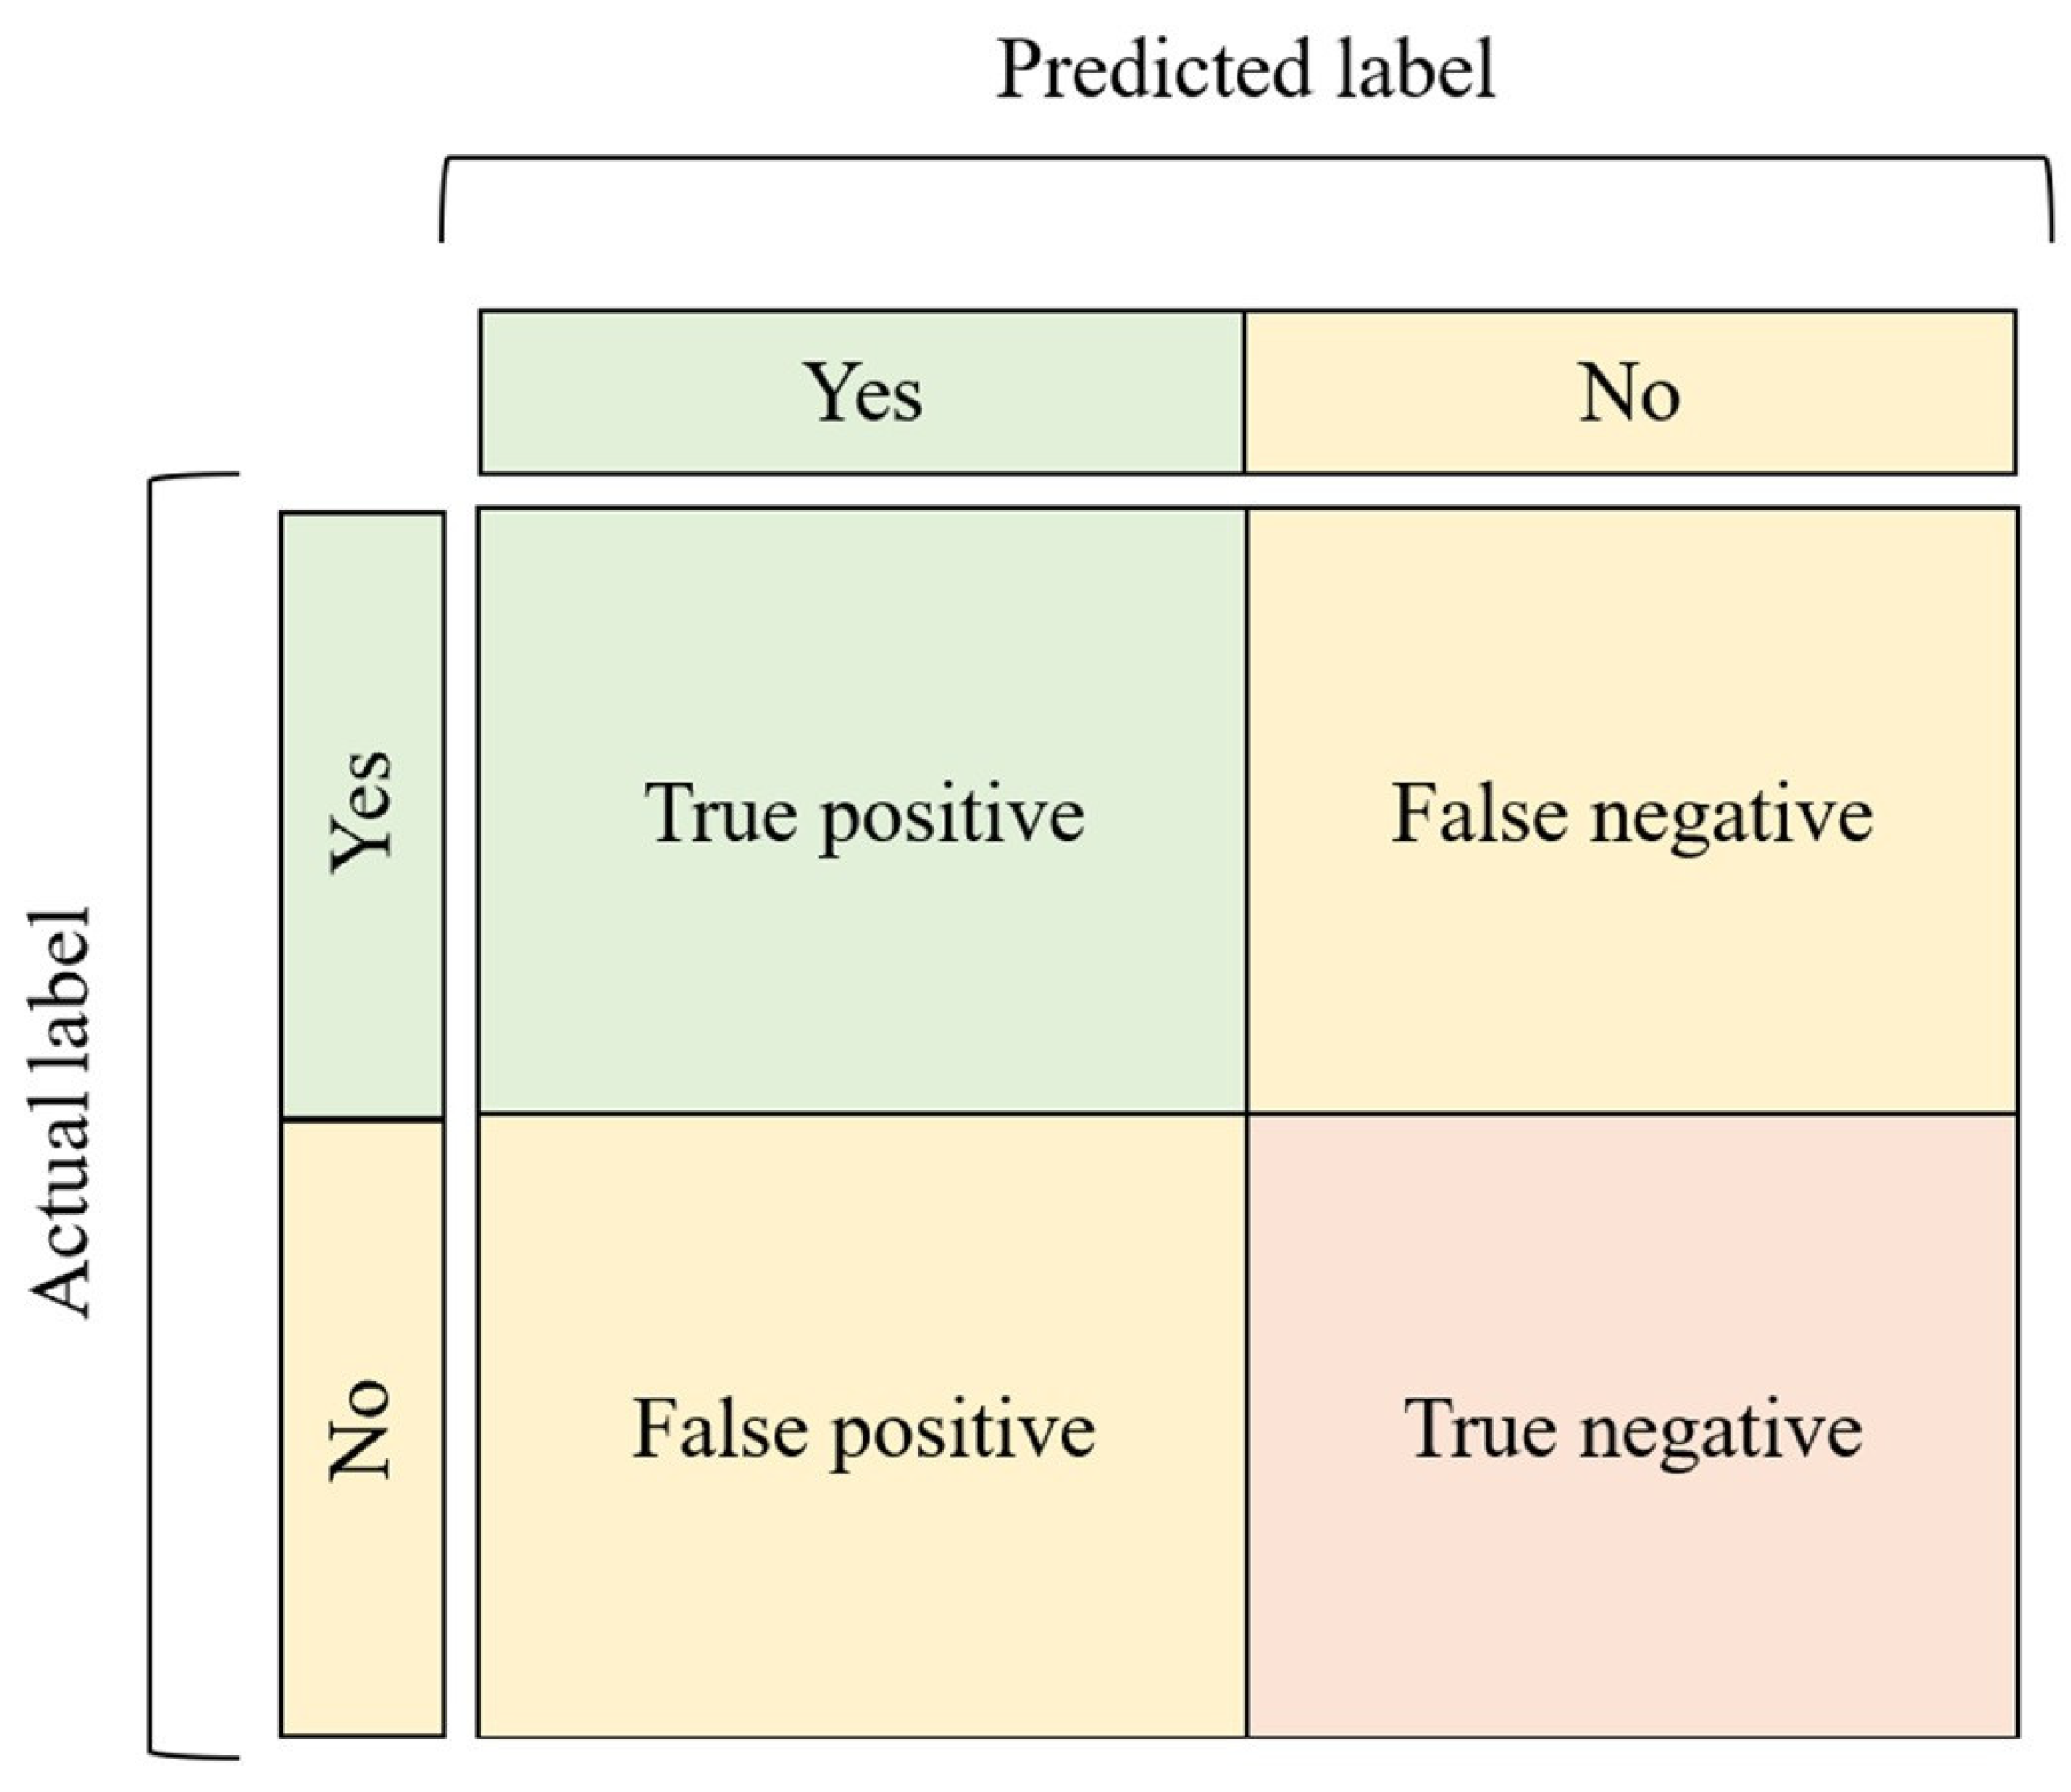
2.6. Evaluation of the Model’s Performance

After training, it is crucial to evaluate the quality of the model built, to understand its performance [31]. To evaluate the model’s performance, metrics such as accuracy, precision, specificity, sensitivity, F1 score, and dice score can be used. These are obtained through parameters such as true negatives, true positives, false negatives, and false positives based on the prediction given by the AI model and the labeled data, which serve as the ground truth [32]. For classification tasks, there are also receiver operating characteristic curves (ROCs) and confusion matrices [15,31].
Accuracy is measured by the division between the correctly predicted data and the total number of predictions [31].
Accuracy = True   positives + True   negatives True   positives + True   negatives + False   positives + False   negatives
Precision is measured by the ratio between true positives and the sum of true positives and false positives. This indicates how accurate the model is in predicting positively [33].
Precision = True   positives True   positives + False   positives
Specificity is the ratio between true negatives and the sum of the true negatives with false positives [32,34].
Specificity = True   negatives True   negatives + False   positives
Sensitivity is one of the most important metrics for the medical field of machine learning. It is measured by the division between true positives and the sum of true positives and false negatives [33,34].
Sensitivity = True   positives True   positives + False   negatives
F1 measure uses the precision and recall scores, combining the two into only one performance test [7,33].
F 1 = 2   ×   Precision   ×   Recall Precision +   Recall
Dice score is generally used in segmentation. If the region of interest annotated by the expert and the one predicted by the model overlap completely, the score is one; if they do not overlap at all, the score is 0 [1,35].
Confusion matrices are a way of visualizing the performance of the model by representing the counts from predicted and actual values in the form of a table (Figure 5) [1,33].
The ROC is a graphical representation of the model’s performance, with the true positive rate (or recall) on the y-axis and the false positive rate (or specificity) on the x-axis, which shows the performance for a number of different candidate threshold values between 0.0 and 1.0. With the ROC, the area under the curve (AUC) is calculated. This can vary between 0 and 1: when the value is 0.5, the model is unable to distinguish between two classes, and when it is 1, it predicts correctly 100% of the time [7,33].

3. Veterinary Imaging

Several authors have already applied machine learning technology in veterinary medicine. In this section, some of the advances made in small animal imaging using AI are presented (Table 1).

3.1. Musculoskeletal

McEvoy and Amigo (2013) were the first researchers to apply machine learning to the musculoskeletal region in the veterinary imaging field [7,36]. Firstly, in 2013, they used a partial least squares discriminant analysis model and an artificial neural network model to identify dogs’ hips in radiographs, classifying the images as “hip” or “not hip” [36]. Later, in 2021, McEvoy et al. used deep learning for the binary classification of hip dysplasia, in the first phase using a YOLO network to detect the hip region and then, in the second phase, to determine if hip dysplasia was present or not [11]. The obtained model was highly accurate [11]. Both studies showed that ML could be applied to veterinary imaging, specifically to hip dysplasia detection [11,36]. Gomes et al. (2021) carried out a similar study to McEvoy et al. (2021), using a CNN to classify dogs’ radiographs as dysplastic or not and measuring the model’s efficiency by comparing the results with the classification by an expert radiologist. Ultimately, the model and the veterinary radiologist produced similar results. Their work demonstrated that it is possible to use smaller datasets and still obtain accurate results by using transfer learning and pre-trained CNNs [39]. Akula et al. (2022) also applied CNNs for hip dysplasia, both in radiographs and in MRI, developing two models, one to identify canine hip dysplasia and another to classify the hips into FCI categories. The dysplasia detection model achieved good results, with an accuracy of 89.7%, whereas the classification model only achieved 70%. The small dataset could be one of the limitations of the study [31]. The Dys4vet group also used machine learning to create software to detect and classify hip dysplasia. Moreira da Silva et al. (2022) used a U-net for femur and acetabulum segmentation and active learning to maximize the model’s performance with the least amount of data. This led to the creation of a high-performing model which required 18.98% less annotated data [25,35].
Ergun and Guney (2021) used CNNs and compared the results with a support vector machine for the classification of radiographs to determine a dog’s maturity (accordingly to the growth plates), and also to detect fractures and date fractures in long bones and compare the results of each one. The group achieved good performance in all models, obtaining F1 scores from 0.62 to 0.89. This work also evaluated the effect of using data augmentation and transfer learning. Both were found to be useful, increasing the effectiveness of the models. However, the augmentation technique was shown to negatively affect the support vector machine model, although not the deep learning algorithms [40].
Ye et al. (2021) developed an automatic system to assist in the interpretation of spectral-domain optical coherence tomography of surgical margin tissue in dogs, using a CNN to classify the tissue as healthy or cancerous with high accuracy and precision [41].
Yang et al. (2015) and Duda et al. (2018) applied machine learning to magnetic resonance images (MRI) to identify muscular dystrophy in Golden Retrievers. Yang et al. (2015) used two different machine learning classifiers to classify the images as healthy or diseased. Duda et al. (2018) used three machine learning classifiers to classify the dystrophy progression in four phases. Both studies concluded that muscle texture analysis could be a promising tool. However, a larger dataset and other methods should be considered [37,38].

3.2. Thoracic

Yoon et al. (2018) and Burti et al. (2020) both used CNNs to evaluate radiographs from dogs. Burti et al. (2020) used it to evaluate the presence or absence of cardiomegaly, while Yoon et al. (2018) used it to assess cardiomegaly, the presence of pneumothorax, pleural effusion, pulmonary patterns, and mediastinal shifts. Yoon et al. (2018) also applied a bag-of-features machine learning model in the same study, which performed worse than the CNN [43,45]. Dumortier et al. (2022) used CNNs pre-trained with human chest X-ray images to identify pulmonary patterns in cats’ radiographs, training 200 different networks, each one with different randomly chosen training and validation sets, in order to improve the model’s performance [53]. Banzato et al. (2021) also used CNNs with transfer learning, using two different pre-trained models, ResNet-50 and DenseNet-121, to test which would be more efficient. The goal was for the model to classify dogs’ thoracic radiographs, labeling them as unremarkable, cardiomegaly, alveolar, bronchial, and interstitial patterns, presence of masses, pleural effusion, pneumothorax, and megaesophagus. ResNet-50 performed better, obtaining an area under the receiver–operator curve of above 0.8 in all parameters except for bronchial patterns and mass identification [34]. This group also developed a similar study to evaluate cats’ radiographs, testing a ResNet-50 and Inception V3 CNN. Both networks had similar performances, with high accuracy, except for mass detection [49].
Zhang et al. (2021) used deep learning to determine the vertebral heart score by measuring 16 key points in the vertebra and heart, which was then used to evaluate if there was cardiomegaly on dog X-rays, with an average performance of 90.9% [50]. More recently, Jeong and Sung (2022) proposed a new automated cardiac index for dogs to improve the classical vertebral heart score, using an algorithm that combined segmentation and measurements. The results showed that this new method could be used to diagnose cardiomegaly at an earlier stage and with a high degree of effectiveness [52].
Li et al. (2020) used CNNs for the detection of left atrial enlargement, comparing the results with veterinary radiologists’ evaluations. They trained two models, one that valued accuracy more highly and another that valued sensitivity more highly. The results revealed that the performance of the model with the emphasis on accuracy achieved an identical accuracy and sensitivity to the radiologists, with a concordance of 85.19% between the two [46].
Marschner et al. (2017) used ML in computed tomography of the pulmonary parenchyma to diagnose pulmonary thromboembolism in dogs. The model was able to distinguish between healthy and abnormal lung tissue. However, it was not able to efficiently distinguish dogs with this pathology from dogs with other lung pathologies [42].
Ott et al. (2021) applied the concept of deep CNNs to develop an AI capable of detecting pulmonary coccidioidomycosis, a zoonotic disease, in dog radiographs, achieving high-performance results [48].
Arsomngern et al. (2019) developed a radiograph diagnosis application (Pet-X) to detect lung abnormalities in cats and dogs using CNNs, by mapping the lesions and classifying them as alveolar, interstitial, and bronchial. The software performed better in lateral position X-rays, which can be explained by the fact that ventrodorsal images present more noisy features. As for the lesion classification, bronchial and interstitial detection models showed poorer performances than the alveolar model [44].
Boissady et al. (2020) used an AI program, PicoxAI, to screen thoracic X-rays for 15 types of primary thoracic lesions in cats and dogs. They used three different CNNs with three different pre-trained models: one without pre-training, another one pre-trained with images from ImageNet, and another pre-trained with ImageNet followed by training with a dataset of human thoracic X-rays. The network pre-trained only with unspecialized data (ImageNet) achieved the best results. The best model was then compared with classification by veterinarians, comparing the error rate in both [47]. In 2021, Boissady et al. also used PicoxAI’s CNN to calculate the vertebral heart score, comparing the results obtained with the annotations of veterinary specialists in order to evaluate the model’s performance. The final results showed a high agreement [51]. Hespel et al. (2022) also evaluated the performance of the PicoxAI program. They compared the error of using four different CNNs with the error rates of 13 veterinary radiologists in the analysis of thoracic radiographs, classifying the images with 15 possible labels. The results varied depending on the label [54].
Kim et al. (2022) studied another AI application—“vetology”—and compared its analysis with veterinary radiologist evaluations in the diagnosis of canine cardiogenic pulmonary edema. The accuracy, sensitivity, and specificity of the model were above 90%. However, despite the negative predictive value of 99%, the positive predictive value was only 56%, with several images being diagnosed differently from the veterinary expert’s evaluation [55]. Müller et al. (2022) carried out a similar study comparing evaluations in the diagnosis of pleural effusion, obtaining 88.7% accuracy, 90.2% sensitivity, and 81.8% specificity [56].

3.3. Nervous System

Banzato et al. conducted three studies in which they used AI to analyze the nervous system in MRIs. In 2017, they used machine learning texture analysis to predict the histological grade in dogs’ meningiomas [57]. In 2018, they carried out a new study on meningioma grading, this time using two different CNNs, one pre-trained, and one without pre-training. The de novo CNN proved to be more efficient [58]. Another study using a CNN and transfer learning was conducted by Banzato’s group in 2018 in order to differentiate between canine glioma and meningioma [59]. In all these studies, it was concluded that machine learning was an effective tool for assisting clinicians in MRI analysis [58,59].
Spiteri et al. (2019) applied machine learning and support vector machines to identify Cavalier King Charles dogs with Chiari-like malformation-associated pain and syringomyelia by detecting distinguishing features in MRI [60].
Biercher et al. (2021) developed a CNN to identify several thoracolumbar spinal cord pathologies in dog MRIs, such as intervertebral disc extrusion, intervertebral disc protrusion, fibrocartilaginous embolism, syringomyelia, and neoplasia. The model showed successful results in the detection and distinction of all pathologies except for syringomyelia and neoplasia. The authors concluded that more data should help in correcting this issue [61].
Wanamaker et al. (2021) used texture analysis machine learning to differentiate and identify glial tumor cells and non-infectious inflammatory meningoencephalitis in MRI and found the designed model to be efficient. Wanamaker also tried to grade subtypes within the two diseases, but without much success [62].

3.4. Abdominal

Banzato et al. (2018) used a deep neural network and transfer learning in ultrasound images to detect the presence of diffuse degenerative hepatic diseases in dogs. The results were compared to evaluate the model’s accuracy with serum biochemistry and cytology, using histopathology results as ground truth. They concluded that the model was more efficient at predicting disease than biochemistry and cytology [63].
Shaker et al. (2021) developed a machine learning model for CT analysis in detecting canine hepatic masses and predicting their malignancy by evaluating their heterogeneity [64].

4. Conclusions

Machine learning in veterinary imaging diagnosis has mostly been applied to the thoracic region, with various studies on the identification of pulmonary patterns and cardiomegaly detection. In addition, some commercially available software, such as “PicoxIA”, enable abdominal, thoracic, and hip image analyses, although studies have only been published validating the thoracic analysis. “Vetology” is another clinically certified software, which was created for the analysis of radiographs of the thorax, heart, and lungs in dogs. There are also a few studies on the musculoskeletal region, mainly the hip, for the detection of hip dysplasia. The nervous system and the abdominal region are the least studied regions for ML in veterinary medicine.
The most commonly used type of machine learning is supervised learning, with expert radiologists first labeling the images to train the AI. CNNs are the most commonly used model for image analysis since they are the best model for this purpose and have been improved in recent years.
The number of images used varies greatly since the necessary number of required images varies depending on the type of machine learning method applied and depending on whether or not augmentation techniques or transfer learning are employed.

Author Contributions

Conceptualization, A.I.P. and P.F.-G.; validation, P.L., A.R., M.S.A.-P., B.C., C.L., L.G., V.F. and M.G.; formal analysis, M.S.A.-P., B.C., L.G., V.F. and M.G.; resources, M.G.; writing—original draft preparation, A.I.P. and P.F.-G.; writing—review and editing, A.I.P. and P.F.-G.; visualization, P.L., A.R., M.S.A.-P., B.C., C.L., L.G., V.F. and M.G.; supervision, M.S.A.-P., B.C., L.G., V.F. and M.G.; project administration, M.G.; funding acquisition, M.S.A.-P., B.C., L.G. and M.G. All authors have read and agreed to the published version of the manuscript.

Funding

This research was funded by project Dys4Vet (POCI-01-0247-FEDER-046914) and co-financed by the European Regional Development Fund (ERDF) through COMPETE2020-The Operational Program for Competitiveness and Internationalization (OPCI).

Institutional Review Board Statement

Not applicable.

Informed Consent Statement

Not applicable.

Data Availability Statement

Not applicable.

Acknowledgments

The authors are also grateful for all the conditions made available by the FCT—Portuguese Foundation for Science and Technology, under the project UIDB/00772/2020 and the Scientific Employment Stimulus—Institutional Call—CEEC-INST/00127/2018 UTAD.

Conflicts of Interest

The authors declare no conflict of interest.

References

  1. Chartrand, G.; Cheng, P.M.; Vorontsov, E.; Drozdzal, M.; Turcotte, S.; Pal, C.J.; Kadoury, S.; Tang, A. Deep Learning: A Primer for Radiologists. RadioGraphics 2017, 37, 2113–2131. [Google Scholar] [CrossRef] [PubMed] [Green Version]
  2. Macukow, B. Neural Networks-State of Art, Brief History, Basic Models and Architecture. In Computer Information Systems and Industrial Management, Proceedings of the 15th IFIP TC8 International Conference on Computer Information Systems and Industrial Management, Vilnius, Lithuania, 14–16 September 2016; Lecture Notes in Computer Science (Including Subseries Lecture Notes in Artificial Intelligence and Lecture Notes in Bioinformatics); Springer: Berlin/Heidelberg, Germany, 2016; Volume 9842, pp. 3–14. [Google Scholar] [CrossRef] [Green Version]
  3. Tsuneki, M. Deep Learning Models in Medical Image Analysis. J. Oral Biosci. 2022, 64, 312–320. [Google Scholar] [CrossRef] [PubMed]
  4. Suzuki, K. Overview of Deep Learning in Medical Imaging. Radiol. Phys. Technol. 2017, 10, 257–273. [Google Scholar] [CrossRef]
  5. Krizhevsky, A.; Sutskever, I.; Hinton, G.E. ImageNet Classification with Deep Convolutional Neural Networks. Commun. ACM 2017, 60, 84–90. [Google Scholar] [CrossRef] [Green Version]
  6. Nakaura, T.; Higaki, T.; Awai, K.; Ikeda, O.; Yamashita, Y. A Primer for Understanding Radiology Articles about Machine Learning and Deep Learning. Diagn. Interv. Imaging 2020, 101, 765–770. [Google Scholar] [CrossRef]
  7. Hennessey, E.; DiFazio, M.; Hennessey, R.; Cassel, N. Artificial Intelligence in Veterinary Diagnostic Imaging: A Literature Review. Vet. Radiol. Ultrasound 2022, 63, 851–870. [Google Scholar] [CrossRef]
  8. McBee, M.P.; Awan, O.A.; Colucci, A.T.; Ghobadi, C.W.; Kadom, N.; Kansagra, A.P.; Tridandapani, S.; Auffermann, W.F. Deep Learning in Radiology. Acad. Radiol. 2018, 25, 1472–1480. [Google Scholar] [CrossRef] [Green Version]
  9. Hespel, A.; Zhang, Y.; Basran, P.S. Artificial Intelligence 101 for Veterinary Diagnostic Imaging. Vet. Radiol. Ultrasound 2022, 63, 817–827. [Google Scholar] [CrossRef]
  10. Borstelmann, S.M. Machine Learning Principles for Radiology Investigators. Acad. Radiol. 2020, 27, 13–25. [Google Scholar] [CrossRef] [Green Version]
  11. McEvoy, F.J.; Proschowsky, H.F.; Müller, A.V.; Moorman, L.; Bender-Koch, J.; Svalastoga, E.L.; Frellsen, J.; Nielsen, D.H. Deep Transfer Learning Can Be Used for the Detection of Hip Joints in Pelvis Radiographs and the Classification of Their Hip Dysplasia Status. Vet. Radiol. Ultrasound 2021, 62, 387–393. [Google Scholar] [CrossRef]
  12. Currie, G.; Hawk, K.E.; Rohren, E.; Vial, A.; Klein, R. Machine Learning and Deep Learning in Medical Imaging: Intelligent Imaging. J. Med. Imaging Radiat. Sci. 2019, 50, 477–487. [Google Scholar] [CrossRef] [Green Version]
  13. Razzak, M.I.; Naz, S.; Zaib, A. Deep Learning for Medical Image Processing: Overview, Challenges and the Future. In Classification in BioApps: Automation of Decision Making; Springer: Cham, Switzerland, 2018; Volume 26, pp. 323–350. [Google Scholar] [CrossRef] [Green Version]
  14. Shen, D.; Wu, G.; Suk, H.-I. Deep Learning in Medical Image Analysis. Annu. Rev. Biomed. Eng. 2017, 19, 221–248. [Google Scholar] [CrossRef] [PubMed] [Green Version]
  15. Do, S.; Song, K.D.; Chung, J.W. Basics of Deep Learning: A Radiologist’s Guide to Understanding Published Radiology Articles on Deep Learning. Korean J. Radiol. 2020, 21, 33–41. [Google Scholar] [CrossRef] [PubMed]
  16. Giger, M.L. Machine Learning in Medical Imaging. J. Am. Coll. Radiol. 2018, 15, 512–520. [Google Scholar] [CrossRef]
  17. Chan, H.P.; Samala, R.K.; Hadjiiski, L.M.; Zhou, C. Advances in Experimental Medicine and Biology. In Deep Learning in Medical Image Analysis; Springer: Berlin/Heidelberg, Germany, 2020; Volume 1213, pp. 3–21. [Google Scholar] [CrossRef]
  18. Lecun, Y.; Bengio, Y.; Hinton, G. Deep Learning. Nature 2015, 521, 436–444. [Google Scholar] [CrossRef]
  19. Le, W.T.; Maleki, F.; Romero, F.P.; Forghani, R.; Kadoury, S. Overview of Machine Learning: Part 2: Deep Learning for Medical Image Analysis. Neuroimaging Clin. N. Am. 2020, 30, 417–431. [Google Scholar] [CrossRef] [PubMed]
  20. Maier, A.; Syben, C.; Lasser, T.; Riess, C. A Gentle Introduction to Deep Learning in Medical Image Processing. Z. Med. Phys. 2019, 29, 86–101. [Google Scholar] [CrossRef] [PubMed]
  21. Wang, J.; Zhu, H.; Wang, S.-H.; Zhang, Y.-D. A Review of Deep Learning on Medical Image Analysis. Mob. Netw. Appl. 2021, 26, 351–380. [Google Scholar] [CrossRef]
  22. Yamashita, R.; Nishio, M.; Do, R.K.G.; Togashi, K. Convolutional Neural Networks: An Overview and Application in Radiology. Insights Imaging 2018, 9, 611–629. [Google Scholar] [CrossRef] [PubMed] [Green Version]
  23. Yasaka, K.; Akai, H.; Kunimatsu, A.; Kiryu, S.; Abe, O. Deep Learning with Convolutional Neural Network in Radiology. Jpn. J. Radiol. 2018, 36, 257–272. [Google Scholar] [CrossRef] [PubMed]
  24. Chlap, P.; Min, H.; Vandenberg, N.; Dowling, J.; Holloway, L.; Haworth, A. A Review of Medical Image Data Augmentation Techniques for Deep Learning Applications. J. Med. Imaging Radiat. Oncol. 2021, 65, 545–563. [Google Scholar] [CrossRef] [PubMed]
  25. Moreira da Silva, D.E.; Gonçalves, L.; Franco-Gonçalo, P.; Colaço, B.; Alves-Pimenta, S.; Ginja, M.; Ferreira, M.; Filipe, V. Active Learning for Data Efficient Semantic Segmentation of Canine Bones in Radiographs. Front. Artif. Intell. 2022, 5, 939967. [Google Scholar] [CrossRef] [PubMed]
  26. Yasaka, K.; Abe, O. Deep Learning and Artificial Intelligence in Radiology: Current Applications and Future Directions. PLoS Med. 2018, 15, e1002707. [Google Scholar] [CrossRef] [PubMed] [Green Version]
  27. Hesamian, M.H.; Jia, W.; He, X.; Kennedy, P. Deep Learning Techniques for Medical Image Segmentation: Achievements and Challenges. J. Digit. Imaging 2019, 32, 582–596. [Google Scholar] [CrossRef] [Green Version]
  28. Zhao, Z.-Q.; Zheng, P.; Xu, S.-T.; Wu, X. Object Detection with Deep Learning: A Review. IEEE Trans. Neural Netw. Learn. Syst. 2019, 30, 3212–3232. [Google Scholar] [CrossRef] [PubMed] [Green Version]
  29. Redmon, J.; Divvala, S.; Girshick, R.; Farhadi, A. You Only Look Once: Unified, Real-Time Object Detection. In Proceedings of the IEEE Conference on Computer Vision and Pattern Recognition, Las Vegas, NV, USA, 27–30 June 2016. [Google Scholar]
  30. Siddique, N.; Paheding, S.; Elkin, C.P.; Devabhaktuni, V. U-Net and Its Variants for Medical Image Segmentation: A Review of Theory and Applications. IEEE Access 2021, 9, 82031–82057. [Google Scholar] [CrossRef]
  31. Akula, S.P.; Akula, P.; Kamati, N. Detection and Classification of Canine Hip Dysplasia According to FCI Grading System Using 3D CNN’s. In Proceedings of the 2022 First International Conference on Artificial Intelligence Trends and Pattern Recognition (ICAITPR), Hyderabad, India, 10–12 March 2022; Volume 109, pp. 1–6. [Google Scholar] [CrossRef]
  32. Anwar, S.M.; Majid, M.; Qayyum, A.; Awais, M.; Alnowami, M.; Khan, M.K. Medical Image Analysis Using Convolutional Neural Networks: A Review. J. Med. Sys. 2018, 42, 226. [Google Scholar] [CrossRef] [PubMed] [Green Version]
  33. Kulkarni, A.; Chong, D.; Batarseh, F.A. Foundations of Data Imbalance and Solutions for a Data Democracy. In Data Democracy: At the Nexus of Artificial Intelligence, Software Development, and Knowledge Engineering; Elsevier: Amsterdam, The Netherlands, 2020; pp. 83–106. [Google Scholar] [CrossRef]
  34. Banzato, T.; Wodzinski, M.; Burti, S.; Osti, V.L.; Rossoni, V.; Atzori, M.; Zotti, A. Automatic Classification of Canine Thoracic Radiographs Using Deep Learning. Sci. Rep. 2021, 11, 3964. [Google Scholar] [CrossRef]
  35. Moreira da Silva, D.E.; Filipe, V.; Franco-Gonçalo, P.; Colaço, B.; Alves-Pimenta, S.; Ginja, M.; Gonçalves, L. Semantic Segmentation of Dog’s Femur and Acetabulum Bones with Deep Transfer Learning in X-Ray Images. In Intelligent Systems Design and Applications, Proceedings of the 21st International Conference on Intelligent Systems Design and Applications (ISDA 2021), 13–15 December 2021; Springer: Cham, Switzerland, 2022; pp. 461–475. [Google Scholar] [CrossRef]
  36. McEvoy, F.J.; Amigo, J.M. Using Machine Learning to Classify Image Features from Canine Pelvic Radiographs: Evaluation of Partial Least Squares Discriminant Analysis and Artificial Neural Network Models. Vet. Radiol. Ultrasound 2013, 54, 122–126. [Google Scholar] [CrossRef] [PubMed]
  37. Yang, G.; Lalande, V.; Chen, L.; Azzabou, N.; Larcher, T.; De Certaines, J.D.; Shu, H.; Coatrieux, J.L. MRI Texture Analysis of GRMD Dogs Using Orthogonal Moments: A Preliminary Study. IRBM 2015, 36, 213–219. [Google Scholar] [CrossRef] [Green Version]
  38. Duda, D.; Azzabou, N.; de Certaines, J.D. Multi-Muscle Texture Analysis for Dystrophy Development Identification in Golden Retriever Muscular Dystrophy Dogs. In Computer Information Systems and Industrial Management, Proceedings of the 17th International Conference, CISIM 2018, Olomouc, Czech Republic, 27–29 September 2018; Lecture Notes in Computer Science (Including Subseries Lecture Notes in Artificial Intelligence and Lecture Notes in Bioinformatics); Springer: Berlin/Heidelberg, Germany, 2018; Volume 11127, pp. 3–15. [Google Scholar] [CrossRef]
  39. Gomes, D.A.; Alves-Pimenta, M.S.; Ginja, M.; Filipe, V. Predicting Canine Hip Dysplasia in X-Ray Images Using Deep Learning. In Optimization, Learning Algorithms and Applications, Proceedings of the First International Conference, OL2A 2021, Bragança, Portugal, 19–21 July 2021; Springer: Cham, Switzerland, 2021; pp. 393–400. [Google Scholar] [CrossRef]
  40. Ergun, G.B.; Guney, S. Classification of Canine Maturity and Bone Fracture Time Based on X-Ray Images of Long Bones. IEEE Access 2021, 9, 109004–109011. [Google Scholar] [CrossRef]
  41. Ye, Y.; Sun, W.W.; Xu, R.X.; Selmic, L.E.; Sun, M. Intraoperative Assessment of Canine Soft Tissue Sarcoma by Deep Learning Enhanced Optical Coherence Tomography. Vet. Comp. Oncol. 2021, 19, 624–631. [Google Scholar] [CrossRef] [PubMed]
  42. Marschner, C.B.; Kokla, M.; Amigo, J.M.; Rozanski, E.A.; Wiinberg, B.; McEvoy, F.J. Texture Analysis of Pulmonary Parenchymateous Changes Related to Pulmonary Thromboembolism in Dogs—A Novel Approach Using Quantitative Methods. BMC Vet. Res. 2017, 13, 219. [Google Scholar] [CrossRef] [PubMed]
  43. Yoon, Y.; Hwang, T.; Lee, H. Prediction of Radiographic Abnormalities by the Use of Bag-of-Features and Convolutional Neural Networks. Vet. J. 2018, 237, 43–48. [Google Scholar] [CrossRef] [PubMed]
  44. Arsomngern, P.; Numcharoenpinij, N.; Piriyataravet, J.; Teerapan, W.; Hinthong, W.; Phunchongharn, P. Computer-Aided Diagnosis for Lung Lesion in Companion Animals from X-Ray Images Using Deep Learning Techniques. In Proceedings of the 2019 IEEE 10th International Conference on Awareness Science and Technology (iCAST), Morioka, Japan, 23–25 October 2019; pp. 1–6. [Google Scholar]
  45. Burti, S.; Longhin Osti, V.; Zotti, A.; Banzato, T. Use of Deep Learning to Detect Cardiomegaly on Thoracic Radiographs in Dogs. Vet. J. 2020, 262, 105505. [Google Scholar] [CrossRef]
  46. Li, S.; Wang, Z.; Visser, L.C.; Wisner, E.R.; Cheng, H. Pilot Study: Application of Artificial Intelligence for Detecting Left Atrial Enlargement on Canine Thoracic Radiographs. Vet. Radiol. Ultrasound 2020, 61, 611–618. [Google Scholar] [CrossRef]
  47. Boissady, E.; de La Comble, A.; Zhu, X.; Hespel, A.M. Artificial Intelligence Evaluating Primary Thoracic Lesions Has an Overall Lower Error Rate Compared to Veterinarians or Veterinarians in Conjunction with the Artificial Intelligence. Vet. Radiol. Ultrasound 2020, 61, 619–627. [Google Scholar] [CrossRef] [PubMed]
  48. Ott, J.; Bruyette, D.; Arbuckle, C.; Balsz, D.; Hecht, S.; Shubitz, L.; Baldi, P. Detecting Pulmonary Coccidioidomycosis with Deep Convolutional Neural Networks. Mach. Learn. Appl. 2021, 5, 100040. [Google Scholar] [CrossRef]
  49. Banzato, T.; Wodzinski, M.; Tauceri, F.; Donà, C.; Scavazza, F.; Müller, H.; Zotti, A. An AI-Based Algorithm for the Automatic Classification of Thoracic Radiographs in Cats. Front. Vet. Sci. 2021, 8, 731936. [Google Scholar] [CrossRef]
  50. Zhang, M.; Zhang, K.; Yu, D.; Xie, Q.; Liu, B.; Chen, D.; Xv, D.; Li, Z.; Liu, C. Computerized Assisted Evaluation System for Canine Cardiomegaly via Key Points Detection with Deep Learning. Prev. Vet. Med. 2021, 193, 105399. [Google Scholar] [CrossRef] [PubMed]
  51. Boissady, E.; De La Comble, A.; Zhu, X.; Abbott, J.; Adrien-Maxence, H. Comparison of a Deep Learning Algorithm vs. Humans for Vertebral Heart Scale Measurements in Cats and Dogs Shows a High Degree of Agreement Among Readers. Front. Vet. Sci. 2021, 8, 764570. [Google Scholar] [CrossRef]
  52. Jeong, Y.; Sung, J. An Automated Deep Learning Method and Novel Cardiac Index to Detect Canine Cardiomegaly from Simple Radiography. Sci. Rep. 2022, 12, 14494. [Google Scholar] [CrossRef] [PubMed]
  53. Dumortier, L.; Guépin, F.; Delignette-Muller, M.L.; Boulocher, C.; Grenier, T. Deep Learning in Veterinary Medicine, an Approach Based on CNN to Detect Pulmonary Abnormalities from Lateral Thoracic Radiographs in Cats. Sci. Rep. 2022, 12, 11418. [Google Scholar] [CrossRef] [PubMed]
  54. Hespel, A.-M.; Boissady, E.; De La Comble, A.; Acierno, M.; Alexander, K.; Mylene, A.; David, B.; de Marie, S.; Jason, F.; Eric, G.; et al. Comparison of Error Rates between Four Pretrained DenseNet Convolutional Neural Network Models and 13 Board-Certified Veterinary Radiologists When Evaluating 15 Labels of Canine Thoracic Radiographs. Vet. Radiol. Ultrasound 2022, 63, 456–468. [Google Scholar] [CrossRef]
  55. Kim, E.; Fischetti, A.J.; Sreetharan, P.; Weltman, J.G.; Fox, P.R. Comparison of Artificial Intelligence to the Veterinary Radiologist’s Diagnosis of Canine Cardiogenic Pulmonary Edema. Vet. Radiol. Ultrasound 2022, 63, 292–297. [Google Scholar] [CrossRef] [PubMed]
  56. Müller, T.R.; Solano, M.; Tsunemi, M.H. Accuracy of Artificial Intelligence Software for the Detection of Confirmed Pleural Effusion in Thoracic Radiographs in Dogs. Vet. Radiol. Ultrasound 2022, 63, 573–579. [Google Scholar] [CrossRef] [PubMed]
  57. Banzato, T.; Bernardini, M.; Cherubini, G.B.; Zotti, A. Texture Analysis of Magnetic Resonance Images to Predict Histologic Grade of Meningiomas in Dogs. Am. J. Vet. Res. 2017, 78, 1156–1162. [Google Scholar] [CrossRef]
  58. Banzato, T.; Cherubini, G.B.; Atzori, M.; Zotti, A. Development of a Deep Convolutional Neural Network to Predict Grading of Canine Meningiomas from Magnetic Resonance Images. Vet. J. 2018, 235, 90–92. [Google Scholar] [CrossRef]
  59. Banzato, T.; Bernardini, M.; Cherubini, G.B.; Zotti, A. A Methodological Approach for Deep Learning to Distinguish between Meningiomas and Gliomas on Canine MR-Images. BMC Vet. Res. 2018, 14, 317. [Google Scholar] [CrossRef] [Green Version]
  60. Spiteri, M.; Knowler, S.P.; Rusbridge, C.; Wells, K. Using Machine Learning to Understand Neuromorphological Change and Image-Based Biomarker Identification in Cavalier King Charles Spaniels with Chiari-like Malformation-Associated Pain and Syringomyelia. J. Vet. Int. Med. 2019, 33, 2665–2674. [Google Scholar] [CrossRef]
  61. Biercher, A.; Meller, S.; Wendt, J.; Caspari, N.; Schmidt-Mosig, J.; De Decker, S.; Volk, H.A. Using Deep Learning to Detect Spinal Cord Diseases on Thoracolumbar Magnetic Resonance Images of Dogs. Front. Vet. Sci. 2021, 8, 721167. [Google Scholar] [CrossRef] [PubMed]
  62. Wanamaker, M.W.; Vernau, K.M.; Taylor, S.L.; Cissell, D.D.; Abdelhafez, Y.G.; Zwingenberger, A.L. Classification of Neoplastic and Inflammatory Brain Disease Using MRI Texture Analysis in 119 Dogs. Vet. Radiol. Ultrasound 2021, 62, 445–454. [Google Scholar] [CrossRef] [PubMed]
  63. Banzato, T.; Bonsembiante, F.; Aresu, L.; Gelain, M.E.; Burti, S.; Zotti, A. Use of Transfer Learning to Detect Diffuse Degenerative Hepatic Diseases from Ultrasound Images in Dogs: A Methodological Study. Vet. J. 2018, 233, 35–40. [Google Scholar] [CrossRef] [PubMed]
  64. Shaker, R.; Wilke, C.; Ober, C.; Lawrence, J. Machine Learning Model Development for Quantitative Analysis of CT Heterogeneity in Canine Hepatic Masses May Predict Histologic Malignancy. Vet. Radiol. Ultrasound 2021, 62, 711–719. [Google Scholar] [CrossRef] [PubMed]
Figure 1. Architecture of an artificial neural network, in which the pixels of a digital image of a dog serve as input. There are four hidden layers and two possible outputs, “dog” or “not dog”. The nodes are arranged in layers and joined by connections. The weights are represented by the letter W (W1, W2, and Wi in the figure).
Vetsci 10 00320 g001
Figure 2. A convolutional operation, where a kernel is applied to a 3 × 3 set of neighboring pixels. A feature map is obtained by calculating the following expression: 1 × 0 + 0 × (-1) + 1 × 0 + 0 × (-1) + 1 × 5 + 1 × (-1) + 1 × 0 + 0 × (-1) + 1 × 0 = 4. *, represents the multiplication between the kernel and the image patch.
Vetsci 10 00320 g002
Figure 3. Representation of the architecture of a convolutional neural network. The input passes through a series of convolutional and pooling operations, then through a fully connected layer to determine the output.
Vetsci 10 00320 g003
Figure 4. The transfer learning process, where part of the weights of a convolutional neural network trained to evaluate non-medical images, is used in a convolutional neural network to classify radiographs.
Vetsci 10 00320 g004
Figure 5. A confusion matrix, which facilitates the visualization of the model’s performance.
Vetsci 10 00320 g005
Table 1. Machine learning in veterinary imaging diagnosis.
Body RegionML TypeImage DatasetObjectiveDiagnostic ImagingReference
MusculoskeletalPartial least squares discriminant analysis
and an ANN
256 images: 200 for training and 56 for testing Identification of the hip regionX-ray[36]
Principal component analysis and support vector machine1993 images: 936 from diseased dogs and 1057 from healthy dogsIdentification of Golden Retriever Muscular DystrophyMRI[37]
Support vector machine, Adaptive boosting, and Monte Carlo feature selection38 images: 5 from diseased and 5 from healthy dogsClassification of Golden Retriever Muscular Dystrophy MRI[38]
YOLO network (YOLO v3 Tiny ConvNet)1835 images: 1686 for training and 149 for testing to the identification of the hip regionIdentification of the hip region and hip dysplasia classification as normal or dysplasticX-ray[11]
CNN (Inception-V3)225 images: 165 images for training and 60 for testingHip dysplasia classification as normal or dysplasticX-ray[39]
CNN (AlexNet, GoogLeNet, and ResNet-50) and multi-class support vector machine1000 images to evaluate the dog’s maturity, 410 images for fracture dating, and 2027 for fracture detectionDetermination of the dog’s maturity, fractures’ dating, and fractures’ detection in long bonesX-ray[40]
CNN (ResNet-50)200 images: 80 of tissue with cancerous margins and 80 of normal tissue for training; 20 of tissue with cancerous margins and 20 of normal tissue for validationClassification of surgical tissue margins as healthy or cancerousSDOCT[41]
3D CNNs1400 images: 800 for training, 400 for validation, and 200 for testing Hip dysplasia classification as normal or dysplasticX-ray
MRI
[31]
U-Net and Feature Pyramid Network (FPN)138 images normal and dysplastic: 70% for training, 15% for validation, and 15% for testingSegmentation of the dog’s femur and acetabulum bonesX-ray[35]
U-Net202 images: 70% for training, 15% for validation, and 15% for testingActive learning in the segmentation of the dog’s femur and acetabulum bonesX-ray[25]
ThoraxPrincipal component analysis, partial least square discriminant analysis, and support vectors machines35 images: 29 images from diseased dogs and 6 images from healthy dogsDiagnosis of pulmonary thromboembolism in dogsCT[42]
Bag of features
and a CNN
3142 images for cardiomegaly (1571 normal and 1571 abnormal); 2086 images for pulmonary patterns (1043 normal and 1043 abnormal); 892 images for mediastinal shift (446 normal and 446 abnormal); 940 images for pleural effusion (470 normal and 470 abnormal); and 78 images for pneumothorax (39 normal and 39 abnormal)Identification of cardiomegaly, pneumothorax, pleural effusion, pulmonary patterns, and mediastinal shifts X-ray[43]
CNN (DenseNet-121)2862 images: 80% for training and 20% for validationPulmonary lesions identificationX-ray[44]
CNN (Inception V3, Inception-ResNet V2, VGG-19, and ResNet-101)1468 images: 1153 images for training and 315 images for testingDetection of cardiomegaly in thoracic radiographsX-ray[45]
CNN (Visual Geometry Group 16 network)792 images: 711 images for training and 81 for testingDetection of left atrial enlargementX-ray[46]
CNN (DenseNet-“PicoxIA”—a commercial program)15780 images: 90% for training and 10% for validationIdentification of 15 types of primary thoracic lesionsX-ray[47]
CNN (Inception, MobileNet, ResNet, VGG, and a four-layer network)1174 images (65% from healthy dogs and 35% from diseased dogs) and training and test sets sorted using ten-fold cross-validationDetection of pulmonary coccidioidomycosisX-ray[48]
CNN (ResNet-50 and DenseNet-121)3839 images randomly divided into training, validation, and test sets in the ratio of 8:1:1Classification of dog’s thoracic radiographs as unremarkable, cardiomegaly, alveolar, bronchial, and interstitial patterns, presence of masses, pleural effusion, pneumothorax, and megaesophagusX-ray[34]
CNN (ResNet-50 and Inception V3)1062 images randomly divided into training, validation, and test sets in the ratio of 8:1:1Classification of cat’s thoracic radiographsX-ray[49]
CNN (HRNet)2643 images: 1875 for training, 399 for validation, and 369 for testingDetermination of the vertebral heart score to identify cardiomegalyX-ray[50]
CNN (DenseNet-121-“PicoxIA”—a commercial program)60 images: 30 canine and 30 felineCalculation of the vertebral heart score to identify cardiomegalyX-ray[51]
U-Net (Improved Attention U-Net)1000 images: 800 for training, 100 for validation, and 100 for testingNew automated cardiac index to improve the vertebral heart score and identify cardiomegalyX-ray[52]
CNN (ResNet-50 v2)500 images: 455 for training and validation and 45 for testingPulmonary patterns identification in catsX-ray[53]
CNN (DenseNet-121-“PicoxIA”—a commercial program)55780 images: 90% for training and 10% for testingClassification of thoracic radiographs with 15 possible labelsX-ray[54]
CNN (“Vetology”—a commercial program)481 imagesAccuracy determination of the “Vetology” for cardiogenic pulmonary edema diagnosisX-ray[55]
CNN (“Vetology”—a commercial program with VGG-16 CNN architecture)4000 images: 2000 of pleural effusion and 2000 of normal patients for trainingAccuracy determination of the “Vetology” for pleural effusion diagnosisX-ray[56]
Nervous systemLinear discriminant analysis58 sets of MRI scans of dogs with meningioma, 27 for training and 31 for testingPrediction of the histological grade in dog’s meningiomasMRI[57]
CNN (AlexNet and scrDNN)56 images: 60% for training, 10% for validation, and 30% for testingPrediction of the histological grade in dog’s meningiomasMRI[58]
CNN (GoogleNet)80 images: 70% for training, 15% for validation, and 15% for testingDistinction between canine glioma and meningiomaMRI[59]
Sequential floating forward selection, support vector machine32 images: 10 normal, 11 with the malformation and clinical signs, and 11 with clinical signs without malformationIdentification of Cavalier King Charles dogs with Chiari-like malformation-associated pain and syringomyeliaMRI[60]
CNN500 images: 375 images for training and 125 images for testingIdentification of thoracolumbar spinal cord pathologies in dogsMRI[61]
Random Forest classifier119 images: 80 images for training and 39 images for testing Differentiation and identification of glial tumor cells and non-infectious inflammatory meningoencephalitisMRI[62]
AbdomenCNN (AlexNet)48 images: 70% for training, 15% for validation, and 15% for testingDetection of diffuse degenerative hepatic diseasesUS[63]
Quadratic discriminant analysis40 imagesDetecting canine hepatic masses and predicting malignancyCT[64]
ANN, artificial neural network; CNN, convolutional neural networks; CT, computed tomography; ML, machine learning; MRI, magnetic resonance imaging; SDOCT, spectral domain optical coherence tomography; US, ultrasound.
Disclaimer/Publisher’s Note: The statements, opinions and data contained in all publications are solely those of the individual author(s) and contributor(s) and not of MDPI and/or the editor(s). MDPI and/or the editor(s) disclaim responsibility for any injury to people or property resulting from any ideas, methods, instructions or products referred to in the content.

