
A Sustainable Approach Based on the Use of Unripe Grape Frozen Musts to Modulate Wine Characteristics as a Proof of Concept
 , , and
Abstract
:
1. Introduction
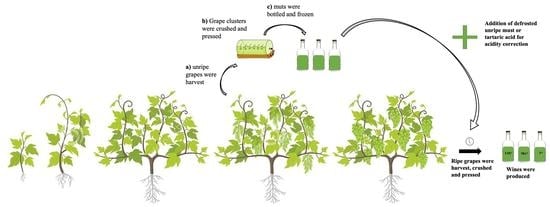
2. Materials and Methods
2.1. Chemical Reagents and Standards
2.2. Fermentation Protocols
2.3. Analysis of Volatile Compounds
2.4. Analysis of Amino Acids
2.5. Statistical Analysis
3. Results
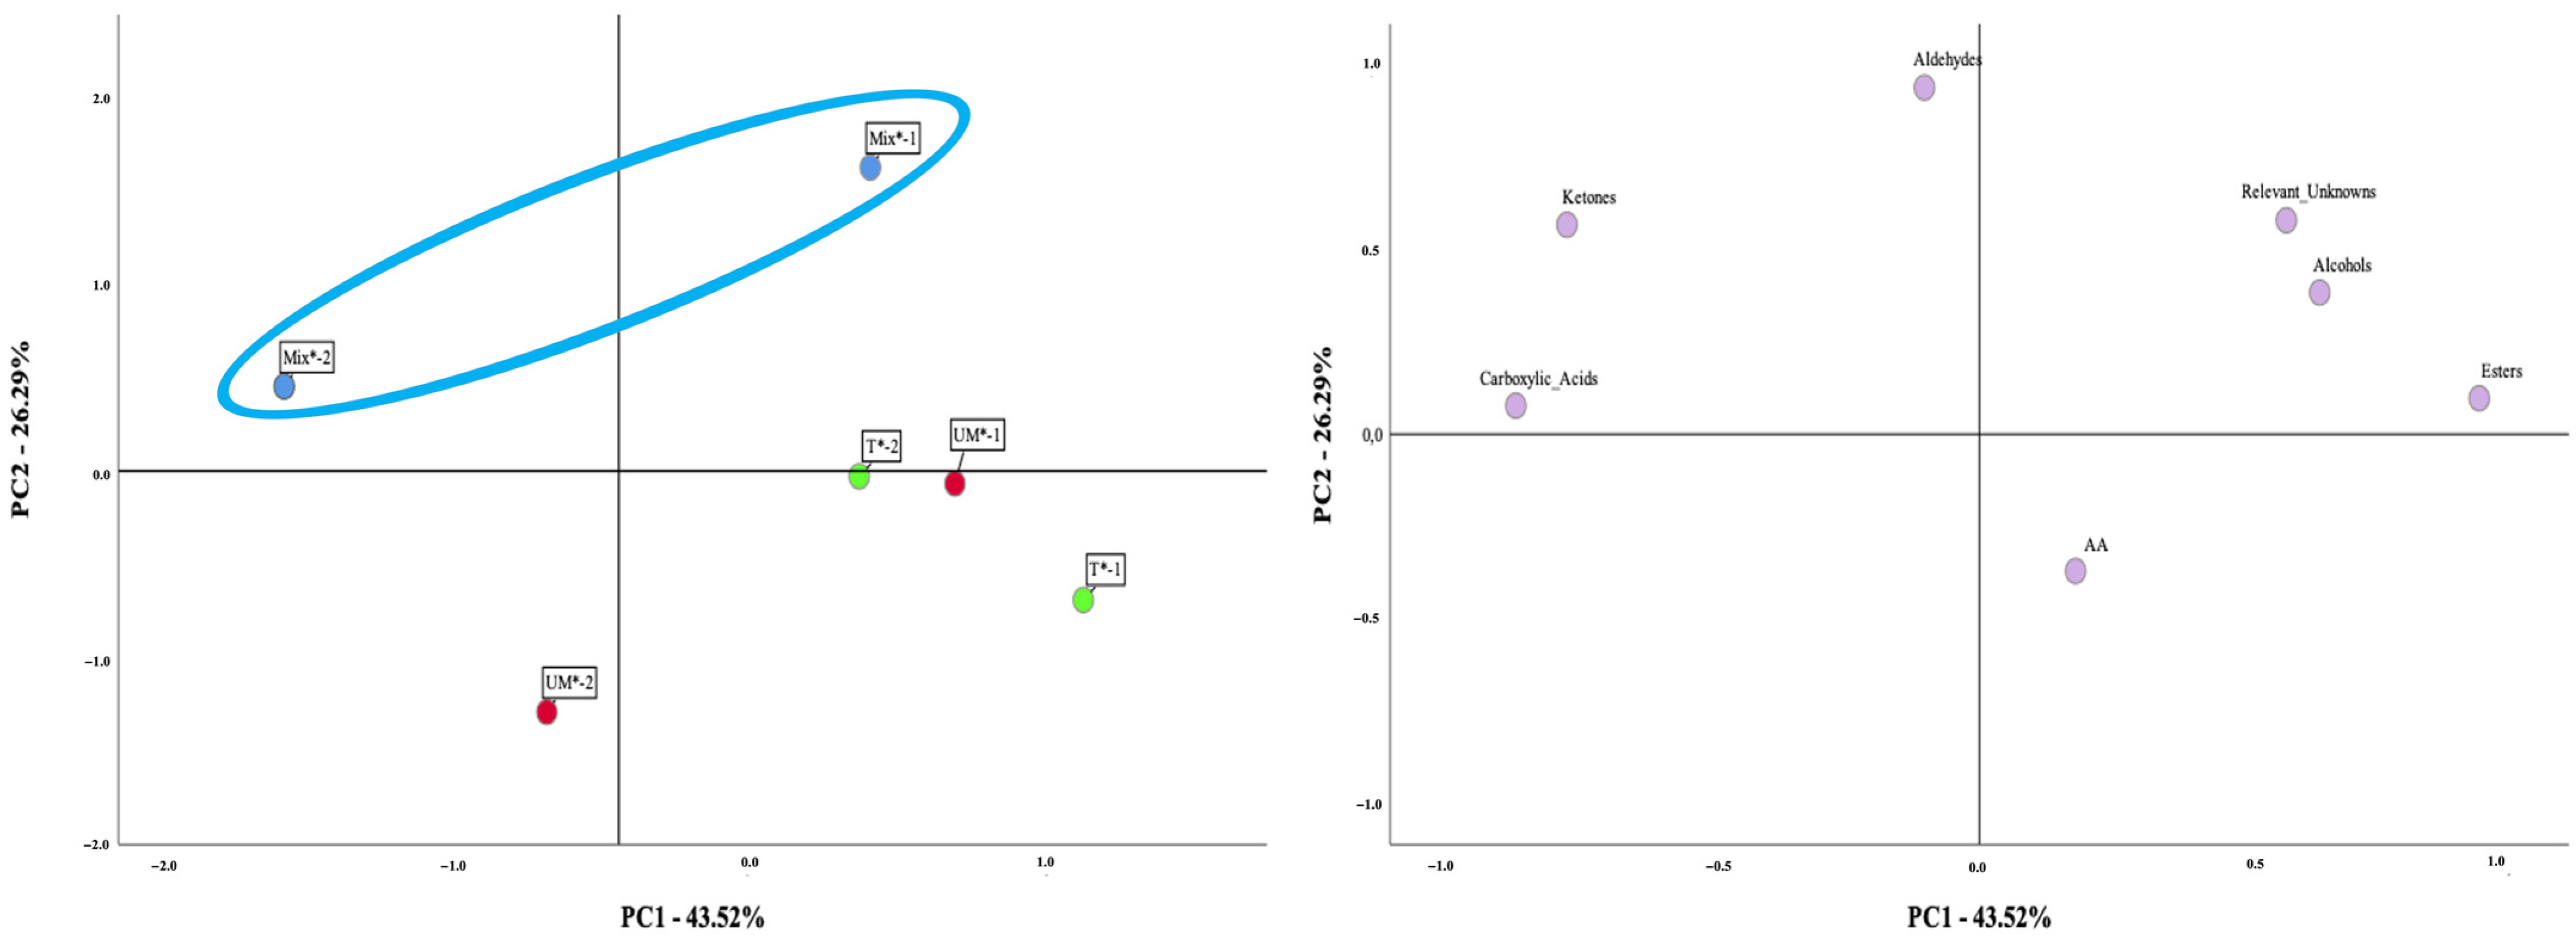
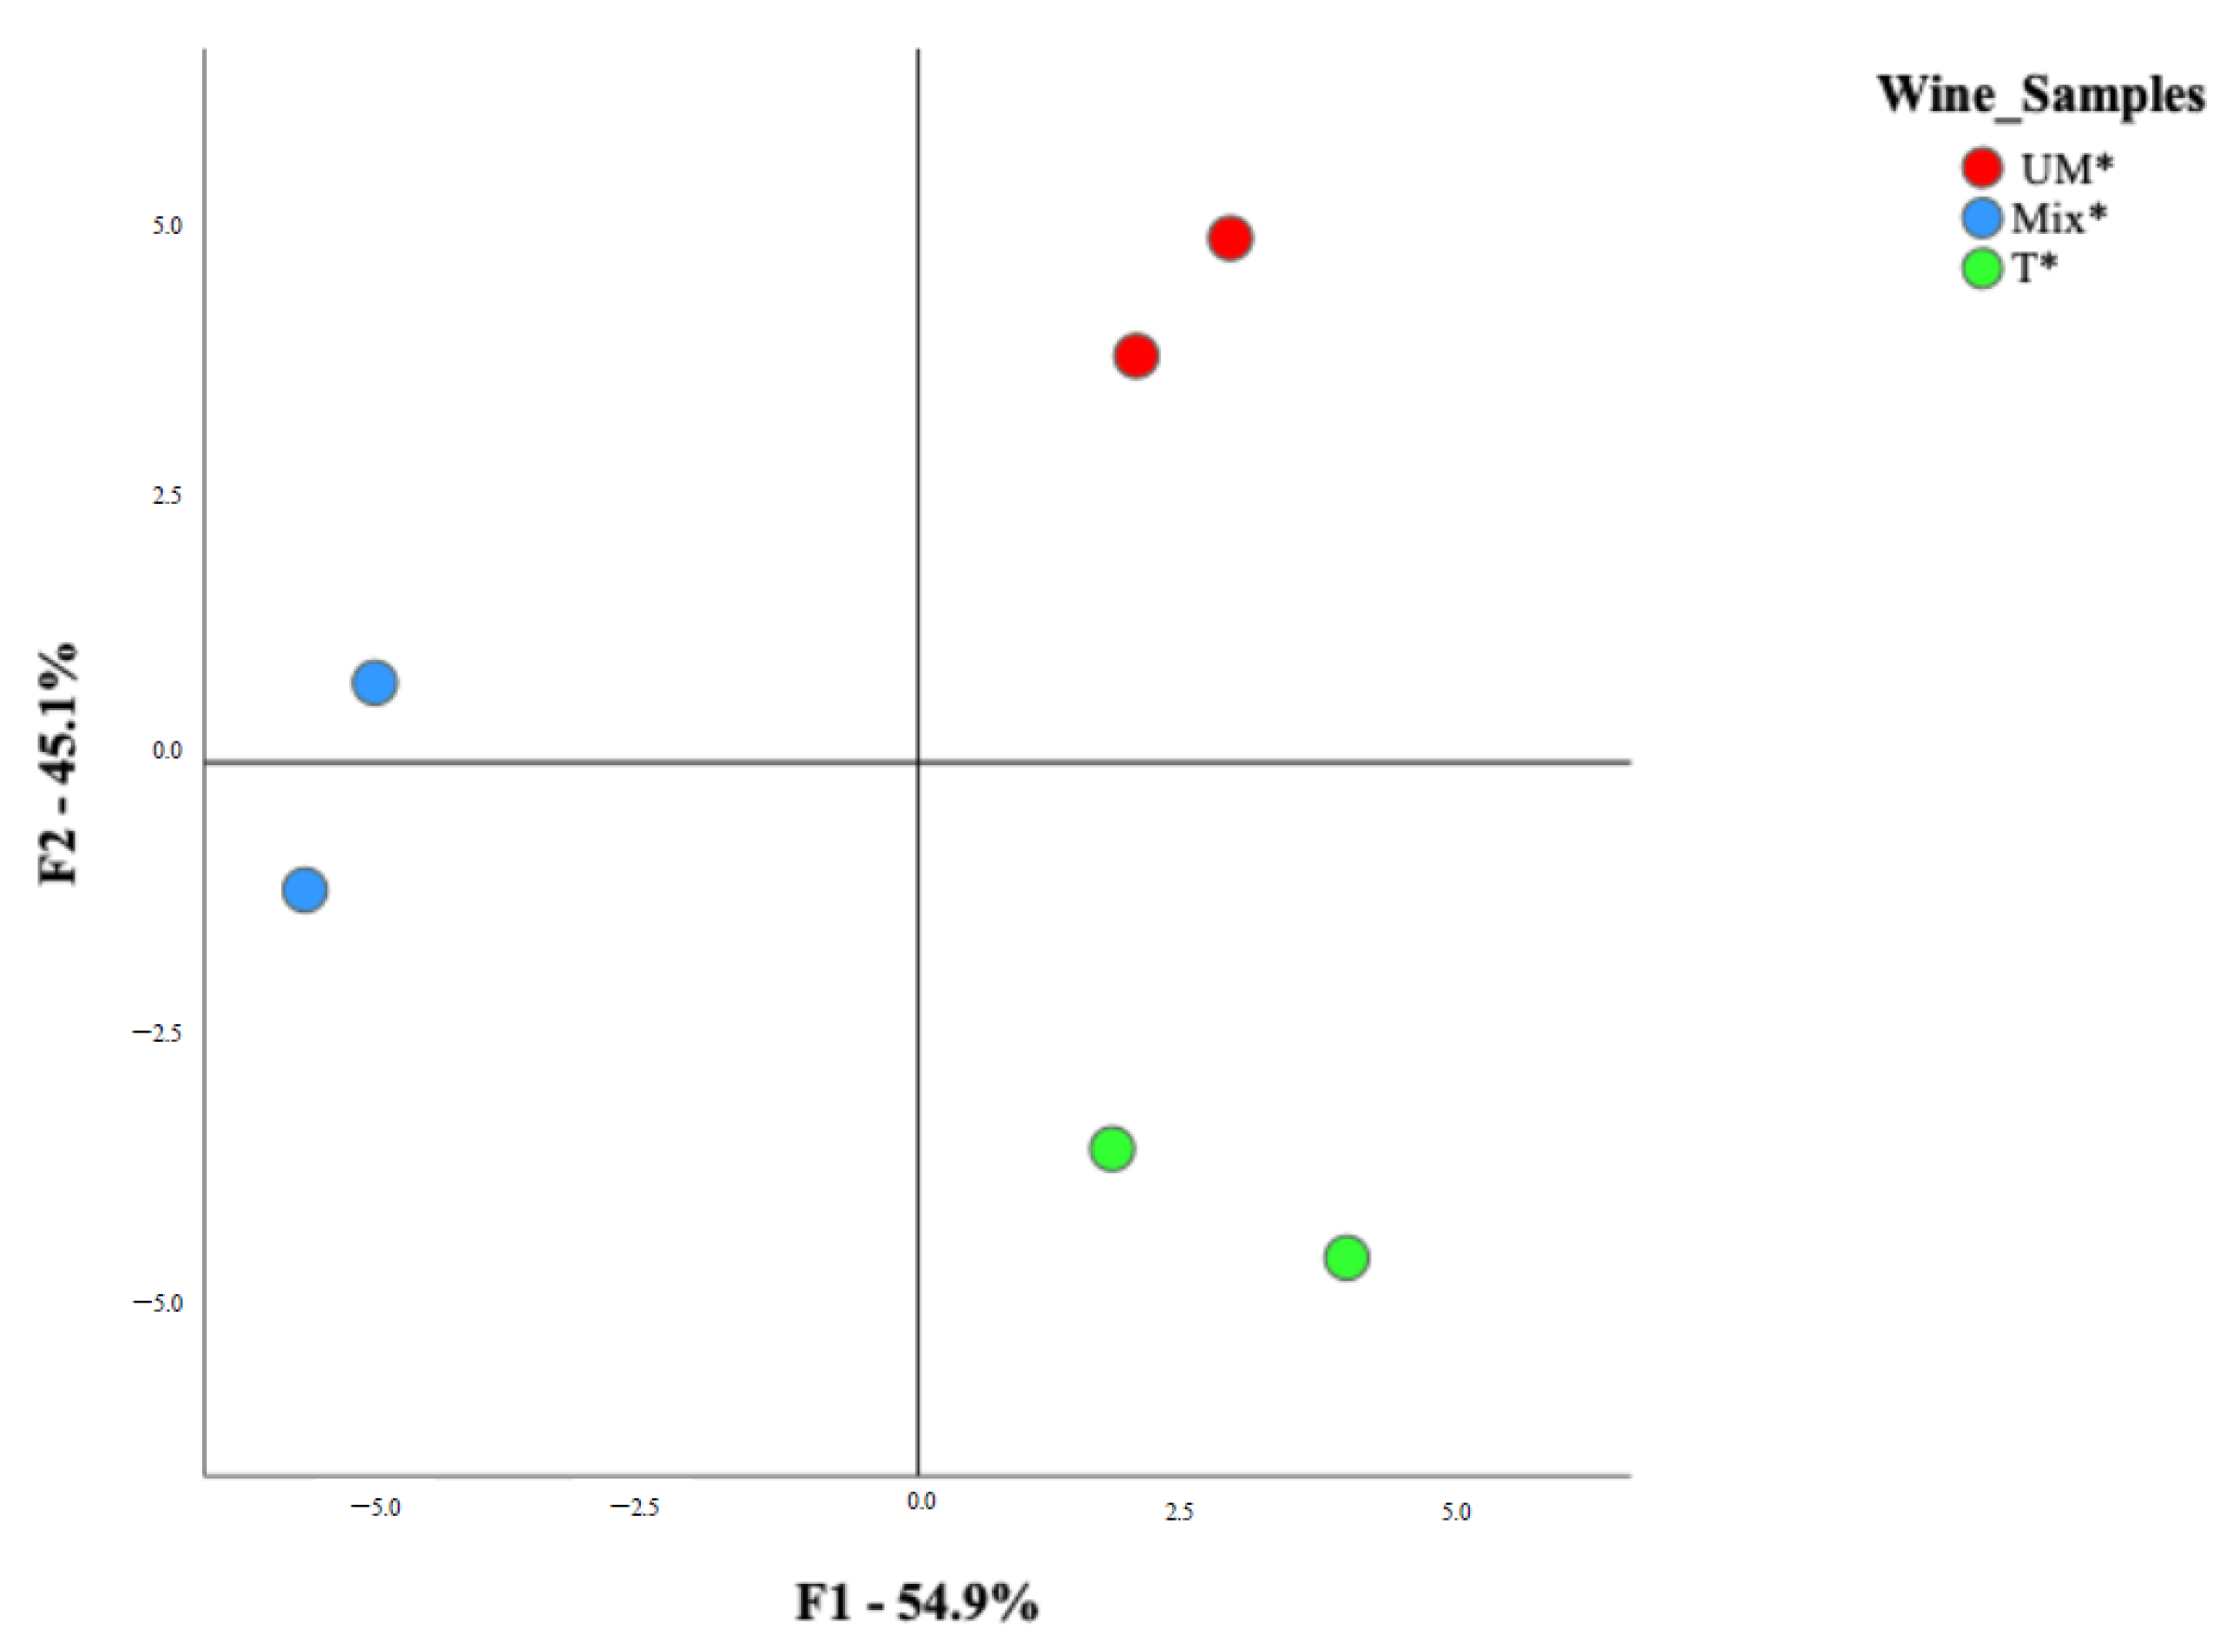
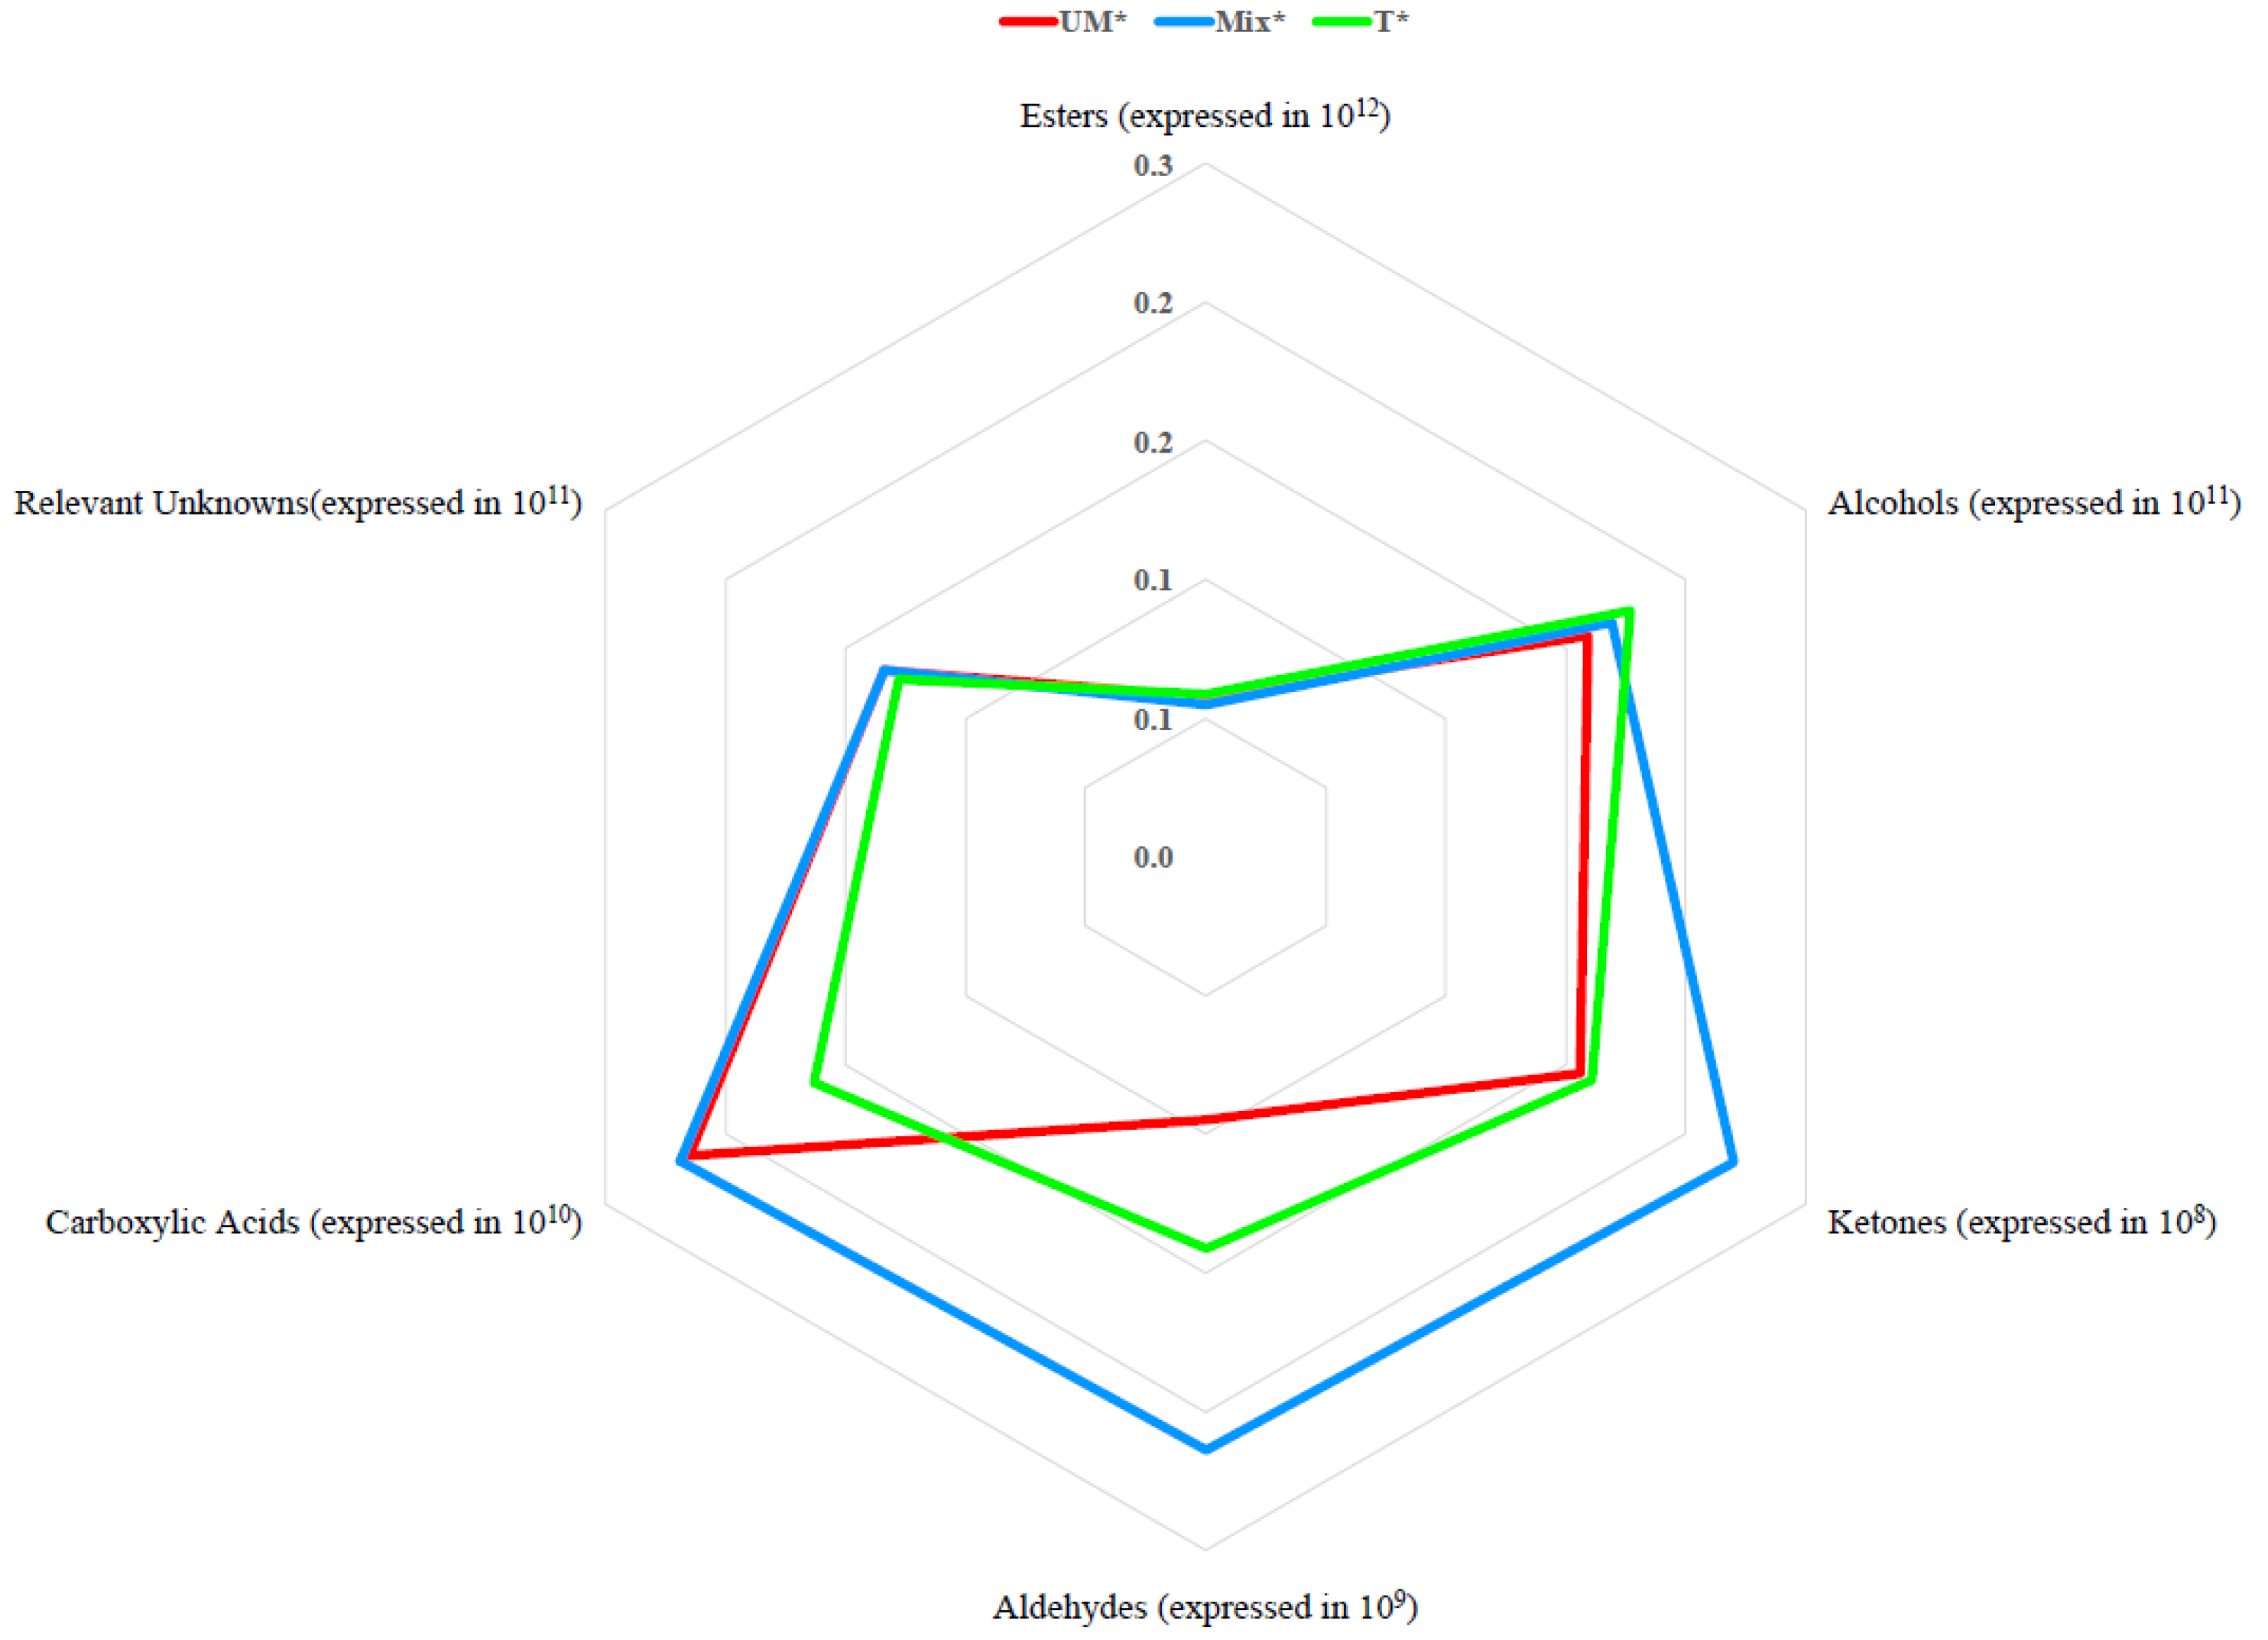
3.1. Oenological Analysis
3.2. Amino Acid, VOCs and Aroma Profile of Antão Vaz White Wines
4. Discussion
5. Conclusions
Author Contributions
Funding
Data Availability Statement
Acknowledgments
Conflicts of Interest
References
- Costa, C.; Graça, A.; Fontes, N.; Teixeira, M.; Gerós, H.; Santos, J.A. The Interplay between Atmospheric Conditions and Grape Berry Quality Parameters in Portugal. Appl. Sci. 2020, 10, 4943. [Google Scholar] [CrossRef]
- Palliotti, A.; Tombesi, S.; Silvestroni, O.; Lanari, V.; Gattic, M.; Ponic, S. Changes in vineyard establishment and canopy management urged by earlier climate-related grape ripening: A review. Sci. Hortic. 2014, 178, 43–54. [Google Scholar] [CrossRef]
- Bigard, A.; Romieu, C.; Sire, Y.; Torregrosa, L. Vitis vinífera L. Diversity for Cations and Acidity Is Suitable for Breeding Fruits Coping with Climate Warming. Front. Plant Sci. 2020, 11, 01175. [Google Scholar] [CrossRef] [PubMed]
- Piccardo, D.; González-Neves, G.; Favre, G.; Pascual, O.; Canals, J.M.; Zamora, F. Impact of Must Replacement and Hot Pre-Fermentative Maceration on the Color of Uruguayan Tannat Red Wines. Fermentation 2019, 5, 80. [Google Scholar] [CrossRef] [Green Version]
- Bonfante, A.; Monaco, E.; Langella, G.; Mercogliano, P.; Bucchignani, E.; Manna, P.; Terribile, F. A dynamic viticultural zoning to explore the resilience of terroir concept under climate change. Sci. Total Environ. 2018, 624, 294–308. [Google Scholar] [CrossRef] [PubMed]
- OIV International Organization of Vine and Wine. International Code of Enological Practices. 2022. Available online: https://www.oiv.int/public/medias/8630/code-2022-en.pdf (accessed on 6 January 2022).
- Morata, A.; Loira, I.; Manuel del Fresno, J.; Escott, C.; Bañuelos, M.A.; Tesfaye, W.; González, C.; Palomero, F.; Lepe, J.A.S. Strategies to Improve the Freshness in Wines from Warm Areas. Adv. Grape Wine Biotechnol. 2019, 9, 151–164. [Google Scholar]
- Fernandes, L.; Relva, A.M.; Gomes da Silva, M.D.R.; Costa Freitas, A.M. Different multidimensional chromatographic approaches applied to the study of wine malolactic fermentation. J. Chromatogr. A 2003, 995, 161–169. [Google Scholar] [CrossRef]
- Torres, M.P.; Cabrita, M.J.; Gomes da Silva, M.D.R.; Palma, V.; Costa Freitas, A.M. The Impact of the Malolactic Fermentation in the Volatile Composition of Trincadeira Wine Variety. J. Food Biochem. 2011, 35, 898–913. [Google Scholar] [CrossRef]
- Cabrita, M.J.; Aires de Sousa, J.M.; Gomes da Silva, M.D.R.; Rei, F.; Costa Freitas, A.M. Multivariate statistical approaches for wine classification based on low molecular weight phenolic compounds. Aust. J. Grape Wine Res. 2012, 18, 138–146. [Google Scholar] [CrossRef]
- Fahey, D.; Scollary, G. Managing Acidity in Grapevines and Wines; NSG Government—Department of Primary Industries: Orange, Australia, 2020. [Google Scholar]
- Tinello, F.; Lante, A. Evaluation of anti-browning and antioxidant activities in unripe grapes recovered during bunch thinning. Aust. J. Grape Wine Res. 2016, 23, 33–41. [Google Scholar] [CrossRef]
- Tinello, F.; Mihaylova, D.; Lante, A. Effect of Dipping Pre-treatment with Unripe Grape Juice on Dried “Golden Delicious” Apple Slices. Food Bioprocess Technol. 2018, 11, 2275–2285. [Google Scholar] [CrossRef]
- Dupas de Matos, A.; Magli, M.; Marangon, M.; Curioni, A.; Pasini, G.; Vincenzi, S. Use of verjuice as an acidic salad seasoning ingredient: Evaluation by consumers’ liking and Check-All-That-Apply. Eur. Food Res. Technol. 2018, 244, 2117–2125. [Google Scholar] [CrossRef]
- Longo, R.; Blackman, J.W.; Antalick, G.; Torley, P.J.; Rogiers, S.Y.; Schmidtke, L.M. Harvesting and blending options for lower alcohol wines: A sensory and chemical investigation. J. Sci. Food Agric. 2017, 98, 33–42. [Google Scholar] [CrossRef] [PubMed]
- Longo, R.; Blackman, J.W.; Antalick, G.; Torley, P.J.; Rogiers, S.Y.; Schmidtke, L.M. A comparative study of partial dealcoholisation versus early harvest: Effects on wine volatile and sensory profiles. Food Chem. 2018, 261, 21–29. [Google Scholar] [CrossRef] [PubMed]
- Longo, R.; Blackman, J.W.; Antalick, G.; Torley, P.J.; Rogiers, S.Y.; Schmidtke, L.M. Volatile and sensory profiling of Shiraz wine in response to alcohol management: Comparison of harvest timing versus technological approaches. Food Res. Int. 2018, 109, 561–571. [Google Scholar] [CrossRef]
- Fanzone, M.L.; Sari, S.E.; Mestre, M.V.; Catania, A.A.; Catelén, M.J.; Jofré, V.P.; González-Miret, M.L.; Combina, M.; Vazquez, F.; Maturano, I.P. Combination of pre-fermentative and fermentative strategies to produce Malbec wines of lower alcohol and pH, with high chemical and sensory quality. OENO One 2020, 54, 4. [Google Scholar] [CrossRef]
- Schelezki, O.J.; Smith, P.A.; Hranilovic, A.; Bindon, K.A.; Jeffery, D.W. Comparison of consecutive harvests versus blending treatments to produce lower alcohol wines from Cabernet Sauvignon grapes: Impact on polysaccharide and tannin content and composition. Food Chem. 2018, 244, 50–59. [Google Scholar] [CrossRef]
- Schelezki, O.J.; Šuklje, K.; Boss, P.K.; Jeffery, D.W. Comparison of consecutive harvests versus blending treatments to produce lower alcohol wines from Cabernet Sauvignon grapes: Impact on wine volatile composition and sensory properties. Food Chem. 2018, 259, 196–206. [Google Scholar] [CrossRef]
- Kontoudakis, N.; Esteruelas, M.; Fort, F.; Canals, J.M.; Zamora, F. Use of unripe grapes harvested during cluster thinning as a method for reducing alcohol content and pH of wine. Aust. J. Grape Wine Res. 2011, 17, 230–238. [Google Scholar] [CrossRef]
- Teslic, N.; Patrignani, F.; Ghidotti, M.; Parpinello, G.P.; Ricci, A.; Tofalo, R.; Lanciotti, R.; Versari, A. Utilization of ‘early green harvest’ and non-Saccharomyces cerevisiae yeasts as a combined approach to face climate change in winemaking. Eur. Food Res. Technol. 2018, 244, 1301–1311. [Google Scholar] [CrossRef]
- Lemos Junior, W.J.F.; Nadai, C.; Crepalde, L.T.; De Oliveira, V.S.; Dupas de Matos, A.; Giacomini, A.; Corich, V. Potential use of Starmerella bacillaris as fermentation starter for the production of low-alcohol beverages obtained from unripe grapes. Int. J. Food Microbiol. 2019, 303, 1–8. [Google Scholar] [CrossRef] [PubMed]
- Fia, G.; Gori, C.; Bucalossi, G.; Borghini, F.; Zanoni, B. A naturally occurring antioxidant complex from unripe grapes: The case of Sangiovese (v. Vitis vinifera). Antioxidants 2018, 7, 27. [Google Scholar] [CrossRef] [PubMed] [Green Version]
- Fia, G.; Bucalossi, G.; Proserpio, C.; Vicenzi, S. Unripe grapes: An overview of the composition, traditional and innovative applications, and extraction methods of a promising waste of viticulture. Aust. J. Grape Wine Res. 2022, 28, 8–26. [Google Scholar] [CrossRef]
- OIV International Organization of Vine and Wine. Statistical Report on World Vitiviniculture. 2019. Available online: http://www.oiv.int/public/medias/6782/oiv-2019-statistical-report-on-world-vitiviniculture.pdf (accessed on 25 March 2021).
- Martins, N.; Garcia, R.; Mendes, D.; Costa Freitas, A.M.; Gomes da Silva, M.; Cabrita, M.J. An ancient winemaking technology: Exploring the volatile composition of amphora wines. LWT 2018, 96, 288–295. [Google Scholar] [CrossRef]
- Pereira, C.; Mendes, D.; Dias, T.; Garcia, R.; Gomes da Silva, M.; Cabrita, M.J. Revealing the yeast modulation potential on amino acid composition and volatile profile of Arinto white wines by a combined chromatographic-based approach. J. Chromatogr. A 2021, 1641, 461991. [Google Scholar] [CrossRef]
- Santos, C.V.A.; Gomes da Silva, M.; Cabrita, M.J. Impact of SO2 and bentonite addition during fermentation on volatile profile of two varietal white wines. LWT 2020, 133, 109893. [Google Scholar] [CrossRef]
- Gómez-Alonso, S.; Hermosín-Gutiérrez, I.; García-Romero, E. Simultaneous HPLC Analysis of Biogenic Amines, Amino Acids, and Ammonium Ion as Aminoenone Derivatives in Wine and Beer Samples. J. Agric. Food Chem. 2007, 55, 608–613. [Google Scholar] [CrossRef]
- Stanimirova, I.; Daszykowski, M.; Walczak, B. Robust Methods in Analysis of Multivariate Food Chemistry Data. Data Handl. Sci. Technol. 2013, 28, 315–340. [Google Scholar]
- Canonico, L.; Solomon, M.; Comitini, F.; Ciani, M.; Varela, C. Volatile profile of reduced alcohol wines fermented with selected non-Saccharomyces yeasts under different aeration conditions. Food Microbiol. 2019, 84, 103247. [Google Scholar] [CrossRef]
- Sun, X.; Dang, G.; Ding, X.; Shen, C.; Liu, G.; Zuo, C.; Chen, X.; Xing, W.; Jin, W. Production of alcohol-free wine and grape spirit by pervaporation membrane technology. Food Bioprod. Process 2020, 123, 262–273. [Google Scholar] [CrossRef]
- Bucher, T.; Deroover, K.; Stockley, C. Low-Alcohol Wine: A Narrative Review on Consumer Perception and Behaviour. Beverages 2018, 4, 82. [Google Scholar] [CrossRef] [Green Version]
- Varela, C.; Dry, P.R.; Kutyna, D.R.; Francis, I.L.; Henschke, P.A.; Curtin, C.D.; Chambers, P.J. Strategies for reducing alcohol concentration in wine. Aust. J. Grape Wine Res. 2015, 21, 670–679. [Google Scholar] [CrossRef]
- Martínez-Pérez, M.P.; Bautista-Ortín, A.B.; Pérez-Porras, P.; Jurado, R.; Gómez-Plaza, E. A New Approach to the Reduction of Alcohol Content in Red Wines: The Use of High-Power Ultrasounds. Foods 2020, 9, 726. [Google Scholar] [CrossRef] [PubMed]
- Gutiérrez-Gamboa, G.; Garde-Cerdán, T.; Moreno-Simunovic, Y.; Pérez-Álvarez, E.P. 10—Amino Acid Composition of Grape Juice and Wine: Principal Factors That Determine Its Content and Contribution to the Human Diet. Nutr. Beverages 2019, 12, 369–391. [Google Scholar]
- Mirás-Avalos, J.M.; Bouzas-Cid, Y.; Trigo-Córdoba, E.; Orriols, I.; Falqué, E. Amino Acid Profiles to Differentiate White Wines from Three Autochtonous Galician Varieties. Foods 2020, 9, 114. [Google Scholar] [CrossRef] [Green Version]
- Gutiérrez-Gamboa, G.; Garde-Cerdán, T.; Rubio-Bréton, P.; Pérez-Álvarez, E.P. Study of must and wine amino acids composition after seaweed applications to Tempranillo blanco grapevines. Food Chem. 2020, 308, 125605. [Google Scholar] [CrossRef]
- Xiau-Feng, Y.; Yan-Iun, J.; Zi-Zhu, T.; Ya-Meng, Z.; Xu-Liang, J.; Zhen-Wen, Z. Effects of the severity and timing of basal leaf removel on the amino acids profiles of Sauvignon Blanc grapes and wines. J. Integr. Agric. 2019, 18, 2052–2062. [Google Scholar]
- Patrignani, F.; Siesto, G.; Gottardi, D.; Vigentini, I.; Toffanin, A.; Englezos, V.; Bevilacqua, A.; Blaiotta, G.; Grieco, F.; Lanciotti, R.; et al. Impact of Two Commercial S. cerevisiae Strains on the Aroma Profiles of Different Regional Musts. Beverages 2022, 8, 59. [Google Scholar] [CrossRef]
- Naranjo, A.; Martínez-Lapuente, L.; Ayestarán, B.; Guadalupe, Z.; Pérez, I.; Canals, C.; Adell, E. Aromatic and Sensory Characterization of Maturana Blanca Wines Made with Different Technologies. Beverages 2021, 7, 10. [Google Scholar] [CrossRef]
- The Pherobase, Database of Pheromones and Semiochemicals, Kovats Index Calculator. 2020. Available online: https://www.pherobase.com (accessed on 10 May 2021).
- Cabrita, M.J.; Costa Freitas, A.M.; Laureano, O.; Borsac, D.; Di Stefano, R. Aroma compounds in varietal wines from Alentejo, Portugal. J. Food Compos. Anal. 2007, 20, 375–390. [Google Scholar] [CrossRef]
- Barbará, J.A.; Nicolli, K.P.; Souza-Silva, É.A.; Biasoto, A.C.T.; Welke, J.E.; Zini, C.A. Volatile profile and aroma potential of tropical Syrah wines elaborated in different maturation and maceration times using comprehensive two-dimensional gas chromatography and olfactometry. Food Chem. 2020, 308, 125552. [Google Scholar] [CrossRef]
- Li, H.; Tao, Y.-S.; Wang, H.; Zhang, L. Impact odorants of Chardonnay dry white wine from Changli County (China). Eur. Food Res. Technol. 2008, 227, 287–292. [Google Scholar] [CrossRef]
- Lang, T.A.; Walker, M.E.; Boss, P.K.; Jiranek, V. Effect of ‘loss of function’ mutation in SER1 in wine yeast: Fermentation outcomes in co-inoculation with non-Saccharomyces. OENO One 2022, 56, 47–61. [Google Scholar] [CrossRef]
- Kong, C.L.; Li, A.H.; Su, J.; Wang, X.C.; Chen, C.Q.; Tao, Y.S. Flavor modification of dry red wine from Chinese spine grape by mixed fermentation with LWT 133 (2020) 109893 Pichia fermentans and S. cerevisiae. LWT 2019, 109, 83–92. [Google Scholar] [CrossRef]
- Ferreira, V.; De-la-Fuente-Blanco, A.; Sáenz-Navajas, M.-P. A New Classification of Perceptual Interactions between Odorants to Interpret Complex Aroma Systems. Application to Model Wine Aroma. Foods 2021, 10, 1627. [Google Scholar] [CrossRef] [PubMed]
- Welke, J.E.; Zanus, M.; Lazzarotto, M.; Zini, C.A. Quantitative analysis of headspace volatile compounds using comprehensive two-dimensional gas chromatography and their contribution to the aroma of Chardonnay wine. Food Res. Int. 2014, 59, 85–99. [Google Scholar] [CrossRef] [Green Version]
- Whitener, M.E.B.; Stanstrup, J.; Panzeri, V.; Carlin, S.; Divol, B.; Du Toit, M.; Vrhovsek, U. Untangling the wine metabolome by combining untargeted SPME–GCxGC-TOF-MS and sensory analysis to profile Sauvignon blanc co-fermented with seven different yeasts. Metabolomics 2016, 12, 53. [Google Scholar] [CrossRef]
- Wang, X.; Tao, Y.; Wu, Y.; An, R.; Yue, Z. Aroma compounds and characteristics of noble-rot wines of Chardonnay grapes artificially botrytized in the vineyard. Food Chem. 2017, 226, 41–50. [Google Scholar] [CrossRef]
- Zhang, L.; Tao, Y.S.; Wen, Y.; Wang, H. Aroma evaluation of young Chinese merlot wines with denomination of origin. S. Afr. J. Enol. Vitic. 2013, 34, 46–53. [Google Scholar] [CrossRef] [Green Version]
- Niu, Y.; Zhang, X.; Xiao, Z.; Song, S.; Eric, K.; Jia, C.; Yu, H.; Zhu, J. Characterization of odor-active compounds of various cherry wines by gas chromatography–mass spectrometry, gas chromatography–olfactometry and their correlation with sensory attributes. J. Chromatogr. B 2011, 879, 2287–2293. [Google Scholar] [CrossRef]
- Culleré, L.; Fernández de Simón, B.; Cadahía, E.; Ferreira, V.; Hernández-Orte, P.; Cacho, J. Characterization by gas chromatography–olfactometry of the most odor-active compounds in extracts prepared from acacia, chestnut, cherry, ash and oak woods. LWT 2013, 53, 240–248. [Google Scholar] [CrossRef]
- Chin, S.-T.; Eyres, G.T.; Marriott, P.J. Cumulative solid phase microextraction sampling for gas chromatography-olfactometry of Shiraz wine. J. Chromatogr. A 2012, 1255, 221–227. [Google Scholar] [CrossRef]
- Welke, J.E.; Manfroi, V.; Zanus, M.; Lazarotto, M.; Zini, C.A. Characterization of the volatile profile of Brazilian Merlot wines through comprehensive two-dimensional gas chromatography time-of-flight mass spectrometric detection. J. Chromatogr. A 2012, 1226, 124–139. [Google Scholar] [CrossRef] [Green Version]
- De-la-Fuente-Blanco, A.; Ferreira, V. Gas Chromatography Olfactometry (GC-O) for the (Semi)Quantitative Screening of Wine Aroma. Foods 2020, 9, 1892. [Google Scholar] [CrossRef]
- Chin, S.-T.; Eyres, G.T.; Marriott, P.J. Identification of potent odourants in wine and brewed coffee using gas chromatography-olfactometry and comprehensive two-dimensional gas chromatography. J. Chromatogr. A 2011, 1218, 7487–7498. [Google Scholar] [CrossRef]
- Geană, E.-I.; Ciucure, C.T.; Artem, V.; Apetrei, C. Wine varietal discrimination and classification using a voltammetric sensor array based on modified screen-printed electrodes in conjunction with chemometric analysis. Microchem. J. 2020, 159, 105451. [Google Scholar] [CrossRef]
- Martins, N.; Jiménez-Morillob, N.T.; Freitas, F.; Garcia, R.; Gomes da Silva, M.; Cabrita, M.J. Revisiting 3D van Krevelen diagrams as a tool for the visualization of volatile profile of varietal olive oils from Alentejo region, Portugal. Talanta 2020, 207, 120276. [Google Scholar] [CrossRef]
- Lucio, O.; Pardo, I.; Heras, J.M.; Krieger, S.; Ferrer, S. Influence of yeast strains on managing wine acidity using Lactobacillus plantarum. Food Control 2018, 92, 471–478. [Google Scholar] [CrossRef]
- Ferrero-del-Teso, S.; Arias, I.; Escudero, A.; Ferreira, V.; Fernández-Zurbano, P.; Sáenz-Navajas, M.P. Effect of grape maturity on wine sensory and chemical features: The case of Moristel wines. LWT 2020, 118, 108848. [Google Scholar] [CrossRef]
- Arias, I.; Lacau, B.; Astrain, J.; Barón, C.; Fenandez-Zurbano, P.; Ferreira, V.; Escudero, A. Effects of vineyard ‘potential’ and grape maturation on the aroma-volatile profile of Grenache wines. OENO One 2019, 4, 695–707. [Google Scholar]
- Arias-Pérez, I.; Ferrero-Del-Teso, S.; Sáenz-Navajas, M.P.; Fernández-Zurbano, P.; Lacau, B.; Astraín, J.; Barón, C.; Ferreira, V.; Escudero, A. Some clues about the changes in wine aroma composition associated to the T maturation of “neutral” grapes. Food Chem. 2020, 320, 126610. [Google Scholar] [CrossRef]
- Garde-Cerdán, T.; Gutiérrez-Gamboa, G.; Fernández-Novales, J.; Pérez-álvarez, E.P.; Diago, M.P. Towards the definition of optimal grape harvest time in Grenache T grapevines: Nitrogenous maturity. Sci. Hortic. 2018, 239, 9–16. [Google Scholar] [CrossRef]
- Richter, C.L.; Dunn, B.; Sherlock, G.; Pugh, T. Comparative metabolic footprinting of a large number of commercial wine yeast strains in Chardonnay fermentations. FEMS Yeast Res. 2013, 13, 394–410. [Google Scholar] [CrossRef]


| Sample Name | Free SO2 (mg·mL−1) | Total SO2 (mg·mL−1) | Ethanol (% Vol) | Total Acidity (g·L−1) | Volatile Acidity (g·L−1) | pH |
|---|---|---|---|---|---|---|
| T* | 10.5 ± 0.6 | 40.0 a ± 1.1 | 13.8 a ± 0.1 | 4.83 c ± 0.02 | 0.29 ± 0.07 | 3.63 a ± 0.01 |
| UM* | 10.0 ± 0.0 | 33.5 b ± 2.1 | 12.8 b ± 0.0 | 6.17 a ± 0.01 | 0.24 ± 0.08 | 3.43 b ± 0.00 |
| Mix* | 12.0 ± 2.8 | 39.5 a ± 0.7 | 13.9 a ± 0.1 | 6.00 b ± 0.03 | 0.26 ± 0.02 | 3.43 b ± 0.01 |
| Antão Vaz Wines (mg·L−1) | ||||
|---|---|---|---|---|
| Abv. | Compound | UM* | Mix* | T* |
| Asp | Aspartic Acid | 6.62 ± 0.38 a | 4.98 ± 0.59 b | 5.96 ± 0.34 a,b |
| Glu | Glutamine | 32.55 ± 6.15 | 27.37 ± 2.81 | 34.34 ± 7.36 |
| Asn | Asparagine | 7.01 ± 1.30 | 5.14 ± 0.69 | 6.36 ± 1.03 |
| Ser | Serine | 7.32 ± 0.73 | 6.83 ± 0.45 | 8.57 ± 1.23 |
| His | Histidine | 5.51 ± 0.48 | 5.68 ± 0.89 | 5.81 ± 0.69 |
| Gln | Glutamic Acid | 3.24 ± 0.18 | 2.92 ± 0.28 | 3.83 ± 1.83 |
| Gly | Glycine | 6.51 ± 0.58 | 5.83 ± 0.33 | 7.52 ± 0.92 |
| Thr | Threonine | 3.09 ± 0.13 | 2.91 ± 0.10 | 3.22 ± 0.18 |
| Arg | Arginine | 29.36 ± 2.32 | 26.36 ± 0.97 | 28.27 ± 2.25 |
| Ala | Alanine | 29.29 ± 2.29 | 27.02 ± 1.06 | 29.30 ± 2.44 |
| GABA | Gamma Aminobutyric Acid | <7.88 | <7.88 | <7.88 |
| Pro | Proline | 767.99 ± 129.04 | 650.12 ± 71.67 | 1029.78 ± 240.84 |
| Tyr | Tyrosine | 6.89 ± 0.35 | 6.23 ± 0.15 | 6.91 ± 0.37 |
| Val | Valine | 3.30 ± 0.28 | 2.95 ± 0.13 | 3.51 ± 0.30 |
| Met | Methionine | 4.01 ± 0.13 | 3.72 ± 0.14 | 4.00 ± 0.15 |
| Cys | Cysteine | 14.48 ± 1.92 | 12.20 ± 1.00 | 12.85 ± 2.47 |
| Ile | Isoleucine | 3.16 ± 0.23 | 2.82 ± 0.12 | 3.27 ± 0.21 |
| Trp | Tryptophan | 3.42 ± 0.12 a | 3.19 ± 0.08 c | 3.38 ± 0.19 b |
| Leu | Leucine | 9.78 ± 1.23 a | <8.51 b | 9.62 ± 1.31 a |
| Phe | Phenylalanine | 6.36 ± 0.72 | 5.19 ± 0.43 | 6.21 ± 0.81 |
| Orn | Ornithine | 10.85 ± 1.84 | 7.90 ± 0.55 | 8.93 ± 1.13 |
| Lys | Lysine | 11.06 ± 1.51 | 8.31 ± 0.67 | 10.81 ± 1.58 |
| Total | 943.15 ± 128.67 b | 929.20 ± 142.14 b | 1083.82 ± 261.61 a | |
| No | Compound | LRI | LRI (Lit) References [43,44,45,46,47,48,49,50,51,52,53,54,55,56,57,58,59] | Aroma Descriptor | UM* | Mix* | T* |
|---|---|---|---|---|---|---|---|
| Esters | |||||||
| 1 | Ethyl acetate | (885–898) | Fruity, sweet, pineapple, red fruits [1] | 2.43 × 10¹⁰ ± 7.78 × 10⁸ b | 2.32 × 10¹⁰ ± 4.60× 10⁸ b | 2.84 × 10¹⁰ ± 1.24 × 10⁹ a | |
| 2 | Ethyl isobutyrate | (955–984) | Fruity, strawberry, sweet, bubble gum, alcoholic [1] | 4.03 × 10⁷ ± 2.30 × 10⁶ | 5.02 × 10⁷ ± 1.17 × 10⁷ | 2.99 × 10⁷ ± 2.23 × 10⁷ | |
| 3 | Isobutyl acetate | 1027 | (1005–1007) | Solvent, alcoholic, ripe fruit [1,2] | 4.48 × 10⁸ ± 1.41 × 10⁷ | 4.50 × 10⁸ ± 1.17 × 10⁷ | 5.31 × 10⁸ ± 1.05 × 10⁸ |
| 4 | Ethyl butyrate | 1049 | (1022–1057) | Fruity, strawberry, sweet, bubble gum, banana [1] | 3.66 × 10⁹ ± 1.20 × 10⁸ | 3.80 × 10⁹ ± 8.13 × 10⁷ | 4.30 × 10⁹ ± 3.36 × 10⁸ |
| 5 | Ethyl 2-methylbutanoate | 1063 | (1041–1069) | strawberry, fruity [2] | N/D | N/D | 5.83 × 10⁵ ± 8.24 × 10⁵ |
| 6 | Isoamyl acetate | 1127 | (1118–1147) | Banana, sweet, fruity, fresh, green [1] | 1.01 × 10¹¹ ± 2.79 × 10⁹ a | 9.34 × 10¹⁰ ± 1.38 × 10⁹ b | 1.03 × 10¹¹ ± 2.12 × 10⁹ a |
| 7 | Ethyl (Z)-but-2-enoate | 1175 | (1122–1152) | 1.26 × 10⁷ ± 2.35 × 10⁶ | 1.64 × 10⁷ ± 6.75 × 10⁶ | 1.71 × 10⁷ ± 3.54 × 10⁵ | |
| 8 | Hexyl acetate | 1231 | 1264 | Pleasant fruity, pear [1] | 6.91 × 10¹⁰ ± 4.99 × 10⁹ | 6.75 × 10¹⁰ ± 1.84 × 10⁹ | 7.16 × 10¹⁰ ± 1.17 × 10⁹ |
| 9 | Ethyl hexanoate | 1269 | (1224–1270) | Green apple, fruity, strawberry, anise [3] | 1.73 × 10¹⁰ ± 6.72 × 10⁸ a | 1.40 × 10¹⁰ ± 3.89 × 10⁸ b | 1.60 × 10¹⁰ ± 2.83 × 10⁸ a |
| 10 | Ethyl 3-hexenoate | 1293 | 1301 | 1.07 × 10⁸ ± 1.21 × 10⁷ | 1.48 × 10⁸ ± 3.22 × 10⁷ | 1.05 × 10⁸ ± 2.57 × 10⁷ | |
| 11 | (Z)-3-Hexenyl acetate | 1309 | 1308 | Fruity, green tea [4] | 1.35 × 10⁹ ± 4.95 × 10⁷ a | 9.71 × 10⁸ ± 6.72 × 10⁷ b | 1.08 × 10⁹ ± 2.58 × 10⁷ b |
| 12 | Ethyl heptanoate | 1324 | 1331 | Pineapple, fruity [5] | 1.12 × 10⁸ ± 9.44 × 10⁶ | 1.22 × 10⁸ ± 5.30 × 10⁶ | 1.27 × 10⁸ ± 4.84 × 10⁷ |
| 13 | Ethyl lactate | 1331 | 1341 | Lactic, raspberry [3] | 1.55 × 10⁷ ± 1.06 × 10⁶ b | 4.69 × 10⁷ ± 1.37 × 10⁷ a | 1.15 × 10⁷ ± 1.10 × 10⁶ b |
| 14 | Heptyl acetate | 1361 | (1374–1385) | Pear [6] | 4.22 × 10⁸ ± 3.18 × 10⁶ b | 3.65 × 10⁸ ± 8.03 × 10⁷ b | 7.64 × 10⁸ ± 7.11 × 10⁷ a |
| 15 | Methyl octanoate | 1378 | 1378 | Fruity, floral, creamy [1] | 2.03 × 10⁸ ± 2.26 × 10⁷ | 2.23 × 10⁸ ± 7.78 × 10⁶ | 2.40 × 10⁸ ± 1.45 × 10⁷ |
| 16 | Ethyl octanoate | 1418 | (1422–1446) | Soapy, fatty, anise, fruity, pineapple, pear, flora, sweet [1] | 1.93 × 10¹¹ ± 1.7 × 10¹⁰ | 1.81 × 10¹¹ ± 1.98 × 10¹⁰ | 2.03 × 10¹¹ ± 1.34 × 10¹⁰ |
| 17 | Isopentyl hexanoate | 1439 | 1444 | Sweet fruity [7] | 4.28 × 10⁸ ± 8.10 × 10⁷ | 4.32 × 10⁸ ± 7.64 × 10⁷ | 4.74 × 10⁸ ± 3.96 × 10⁷ |
| 18 | Ethyl nonanoate | 1510 | 1528 | Rose, fruity [1] | 2.90 × 10⁸ ± 6.29 × 10⁷ | 2.81 × 10⁸ ± 3.89 × 10⁷ | 4.18 × 10⁸ ± 9.05 × 10⁷ |
| 19 | Butyl octanoate | 1520 | (1601–1621) | Orange floral, jasmine, pear [1] | 1.98 × 10⁷ ± 3.89 × 10⁶ | 2.11 × 10⁷ ± 3.18 × 10⁶ | 1.9 × 10⁷ ± 1.48 × 10⁶ |
| 20 | Propyl octanoate | 1524 | (1508–1530) | 5.5 × 10⁷ ± 1.79 × 10⁷ | 6.12 × 10⁷ ± 1.21 × 10⁷ | 6.71 × 10⁷ ± 3.15 × 10⁷ | |
| 21 | Ethyl (E)-oct-2-enoate | 1532 | Fruity, pineapple, green with a fatty waxy nuance [1] | 1.04 × 10⁸ ± 1.20 × 10⁷ | 1.39 × 10⁸ ± 4.29 × 10⁷ | 1.07 × 10⁸ ± 3.11 × 10⁷ | |
| 22 | Isoamyl lactate | 1539 | 1583 | Fruity creamy nutty [8] | N/D | N/D | 3.18 × 10⁷ ± 4.49 × 10⁷ |
| 23 | Methyl decanoate | 1565 | (1570–1636) | Fruity, soap, waxy [1] | 6.44 × 10⁷ ± 2.37 × 10⁶ | 6.53 × 10⁷ ± 1.56 × 10⁷ | 7.48 × 10⁷ ± 2.20 × 10⁶ |
| 24 | Ethyl decanoate | 1603 | (1595–1665) | Fruity, grape, fatty, pleasant, floral, sweet [1] | 1.08 × 10¹¹ ± 8.2 × 10⁹ | 1.02 × 10¹¹ ± 1.59 × 10¹⁰ | 1.03 × 10¹¹ ± 1.48 × 10⁹ |
| 25 | Isoamyl octanoate | 1622 | 1642 | Sweet, cheese [5] | 2.54 × 10⁹ ± 2.86 × 10⁸ | 2.39 × 10⁹ ± 4.63 × 10⁸ | 2.10 × 10⁹ ± 2.33 × 10⁸ |
| 26 | Diethyl succinate | 1633 | 1684 | Light fruity [3] | 1.15 × 10⁸ ± 8.17 × 10⁶ | 1.08 × 10⁸ ± 1.69 × 10⁷ | 1.87 × 10⁸ ± 6.19 × 10⁷ |
| 27 | Ethyl dec-9-enoate (isomer) | 1639 | 1694 | Fruity, fatty [1] | 7.41 × 10⁷ ± 1.34 × 10⁶ a | 5.38 × 10⁷ ± 7.88 × 10⁶ b | 6.35 × 10⁷ ± 2.33 × 10⁶ a,b |
| 28 | Decyl acetate | 1641 | (1691–1692) | 1.32 × 10⁷ ± 2.16 × 10⁶ | 4.30 × 10⁷ ± 1.71 × 10⁷ | 2.27 × 10⁷ ± 7.60 × 10⁶ | |
| 29 | Isobutyl decanoate | 1708 | 1746 | 3.87 × 10⁸ ± 2.47 × 10⁷ | 3.8 × 10⁸ ± 2.2 × 10⁷ | 3.47 × 10⁸ ± 5.3 × 10⁷ | |
| 30 | Ethyl trans-dec-2-enoate (isomer) | 1720 | 6.11 × 10⁷ ± 1.53 × 10⁷ | 6.47 × 10⁷ ± 3.67 × 10⁷ | 6.98 × 10⁷ ± 1.2 × 10⁷ | ||
| 31 | Phenethyl acetate | 1776 | 1803 | Rose, jasmine, sweet, honey, floral, rosy with a slight green nectar fruity body and mouth feel [1] | 9.67 × 10⁹ ± 9.55 × 10⁸ | 1.08 × 10¹⁰ ± 5.66 × 10⁸ | 1.18 × 10¹⁰ ± 6.36 × 10⁸ |
| 32 | Ethyl laurate | 1787 | 1822 | Sweet, floral, fruity, cream [9] | 3.90 × 10¹⁰ ± 5.94 × 10⁹ | 4.39 × 10¹⁰ ± 6.3 × 10⁹ | 3.42 × 10¹⁰ ± 1.0 × 10¹⁰ |
| 33 | Isoamyl decanoate | 1806 | (1840–1871) | 1.00 × 10⁹ ± 3.61 × 10⁷ | 1.39 × 10⁹ ± 1.20 × 10⁸ | 1.09 × 10⁹ ± 4.91 × 10⁸ | |
| 34 | Ethyl myristate | 1964 | (2015–2094) | 3.56 × 10⁸ ± 3.82 × 10⁷ | 4.10 × 10⁸ ± 4.10 × 10⁷ | 3.94 × 10⁸ ± 3.01 × 10⁷ | |
| 35 | Isoamyl laurate | 1992 | (2048–2110) | 1.20 × 10⁸ ± 1.42 × 10⁷ | 1.49 × 10⁸ ± 1.17 × 10⁷ | 1.20 × 10⁸ ± 4.90 × 10⁷ | |
| 36 | Ethyl-tetradec-9-enoate (isomer) | 3.71 × 10⁸ ± 1.38 × 10⁷ | 4.47 × 10⁸ ± 2.44 × 10⁷ | 2.89 × 10⁸ ± 1.52 × 10⁸ | |||
| 37 | Ethyl hexadecanoate | 2229 | Fatty, rancid, fruity, sweet [3] | 9.46 × 10⁸ ± 3.09 × 10⁸ | 8.39 × 10⁸ ± 1.81 × 10⁸ | 1.04 × 10⁹ ± 3.21 × 10⁸ | |
| 38 | Ethyl hexadec-9-enoate (isomer) | 1.37 × 10⁹ ± 1.66 × 10⁸ | 1.51 × 10⁹ ± 1.41 × 10⁷ | 1.18 × 10⁹ ± 3.35 × 10⁸ | |||
| Alcohols | |||||||
| 39 | Ethanol | 926 | 1.01 × 10¹¹ ± 4.45 × 10⁹ | 1.01 × 10¹¹ ± 1.63 × 10¹⁰ | 1.10 × 10¹¹ ± 4.95 × 10⁹ | ||
| 40 | Isobutyl alcohol | 1102 | (1085–1125) | Fusel, alcohol, malty, fruity, sweet [1] | 1.23 × 10⁹ ± 9.90 × 10⁷ | 1.51 × 10⁹ ± 2.16 × 10⁸ | 1.56 × 10⁹ ± 1.20 × 10⁸ |
| 41 | Butyl alcohol | 1150 | (1138–1146) | Medicinal, alcohol, spicy, refreshing, sweet [1] | 2.41 × 10⁷ ± 5.66 × 10⁵ | 2.09 × 10⁷ ± 9.23 × 10⁶ | 3.11 × 10⁷ ± 2.05 × 10⁷ |
| 42 | Pentan-1-ol | 1203 | 1244 | 4.11 × 10¹⁰ ± 2.58 × 10⁹ | 4.64 × 10¹⁰ ± 5.30 × 10⁸ | 4.67 × 10¹⁰ ± 2.23 × 10⁹ | |
| 43 | Isohexanol | 1300 | (1301–1316) | Almond, toasted [10] | 9.13 × 10⁷ ± 1.65 × 10⁷ | 6.25 × 10⁷ ± 3.04 × 10⁷ | 8.50 × 10⁷ ± 7.07 × 10⁶ |
| 44 | 3-Methyl-1-pentanol | 1313 | (1313–1325) | Herbaceous, cocoa, soil, mushroom [10,11] | 2.43 × 10⁷ ± 2.44 × 10⁶ | 4.17 × 10⁷ ± 1.86 × 10⁷ | 3.11 × 10⁷ ± 1.26 × 10⁷ |
| 45 | Hexanol | 1337 | (1351–1392) | Green, grass, flora, cooked, burnt [1] | 1.27 × 10⁹ ± 1.94 × 10⁸ | 1.38 × 10⁹ ± 1.70 × 10⁸ | 1.33 × 10⁹ ± 1.34 × 10⁸ |
| 46 | (Z)-hex-3-en-1-ol | 1367 | (1378–1407) | Fruity, plant, refreshing, citrus [2,12] | 1.66 × 10⁸ ± 2.05 × 10⁷ | 1.61 × 10⁸ ± 2.12 × 10⁶ | 1.43 × 10⁸ ± 2.83 × 10⁶ |
| 47 | 1-Heptanol | 1430 | Rusty, fishy, sweaty, earthy [1] | 5.31 × 10⁸ ± 8.17 × 10⁷ | 6.32 × 10⁸ ± 2.83 × 10⁶ | 7.92 × 10⁸ ± 1.44 × 10⁸ | |
| 48 | 2-Nonen-1-ol | 1572 | 4.01 × 10⁷ ± 0.00 × 100 | 5.49 × 10⁷ ± 1.56 × 10⁷ | 6.69 × 10⁷ ± 1.12 × 10⁷ | ||
| 49 | Nonan-1-ol | 1615 | (1619–1624) | 3.04 × 10⁷ ± 1.17 × 10⁷ | 4.67 × 10⁷ ± 1.09 × 10⁷ | 5.07 × 10⁷ ± 2.47 × 10⁵ | |
| 50 | Methionol | 1677 | (1738–1745) | Plastic, rubber [13] | 9.35 × 10⁷ ± 1.16 × 10⁷ | 1.07 × 10⁸ ± 1.82 × 10⁷ | 9.00 × 10⁷ ± 2.55 × 10⁷ |
| 51 | Phenylethyl alcohol | 1858 | (1905–1940) | Flowery, pollen, perfume, rose, sweet, honey [1] | 1.38 × 10¹⁰ ± 1.94 × 10⁹ | 1.77 × 10¹⁰ ± 8.49 × 10⁸ | 1.63 × 10¹⁰ ± 1.4 × 10⁹ |
| 52 | Nerolidol | 1959 | (2008–2057) | Floral, fruity, orange, light flavor [3] | 3.22 × 10⁷ ± 2.40 × 10⁷ | 2.89 × 10⁷ ± 1.12 × 10⁷ | 3.32 × 10⁷ ± 4.14 × 10⁶ |
| Ketones | |||||||
| 53 | 2-Nonanone | 1384 | 1397 | Fruity, floral, fatty [1] | 9.66 × 10⁶ ± 4.93 × 10⁶ | 1.70 × 10⁷ ± 3.29 × 10⁶ | 1.34 × 10⁷ ± 3.35 × 10⁶ |
| 54 | 3-Decanone | 1488 | 1491 | 1.04 × 10⁸ ± 1.11 × 10⁷ | 1.61 × 10⁸ ± 2.97 × 10⁷ | 1.33 × 10⁸ ± 3.82 × 10⁷ | |
| 55 | γ-Butirolactone | 1627 | (1640–1673) | Toasty, wood, caramel, sour, dried floral [10,14] | 4.26 × 10⁷ ± 3.68 × 10⁶ | 4.29 × 10⁷ ± 1.66 × 10⁶ | 4.83 × 10⁷ ± 1.08 × 10⁷ |
| Aldehydes | |||||||
| 56 | Nonanal | 1389 | (1402–1415) | Waxy, aldehydic, rose, fresh, orris, orange peel, fatty, peely [1] | 4.02 × 10⁸ ± 3.78 × 10⁸ | 1.27 × 10⁹ ± 1.32 × 10⁸ | 6.40 × 10⁸ ± 7.05 × 10⁸ |
| 57 | Furfural | 1465 | (1458–1485) | Woody, almond, sweet, fruity, flowery, sweet wood, nut, bready, caramel, burnt [15,16,17] | 4.96 × 10⁸ ± 7.32 × 10⁷ | 8.21 × 10⁸ ± 1.77 × 10⁸ | 7.24 × 10⁸ ± 4.24 × 10⁷ |
| 58 | 2-Methyl hexadecanal | 1695 | 1654 | 4.97 × 10⁷ ± 1.38 × 10⁷ | 4.84 × 10⁷ ± 2.97 × 10⁶ | 4.83 × 10⁷ ± 3.89 × 10⁶ | |
| Carboyilic acids | |||||||
| 59 | 2-Hydroxyoctanoic acid | 1749 | 1.93 × 10⁷ ± 5.73 × 10⁶ | 2.85 × 10⁷ ± 3.04 × 10⁶ | 1.97 × 10⁷ ± 4.88 × 10⁶ | ||
| 60 | Cis-5-Dodecenoic acid | 1837 | 1.75 × 10⁹ ± 5.23 × 10⁸ | 1.88 × 10⁹ ± 3.08 × 10⁸ | 1.22 × 10⁹ ± 4.63 × 10⁸ | ||
| 61 | Octanoic acid | (2083–2098) | Fatty, unpleasant, cheese, fatty acid, harsh, rancid [1,10] | 1.97 × 10¹⁰ ± 3.71 × 10⁹ | 2.00 × 10¹⁰ ± 3.18 × 10⁹ | 1.50 × 10¹⁰ ± 4.14 × 10⁹ | |
| Relevant unknowns | |||||||
| 62 | Unknown 1 | 4.19 × 10⁷ ± 5.37 × 10⁶ | 5.54 × 10⁷ ± 1.44 × 10⁷ | 4.58 × 10⁷ ± 1.03 × 10⁷ | |||
| 63 | Unknown 2 | 1140 | N/D | N/D | 2.53 × 10⁷ ± 3.57 × 10⁷ | ||
| 64 | Unknown 3 | 1176 | 4.52 × 10⁷ ± 6.75 × 10⁶ | 4.02 × 10⁷ ± 2.79 × 10⁶ | 4.69 × 10⁷ ± 2.97 × 10⁶ | ||
| 65 | Unknown 4 | 1190 | 9.29 × 10⁷ ± 3.06 × 10⁷ | 7.84 × 10⁷ ± 4.89 × 10⁷ | 4.86 × 10⁷ ± 1.97 × 10⁷ | ||
| 66 | Unknown 5 | 1227 | 1.80 × 10⁸ ± 1.38 × 10⁷ | 1.59 × 10⁸ ± 1.87 × 10⁷ | 1.76 × 10⁸ ± 1.10 × 10⁷ | ||
| 67 | Unknown 6 | 1236 | 3.40 × 10⁷ ± 2.45 × 10⁷ | 2.00 × 10⁷ ± 2.83 × 10⁷ | 3.11 × 10⁷ ± 1.15 × 10⁷ | ||
| 68 | Unknown 7 | 1244 | 1.08 × 10⁷ ± 9.49 × 10⁶ | 5.32 × 10⁶ ± 7.52 × 10⁶ | 1.62 × 10⁷ ± 7.07 × 10⁶ | ||
| 69 | Unknown 8 | 1260 | 7.07 × 10⁷ ± 9.26 × 10⁶ | 8.16 × 10⁷ ± 1.30 × 10⁷ | 8.22 × 10⁷ ± 4.36 × 10⁶ | ||
| 70 | Unknown 9 | 1273 | 1.37 × 10⁷ ± 7.35 × 10⁵ | 1.69 × 10⁷ ± 1.61 × 10⁷ | 1.94 × 10⁷ ± 6.93 × 10⁶ | ||
| 71 | Unknown 10 | 1287 | 8.01 × 10⁷ ± 5.23 × 10⁶ a,b | 9.11 × 10⁷ ± 7.00 × 10⁶ a | 6.75 × 10⁷ ± 2.40 × 10⁶ b | ||
| 72 | Unknown 11 | 1341 | 1.03 × 10⁸ ± 1.13 × 10⁶ b | 1.24 × 10⁸ ± 2.47 × 10⁶ a | 1.05 × 10⁸ ± 2.83 × 10⁵ b | ||
| 73 | Unknown 12 | 1470 | 1.28 × 10⁸ ± 4.24 × 10⁶ b | 1.54 × 10⁸ ± 1.06 × 10⁶ a | 1.21 × 10⁸ ± 6.93 × 10⁶ b | ||
| 74 | Unknown 13 | 1495 | 1.04 × 10⁸ ± 2.54 × 10⁷ | 9.35 × 10⁷ ± 2.12 × 10⁷ | 1.03 × 10⁸ ± 7.28 × 10⁶ | ||
| 75 | Unknown 14 | 1523 | 2.23 × 10⁷ ± 8.96 × 10⁶ | 2.51 × 10⁷ ± 2.09 × 10⁶ | 2.50 × 10⁷ ± 1.51 × 10⁷ | ||
| 76 | Unknown 15 | 1548 | 2.54 × 10⁷ ± 3.89 × 10⁶ | 2.97 × 10⁷ ± 1.02 × 10⁷ | 3.15 × 10⁷ ± 7.21 × 10⁶ | ||
| 77 | Unknown 16 | 1561 | 1.52 × 10⁷ ± 1.10 × 10⁶ a | 1.90 × 10⁷ ± 1.10 × 10⁶ a | 9.53 × 10⁶ ± 2.29 × 10⁶ b | ||
| 78 | Unknown 17 | 1597 | 6.11 × 10⁶ ± 1.77 × 10⁵ | 6.65 × 10⁶ ± 3.90 × 10⁶ | 1.00 × 10⁷ ± 8.41 × 10⁵ | ||
| 79 | Unknown 18 | 1611 | 2.65 × 10⁷ ± 1.34 × 10⁷ | 1.67 × 10⁷ ± 9.10 × 10⁶ | 1.59 × 10⁷ ± 2.28 × 10⁶ | ||
| 80 | Unknown 19 | 1651 | 1.30 × 10¹¹ ± 1.59 × 10¹⁰ | 1.31 × 10¹¹ ± 1.41 × 10¹⁰ | 1.25 × 10¹¹ ± 2.12 × 10⁹ | ||
| 81 | Unknown 20 | 1661 | 2.15 × 10⁸ ± 3.64 × 10⁷ | 2.10 × 10⁸ ± 1.52 × 10⁷ | 2.21 × 10⁸ ± 2.40 × 10⁷ | ||
| 82 | Unknown 21 | 1680 | 3.23 × 10⁷ ± 1.03 × 10⁶ | 2.98 × 10⁷ ± 7.85 × 10⁶ | 3.27 × 10⁷ ± 3.75 × 10⁶ | ||
| 83 | Unknown 22 | 1728 | 6.35 × 10⁶ ± 4.60 × 10⁵ | 6.94 × 10⁷ ± 8.71 × 10⁷ | 6.85 × 10⁶ ± 1.18 × 10⁶ | ||
| 84 | Unknown 23 | 1729 | 4.56 × 10⁷ ± 1.32 × 10⁷ a,b | 7.11 × 10⁷ ± 8.13 × 10⁶ a | 2.70 × 10⁷ ± 2.09 × 10⁶ b | ||
| 85 | Unknown 24 | 1753 | 1.89 × 10⁷ ± 4.49 × 10⁶ | 2.49 × 10⁷ ± 6.36 × 10⁵ | 1.91 × 10⁷ ± 2.44 × 10⁶ | ||
| 86 | Unknown 25 | 1757 | 1.16 × 10⁸ ± 2.12 × 10⁷ | 1.13 × 10⁸ ± 3.64 × 10⁷ | 1.05 × 10⁸ ± 3.25 × 10⁷ | ||
| 87 | Unknown 26 | 1826 | 2.05 × 10⁹ ± 5.69 × 10⁸ | 1.99 × 10⁹ ± 2.93 × 10⁸ | 1.40 × 10⁹ ± 4.45 × 10⁸ | ||
| 88 | Unknown 27 | 1893 | 5.60 × 10⁷ ± 2.72 × 10⁷ | 7.36 × 10⁷ ± 7.18 × 10⁶ | 4.82 × 10⁸ ± 5.78 × 10⁸ | ||
| Total | 1.76 × 10¹² ± 7.35 × 10¹⁰ | 1.74 × 10¹² ± 8.50 × 10¹⁰ | 1.80 × 10¹² ± 5.10 × 10¹⁰ | ||||
Publisher’s Note: MDPI stays neutral with regard to jurisdictional claims in published maps and institutional affiliations. |
© 2022 by the authors. Licensee MDPI, Basel, Switzerland. This article is an open access article distributed under the terms and conditions of the Creative Commons Attribution (CC BY) license (https://creativecommons.org/licenses/by/4.0/).
Share and Cite
Pereira, C.; Mendes, D.; Martins, N.; Gomes da Silva, M.; Garcia, R.; Cabrita, M.J. A Sustainable Approach Based on the Use of Unripe Grape Frozen Musts to Modulate Wine Characteristics as a Proof of Concept. Beverages 2022, 8, 79. https://doi.org/10.3390/beverages8040079
Pereira C, Mendes D, Martins N, Gomes da Silva M, Garcia R, Cabrita MJ. A Sustainable Approach Based on the Use of Unripe Grape Frozen Musts to Modulate Wine Characteristics as a Proof of Concept. Beverages. 2022; 8(4):79. https://doi.org/10.3390/beverages8040079
Chicago/Turabian StylePereira, Catarina, Davide Mendes, Nuno Martins, Marco Gomes da Silva, Raquel Garcia, and Maria João Cabrita. 2022. "A Sustainable Approach Based on the Use of Unripe Grape Frozen Musts to Modulate Wine Characteristics as a Proof of Concept" Beverages 8, no. 4: 79. https://doi.org/10.3390/beverages8040079