Article

Mitigating Grapevine Red Blotch Virus Impact on Final Wine Composition

Department of Viticulture and Enology, University of California, Davis, One Shields Avenue, Davis, CA 95616, USA
*
Author to whom correspondence should be addressed.
Beverages 2021, 7(4), 76; https://doi.org/10.3390/beverages7040076
Submission received: 21 October 2021 / Revised: 23 November 2021 / Accepted: 24 November 2021 / Published: 29 November 2021

Abstract

:
Grapevine red blotch virus (GRBV), the causative agent of red blotch disease, causes significant decreases in sugar and anthocyanin accumulation in grapes, suggesting a delay in ripening events. Two mitigation strategies were investigated to alleviate the impact of GRBV on wine composition. Wines were made from Cabernet Sauvignon (CS) (Vitis vinifera) grapevines, grafted onto 110R and 420A rootstocks, in 2016 and 2017. A delayed harvest and chaptalization of diseased grapes were employed to decrease chemical and sensory impacts on wines caused by GRBV. Extending the ripening of the diseased fruit produced wines that were overall higher in aroma compounds such as esters and terpenes and alcohol-related (hot and alcohol) sensory attributes compared to wines made from diseased fruit harvested at the same time as healthy fruit. In 2016 only, a longer hangtime of GRBV infected fruit resulted in wines with increased anthocyanin concentrations compared to wines made from GRBV diseased fruit that was harvested at the same time as healthy fruit. Chaptalization of the diseased grapes in 2017 produced wines chemically more similar to wines made from healthy fruit. However, this was not supported by sensory analysis, potentially due to high alcohol content masking aroma characteristics.

Graphical Abstract

1. Introduction

Grapevines (Vitis spp.) are among the most widely grown fruit crops globally, with the United States being one of the top grape-growing and wine-producing countries. Like many other crops, pathogens threaten the economic status of grapevines by lowering yields or decreasing the quality of the grapes and the resulting wines. Currently, with over 70 viruses identified, grapevines contain the highest number of pathogens to infect a single crop [1]. In 2012, a new circular, single-stranded DNA virus was identified in grapevines and is currently known as grapevine red blotch virus (GRBV) [2,3].
GRBV has been identified in the United States, Canada, Switzerland, South Korea, Mexico, India, and Argentina [4,5,6,7,8,9,10] and is known to infect white and red wine grape cultivars and table and raisin grapes, and it is interspecific of hybrids and rootstocks. GRBV is the causative agent of grapevine red blotch disease (GRBD) [11], with foliar symptoms consisting of red blotches on leaf blades and margins and reddening of the primary, secondary, and tertiary veins in red grape cultivars [12,13,14]. GRBV causes increases in sugar and anthocyanin concentrations in leaves of red grape cultivars, with consistent decreases of both in the grape berry [14,15,16]. The impact of GRBV on the secondary metabolites in grapes is variable and dependent on genotypic and environmental factors [14,17]. However, little research has been done on the impact of GRBV on the final wine composition and quality.
Previous studies observed that GRBD causes a delay in grape maturation and can potentially impact the final wine quality, producing wines with lower ethanol, phenolic, and aroma content. Research indicated that a trained sensory panel was able to differentiate between wines made from GRBV infected fruit and wines made from healthy fruit, which was driven by differences in alcohol and mouthfeel attributes [18]. Recently, a study indicated that the low inclusion of GRBD fruit during winemaking still impacted the chemical and sensorial parameters of the final wine [19]. However, no mitigation strategies have been investigated to alleviate the effects of GRBV on final wine composition.
It is well known that when the grape berry has reached full maturation, flow from the phloem decreases, slowing down the transport of water and solutes from leaves to the berry [20]. Therefore, extending ripening past the typical ripening point of grapes correlates to decreases in metabolite biosynthesis in the berry [21]. Instead, metabolites, such as sugars and phenolics, begin to concentrate in the berry through transpiration [20,22,23]. Although research has indicated that a longer hangtime can increase phenolic concentration in the berry through dehydration [24], other studies have demonstrated a decrease in anthocyanin levels in overripe berries due to degradation [25]. However, the maximum level of anthocyanins in the grape did not correlate with maximum extractability in the final wines, where a longer hangtime resulted in greater anthocyanin extractability during winemaking [25]. Additionally, fruit maturity impacts volatile accumulation in grapes such as terpenes and esters [26,27,28]. Bindon et al. investigated the relationship between fruit maturity, wine composition, and sensory characteristics. They found that later harvested fruit correlated to dark fruit attributes, whereas earlier picked fruit correlated with vegetative characteristics [29].
Phenolic extraction during fermentation is also impacted by ethanol production [30]. In general, higher ethanol concentrations during fermentation increase phenolic content in final wines [31,32], which have been correlated to higher sensory quality scores by wine judges [33]. However, additional studies have indicated that higher ethanol concentrations during fermentation do not increase the extraction of monomeric phenolics but increase polymerization and produce darker wines that are perceived by a sensory panel [34]. This study indicated that wine alcohol content is positively correlated to fruity characteristics in final wines and negatively correlated to green or vegetal aromas [28,34].
As previous research has shown that GRBV has led to delay ripening events in grapes, resulting in wines with lower ethanol content and phenolic concentrations, the current study investigated two mitigation strategies to reduce the impact of GRBV on resulting wine quality. In 2016 and 2017, diseased fruit was harvested first when the healthy fruit reached 25 °Brix, and a second time once the diseased fruit reached 25 °Brix. Additionally, in 2017, a sub-portion of the first harvested diseased fruit was also chaptalized to match the sugar content of healthy fruit must. Both mitigation strategies increase the sugar content of grape musts, consequently increasing the ethanol content of final wines. Therefore, it is hypothesized that the two mitigation strategies employed in this project will result in a wine made from diseased fruit being chemically and sensorially similar to a wine made from healthy fruit.

2. Materials and Methods

2.1. Grape Harvest and Winemaking

Cabernet Sauvignon (Vitis vinifera), grafted onto 110R and 420A rootstocks, grapevines were used for this investigation, from Oakville Experimental Station (Napa County, CA, USA). Details of the vineyard and viticultural practices were previously described in Rumbaugh et al. [17] and Martínez-Lüscher et al. [15]. GRBV symptoms in this vineyard block were monitored for several years prior to this study. A 100% correlation between qPCR testing for GRBV and symptoms in grapevines was shown. Due to the number of vines needed for winemaking, only a subset of vines was retested for GRBV [17]. At harvest, 240 symptomatic (RB(+)) vines and 120 asymptomatic (RB(−)) vines were harvested simultaneously once RB(−) reached 25 °Brix. In addition, a second harvest of diseased fruit (RB(+) 2H) was performed once they reached 25 °Brix. In general, this harvest occurred one to two weeks after the first harvest (Table 1). However, the second harvest of CS 420A grapevines on 17 October 2017, occurred after the Northern California wildfires and heavy smoke exposure. Therefore, these wines were excluded from the sensory analysis due to smoke impact.
Wines were made at the UC Davis LEED Platinum Teaching and Research Winery (University of California, Davis, CA, USA) using standard experimental protocols for red wines in 200 L research fermenters [18]. In 2016, the following fermentations were performed in triplicate: RB(−), RB(+), and RB(+) 2H. In 2017, due to observed differences between RB(+) and RB(+) 2H in 2016, chaptalization was performed to determine if sugar content (therefore ethanol content) was the main driver of phenolic extraction in wines. Thus, during the first harvest, RB(+) grapes either had no sugar added or sugar (sucrose) added aiming for similar total soluble-solids (TSS measured in °Brix) of RB(−) grape must. The following fermentations were performed in 2017 in triplicate: RB(−), RB(+), RB(+) sugar addition (S), and RB(+) 2H. Prior to yeast inoculation, °Brix, titratable acidity (TA measured as tartaric acid equivalents), pH, malic acid concentration, and yeast assimilable nitrogen (YAN) were measured for all treatments and are shown in Table 1. Fermentations were performed as in Girardello et al. [18].
Upon completion of primary fermentation (eight to nine days to reach <2.0 g/L residual sugar), wines were pressed using a basket press and returned to the research fermenters to settle. According to the manufacturer’s protocol, the wines were inoculated for malolactic fermentation (MLF) with Viniflora® Oenococcus oeni (Chr. Hansen A/S, Hørsholm, Denmark). When needed, re-inoculation with Lalvin MBR VP 41 Oenococcus oeni (Lallemand, Bakersfield, CA, USA) was performed. This was the case with RB(−) and RB(+) S in 2017 due to higher final ethanol content. These wines took around two to three months longer to finish, potentially causing differences in secondary metabolites [35,36]. Once MLF was complete, the wines were racked into stainless steel containers, adjusted to 30 mg/L of free SO2, and stored at 15 °C. Before bottling, ethanol concentrations were measured using an infrared spectrophotometer (Anton Paar USA Inc., Ashland, VA, USA), whereas residual sugar, acetic acid, free and bound SO2, pH, and TA were measured as in Iland and coworkers [37]. During bottling, wines were sterile filtered in Bordeaux-style bottles with Saranex screw caps (Saranex/Transcendia, Franklin Park, IL, USA). Wines were stored at 14 °C until further analysis. Three months after bottling, two bottles from each fermenter replicate were randomly selected for a total of six replicates for each analysis.

2.2. Phenolic Analysis

2.2.1. Phenolic Extraction through Fermentation

The progression of phenolic extraction was analyzed for each of the wine treatments for each rootstock. A 2 mL sample was taken each day of alcoholic fermentation to track the extraction of total phenolics, total anthocyanins, and total tannins. Samples were centrifuged at 4 °C at 4000 rpm for 15 min with an Eppendorf 5403 centrifuge (Westbury, NY, USA). An aliquot was taken and placed into a 1.5 mL tube and shaken to minimize CO2 production. Samples were analyzed based on a modified protein precipitation method [38,39,40] using a Genesys10S UV–Vis Spectrophotometer (Thermo Fisher Scientific, Madison, WI, USA) at 280–520 nm, and data were processed using the program Wine-XRAY with VESUVVIO software (Napa, CA, USA).

2.2.2. Wine Phenolic Analysis

Wine samples were collected at the time of sensory analysis and frozen until chemical analysis. Samples were thawed and centrifuged at 15,000 rpm for 5 min with an Eppendorf 5424 centrifuge (Westbury, NY, USA). Large polymeric pigments (LPP) and small polymeric pigments (SPP) were measured as in Harbertson et al. [40], whereas a modified protein precipitation assay [41] was used to determine total tannins. Using a Genesys10S UV–Vis Spectrophotometer, total tannins were measured at 510 nm absorbance and expressed as catechin equivalents (CE); SPP and LPP were measured at 520 nm absorbance. Relative concentrations of tannins were expressed as CE, and absorbance units of SPP and LPP were calculated as in Harbertson et al. [41].
Wine phenolic profiles were determined by RP-HPLC using an Agilent 1260 Infinity (Agilent Technologies, Santa Clara, CA, USA) equipped with a diode array detector, with a temperature controlled autosampler maintained at 8 °C. Chromatographic separation was carried out with a PLRP-S 100 A 3 µM 150 × 4.6 mm column stored at 35 °C. The sample (20 µL) was injected onto the column with the mobile phase flow rate set at 1 mL/min. The chromatographic method is described in Peng et al. [42]. To monitor the eluted compounds, the wavelengths 280 nm, 320 nm, 360 nm, and 520 nm were used. Calibrations curves were constructed for gallic acid, (+)-catechin, (−)-epicatechin, caffeic acid, quercetin, quercetin-rhamnoside, p-coumaric acid, and malvidin-3-O-glucoside chloride to quantify compounds. Other compounds identified were quantified as described in Girardello et al. [18]. All data processing was completed with Agilent® CDS ChemStation software version D.04 (Agilent Technologies, Santa Clara, CA, USA).

2.3. Volatile Profile Analysis

Two bottles were randomly selected from each fermentation replicate for each treatment (a total of six bottles per treatment). To an amber vial containing 3 g of NaCl, 10 mL of the wine sample was added. In 2016, each vial was spiked with 50 μL of 50 mg/L 2-octanol, and in 2017, each vial was spiked with 50 μL 10 mg/L of 2-undecanone as an internal standard. The vials were capped with crimp caps (Supelco Analytical, Bellefonte, PA, USA). Each bottle replicate from each fermentation replicate was analyzed in triplicate. The volatile profiles of each wine treatment were analyzed via HS-SPME-GC–MS. The wine samples were extracted and injected onto the GC-MS model 7890A (Agilent Technologies, Santa Clara, CA, USA) via a Gerstel Muli-purpose Sampler (version 1.2.3.1, Gerstel Inc., Linthicum, MD, USA). The analysis was carried out similarly as in Hendrickson et al. [43], with the exception that the carrier gas, helium, was set at a constant pressure of 5.53 psi in 2016 (retention-time locked to 2-octanol) and 7.03 psi in 2017 (retention-time locked to 2-undecanone). Each sample was semi-quantitatively analyzed using relative peak areas by normalizing with the peak area of the internal standard. Compounds were analyzed using Mass Hunter software version B.07.00 (Agilent Technologies, Santa Clara, CA, USA) and identified by retention time and confirmation of mass spectra ion peaks using the National Institute of Standards and Technology database (NIST) (https://www.nist.gov (accessed on 9 July 2020)).

2.4. Sensory Evaluation

In 2016, for both rootstocks and all treatments, three fermenter replicates were evaluated for a total of 18 wines. Due to noticeable differences in one of the fermenter replicates in each treatment, only two replicates were chosen in 2017. Cabernet Sauvignon 420A RB(+) 2H wines were not evaluated through descriptive analysis (DA) due to a smoky and ashy aftertaste from the wildfires in 2017, leaving seven treatments and 14 wines to be analyzed in 2017. DA was performed in triplicate for aroma, taste, mouthfeel, and color in May 2017 and June 2018, three months after bottling, in the J. Lohr Wine Sensory Room, at the University of California in Davis, California. Eleven panelists (five male and six female) were recruited for sensory analysis of both 2016 and 2017 wines by advertising within the University of California, Davis. Panelists gave informed consent before the study and were not aware of the research purpose or how many different samples they were evaluating. For DA and color evaluation of the wines, similar methods as in Lawless and Heymann [44] and Casassa et al. [24] were used, respectively.
Training for the panel consisted of seven one-hour sessions over four weeks. Panelists saw each wine at least three times. In those sessions, panelists generated a list of sensory attributes with related reference standards (Supplemental Tables S5 and S6) after blindly tasting the wines. Following the training sessions, panelists assessed the wines in triplicate in one-hour evaluation sessions over two weeks in individual sensory booths. In 2016, panelists evaluated six wines in each of the nine evaluation sessions, with a 30-s break between each wine evaluated. A five-minute break was given between wines three and four. Similarly, in 2017 panelists evaluated seven wines in each of the six sessions with a five-minute break between wines four and five. Prior to each evaluation session, panelists completed a reference standard test where they were asked to identify aroma standards blindly. The wines were served (40 mL) in a black ISO (ISO-3591:1977) wine tasting glass coded with a randomly generated three-digit code. Wine samples were randomly presented in a Williams Latin Square complete block design calculated by the FIZZ software (FIZZ network, version 2.47 B, Biosystèmes, Couternon, France). The evaluation sessions were performed in a booth with red lighting at room temperature, where the panelists were asked to evaluate each wine in attribute intensity on a 10 cm anchored line scale (“not present” and “high” for all attributes besides viscosity, for which the anchors were “watery” and “very viscous”). Panelists expectorated each wine and cleansed their palates with ambient temperature water and unsalted crackers during a 1-min break between wine samples to limit carry over.
Afterward, panelists were directed to another booth to evaluate the color of each wine. The wine poster Les couleurs du vin (Bouchard Ainé & Fils) was used to assess each wine as described in Casassa et al. [24]. The panelists were asked to blindly match each wine with one of the 42 red wine color examples on the poster. Wines were analyzed under vertically mounted halogen lights at a 45° angle and in the direct line of sight. Panelists were asked to compare each wine side by side with the poster. All sensory data were collected using FIZZ software.

2.5. Statistical Analysis

Sample means and standard deviations were calculated using Microsoft Excel (Microsoft, Redmond, Washington, DC, USA), and all other statistical analysis was performed using R (RStudio version 1.2.5042, R version 3.6.1 https://www.rstudio.com (accessed on 26 November 2021)) with an alpha of 0.05. Chemical analysis was conducted through a one-way analysis of variance (ANOVA) and a post-hoc Tukey Honest significance (HSD) test. For sensory analysis, significance was tested by multivariate analysis of variance (MANOVA) for the overall treatment effect, and then by a three-way ANOVA with two-way interactions. If there was a significant wine to judge interaction and wine to replication interaction, a pseudo-mixed model ANOVA was performed to determine if the wine effect was truly significant in the sensory analysis. Principal component analysis (PCA) was used to determine the variance in the volatile analysis. Multiple factor analysis (MFA) was used to determine the variance between samples for chemical and sensory analysis.

3. Results

3.1. Basic Grape Chemical Composition at Harvest

In Table 1, the harvest dates and basic chemical composition for each treatment (RB(−), RB(+), RB(+) S and, RB(+) 2H) are shown. In 2017, CS 420A RB(+) 2H grapes were harvested after the Northern California wildfires and 10 days of smoke exposure, which potentially led to smoke impacted wines. It was observed that in all cases but CS 420A in 2017, RB(+) 2H grapes were significantly higher in TSS than RB(+) grapes, which were harvested at the same time as healthy fruit (RB(−)). However, CS 110R RB(+) 2H grapes in both years were not able to meet similar TSS as RB(−) grapes. In general, pH was lower, and TA and malic acid were higher in RB(+) compared to RB(−) grape juice, corresponding to a delay in ripening. The RB(+) 2H grape juice, in general, showed higher pH values and decreased TA and malic acid concentrations when compared to RB(+). No significant trend for YAN levels was observed.

3.2. Phenolic Extractability

The graphs of total anthocyanin and total tannin concentrations are respectively shown in Figure 1a,b for all wine treatments for CS 110R and 420A in 2016. Figure 1c,d respectively portray total anthocyanin and total tannin concentrations for CS 110R and 420A in 2017. Significant differences among treatments were calculated for anthocyanin concentrations (Supplemental Table S1) and tannin concentrations (Supplemental Table S2). In general, total anthocyanin concentrations in RB(−) grape musts were significantly higher than the other treatments towards the end of fermentation across season and rootstock (Figure 1a,c and Supplemental Table S1). The anthocyanin profile of fermenting grape musts (Figure 1 and Supplemental Tables S1 and S2) indicated that a delayed harvest of diseased fruit increased the extractability of anthocyanins when compared to RB(+) fruit.
It was observed for RB(+) 2H grapes that dehydration in the berry led to significantly smaller berry mass and increases in sugar content (data not shown). It was hypothesized that the higher sugar concentration, resulting in higher alcohol content during fermentation, led to higher extraction of anthocyanins into the final wines. Therefore, in 2017, chaptalization was performed, aiming for the TSS of the RB(−) grapes, to investigate this possibility. However, as indicated by Figure 1, chaptalization of diseased grape must did not increase anthocyanin extraction and was statistically similar to RB(+) wines at the end of fermentation.
Overall, RB(−) wines were significantly higher in tannin concentrations at the end of fermentation when compared to the other treatments, which were all similar. Although the harvest date was one to two weeks later, tannin concentrations for RB(+) 2H and RB(+) wines were generally statistically similar through fermentation, except for CS 110R in 2016.

3.3. Final Wine Composition

3.3.1. Chemical Parameters at Bottling

Table 2 depicts the percentage alcohol (% v/v), pH, TA, and residual sugar (RS) for all wine treatments in both years. As expected, with the starting TSS values of the grape must, RB(−) was highest in alcohol content in 2016, followed by RB(+) 2H and then RB(+). Similar observations were made in 2017; however, RB(+) S wines were significantly higher in percentage alcohol than all other treatments. In general, RS was significantly lower in RB(+) than other treatments except for CS 420A in 2017.

3.3.2. Phenolic Compound Composition

Table 3 and Table 4 portray the phenolic profiles of the individual wine treatments. Total tannin, SPP, and LPP values from the protein precipitation assay are supplemental to the values of polymeric pigments and phenols from RP-HPLC analysis. In 2016, it was observed that total flavan-3-ols were significantly higher in RB(+) and RB(+) 2H wines than RB(−) wines for both rootstocks. The concentrations of flavanols and anthocyanins were generally lower in RB(+) wines than in other wine treatments. Additionally, polymeric pigment, polymeric phenol, and SPP values were significantly higher in RB(−) and RB(+) 2H wines than RB(+) wines for both rootstocks in 2016.
Overall, in 2017 the phenolic profiles of chaptalized wines were more similar to RB(−) wines than RB(+) or RB(+) 2H wines. For CS 110R, flavan-3-ol, flavanol, and anthocyanin concentrations were higher in RB(+) and RB(+) 2H wines compared to RB(−) and RB(+) S wines. In addition, RB(−) and RB(+) S wines generally were higher in concentration for polymeric pigments, polymeric phenols, and SPP values than RB(+) 2H and RB(+). For CS 420A, RB(+) S was the only treatment significantly different and lower than other wine treatments for anthocyanin concentrations.

3.3.3. Volatile Compound Composition

In 2016, 34 and 39 volatile aroma compounds were identified, and 31 and 27 were significantly different for CS 110R and CS 420A, respectively. For CS 110R and CS 420A in 2017, there was a total of 31 and 29 volatiles identified, 26 and 6 of them being significantly different, respectively. Figure 2 depicts the PCA of the volatile profiles of wines made in 2016 and 2017, with ellipses to show 95% confidence intervals. Across seasons and rootstocks, 71–86% of the variance of the volatile profiles between treatments was explained. The third principal component (PC) was able to further separate the treatments only in the case of CS 110R 2017, in which an additional 12% of the variance was explained (Supplemental Figure S1). For the PCA in Figure 2a–c and Supplemental Figure S1, the 20 highest significantly different volatile compounds that contribute to the variance between the treatments are shown. The separation between sample treatments is well displayed by plotting the variables that contribute the most variance explained in the PCA, and the separation between sample treatments is well displayed [45]. For CS 420A wines in 2017 (Figure 2d), only the six significantly different volatile compounds are plotted to show the highest degree of separation between the treatments.
In general, across season and rootstocks, RB(+) wines were negatively correlated with most of the volatile compounds. In 2016, the PCA of the volatile profiles of wines in Figure 2a,b showed that RB(+) 2H wines were differentiated from RB(+) and RB(−) wines. Esters, terpenoids, and higher alcohols (HAs), which are responsible for fruity and floral aromas, were negatively correlated with RB(+) wines and positively correlated with RB(+) 2H and RB(−) wines.
For CS 110R wines in 2017, Figure 2c indicates that RB(+) 2H and RB(+) wines were similar and were separated from RB(−) wines at the 95% confidence level. RB(+) 2H was correlated with esters and terpenoids. By plotting the third PC (Supplemental Figure S1), RB(+) S wines were separated from RB(−) wines and were positively correlated with HAs, whereas RB(−) wines were correlated with the esters, ethyl 2-methylbutanoate and ethyl 3-methylbutanoate, as well as p-cymene, and cis-2-hexen-1-ol.
For CS 420A in 2017 (Figure 2d) only RB(−) and RB(+) wines were separated on the PCA at a 95% confidence interval. RB(+) S and RB(−) wines were both highly correlated with the volatile compounds ethyl octanoate, limonene, and benzaldehyde. The confidence ellipses suggest that RB(+) and RB(+) 2H wines were not distinguishable; however, the volatile aroma compound profile of CS 420A RB(+) 2H may have been affected by the Northern California wildfires, and, therefore, no conclusions can be drawn.

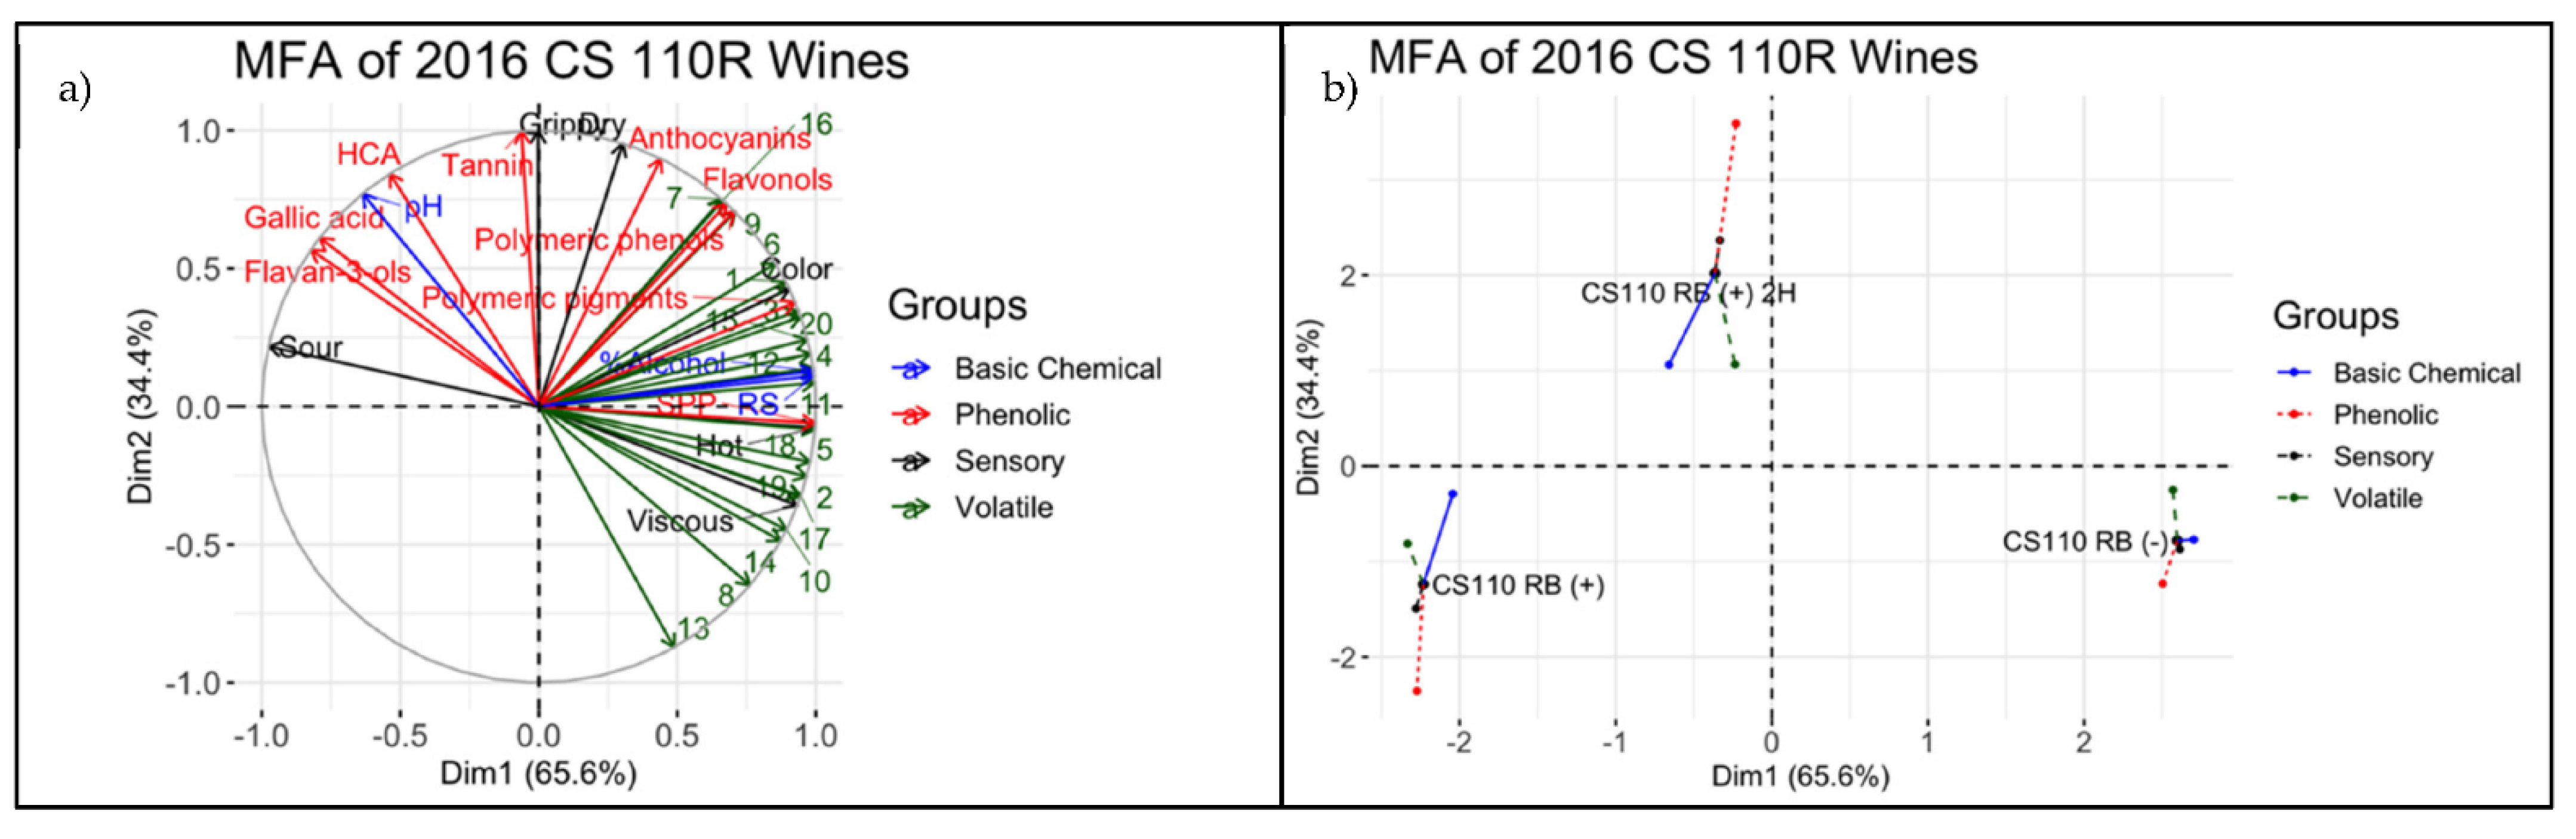
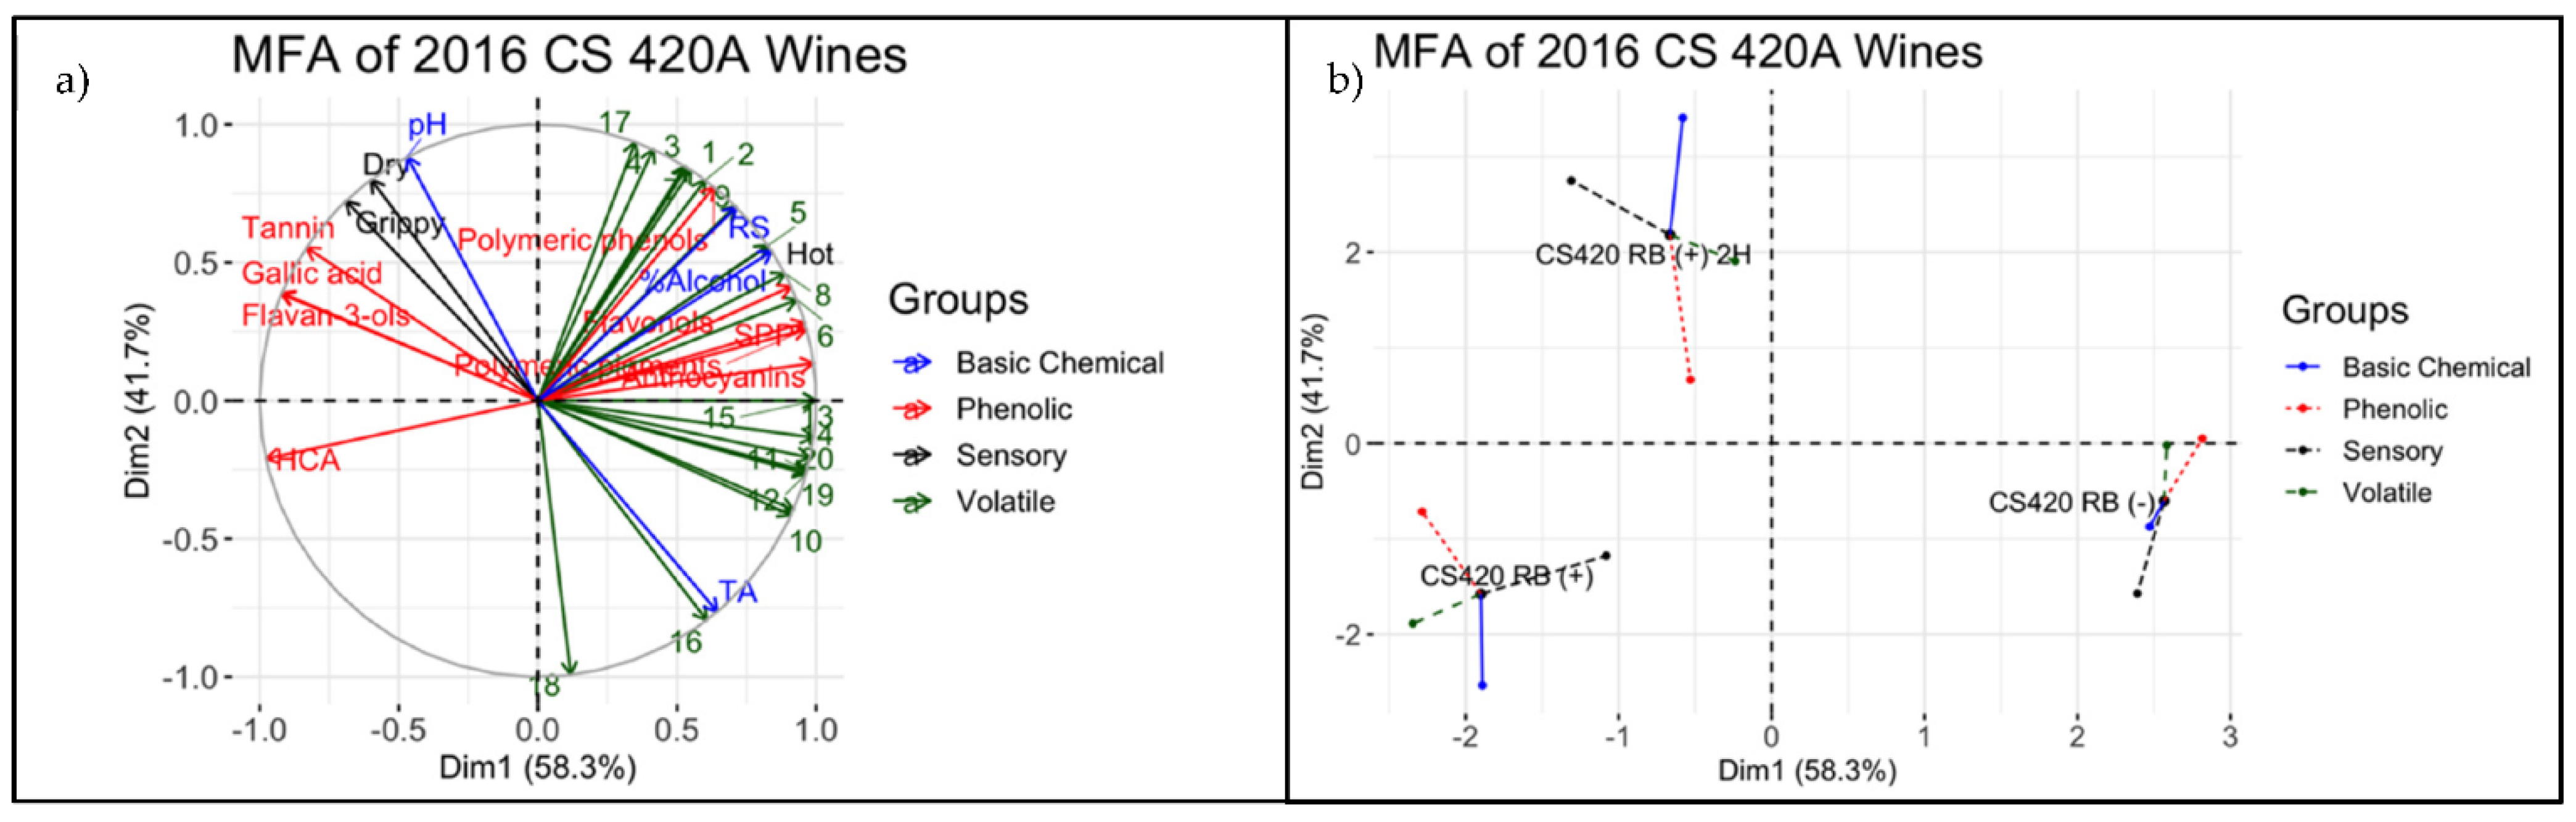
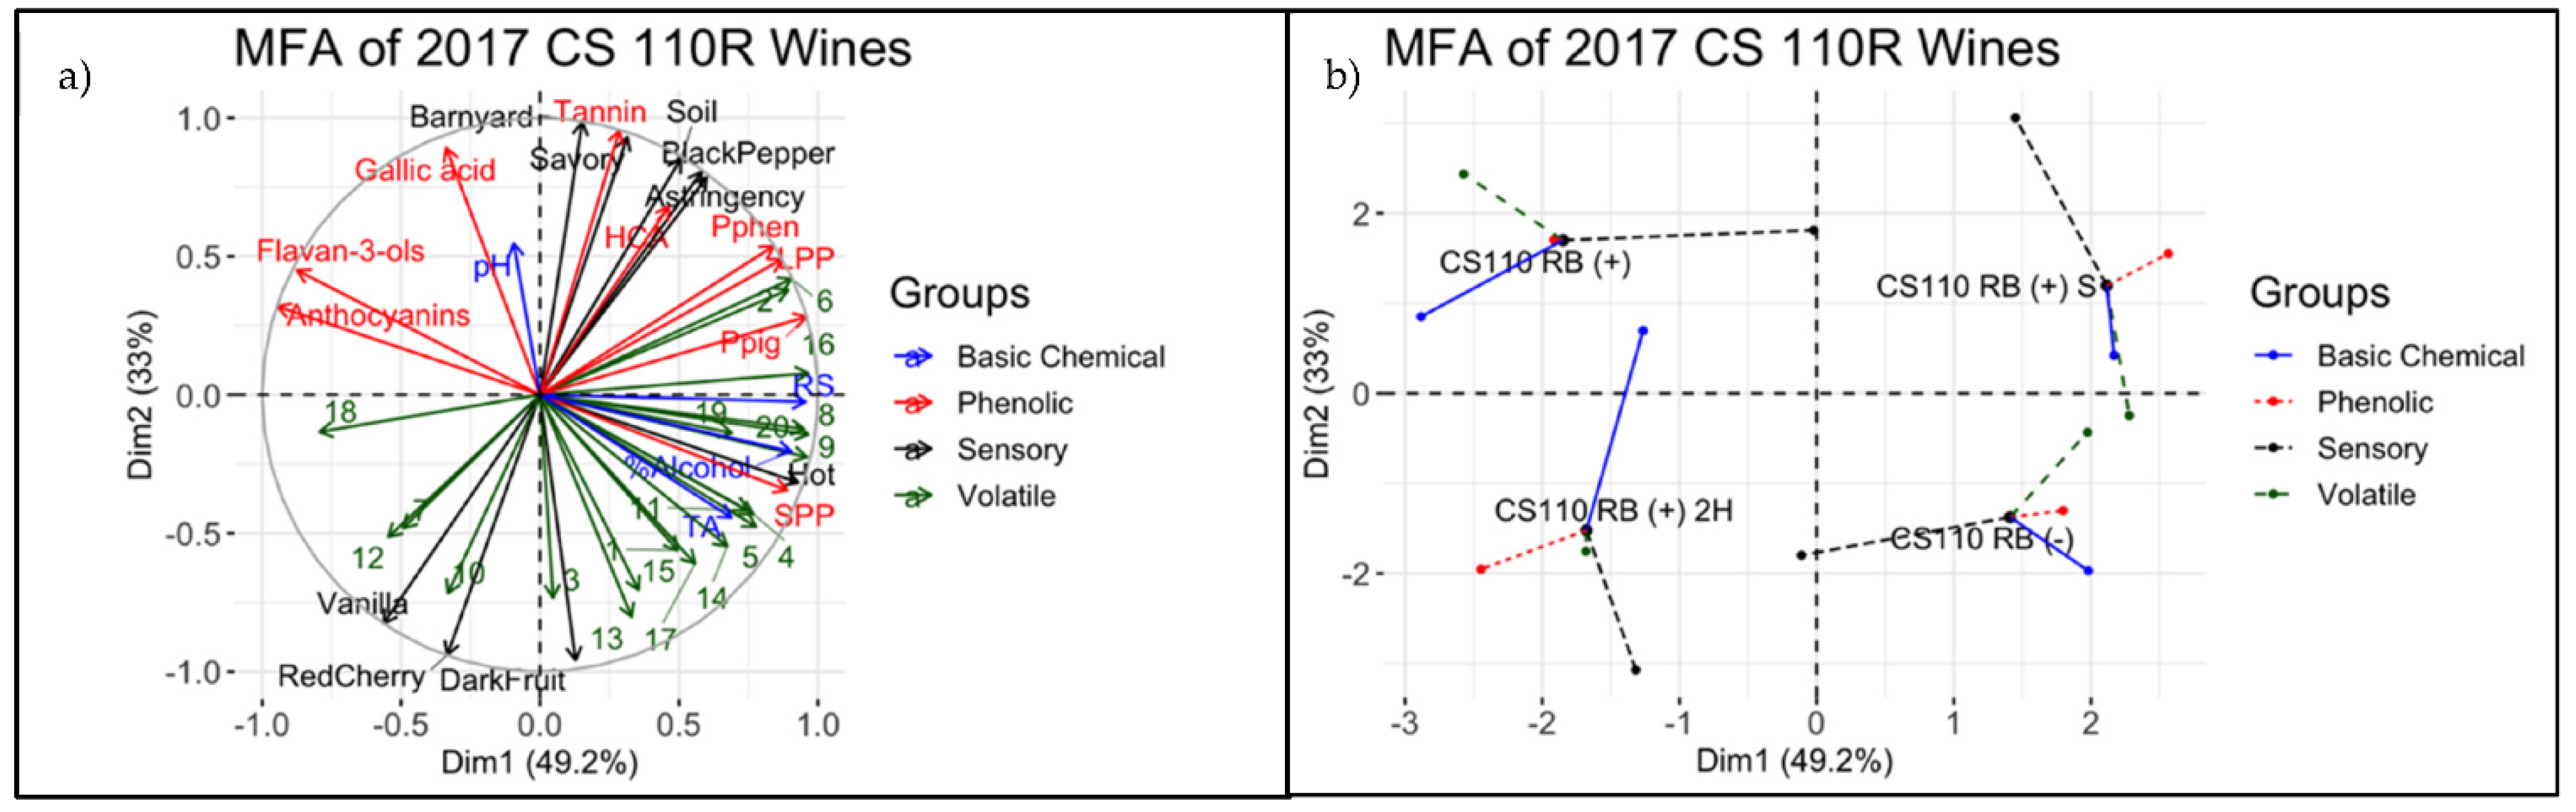
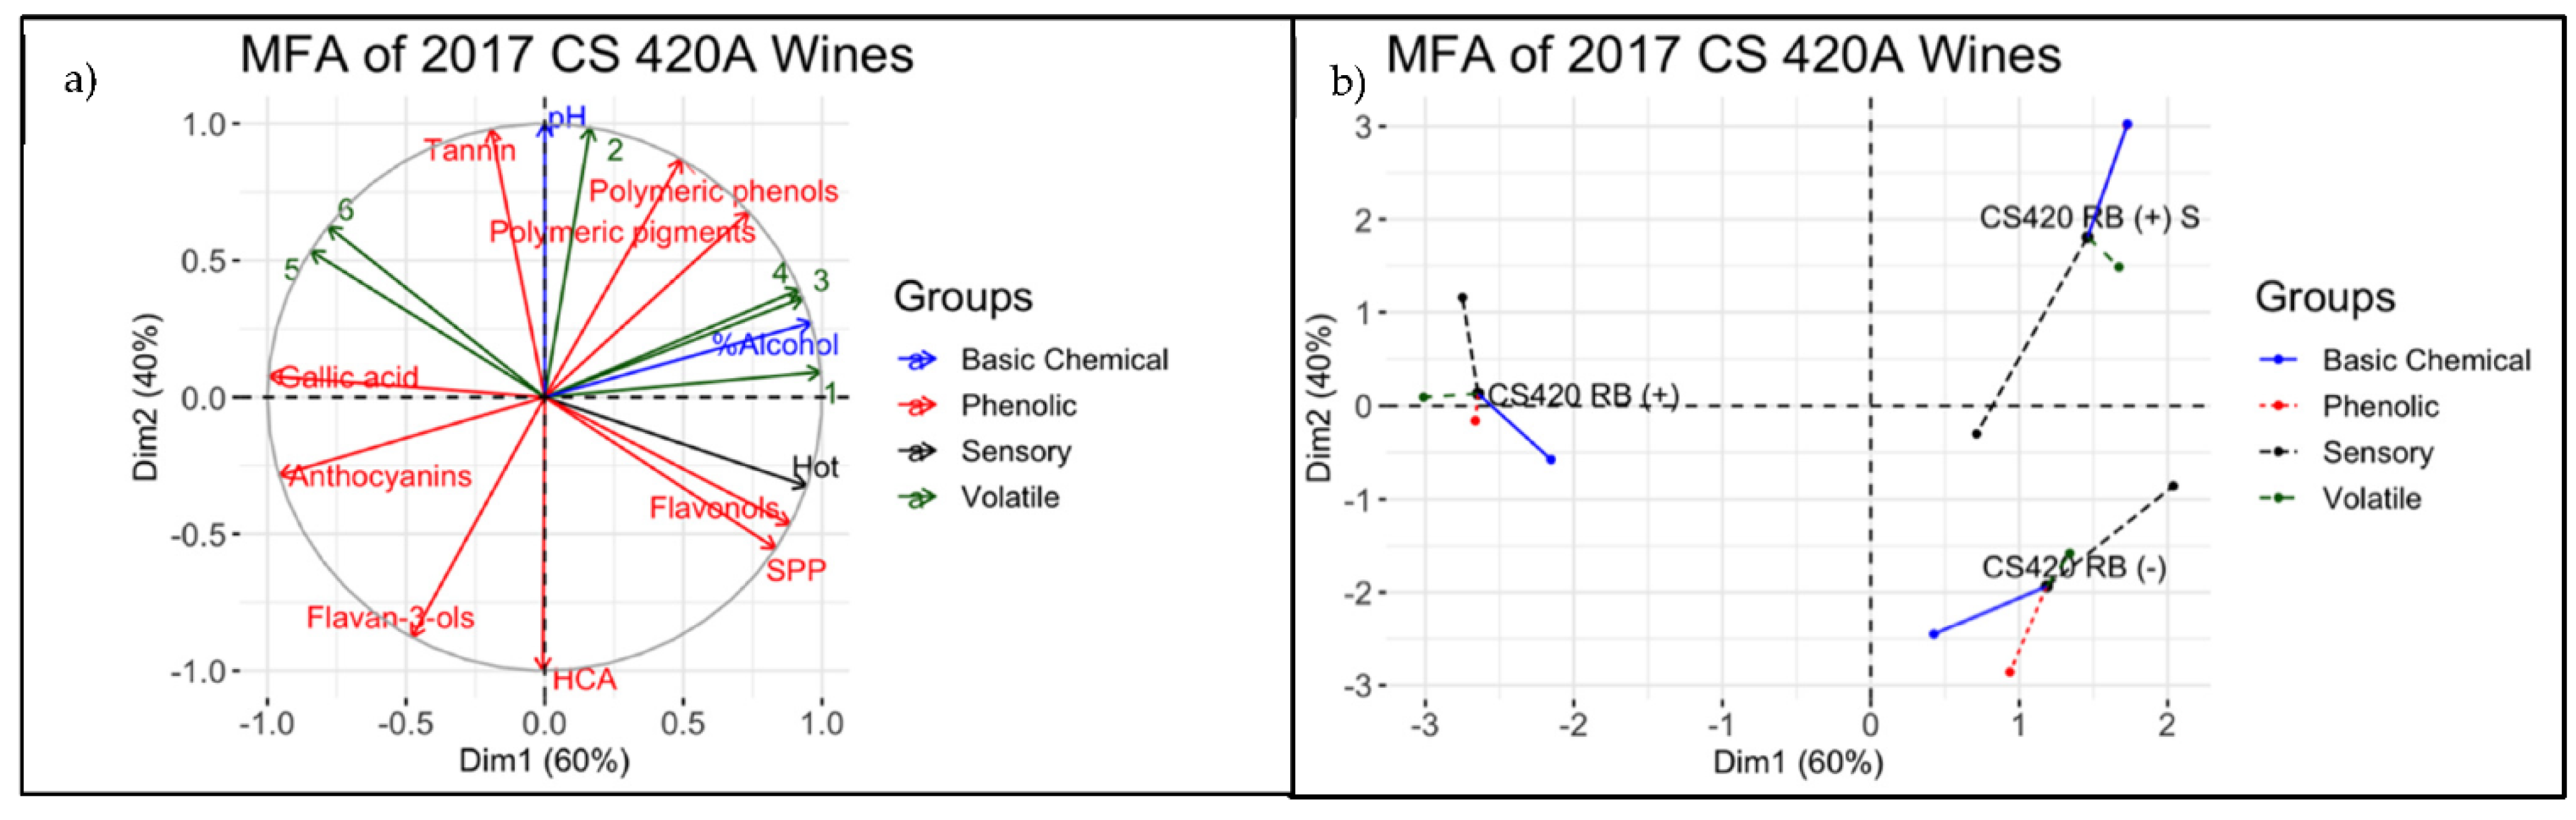
3.4. Descriptive Analysis of Final Wines

A MANOVA determined significant wine effects for all sensory evaluations, except for CS 420A in 2017. An ANOVA and MFA were still applied to analyze CS 420A data in 2017; however, this observation indicates that the panel could not distinguish between the CS 420A wines made in 2017. All sensory attributes that had a significant wine effect in the final wines in 2016 and 2017 are shown in Supplemental Table S3. In general, it was observed that panelists could distinguish between RB(−) wines and RB(+) wines, across season and rootstock. A hot mouthfeel or an alcohol aroma was higher for RB(−) wines than RB(+) wines, which was mainly significant.
For CS 110R wines in 2016, RB(−) had significantly higher values for hot mouthfeel and visual color than RB(+) wines. At the same time, RB(+) wines were rated significantly higher for sour. Panelists rated RB(+) 2H higher for dry mouthfeel than other treatments and statistically similar to RB(−) for color. RB(+) 2H wines were also found to be significantly hotter than RB(+) wines, but still lower than RB(−) wines. In the case of CS 420A wines made in 2016, RB(−) and RB(+) 2H wines were statistically similar for alcohol aroma and sweet taste, which were both higher than RB(+) wines.
In 2017, RB(−) wines were rated significantly higher for dark fruit and red cherry aromas. They were higher, although not significant for the vanilla aroma and hot mouthfeel compared to RB(+) wines. On the other hand, RB(+) wines were rated higher for barnyard, soil, savory, and black pepper aromas, as well as astringency mouthfeel than RB(−) wines, although only barnyard was significant. The panelists rated RB(+) 2H wines as statistically similar to RB(−) wines for all attributes, and RB(+) S wines as statistically similar to RB(+) wines for all attributes besides hot mouthfeel (Supplemental Table S3). For the hot mouthfeel, RB(+) S wines were significantly higher than RB(+) wines but similar to RB(−) and RB(+) 2H wines.

4. Discussion

4.1. Phenolic Extractability

The current study indicated that extending the ripening of GRBV infected grapes did increase anthocyanin extractability during winemaking. Chaptalization of diseased grape musts in 2017 did not show a similar trend, suggesting another factor besides ethanol concentration influences anthocyanin extractability. Similar findings were observed in Bautista-Ortin et al. [25], where a longer hangtime of grapes resulted in increased anthocyanin extractability during winemaking. In this work, the authors correlated their findings to changes in the grape skin cell wall. Research has shown that dehydration of berries and a longer hangtime can lead to degradation of the grape skin cell wall [46]. It is commonly accepted that pectolytic enzyme activity that degrades the cell wall increases during ripening and is positively correlated to the enhanced extractability of anthocyanins from grape skins [47]. GRBV delays grape ripening events, one potentially being cell wall metabolism, resulting in more rigid cell walls, consequently decreasing phenolic extractability. Our work potentially suggests that changes in the integrity and composition of the grape skin cell wall through a longer hangtime drive extractability during fermentation for GRBV infected grapes. Another explanation is that extended ripening concentrates secondary metabolites through dehydration, leading to a higher concentration of anthocyanins in RB(+) 2H wines compared to RB(+) and RB(+) S wines. However, an investigation into the changes in the cell wall of GRBV infected grapes through ripening and how this may impact phenolic extractability is needed.
Results in the current study indicate that RB(+) wines were significantly lower in tannin concentrations than RB(−) wines by the end of primary fermentation. This is contrary to findings in Rumbaugh et al. [17], where tannin content and concentration were higher in RB(+) grapes when compared to RB(−) grapes, which was potentially due to a host defense mechanism stimulated by GRBV infection. This suggests that although tannin grape content is higher in RB(+) grapes than RB(−), the extractability during winemaking is much lower. Previous work has indicated that tannins can bind to grape skin cell walls during fermentation [48], and that tannin extraction can increase with increases in ethanol and temperature [49]. However, in 2017 for RB(+) S wines, the concentration of tannins was similar to RB(+) and RB(+) 2H wines, indicating that a higher alcohol content did not afford higher extraction of tannins in GRBV infected fruit. Collectively these observations indicate that ethanol production during fermentation is not the only factor increasing tannin extraction of RB(−) grape musts when compared to RB(+) and RB(+) S. Research indicates that pectin and soluble proteins, namely pathogenesis-related (PR) proteins, can bind to tannins during fermentation, decreasing extraction during winemaking [31,48,50]. The impact of GRBV on grape skin cell wall composition and PR proteins has yet to be elucidated.

4.2. The Effect of Ethanol and Ripeness Stage on Wine Chemical Composition

In 2016, the extended ripening of diseased grapes showed the potential to mitigate some of the effects of GRBV on the chemical composition of the wines. RB(+) 2H wines were generally higher in phenolic concentrations than RB(+) wines, agreeing with previous work that investigated the impact of a longer hangtime of grapes on phenolic composition in wines [24,25,34]. However, unlike results in 2016, tannin levels in 2017 were significantly lower in RB(+) 2H when compared to RB(+) and RB(+) S, which were previously similar during fermentation (Figure 1). In 2017, RB(+) 2H grapes were harvested one to two weeks later than in 2016, potentially increasing cell wall degradation [47,50,51,52]. Increased berry senescence can increase the binding of large polymeric compounds to the grape cell wall. Therefore, although extended ripening can potentially alleviate the impact of GRBV on final wine composition, this is highly dependent on the ripening stage, where over-ripening can cause decreases in desired polymeric phenols in wines.
Overall, RB(+) wines were lower in volatile aroma compound concentrations than RB(−) wines, agreeing with previous results regarding the volatile profile of grapes [17]. The current study indicates that the volatile profile of RB(+) 2H wines were generally different than those of both RB(+) and RB(−). Previous research has shown that volatile accumulation is correlated with ripening in grapes [26,27,53,54]. Studies also indicated that alcohol content plays a significant role in the production of volatiles during winemaking, through yeast metabolism and chemical reactions, as well as the volatility of aroma compounds in a final wine [55,56]. The differences in alcohol content among these wines would contribute to a difference in volatility of aroma compounds and the formation of volatile compounds during fermentation, leading to all three wines being differentiated based on volatile composition.
On the other hand, chaptalizing the GRBV grape must in 2017 increased the chemical similarity between RB(+) S and RB(−) wines. In the case of CS 110R, the increase in polymerized phenolics in these two treatments most likely is a result of the higher alcohol content, leading to a longer malolactic fermentation (MLF). Previous work investigating the effects of the duration of MLF on secondary metabolite concentrations has shown that a longer duration of MLF caused decreases in anthocyanin concentrations while increasing polymerization [36]. In addition, research indicates that a higher prefermentative Brix, and therefore higher alcohol content, did not lead to higher anthocyanin extraction, but it did increase concentrations of polymeric phenols and pigments [24,34].
The alcohol content also largely impacted the volatile profiles of the final wines. For both rootstocks in 2017, the chaptalization of wine differentiated the volatile compound profile from RB(+) wines. PCA results indicated that CS 110R RB(+) S wines positively correlated with HAs (Supplemental Figure S1). HAs are formed through yeast metabolism of either sugar or amino acids (Ehrlich mechanism). Their production is increased with higher amounts of suspended solids, such as augmented sugar due to chaptalization [57]. Depending on their concentration, these compounds are responsible for fusel oil and solvent aromas in wines [58]. On the other hand, RB(−) wines were correlated to esters formed through enzymatic or acid-catalyzed condensation reactions of carboxylic acids and alcohols, and responsible for fruity and floral aromas [57]. In the current study, the chaptalization of CS 110R diseased grape musts increased HA formation during fermentation, differentiating RB(+) S wines from RB(−) wines (Supplemental Figure S1).

4.3. Integrating Chemical and Sensorial Observations

MFA was used to visualize the correlations between chemical and sensorial observations (Figure 3, Figure 4, Figure 5 and Figure 6). Between 82 and 100% of the variance was explained in the first two dimensions across seasons and rootstocks. CS 110R in 2016 had the best correlation between chemical and sensory data, although CS 420A in 2016 and 2017 also showed correlations between sensory and basic chemical and volatile data, while CS 110R in 2017 only exhibited correlations between sensory and phenolic datasets (Supplemental Figure S2 and Supplemental Table S4) [59].
In 2016, RB(−) and RB(+) 2H were positively correlated to alcohol content, hot mouthfeel, alcohol aroma, and many of the volatile compounds responsible for the fruity or floral aromas, such as esters and terpenes. This agrees with the previous research that showed higher alcohol content is associated with fruity and floral aromas [34]. For CS 110R in 2016, the color sensory attribute was highly correlated with anthocyanin concentrations and polymeric pigments, all of which were well correlated with RB(−) and, to a lesser degree, RB(+) 2H wines. The RB(+) wines in 2016 were negatively correlated with the majority of aroma compounds, anthocyanins, and alcohol content compared to RB(−) wine and was rated lower in the related sensory attributes (Figure 3). On the other hand, in RB(+) 2H wines, total tannin concentrations and polymeric phenol concentrations were highly correlated with a dry mouthfeel, indicating a delayed harvest can lead to higher tannin levels and higher astringency in wines [22]. For CS 420A in 2016 (Figure 4a,b), RS and sweet taste were positively correlated with RB(−) and RB(+) 2H, and negatively correlated with RB(+) wines. All wines were dry with less than 0.2 g/L of RS. Therefore, the perceived sweet taste in the wines could have been related to higher ethanol concentrations, which are associated with darker fruits and perceived sweetness in wines [24,31,60].
The MFA for 110R wines in 2017 (Figure 5) could not separate the wine treatments well, which potentially is explained by their volatile and sensory profiles. RB(+) S wines were similar to RB(−) wines in terms of the volatile compound profile, yet different in terms of their sensory characteristics (Figure 2c and Supplemental Table S3), whereas RB(+) S and RB(+) wines were positively correlated with soil, barnyard, savory, and black pepper attributes and negatively correlated with vanilla, red cherry, and dark fruit (Figure 5). The latter attributes were generally rated higher by panelists for RB(−) and RB(+) 2H than for RB(+) S and RB(+) wines. Previous findings suggest an increase in ethanol concentration can be detrimental to the aromatic profile of a wine, by the overwhelming alcohol aroma masking the fruity aromas contributed by esters [55,56,61,62]. Higher ethanol concentrations have also been associated with spicy flavors, astringency, and hot mouthfeel [34]. In addition, the higher concentration of HAs in RB(+) S wines are known to suppress fruity characteristics in wines [63]. These results suggest that although chemically the chaptalization of first harvested GRBV impacted grapes produced wines similar to RB(−) wines, the alcohol content may have been high enough to mask aromas from panelists’ perceptions.

5. Conclusions

This study investigated two potential mitigation strategies for GRBV: chaptalization and extending the ripening time of GRBV impacted grapes. Through chemical and sensorial analysis of the wines, it was determined that although chaptalization was able to increase the concentration of esters, terpenes, and HAs, this did not translate into fruitier aromas detected by sensory panelists. Overall, the chaptalized wines led to a decrease in anthocyanin concentrations, but an increase in polymeric pigments, which were similar to RB(−) wines. Therefore, although chemically the chaptalization of first harvested diseased grapes produced wines that were similar to RB(−) wines, panelists did not rate them similarly.
On the other hand, the sensory analysis found that a delayed harvest was able to increase the similarities between healthy and diseased grapes. Moreover, delayed harvest consistently increased concentrations of volatile and phenolic compounds compared to RB(+) wines. However, it is unknown whether this was driven by changes in the grape skin cell wall integrity and composition. Further research is needed to understand how GRBV alters grape skin cell walls during ripening.

Supplementary Materials

The following are available online at https://www.mdpi.com/article/10.3390/beverages7040076/s1, Table S1. Total anthocyanin concentrations (mg/L) during fermentation via Wine X-ray analysis for wines in 2016 and 2017 (n = 3); Table S2. Total tannin concentrations during fermentation by Wine X-ray analysis for wines in 2016 and 2017 (n = 3); Table S3. Significantly different sensory attributes of wines made in 2016 and 2017 as determined through descriptive analysis; Table S4. RV coefficients to compare each data set in the multifactor analysis of each rootstock and season. Significant RV coefficients are indicated in bold lettering; Table S5. List of sensory attributes that were used in 2016 and the recipes to make each standard; Table S6. List of sensory attributes that were used in 2017 and the recipes to make each standard. Figure S1. Principal component analysis of the first and third dimensions for volatile compounds in CS 110R wines made in 2017. Ellipses are drawn to 95% confidence with an n = 6 for two bottle replicates for each fermenter replicate. Only the highest 20 significant volatile compounds that contribute to the variance are plotted. CS110 = Cabernet Sauvignon 110R, RB = red blotch, (−) = negative, (+) = positive, 2H = second harvest, S = chaptalization; Figure S2. Multifactor analysis of the groups of variables that were used to analyze the wines: sensory profile volatile profile, phenolic profile, and basic chemical parameters at bottling. (a) CS 110R wines made in 2016, (b) CS 420A wines made in 2016, (c) CS 110R wines made in 2017, and (d) CS 420A wines made in 2017. CS110 = Cabernet Sauvignon 110R, and CS420 = Cabernet Sauvignon 420A.

Author Contributions

C.B., H.H. and A.O. conceived and planned the experiments. A.R., R.C.G., C.B. and A.O. processed the grapes and made the wines. A.R. and R.C.G. carried out sample collection and data acquisition for grapes and wines. A.C., H.H. and A.O. designed the sensory evaluations. A.R., R.C.G. and A.C. conducted the sensory evaluations. A.R., R.C.G., H.H. and A.O. contributed to interpretation of the results. A.R. took the lead in writing the manuscript. All authors provided critical feedback and helped shape the research, analysis, and manuscript. All authors have read and agreed to the published version of the manuscript.

Funding

The authors thank the American Vineyard Foundation (AVF (Grant number 2017-1675)) and the Henry A. Jastro Scholarship for funding this work. The APC was funded by MDPI Beverages.

Institutional Review Board Statement

Not applicable.

Informed Consent Statement

Not applicable.

Acknowledgments

The authors thank the Agricultural and Environmental graduate group, the Horticulture and Agronomy graduate group, and the Viticulture and Enology Department at UC Davis. In addition, they thank the employees of the LEED Platinum Teaching and Research Winery at UC Davis for their help in winemaking.

Conflicts of Interest

The authors declare no conflict of interest.

Ethics Statement

All subjects gave their informed consent for inclusion prior to participating in this study. The study was conducted in accordance with the Declaration of Helsinki, and the Institutional Review Board (IRB 699890-1) approved this study as exempt with project number HRP-213.

References

  1. Dolja, V.V.; Meng, B.; Martelli, G.P. Evolutionary Aspects of Grapevine Virology. In Grapevine Viruses: Molecular Biology, Diagnostics and Management; Meng, B., Martelli, G.P., Golino, D.A., Fuchs, M., Eds.; Springer International Publishing: New York, NY, USA, 2017; pp. 659–688. ISBN 978-3-319-57706-7. [Google Scholar]
  2. Krenz, B.; Thompson, J.R.; Fuchs, M.; Perry, K.L. Complete Genome Sequence of a New Circular DNA Virus from Grapevine. J. Virol. 2012, 86, 7715. [Google Scholar] [CrossRef] [Green Version]
  3. Rwahnih, M.A.; Dave, A.; Anderson, M.M.; Rowhani, A.; Uyemoto, J.K.; Sudarshana, M.R. Association of a DNA Virus with Grapevines Affected by Red Blotch Disease in California. Phytopathology 2013, 103, 1069–1076. [Google Scholar] [CrossRef] [Green Version]
  4. Krenz, B.; Thompson, J.R.; Mclane, H.L.; Fuchs, M.; Perry, K.L. Grapevine red blotch-associated virus is widespread in the United States. Phytopathology 2014, 104, 1232–1240. [Google Scholar] [CrossRef] [Green Version]
  5. Poojari, S.; Lowery, D.T.; Rott, M.; Schmidt, A.M.; Úrbez-Torres, J.R. Incidence, distribution and genetic diversity of Grapevine red blotch virus in British Columbia. Can. J. Plant Pathol. 2017, 39, 201–211. [Google Scholar] [CrossRef]
  6. Reynard, J.; Gugerli, P. Effects of Grapevine red blotch-associated virus on vine physiology and fruit composition of field grown grapevine cv. Gamay. In Proceedings of the 18th Congress of the International Council for the Study of Virus and Virus-like Diseases of the Grapevine (ICVG), Ankara, Turquie, 7–11 September 2015; pp. 234–235. [Google Scholar]
  7. Lim, S.; Igori, D.; Zhao, F.; Moon, J.; Cho, I.-S.; Choi, G.-S. First report of Grapevine red blotch-associated virus on grapevine in Korea. Plant Dis. 2016, 100, 1957. [Google Scholar] [CrossRef]
  8. Gasperin-Bulbarela, J.; Licea-Navarro, A.F.; Pino-Villar, C.; Hernandez-Martínez, R.; Carrillo-Tripp, J. First report of grapeviné red blotch virus in Mexico. Plant Dis. 2019, 103, 381. [Google Scholar] [CrossRef]
  9. Luna, F.; Debat, H.; Gomez-Talquenca, S.; Moyano, S.; Zavallo, D.; Asurmendi, S. First report of grapevine red blotch virus infecting grapevine in Argentina. J. Plant Pathol. 2019, 101, 1239. [Google Scholar] [CrossRef] [Green Version]
  10. Marwal, A.; Kumar, R.; Paul Khurana, S.M.; Gaur, R.K. Complete nucleotide sequence of a new geminivirus isolated from Vitis vinifera in India: A symptomless host of Grapevine red blotch virus. Virusdisease 2019, 30, 106–111. [Google Scholar] [CrossRef] [PubMed]
  11. Yepes, L.M.; Cieniewicz, E.; Krenz, B.; McLane, H.; Thompson, J.R.; Perry, K.L.; Fuchs, M. Causative Role of Grapevine Red Blotch Virus in Red Blotch Disease. Phytopathology 2018, 108, 902–909. [Google Scholar] [CrossRef] [Green Version]
  12. Calvi, B.L. Effects of Red-leaf Disease on Cabernet Sauvignon at the Oakville Experimental Vineyard and Mitigation by Harvest Delay and Crop Adjustment; University of California, Davis: Davis, CA, USA, 2011. [Google Scholar]
  13. Sudarshana, M.R.; Perry, K.L.; Fuchs, M.F. Grapevine Red Blotch-Associated Virus, an Emerging Threat to the Grapevine Industry Mysore. Phytopathology 2015, 1026–1032. [Google Scholar] [CrossRef] [PubMed] [Green Version]
  14. Girardello, R.C.; Cooper, M.L.; Smith, R.J.; Lerno, L.A.; Bruce, R.C.; Eridon, S.; Oberholster, A. Impact of Grapevine Red Blotch Disease on Grape Composition of Vitis vinifera Cabernet Sauvignon, Merlot, and Chardonnay. J. Agric. Food Chem. 2019, 67, 5496–5511. [Google Scholar] [CrossRef]
  15. Martínez-Lüscher, J.; Plank, C.M.; Brillante, L.; Cooper, M.L.; Smith, R.J.; Al-Rwahnih, M.; Yu, R.; Oberholster, A.; Girardello, R.; Kurtural, S.K. Grapevine Red Blotch Virus May Reduce Carbon Translocation Leading to Impaired Grape Berry Ripening. J. Agric. Food Chem. 2019, 67, 2437–2448. [Google Scholar] [CrossRef]
  16. Wallis, C.M.; Sudarshana, M.R.; Girardello, R.C.; Cooper, M.L.; Smith, R.J.; Lerno, L.A.; Bruce, R.C.; Eridon, S.; Oberholster, A. Effects of Grapevine red blotch-associated virus (GRBaV) infection on foliar metabolism of grapevines. Can. J. Plant Pathol. 2016, 38, 5496–5511. [Google Scholar] [CrossRef]
  17. Rumbaugh, A.C.; Girardello, R.C.; Cooper, M.L.; Plank, C.M.; Kurtural, S.K.; Oberholster, A. Impact of Rootstock and Season on Red Blotch Disease Expression in Cabernet Sauvignon (V. vinifera). Plants 2021, 10, 1583. [Google Scholar] [CrossRef] [PubMed]
  18. Girardello, R.C.; Cooper, M.L.; Lerno, L.A.; Brenneman, C.; Eridon, S.; Sokolowsky, M.; Heymann, H.; Oberholster, A. Impact of Grapevine Red Blotch Disease on Cabernet Sauvignon and Merlot Wine Composition and Sensory Attributes. Molecules 2020, 25, 3299. [Google Scholar] [CrossRef]
  19. Bowen, P.; Bogdanoff, C.; Poojari, S.; Usher, K.; Lowery, T.; Úrbez-Torres, J.R. Effects of grapevine red blotch disease on cabernet franc vine physiology, bud hardiness, and fruit and wine quality. Am. J. Enol. Vitic. 2020, 71, 308–318. [Google Scholar] [CrossRef]
  20. Coombe, B.G.; Mccarthy, M.G. Dynam ics of grape berry grow th and physiology of ripening. Aust. J. Grape Wine Res. 2000, 6, 131–135. [Google Scholar] [CrossRef]
  21. Keller, M. The Science of Grapevines: Anatomy and Physiology, 2nd ed.; Elsevier Science: San Diego, CA, USA, 2015. [Google Scholar]
  22. Bondada, B.; Harbertson, E.; Shrestha, P.M.; Keller, M. Temporal extension of ripening beyond its physiological limits imposes physical and osmotic challenges perturbing metabolism in grape (Vitis vinifera L.) berries. Sci. Hortic. (Amsterdam) 2017, 219, 135–143. [Google Scholar] [CrossRef]
  23. Coombe, B.G. The Grape Berry as a Sink. Acta Hortic. 1989, 239, 149–158. [Google Scholar] [CrossRef]
  24. Casassa, L.F.; Beaver, C.W.; Mireles, M.; Larsen, R.C.; Hopfer, H.; Heymann, H.; Harbertson, J.F. Influence of fruit maturity, maceration length, and ethanol amount on chemical and sensory properties of Merlot wines. Am. J. Enol. Vitic. 2013, 64, 437–449. [Google Scholar] [CrossRef]
  25. Bautista-Ortín, A.B.; Fernández-Fernández, J.I.; López-Roca, J.M.; Gómez-Plaza, E. The effect of grape ripening stage on red wine color. J. Int. Sci. Vigne Vin 2006, 40, 15–24. [Google Scholar] [CrossRef] [Green Version]
  26. Canuti, V.; Conversano, M.; Calzi, M.L.; Heymann, H.; Matthews, M.A.; Ebeler, S.E. Headspace solid-phase microextraction-gas chromatography-mass spectrometry for profiling free volatile compounds in Cabernet Sauvignon grapes and wines. J. Chromatogr. A 2009, 1216, 3012–3022. [Google Scholar] [CrossRef]
  27. Kalua, C.M.; Boss, P.K. Evolution of volatile compounds during the development of cabernet sauvignon grapes (Vitis vinifera L.). J. Agric. Food Chem. 2009, 57, 3818–3830. [Google Scholar] [CrossRef] [PubMed]
  28. Palomo, E.S.; Díaz-Maroto, M.C.; Viñas, M.A.G.; Soriano-Pérez, A.; Pérez-Coello, M.S. Aroma profile of wines from Albillo and Muscat grape varieties at different stages of ripening. Food Control 2007, 18, 398–403. [Google Scholar] [CrossRef]
  29. Bindon, K.; Holt, H.; Williamson, P.O.; Varela, C.; Herderich, M.; Francis, I.L. Relationships between harvest time and wine composition in Vitis vinifera L. cv. Cabernet Sauvignon 2. Wine sensory properties and consumer preference. Food Chem. 2014, 154, 90–101. [Google Scholar] [CrossRef]
  30. Lerno, L.; Reichwage, M.; Panprivech, S.; Ponangi, R.; Hearne, L.; Oberholster, A.; Block, D.E. Chemical gradients in pilot-scale cabernet sauvignon fermentations and their effect on phenolic extraction. Am. J. Enol. Vitic. 2017, 68, 401–411. [Google Scholar] [CrossRef]
  31. Bindon, K.A.; Madani, S.H.; Pendleton, P.; Smith, P.A.; Kennedy, J.A. Factors affecting skin tannin extractability in ripening grapes. J. Agric. Food Chem. 2014, 62, 1130–1141. [Google Scholar] [CrossRef] [PubMed]
  32. Medina-Plaza, C.; Beaver, J.W.; Lerno, L.; Dokoozlian, N.; Ponangi, R.; Blair, T.; Block, D.E.; Oberholster, A. Impact of temperature, ethanol and cell wall material composition on cell wall-anthocyanin interactions. Molecules 2019, 24, 3350. [Google Scholar] [CrossRef] [PubMed] [Green Version]
  33. Kassara, S.; Kennedy, J.A. Relationship between red wine grade and phenolics. 2. Tannin composition and size. J. Agric. Food Chem. 2011, 59, 8409–8412. [Google Scholar] [CrossRef] [PubMed]
  34. Sherman, E.; Greenwood, D.R.; Villas-Boâs, S.G.; Heymann, H.; Harbertson, J.F. Impact of grape maturity and ethanol concentration on sensory properties of Washington State merlot wines. Am. J. Enol. Vitic. 2017, 68, 344–356. [Google Scholar] [CrossRef]
  35. Costello, P.J.; Francis, I.L.; Bartowsky, E.J. Variations in the effect of malolactic fermentation on the chemical and sensory properties of cabernet sauvignon wine: Interactive influences of oenococcus oeni strain and wine matrix composition. Aust. J. Grape Wine Res. 2012, 18, 287–301. [Google Scholar] [CrossRef]
  36. López, R.; López-Alfaro, I.; Gutiérrez, A.R.; Tenorio, C.; Garijo, P.; González-Arenzana, L.; Santamaría, P. Malolactic fermentation of Tempranillo wine: Contribution of the lactic acid bacteria inoculation to sensory quality and chemical composition. Int. J. Food Sci. Technol. 2011, 46, 2373–2381. [Google Scholar] [CrossRef]
  37. Iland, P.; Bruer, N.; Edwards, G.; Weeks, S.; Wilkes, E. Chemical Analysis of Grapes and Wine: Techniques and Concepts; Patrick Iland Wine Promotions PTY LTD: Campbelltown SA, Australia, 2004. [Google Scholar]
  38. Skogerson, K.; Downey, M.; Mazza, M.; Boulton, R. Rapid determination of phenolic components in red wines from UV-visible spectra and the method of partial least squares. Am. J. Enol. Vitic. 2007, 58, 318–325. [Google Scholar]
  39. Harbertson, J.F.; Kennedy, J.A.; Adams, D.O. Tannin in skins and seeds of Cabernet Sauvignon, Syrah, and Pinot noir berries during ripening. Am. J. Enol. Vitic. 2002, 53, 54–59. [Google Scholar]
  40. Harbertson, J.F.; Picciotto, E.A.; Adams, D.O. Measurement of Polymeric Pigments in Grape Berry Extract sand Wines Using a Protein Precipitation Assay Combined with Bisulfite Bleaching. Am. J. Enol. Vitic. 2003, 54, 301–306. [Google Scholar]
  41. Harbertson, J.F.; Mireles, M.; Yu, Y. Improvement of BSA tannin precipitation assay by reformulation of resuspension buffer. Am. J. Enol. Vitic. 2015, 66, 95–99. [Google Scholar] [CrossRef]
  42. Peng, Z.; Iland, P.G.; Oberholster, A.; Sefton, M.A.; Waters, E.J. Analysis of pigmented polymers in red wine by reverse phase HPLC. Aust. J. Grape Wine Res. 2002, 8, 70–75. [Google Scholar] [CrossRef]
  43. Hendrickson, D.A.; Lerno, L.A.; Hjelmeland, A.K.; Ebeler, S.E.; Heymann, H.; Hopfer, H.; Block, K.L.; Brenneman, C.A.; Oberholster, A. Impact of mechanical harvesting and optical berry sorting on grape and wine composition. Am. J. Enol. Vitic. 2016, 67, 385–397. [Google Scholar] [CrossRef]
  44. Lawless, H.; Heymann, H. Sensory Evaluation of Food: Principles and Practices; Springer: New York, NY, USA, 1998. [Google Scholar]
  45. STHDA. Practical Guide to Principal Component Methods in R. 2017. Available online: http://www.sthda.com/english/wiki/practical-guide-to-principal-component-methods-in-r (accessed on 26 November 2021).
  46. Marquez, A.; Perez-Serratosa, M.; Varo, M.A.; Merida, J. Effect of temperature on the anthocyanin extraction and color evolution during controlled dehydration of tempranillo grapes. J. Agric. Food Chem. 2014, 62, 7897–7902. [Google Scholar] [CrossRef]
  47. Hernández-Hierro, J.M.; Quijada-Morín, N.; Martínez-Lapuente, L.; Guadalupe, Z.; Ayestarán, B.; Rivas-Gonzalo, J.C.; Escribano-Bailón, M.T. Relationship between skin cell wall composition and anthocyanin extractability of Vitis vinifera L. cv. Tempranillo at different grape ripeness degree. Food Chem. 2014, 146, 41–47. [Google Scholar] [CrossRef] [Green Version]
  48. Bindon, K.A.; Bacic, A.; Kennedy, J.A. Tissue-specific and developmental modifications of grape cell walls influence the adsorption of proanthocyanidins. J. Agric. Food Chem. 2012, 60, 9249–9260. [Google Scholar] [CrossRef]
  49. Beaver, J.W.; Medina-Plaza, C.; Miller, K.; Dokoozlian, N.; Ponangi, R.; Blair, T.; Block, D.; Oberholster, A. Effects of the Temperature and Ethanol on the Kinetics of Proanthocyanidin Adsorption in Model Wine Systems. J. Agric. Food Chem. 2019, 68, 2891–2899. [Google Scholar] [CrossRef] [PubMed]
  50. Springer, L.F.; Sacks, G.L. Protein-precipitable tannin in wines from Vitis vinifera and interspecific hybrid grapes (Vitis ssp.): Differences in concentration, extractability, and cell wall binding. J. Agric. Food Chem. 2014, 62, 7515–7523. [Google Scholar] [CrossRef]
  51. Bautista-Ortín, A.B.; Molero, N.; Marín, F.; Ruiz-García, Y.; Gómez-Plaza, E. Reactivity of pure and commercial grape skin tannins with cell wall material. Eur. Food Res. Technol. 2014, 240, 645–654. [Google Scholar] [CrossRef]
  52. Bautista-Ortín, A.B.; Rodríguez-Rodríguez, P.; Gil-Muñoz, R.; Jiménez-Pascual, E.; Busse-Valverde, N.; Martínez-Cutillas, A.; López-Roca, J.M.; Gómez-Plaza, E. Influence of berry ripeness on concentration, qualitative composition and extractability of grape seed tannins. Aust. J. Grape Wine Res. 2012, 18, 123–130. [Google Scholar] [CrossRef]
  53. Pedneault, K.; Dorais, M.; Angers, P. Flavor of cold-hardy grapes: Impact of berry maturity and environmental conditions. J. Agric. Food Chem. 2013, 61, 10418–10438. [Google Scholar] [CrossRef] [PubMed]
  54. Deluc, L.G.; Grimplet, J.; Wheatley, M.D.; Tillett, R.L.; Quilici, D.R.; Osborne, C.; Schooley, D.A.; Schlauch, K.A.; Cushman, J.C.; Cramer, G.R.; et al. Transcriptomic and metabolite analyses of Cabernet Sauvignon grape berry development. BMC Genomics 2013, 61, 429. [Google Scholar] [CrossRef] [PubMed] [Green Version]
  55. Goldner, M.C.; Zamora, M.C.; Lira, P.D.L.; Gianninoto, H.; Bandoni, A. Effect of ethanol level in the perception of aroma attributes and the detection of volatile compounds in red wine. J. Sens. Stud. 2009, 24, 243–257. [Google Scholar] [CrossRef]
  56. Robinson, A.L.; Ebeler, S.E.; Heymann, H.; Boss, P.K.; Solomon, P.S.; Trengove, R.D. Interactions between wine volatile compounds and grape and wine matrix components influence aroma compound headspace partitioning. J. Agric. Food Chem. 2009, 57, 10313–10322. [Google Scholar] [CrossRef] [PubMed]
  57. Waterhouse, A.L.; Sacks, G.L.; Jeffery, D.W. Understanding Wine Chemistry; John Wiley & Sons, Ltd.: West Sussex, UK, 2016; ISBN 9781118627808. [Google Scholar]
  58. Cameleyre, M.; Lytra, G.; Tempere, S.; Barbe, J.C. Olfactory Impact of Higher Alcohols on Red Wine Fruity Ester Aroma Expression in Model Solution. J. Agric. Food Chem. 2015, 63, 9777–9788. [Google Scholar] [CrossRef]
  59. Josse, J.; Pagès, J.; Husson, F. Testing the significance of the RV coefficient. Comput. Stat. Data Anal. 2008, 53, 82–91. [Google Scholar] [CrossRef]
  60. Heymann, H.; Licalzi, M.; Conversano, M.R.; Bauer, A.; Skogerson, K.; Matthews, M. Effects of extended grape ripening with or without must and wine alcohol manipulations on cabernet sauvignon wine sensory characteristics. S. Afr. J. Enol. Vitic. 2013, 34, 86–99. [Google Scholar] [CrossRef]
  61. Escudero, A.; Campo, E.; Fariña, L.; Cacho, J.; Ferreira, V. Analytical characterization of the aroma of five premium red wines. Insights into the role of odor families and the concept of fruitiness of wines. J. Agric. Food Chem. 2007, 55, 4501–4510. [Google Scholar] [CrossRef]
  62. Villamor, R.R.; Evans, M.A.; Ross, C.F. Effects of ethanol, tannin, and fructose concentrations on sensory properties of model red wines. Am. J. Enol. Vitic. 2013, 64, 342–348. [Google Scholar] [CrossRef]
  63. De-La-Fuente-Blanco, A.; Sáenz-Navajas, M.P.; Ferreira, V. On the effects of higher alcohols on red wine aroma. Food Chem. 2016, 210, 107–114. [Google Scholar] [CrossRef] [PubMed]
Figure 1. Total anthocyanin and tannin concentrations during fermentation via Wine X-ray analysis for wines in 2016 and 2017 (n = 3). (a) Total anthocyanin concentrations through fermentation in 2016; (b) total tannin concentrations through fermentation in 2016; (c) total anthocyanin concentrations through fermentation in 2017, and (d) total tannin concentrations through fermentation in 2017. CS110 = Cabernet Sauvignon 110R, CS420 = Cabernet Sauvignon 420A, RB = red blotch, (−) = negative, (+) = positive, 2H = second harvest, S = chaptalization, ME = malvidin-3-glucoside equivalents, and CE = catechin equivalents.
Beverages 07 00076 g001
Figure 2. Principal component analysis of volatile compounds in wines: (a) CS 110R wines made in 2016, (b) CS 420A wines made in 2016, (c) CS 110R wines made in 2017, and (d) CS 420A wines made in 2017. Ellipses are drawn to 95% confidence with n = 6 for two bottle replicates for each fermenter replicate. Only the highest 20 significant volatile compounds that contribute to the variance are plotted. However, 2d shows only the six volatiles that were significantly different. CS110 = Cabernet Sauvignon 110R, CS420 = Cabernet Sauvignon 420A, RB = red blotch, (−) = negative, and (+) = positive, 2H = second harvest, S = chaptalization.
Beverages 07 00076 g002
Figure 3. Multifactor analysis of 2016 Cabernet Sauvignon 110R wines which (a) displays the significant basic chemical parameters at bottling, phenolic profile, volatile profile, and sensory attributes on a loadings plot and how they separate and correlate to (b) the wine treatments plotted on a partial axes plot. For bottling values, phenolic compound values, and volatile compound values n = 6, and for sensory data n = 9. CS110 = Cabernet Sauvignon 110R, RS = residual sugar, HCA = hydroxycinnamic acids, SPP = small polymeric pigments, 1 = ethyl acetate, 2 = ethyl isobutanoate, 3 = ethyl butanoate, 4 = ethyl 2-methylbutanoate, 5 = ethyl 3-methylbutanoate, 6 = isobutanol, 7 = isoamyl acetate, 8 = α-terpinene, 9 = isoamyl alcohol, 10 = ethyl hexanoate, 11 = p-cymene, 12 = ethyl lactate, 13 = hexanol, 14 = trans-3-hexen-1-ol, 15 = cis-3-hexen-1-ol, 16 = cis-2-hexen-1-ol, 17 = ethyl octanoate, 18 = β-cyclocitral, 19 = benzyl alcohol, 20 = 2-phenylethyl alcohol, RB = red blotch, (+) = positive, (−) = negative, 2H = second harvest.
Beverages 07 00076 g003
Figure 4. Multifactor analysis of 2016 Cabernet Sauvignon 420A wines which (a) displays the significant basic chemical parameters at bottling, phenolic profile, volatile profile, and sensory attributes on a loadings plot and how they separate and correlate to (b) the wine treatments plotted on a partial axes plot. For bottling values, phenolic compound values, and volatile compound values n = 6, and for sensory data n = 9. CS 420 = Cabernet Sauvignon 420A, RS = residual sugar, TA = titratable acidity, HCA = hydroxycinnamic acids, SPP = small polymeric pigments, 1 = ethyl acetate, 2 = ethyl butanoate, 3 = isobutanol, 4 = isoamyl acetate, 5 = β-myrcene, 6 = limonene, 7 = isoamyl alcohol, 8 = p-cymene, 9 = hexyl acetate, 10 = trans-3-hexen-1-ol, 11 = cis-2-hexen-1-ol, 12 = nerol oxide, 13 = β-cycolcitral, 14 = ethyl decanoate, 15 = nerol, 16 = geraniol, 17 = benzyl alcohol, 18 = octanoic acid, 19 = 2-ethylphenol, 20 = ethyl cinnamate, RB = red blotch, (+) = positive, (−) = negative, 2H = second harvest.
Beverages 07 00076 g004
Figure 5. Multifactor analysis of 2017 Cabernet Sauvignon 110R wines which (a) displays the significant basic chemical parameters at bottling, phenolic profile, volatile profile, and sensory attributes on a loadings plot and how they separate and correlate to (b) the wine treatments plotted on a partial axes plot. Since a fermenter replicate was removed for each treatment for DA (n = 6), the same fermenter was removed when plotting the MFA for bottling values, phenolic compound values, and volatile compound values (n = 4). CS110 = Cabernet Sauvignon 110R, RS = residual sugar, TA = titratable acidity, HCA = hydroxycinnamic acids, SPP = small polymeric pigments, LPP = large polymeric pigments, 1 = ethyl acetate, 2 = ethyl isobutanoate, 3 = ethyl butanoate, 4 = ethyl 2-methylbutanoate, 5 = ethyl 3-methylbutanoate, 6 = isobutanol, 7 = isoamyl acetate, 8 = limonene, 9 = isoamyl alcohol, 10 = ethyl hexanoate, 11 = p-cymene, 12 = hexyl acetate, 13 = hexanol, 14 = trans-3-hexen-1-ol, 15 = ethyl octanoate, 16 = benzaldehyde, 17 = β-linalool, 18 = β-damascenone, 19 = benzyl alcohol, 20 = 2-phenylethyl alcohol, RB = red blotch, (+) = positive, (−) = negative, 2H = second harvest.
Beverages 07 00076 g005
Figure 6. Multifactor analysis of 2017 Cabernet Sauvignon 420A wines which (a) displays the significant basic chemical parameters at bottling, phenolic profile, volatile profile, and sensory attributes on a loadings plot and how they separate and correlate to (b) the wine treatments plotted on a partial axes plot. Since a fermenter replicate was removed for each treatment for DA (n = 6), the same fermenter was removed when plotting the MFA for bottling values, phenolic compound values, and volatile compound values (n = 4). In addition, since the second harvest was not analyzed for sensory, it is not shown here, consequently changing what values were significant. CS 420 = Cabernet Sauvignon 420A, RS = residual sugar, TA = titratable acidity, HCA = hydroxycinnamic acids, ANTH = anthocyanins, Pphen = polymeric phenols, Ppig = polymeric pigments, SPP = small polymeric pigments, 1 = limonene, 2 = hexyl acetate, 3 = ethyl octanoate, 4 = β-citronellol, 5 = phenethyl acetate, RB = red blotch, (+) = positive, (−) = negative, 2H = second harvest.
Beverages 07 00076 g006
Table 1. Chemical analysis of grape musts after destemming–crushing and sugar addition (when applicable) across years and rootstocks (n = 3).
SampleHarvest Date°BrixpHTA (g/L)YAN (mg/L)Malic Acid (mg/L)
CS110 RB(−)20 September 201625.6 ± 0.1 a3.62 ± 0.0 a3.84 ± 0.3 b81.1 ± 7.1 b1460.0 ± 55.1 c
CS110 RB(+)20 September 201621.7 ± 0.1 c3.45 ± 0. b4.75 ± 0.1 a121.8 ± 9.8 a2275.0 ± 48.6 a
CS110 RB(+) 2H27 September 201623.8 ± 0.1 b3.59 ± 0.0 a4.49 ± 0.2 a127.2 ± 7.1 a1970.3 ± 29.5 b
CS420 RB(−)20 September 201624.3 ± 0.1 a3.50 ± 0.0 b4.23 ± 0.1 b99.7 ± 2.5 a1625.7 ± 48.0 c
CS420 RB(+)20 September 201622.1 ± 0.1 b3.48 ± 0.0 b4.53 ± 0.1 a83.6 ± 17.8 a1852.0 ± 13.9 b
CS420 RB(+) 2H27 September 201623.7 ± 0.1 a3.55 ± 0.0 a4.56 ± 0.2 a104.3 ± 3.2 a1953.3 ± 56.3 a
CS110 (–)26 September 201725.5 ± 0.1 b3.62 ± 0.0 b3.97 ± 0.0 c145.9 ±0.6 b2649.3 ± 45.7 b
CS110 (+)26 September 201723.4 ± 0.0 d3.57 ± 0.0 b4.87 ± 0.1 a150.2 ±1.8 b2779.0 ± 68.6 ab
CS110 (+) S26 September 201728.2 ± 0.5 a3.57 ± 0.1 b4.83 ± 0.1 a143.7 ±6.8 b2831.7 ± 140.4 ab
CS110 (+) 2H6 October 201724.7 ± 0.2 c3.86 ± 0.0 a4.18 ± 0.1 b164.0 ±1.4 a2971.7 ± 47.7 a
CS420 (–)6 October 201725.3 ± 0.1 a3.56 ± 0.0 b4.62 ± 0.2 a127.9 ±15.9 a2201.0 ± 34.7 c
CS420 (+)6 October 201723.6 ± 0.3 b3.51 ± 0.0 b4.82 ± 0.0 a106.3 ± 4.1 a2870.0 ± 21.0 a
CS420 (+) S6 October 201725.9 ± 0.6 a3.51 ± 0.0 b4.82 ± 0.1 a111.0 ± 13.5 a2823.7 ± 16.4 a
CS420 (+) 2H17 October 201724.2 ± 0.1 b3.70 ± 0.0 a4.05 ± 0.0 b117.1 ± 2.4 a2477.0 ± 39.0 b
TA = titratable acidity, YAN = yeast assimilable nitrogen, CS110 = Cabernet Sauvignon 110R, CS420 = Cabernet Sauvignon 420A, RB = red blotch, (−) = negative, (+) = positive, 2H = second harvest, S = chaptalization. Difference in lettering indicates a significant difference between treatments in each rootstock/season combination after applying Tukey’s HSD test (p < 0.05).
Table 2. Chemical compositions of final wines in 2016 and 2017 (n = 6).
2016
110R420A
Bottling Chemical ParametersRB(−)RB(+)RB(+) 2HRB(−)RB(+)RB(+) 2H
% Alcohol (% v/v) 15.10 ± 0.20 a11.99 ± 0.24 c13.54 ± 0.09 b14.07 ± 0.18 a12.12 ± 0.18 c13.66 ± 0.09 b
pH3.55 ± 0.07 b3.6 ± 0.01 ab3.65 ± 0.03 a3.44 ± 0.04 b3.47 ± 0.01 b3.59 ± 0.05 a
TA (g/L)6.79 ± 0.21 a6.45 ± 0.12 a6.61 ± 0.13 a7.13 ± 0.21 a6.86 ± 0.04 ab6.51 ± 0.20 b
RS (g/L) 0.27 ± 0.03 a0.17 ± 0.01 c0.22 ± 0.00 b0.20 ± 0.01 a0.19 ± 0.01 b0.20 ± 0.01 a
2017
110R420A
Bottling Chemical ParametersRB(−)RB(+)RB(+) SRB(+) 2HRB(−)RB(+)RB(+) SRB(+) 2H
% Alcohol (% v/v) 15.42 ± 0.12 b13.77 ± 0.15 d16.06 ± 0.03 a14.72 ± 0.06 c15.01 ± 0.09 b14.02 ± 0.18 c15.51 ± 0.16 a14.30 ± 0.02 c
pH3.78 ± 0.05 b3.88 ± 0.01 a3.92 ± 0.04 a3.88 ± 0.03 ab3.58 ± 0.02 b3.67 ± 0.03 a3.71 ± 0.02 a3.70 ± 0.03 a
TA (g/L)6.74 ± 0.12 a5.83 ± 0.11 b6.06 ± 0.11 b5.94 ± 0.10 b6.41 ± 0.16 a6.05 ± 0.21 a6.42 ± 0.16 a6.21 ± 0.21 a
RS (g/L) 0.74 ± 0.15 a0.23 ± 0.10 b0.96 ± 0.03 a0.42 ± 0.10 b0.87 ± 0.45 a0.47 ± 0.15 a0.61 ± 0.18 a0.24 ± 0.02 a
TA = Titratable Acidity, RS = residual sugar, 110R = Cabernet Sauvignon 110R, 420A = Cabernet Sauvignon 420A, RB = red blotch, (−) = negative, and (+) = positive, 2H = second harvest, S = chaptalization. Difference in lettering indicates a significant difference between treatments of 110R and 420A respectively, after applying Tukey’s HSD test (p < 0.05).
Table 3. Phenolic profile of wines in 2016 analyzed using HPLC-DAD and spectrophotometrically (n = 6). Values for SPP, LPP, and Tannin were obtained through a modified protein precipitation assay. All other values were obtained through HPLC-DAD.
2016
110R420A
Phenolic CompoundRB(−)RB(+)RB(+) 2HRB(−)RB(+)RB(+) 2H
Total Flavan-3-ols (mg/L)29.14 ± 0.60 b32.93 ± 0.95 a33.99 ± 0.96 a30.00 ± 0.77 b33.86 ± 0.65 a34.47 ± 0.29 a
Total HCA (mg/L)33.34 ± 0.50c35.57 ± 0.06 b38.58 ± 0.92a42.79 ± 2.84 b47.68 ± 3.74 a45.41 ± 1.64 ab
Total Flavonols (mg/L)70.64 ± 5.37 a47.66 ± 2.45 b75.74 ± 1.76 a82.45 ± 1.38 a73.00 ± 2.41 b79.16 ± 1.89 a
Total Anthocyanins (mg/L)334.42 ± 16.07 b295.61 ± 15.86 c365.64 ± 8.56 a370.96 ± 4.96 a329.98 ± 20.1 b346.31 ± 23.24 ab
Gallic Acid (mg/L)7.73 ± 0.28 c10.03 ± 0.20 b10.88 ± 0.44 a7.22 ± 0.37 b9.29 ± 0.06 a9.63 ± 0.47 a
Polymeric Pigments (mg/L)20.97 ± 4.12 a10.16 ± 2.07 b18.03 ± 1.90 a18.48 ± 0.22 a14.03 ± 0.06 c16.29 ± 1.44 b
Polymeric Phenols (mg/L)233.81 ± 44.59 a136.41 ± 24.48 b250.05 ± 32.61 a232.59 ± 10.83 a198.46 ± 9.55 b237.22 ± 22.76 a
SPP (Au520)2.34 ± 0.08 a1.30 ± 0.11 c1.64 ± 0.01 b1.60 ± 0.06 a1.15 ± 0.05 c1.39 ± 0.06 b
LPP (Au520)0.72 ± 0.21 a0.29 ± 0.18 a0.70 ± 0.12 a0.55 ± 0.21 a0.50 ± 0.06 a0.55 ± 0.05 a
Tannin (mg/L CE)173.53 ± 77.14 ab154.77 ± 19.76 b405.14 ± 87.81 a386.77 ± 41.76 a456.08 ± 26.96 a488.43 ± 41.87 a
HCA = hydroxycinnamic acids, SPP = short polymeric pigments, LPP = long polymeric pigments, CE = catechin equivalents, 110R = Cabernet Sauvignon 110R, 420A = Cabernet Sauvignon 420A, RB = red blotch, (−) = negative, and (+) = positive, 2H = second harvest, S = chaptalization. Difference in lettering indicates a significant difference between treatments after applying Tukey’s HSD test (p < 0.05).
Table 4. Phenolic profile of wines in 2017 analyzed using HPLC-DAD and spectrophotometrically (n = 6). Values for SPP, LPP, and tannin were obtained through a modified protein precipitation assay. All other values were obtained through HPLC-DAD.
2017
110R420A
Phenolic CompoundRB(−)RB(+)RB(+) SRB(+) 2HRB(−)RB(+)RB(+) SRB(+) 2H
Total Flavan-3-ols (mg/L)37.98 ± 1.05 c46.45 ± 1.28 a37.93 ± 0.29 c42.26 ± 1.66 b41.94 ± 1.20 a42.14 ± 0.86 a37.65 ± 1.90 b42.01 ± 1.43 a
Total HCA (mg/L)26.89 ± 1.41 a27.39 ± 0.46 a26.22 ± 1.25 a17.17 ± 1.59 b28.99 ± 1.45 a24.03 ± 1.99 b21.55 ± 2.25 b16.40 ± 1.64 c
Total Flavonols (mg/L)36.51 ± 2.71 ab41.38 ± 2.29 a34.04 ± 2.38 b41.70 ± 7.43 a45.60 ± 3.27 ab47.36 ± 1.90 a44.14 ± 1.26 ab38.79 ± 4.47 b
Total Anthocyanins (mg/L)92.74 ± 26.48 b214.11 ± 11.70 a100.47 ± 28.10 b189.61 ± 29.54 a170.35 ± 11.66 a185.50 ± 5.43 a143.27 ± 28.5 b182.85 ± 16.75 a
Gallic Acid (mg/L)16.38 ± 0.17 c19.71 ± 0.86 a19.11 ± 0.11 a17.83 ± 0.17 b14.69 ± 0.19 b15.89 ± 0.39 a15.05 ± 0.69 b15.79 ± 0.44 a
Polymeric Pigments (mg/L)38.05 ± 11.50 a19.54 ± 0.65 b40.46 ± 4.45 a17.43 ± 6.63 b27.22 ± 5.40 ab22.17 ± 0.73 bc31.85 ± 2.64 a19.94 ± 5.57 c
Polymeric Phenols (mg/L)379.98 ± 98.00 a253.26 ± 2.36 b417.65 ± 25.17 a217.08 ± 81.58 b341.40 ± 38.37 ab298.81 ± 16.46 bc380.55 ± 31.61 a245.89 ± 68.18 c
SPP (Au520)3.14 ± 0.30 a1.50 ± 0.01 c2.53 ± 0.07 b1.74 ± 0.35 c2.49 ± 0.24 a1.47 ± 0.03 c2.00 ± 0.06 b2.00 ± 0.40 b
LPP (Au520)1.06 ± 0.72 ab0.54 ± 0.03 bc1.42 ± 0.12 a0.29 ± 0.28 c0.85 ± 0.25 ab0.65 ± 0.03 ab1.07 ± 0.09 a0.19 ± 0.32 b
Tannin (mg/L CE)297.99 ± 171.60 ab440.52 ± 33.49 a460.33 ± 25.76 a175.89 ± 133.11 b379.17 ± 61.19 b452.88 ± 37.89 ab542.14 ± 17.27 a230.01 ± 128.61 c
HCA = hydroxycinnamic acids, SPP = short polymeric pigments, LPP = long polymeric pigments, CE = catechin equivalents, 110R = Cabernet Sauvignon 110R, 420A = Cabernet Sauvignon 420A, RB = red blotch, (−) = negative, and (+) = positive, 2H = second harvest, S = chaptalization. Difference in lettering indicates a significant difference between treatments after applying Tukey’s HSD test (p < 0.05).
Publisher’s Note: MDPI stays neutral with regard to jurisdictional claims in published maps and institutional affiliations.

