Article

The Kavalactone Content and Profile of Fiji Kava Sold on the Local Market

by
Tibor Pasinszki
* and
Deepti Darshani Devi
College of Engineering, Science and Technology, Fiji National University, Suva P.O. Box 3722, Fiji
*
Author to whom correspondence should be addressed.
Beverages 2024, 10(1), 4; https://doi.org/10.3390/beverages10010004
Submission received: 11 November 2023 / Revised: 21 December 2023 / Accepted: 22 December 2023 / Published: 25 December 2023
(This article belongs to the Section Quality, Nutrition, and Chemistry of Beverages)

Abstract

:
Kava is the traditional intoxicating beverage of the Pacific with mild sedative and muscle relaxant effects, which are attributed to a group of compounds known as kavalactones. This paper aims to evaluate the quality of kava sold in the local markets of Fiji through the quantification of the six major kavalactones in kava root bundles and powdered kava packages using ethanolic extracts and HPLC. It was found in this work that kava root bundles contain mainly noble kava roots with a total kavalactone content of 8–13%; kavain had the highest concentration among kavalactones and kavain, methysticin, and yangonin together represented 69–71% of the total kavalactone content. Adulteration via mixing noble kava roots with those of non-noble kava with a relatively high dihydrokavain and dihydromethysticin content has also been observed. Powdered kava products were found to contain lower amounts of kavalactones (3–5%) with a less favorable kavalactone profile than those of root bundles, possibly due to mixing roots, rhizomes, and/or basal stems. The findings of this work, namely the variation in kavalactone content and profile in marketed products, indicate the need for rigorous quality control and quality indicators on kava commodities. Suggestions to include quantitative measures in the previously proposed chemical standardization code are also presented.

Graphical Abstract

1. Introduction

Kava is the traditional non-alcoholic social drink of the Pacific, used in ceremonies and significant events, and consumed on a regular basis at home or in urban kava bars due to its relaxing and anxiety-relieving properties [1,2,3,4,5,6]. The drink is traditionally prepared from the dried and ground roots and rhizomes of the kava plant (Piper methysticum) by soaking the powder in cold water and pressing it through a cloth strainer. Kava is now sold around the globe as a dietary supplement, herbal medicine, and anxiolytic agent in the form of dry-filled capsules, tablets, tinctures, and fluid extracts [1,7,8,9]. Although adverse health effects, like hepatotoxicity, have been reported for kava extract consumption, the moderate consumption of the traditional beverage prepared with its traditional composition is believed to be safe [1,4,8,9]. The Piper methysticum plant is a hardy, slow-growing perennial shrub. It is sterile and cultivated by propagation from stem cuttings [1,2]. Plant growth requires a high average temperature of 20–35 °C and high humidity, prefers shade and protection from wind, and grows best in well-drained, friable, and deep soils that are rich in organic matter [2]. Its traditional cultivation area is restricted to the tropical Pacific region. Kava is one of the most important agricultural products of Fiji, and Fiji is one of the main producers and exporters of kava in the world. Fiji’s dried kava production in 2021 and export in 2022 were 13,790 and 498 metric tons, with values of 965.3 and 40.7 million Fijian dollars (about USD 434 and 18 million), respectively [10,11]. Both external and internal markets require consistent quality. The quality of processed kava, however, depends on several factors such as the cultivation area (viz., climate, soil, precipitation), the variety of the plant, and production practices (e.g., plant organ used as raw material, cleaning, drying) [12]. To assist kava producers and suppliers to ensure quality, the Fiji Kava Quality Manual has been developed, focusing mainly on farming and production practices [13]. Fiji has a large internal market. Kava roots and rhizomes are sold in local markets in bundles, and packaged powdered kava produced by commercial companies are distributed in shops and supermarkets. The rigorous standardization and quality assurance of kava products is based on analytical measurements; however, this is yet to be implemented. In general, kava products are marketed by the origin of the kava plant, and consumers are expected to trust retailers and commercial companies concerning its origin and quality because the cropland, cultivar, or plant parts, as well as a mixture of plant organs, cannot be identified by visual inspection after the harvesting, drying, and grinding of the plant tissue.
Kava’s beneficial psychoactive and medicinal effects are attributed to a special class of compounds known as kavalactones (KLs). Twenty kavalactones and nine kavalactone dimers have been identified to date from P. Methysticum [14]; however, only six, the major kavalactones, account for approximately 96% of the total lipid extract from kava [2,15]. These major kavalactones are desmethoxyyangonin (1, DMY), dihydrokavain (2, DHK), yangonin (3, YAN), kavain (4, KAV), dihydromethysticin (5, DHM), and methysticin (6, METH) (Figure 1). Another group of compounds, known as flavokavains (FKs), has also been commonly found in kava but in significantly lower quantities.
The KL and FK content of kava can vary strongly depending on plant age and cultivar, ranging from 3 to 20% of the dried root weight [16]. Since each KL has a specific biological effect, not only the total but the relative amounts of KLs determine kava products’ health benefits. KAV, for example, is associated with enhanced anxiolytic and relaxing effects, while DHK and DHM are responsible for nausea and headache [1,2,12]. Kava, with the highest KAV content and relatively low DHK and DHM content, is categorized as noble kava and is, therefore, more valuable than other cultivars and the only suggested type for human consumption. Due to the key role of the six major KLs in kava’s psychoactive effect, the quality of kava is usually evaluated by the content of these lactones in various kava products. In addition, this lactone ‘fingerprint’ may be used to distinguish different kava cultivars. The current chemical quality standardization code, which is adopted in the Fiji Kava Quality Manual [13] and used in this work, was proposed by Teschke and Lebot [3,17]. This code called the chemotype or kavalactone profile, is based on assigning an identification number (ID) to each kavalactone (Figure 1) and listing the numbers of the corresponding KLs in decreasing order of their quantity. Chemotype 463251, for example, means that KAV, 4 has the highest concentration in kava, followed by METH (6), YAN (3), DHK (2), DHM (5), and DMY (1) in decreasing order of quantity. Although chemotyping is an important step towards quality assurance, it does not provide information about the relative amount of KLs; therefore, further adjustment to this code is required, and we suggest refinements and steps forward in this work.
Fiji’s kava production is mainly focused on noble kava. According to a survey conducted in 2014 in Fiji in major kava farming areas [13], there are thirteen major kava varieties in Fiji, and all of them are suitable for consumption. No single kava variety dominated any of the production areas. Kava can be purchased anywhere in Fiji, but quality codes are still not provided on kava packages and naturally not provided with kava root bundles in the market. It is not known by customers if root bundles contain a single variant, if they are mixed, or if kava powder is made from roots, rhizomes, or basal stems or from their mixtures. The aim of the current work was, therefore, to shed light on kava selling practices in the local market and to provide information on the chemical ‘fingerprint’ and quality of marketed kava concerning the kavalactone content and chemotype.

2. Materials and Methods

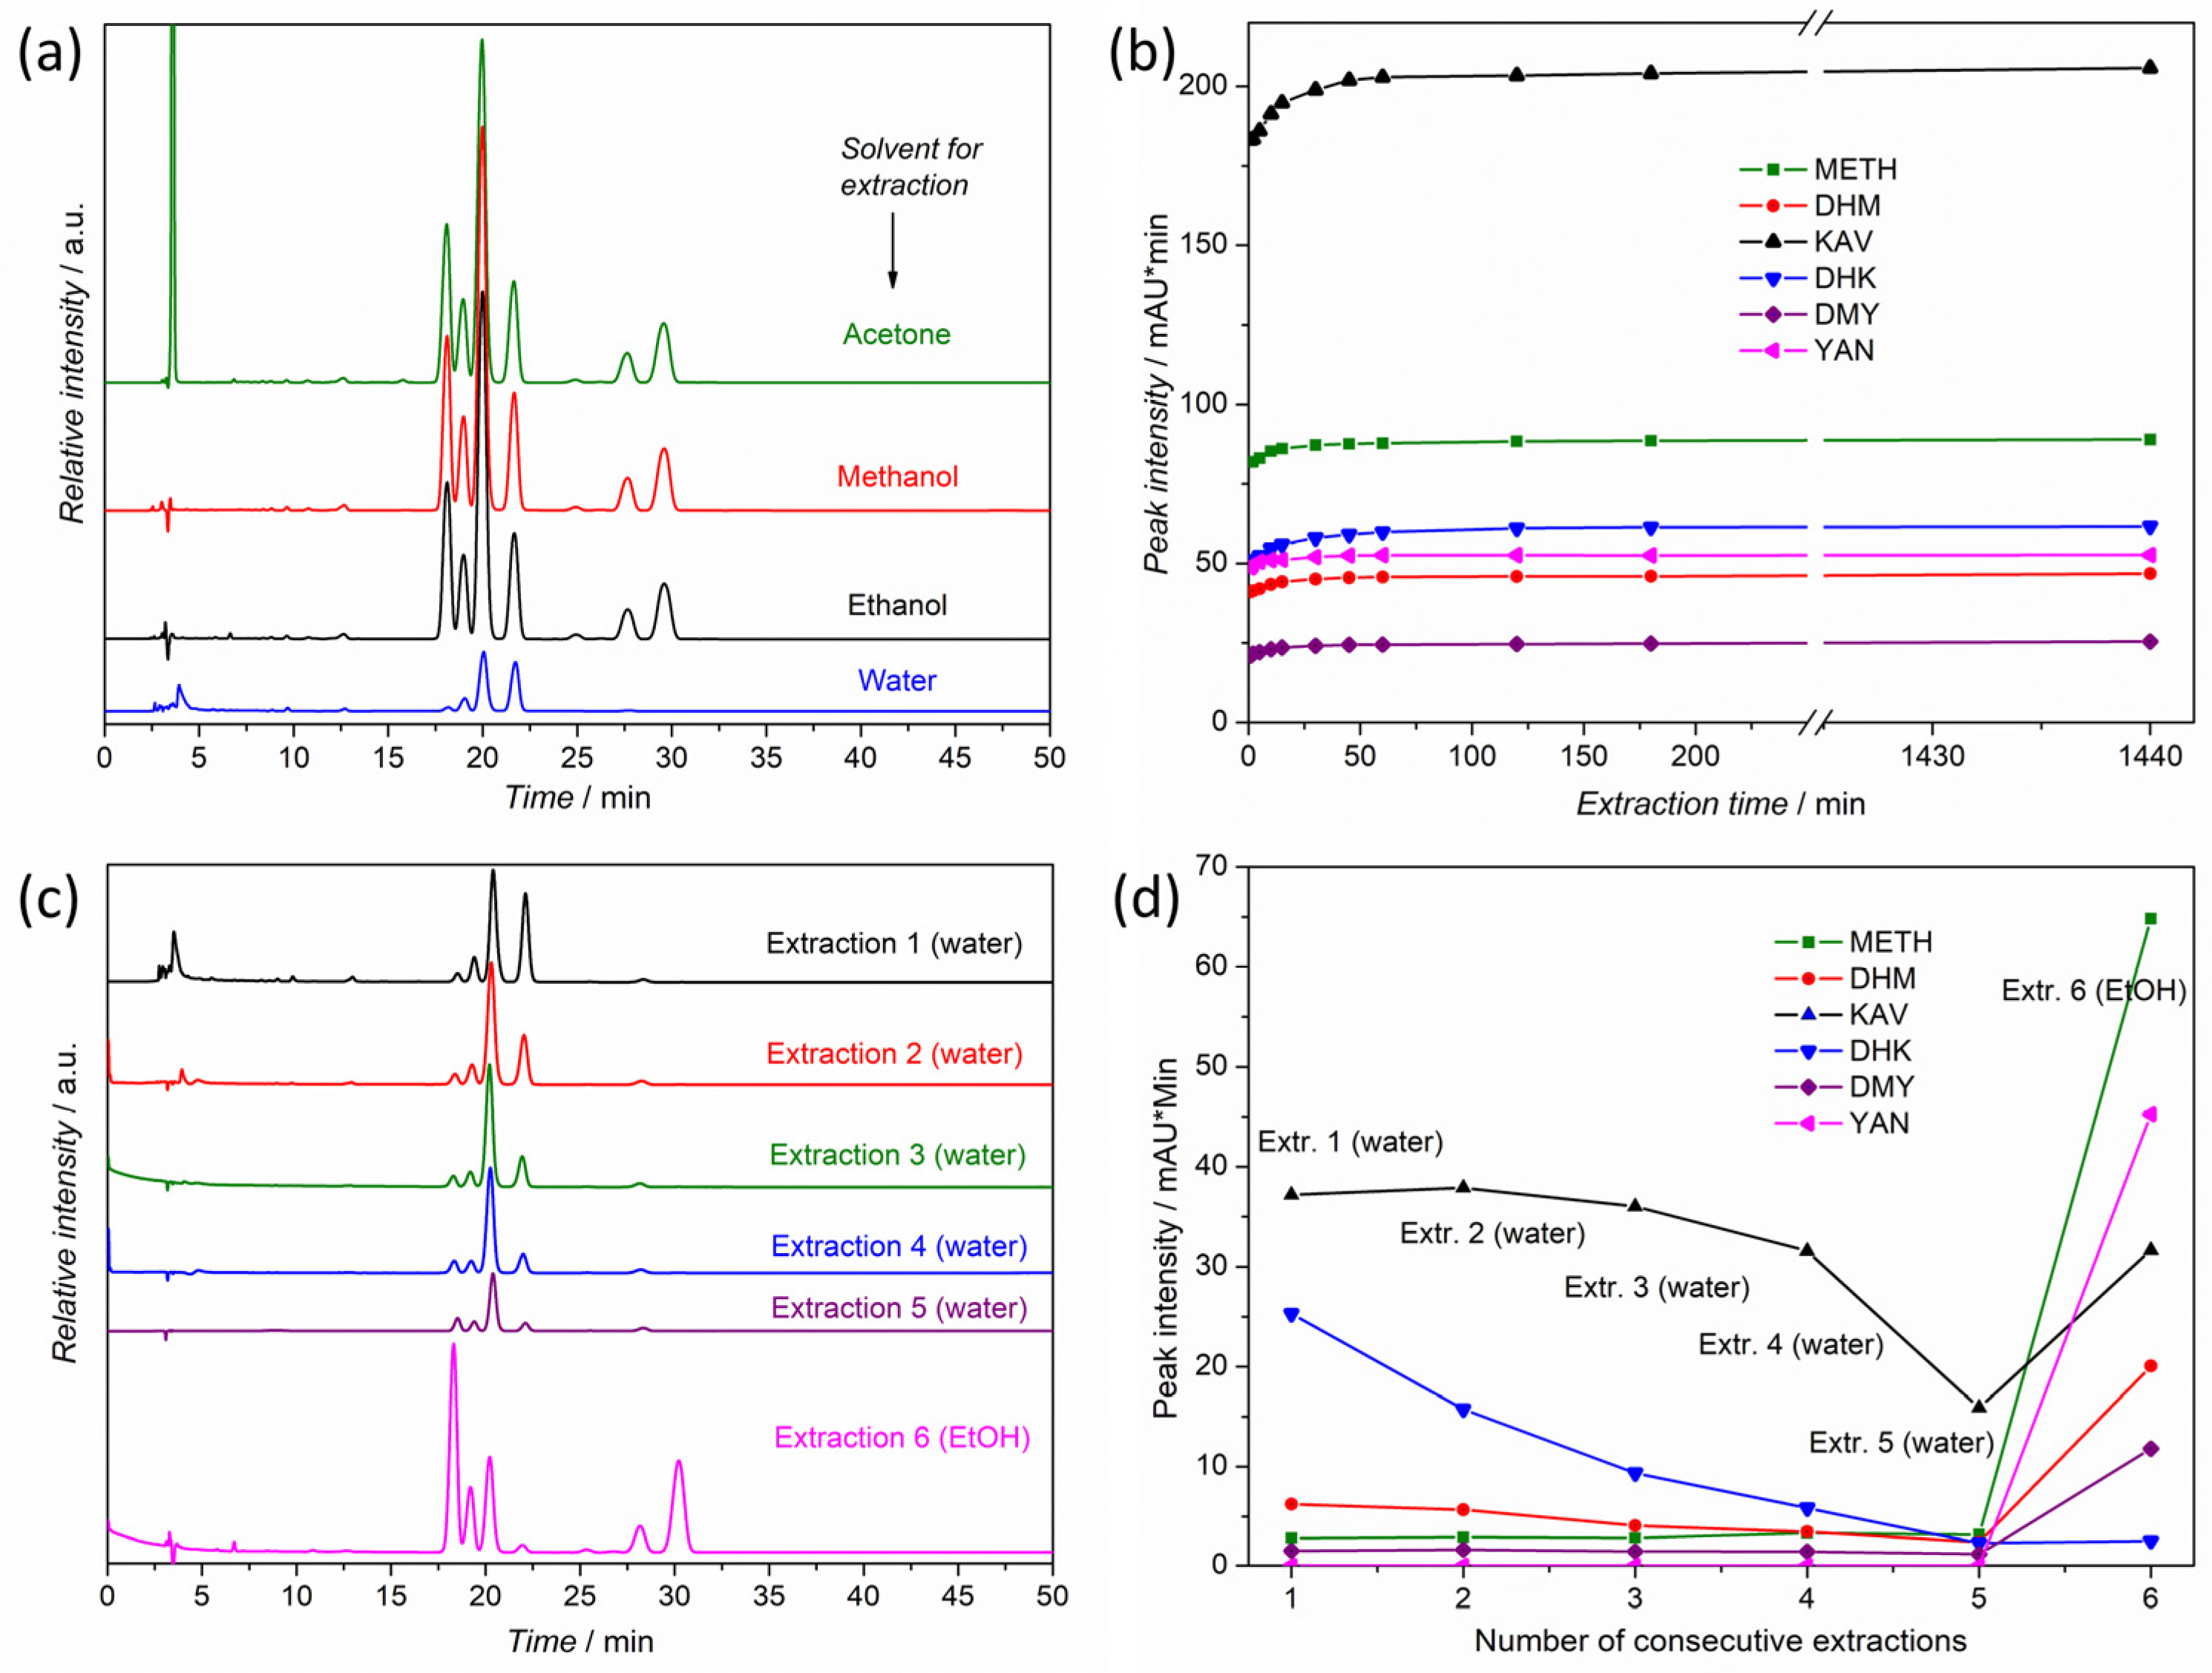
2.1. Solvents and Materials

HPLC (high-performance liquid chromatography)-grade methanol and acetonitrile- and analytical-grade absolute ethanol and acetone were purchased from Banksia Scientific (Bulimba, Australia). HPLC-grade glacial acetic acid was purchased from Thermo Fisher Scientific (Auckland, New Zealand). The six kavalactone standards were obtained from Biosynth Ltd. (Compton, UK) and MedChem Express LLC (Shanghai, China). The certified mixture of kavalactone standards in acetonitrile was supplied by the Cerilliant Corporation (Round Rock, TX, USA). Ultrapure (type 1) water with a resistivity of 18.2 MΩ·cm was produced using a Millipore Direct-Q Ultrapure water system. Packaged powdered kava from local manufacturers was purchased from the local shops in Suva (Fiji); these are numbered CKP1-8 (commercial kava powder) to keep the name of the producer confidential. Dried kava roots were purchased from local markets in Suva. The ‘false kava’ (Piper auritum Kunth) plant used in this study was grown in Taveuni and obtained from a local farmer (Taveuni, Fiji). The Piper methysticum plant (of the variant Dokobana Loa) used in this study was collected by the authors in Dakuivuna village (east Viti Levu, Fiji). The tissues of these plants were used for kavalactone quantification either directly without drying or after drying (freeze-dried or dried in a drying box at 50 °C for 2 days). Plant tissues were ground using a coffee grinder. The dried tissue was pulverized using a mortar and pestle before extraction. All samples were collected in August and September 2023.

2.2. Extraction of Kava Powders and Plant Tissues

Kava powder extraction was performed as follows: 1 g of dried kava powder, 40 mL of absolute ethanol, and a magnetic stir bar was placed into a 100 mL round bottom flask. The flask was stoppered and covered with aluminum foil to keep the suspension in the dark. Extraction was conducted at room temperature with one hour of continuous magnetic stirring. Ground plant tissues were extracted the same way but using 3 g of tissue and 40 mL of absolute ethanol. Following one hour of stirring, a 2.5 mL extract was transferred from the mixture into a centrifuge tube using a syringe, centrifuged at rpm of 4500 for 15 min, and filtered through a syringe filter disk with a pore size of 0.45 μm. The solution obtained was used for HPLC analysis. All experiments were performed in duplicate unless otherwise noted. Spiking experiments were conducted by adding a pre-prepared kavalactone mix solution to ‘false kava’ root powder or commercial kava powder and extracting them the same way as described above (see more details in the Section 3 below). Yangonin decomposition in methanol was noted previously [6,18]. We observed that yangonin was stable in an ethanolic solution in the dark; however, it was decomposed/isomerized when its solution was exposed to daylight/artificial light in the laboratory (see Supplementary Material Figure S1).

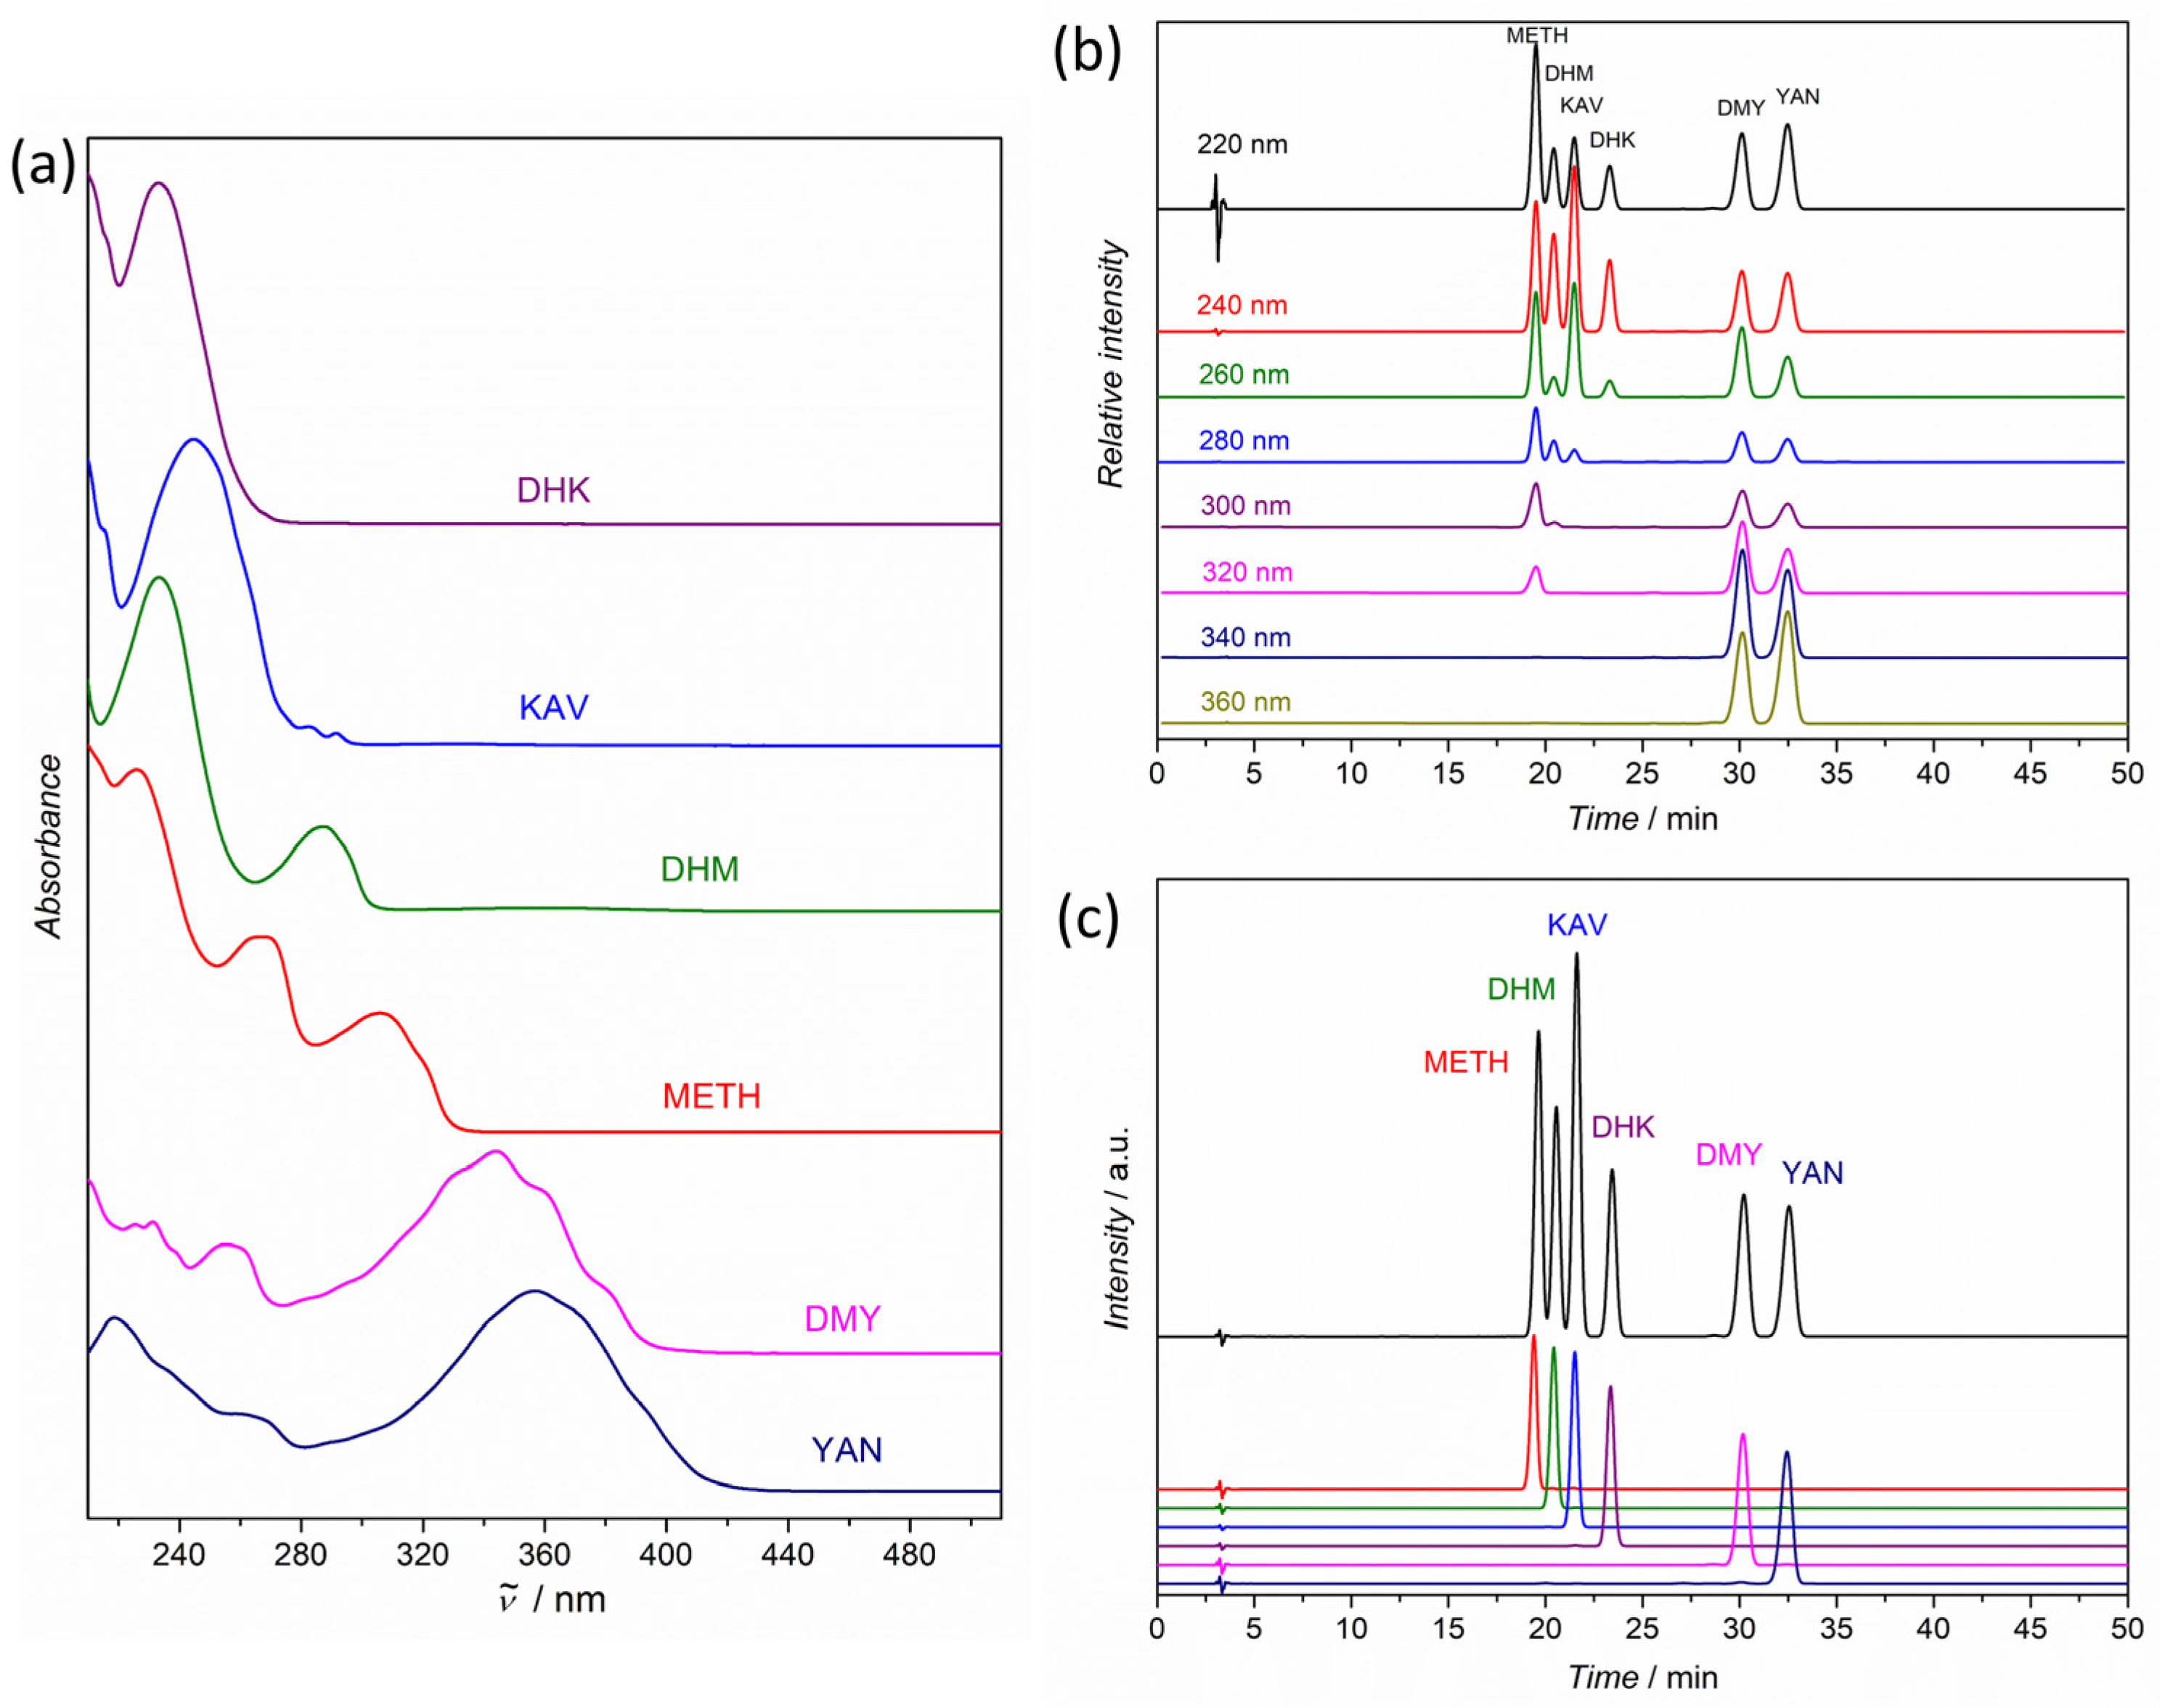
2.3. UV and HPLC Measurements

The UV/Vis spectra of the six reference kavalactones were recorded in the 190–800 nm region using a step size of 0.1 nm, absolute ethanol as the solvent, and a SP-MUV8000T Dual-beam UV/Vis spectrophotometer (wavelength accuracy: ±0.1 nm; Bioevopeak Co., Ltd., Jinan, Shandong, China). HPLC measurements were performed on a Thermo Scientific Dionex UltiMate 3000 (U)HPLC instrument equipped with a DAD-3000RS diode array UV detector (Auckland, New Zealand).
The chromatographic separations were carried out using the method of Shao et al. [19], which involved the application of a YMCbasic S-5 um reversed-phase analytical column (25 cm × 4.6 mm I.D.; 5 μm particle size; supplied by YMC Co., Ltd., Kyoto, Japan), isocratic elution using a mobile phase of water–methanol–acetonitrile–acetic acid (60:20:20:0.1 v/v%), a column temperature of 40 °C, injection at 5 μL, and a flow rate of 1 mL/min. The quantification of kavalactones was carried out at 240 nm. Calibration curves for the six kavalactones were established by the serial dilution of a kavalactone mix solution containing 4 mM of each lactone, and linearity was confirmed, covering the range of 0.01–4 mM. Calibration curves remained consistent during this study.

3. Results and Discussion

3.1. Method Selection and Validation

After the perusal of the relevant literature, reversed-phase HPLC with UV detection was concluded to be the method of choice for kavalactone quantification and was selected for this study [6]. The six major kavalactones were absorbed in the near-UV region (Figure 2a). The simultaneous detection of all kavalactones, however, required the detection wavelength to be below 270 nm (Figure 2b). Based on UV band position and absorption intensity, the wavelength of 240 nm was selected in this study for quantifying all six major kavalactones. To identify lactones in a kavalactone mixture and to obtain the order of elution on the applied HPLC column, the solutions of individual kavalactones were also investigated (Figure 2c). Kavalactones were numbered according to the code proposed by Teschke and Lebot [3,17] (Figure 1).
Since there is no consensus concerning the selection of the solvent for kava extraction [6,8,12,20,21,22], the three most used organic solvents, acetone, ethanol, and methanol, as well as water, were tested for kavalactone extraction. We noted that the solvent, kava/solvent ratio, the grain size of the powder, together with extraction time, played a role in the efficiency of extraction. Concerning our experimental set-up, one hour extraction time was found to be sufficient for the extraction of kavalactones from finely ground kava powder using acetone, ethanol, and methanol, and confirmed by the repeated extraction of depleted kava powder separated via centrifugation. These three solvents were found to be equally efficient for the extraction of the six major kavalactones, as chromatograms of extracts were identical (Figure 3a). Since ethanol is less volatile than methanol and acetone and less poisonous than methanol, it was selected as the extractant for this study. The extraction with these solvents was observed to be relatively fast, as shown for ethanol in Figure 3b using a commercial kava powder; more than 90% of KLs were extracted within a couple of minutes by stirring the mixture. Water, however, was confirmed to be a poor solvent for the extraction of KLs; five consecutive extractions of 1 g of kava powder using 40 mL of water in each step were insufficient to extract all KLs (Figure 3c,d) due to KLs’ limited solubility [4] and sluggish dissolution at room temperature. YAN had the lowest solubility (see Figure 3c) and possibly contributed to the physiological effect of kava drinks through the digestion of fine solid kava particles, usually unfiltered during the preparation of the kava drink.
The precision of the chromatographic measurement was evaluated by performing five replicate analyses of a kavalactone mix in abs. ethanol (4 mM for each lactone) within the same working day. Relative standard deviations (RSDs) were below 1% (0.8, 0.7, 0.8, 0.7, 0.8, and 0.8 for METH, DHM, KAV, DHK, DMY, and YAN, respectively). This experiment was repeated the following day but using a different solution containing 0.004 mM of kavalactones; RSDs were 0.8, 1.0, 0.9, 0.9, 0.5, and 0.7% for METH, DHM, KAV, DHK, DMY, and YAN, respectively. The precision of the analytical procedure (extraction plus HPLC analysis) was evaluated by quantifying the kavalactone content of a commercial kava powder. RSDs were found to be 2.2, 0.9, 0.8, 0.7, 0.7, and 0.9% for METH, DHM, KAV, DHK, DMY, and YAN, respectively, suggesting that this method has excellent performance. The instrumental Limit of Detection (LOD) was calculated by multiplying the standard deviation of seven replicate measurements of a standard solution containing very low (0.004 mM) concentrations of each analyte with Student’s t-statistic value (3.143) for a one-tailed test at the 99% confidence level (α = 0.01) with 7 − 1= 6 degrees of freedom [23]. The LOD for METH, DHM, KAV, DHK, DMY, and YAN was 0.10, 0.27, 0.11, 0.06, 0.03, and 0.05 μg/mL, respectively. The Limit of Quantification (LOQ) can be calculated as 3.33·LOD. We noted that kava extracts in this work typically had kavalactone concentrations about two orders of magnitude higher than LOQs.
The recovery of the six reference kavalactones was determined via the following two methods: (1) ‘false kava’ root powder which does not contain kavalactones was spiked with a kavalactone mix solution (0.016 mmol, 3.7–4.4 mg, of each kavalactone/1 g kava powder) and extracted, or (2) commercial kava powder (traditional grind) was extracted without spiking and after spiking (the mean lactone values of triplicate experiments without spiking were used as a reference in spiked experiments) (Figure 4a). The recoveries for METH, DHM, KAV, DHK, DMY, and YAN in ‘false kava’ and kava root powder spiking were 98, 99, 100, 99, 99, and 97% and 97, 102, 104, 103, 102, and 102%, respectively.

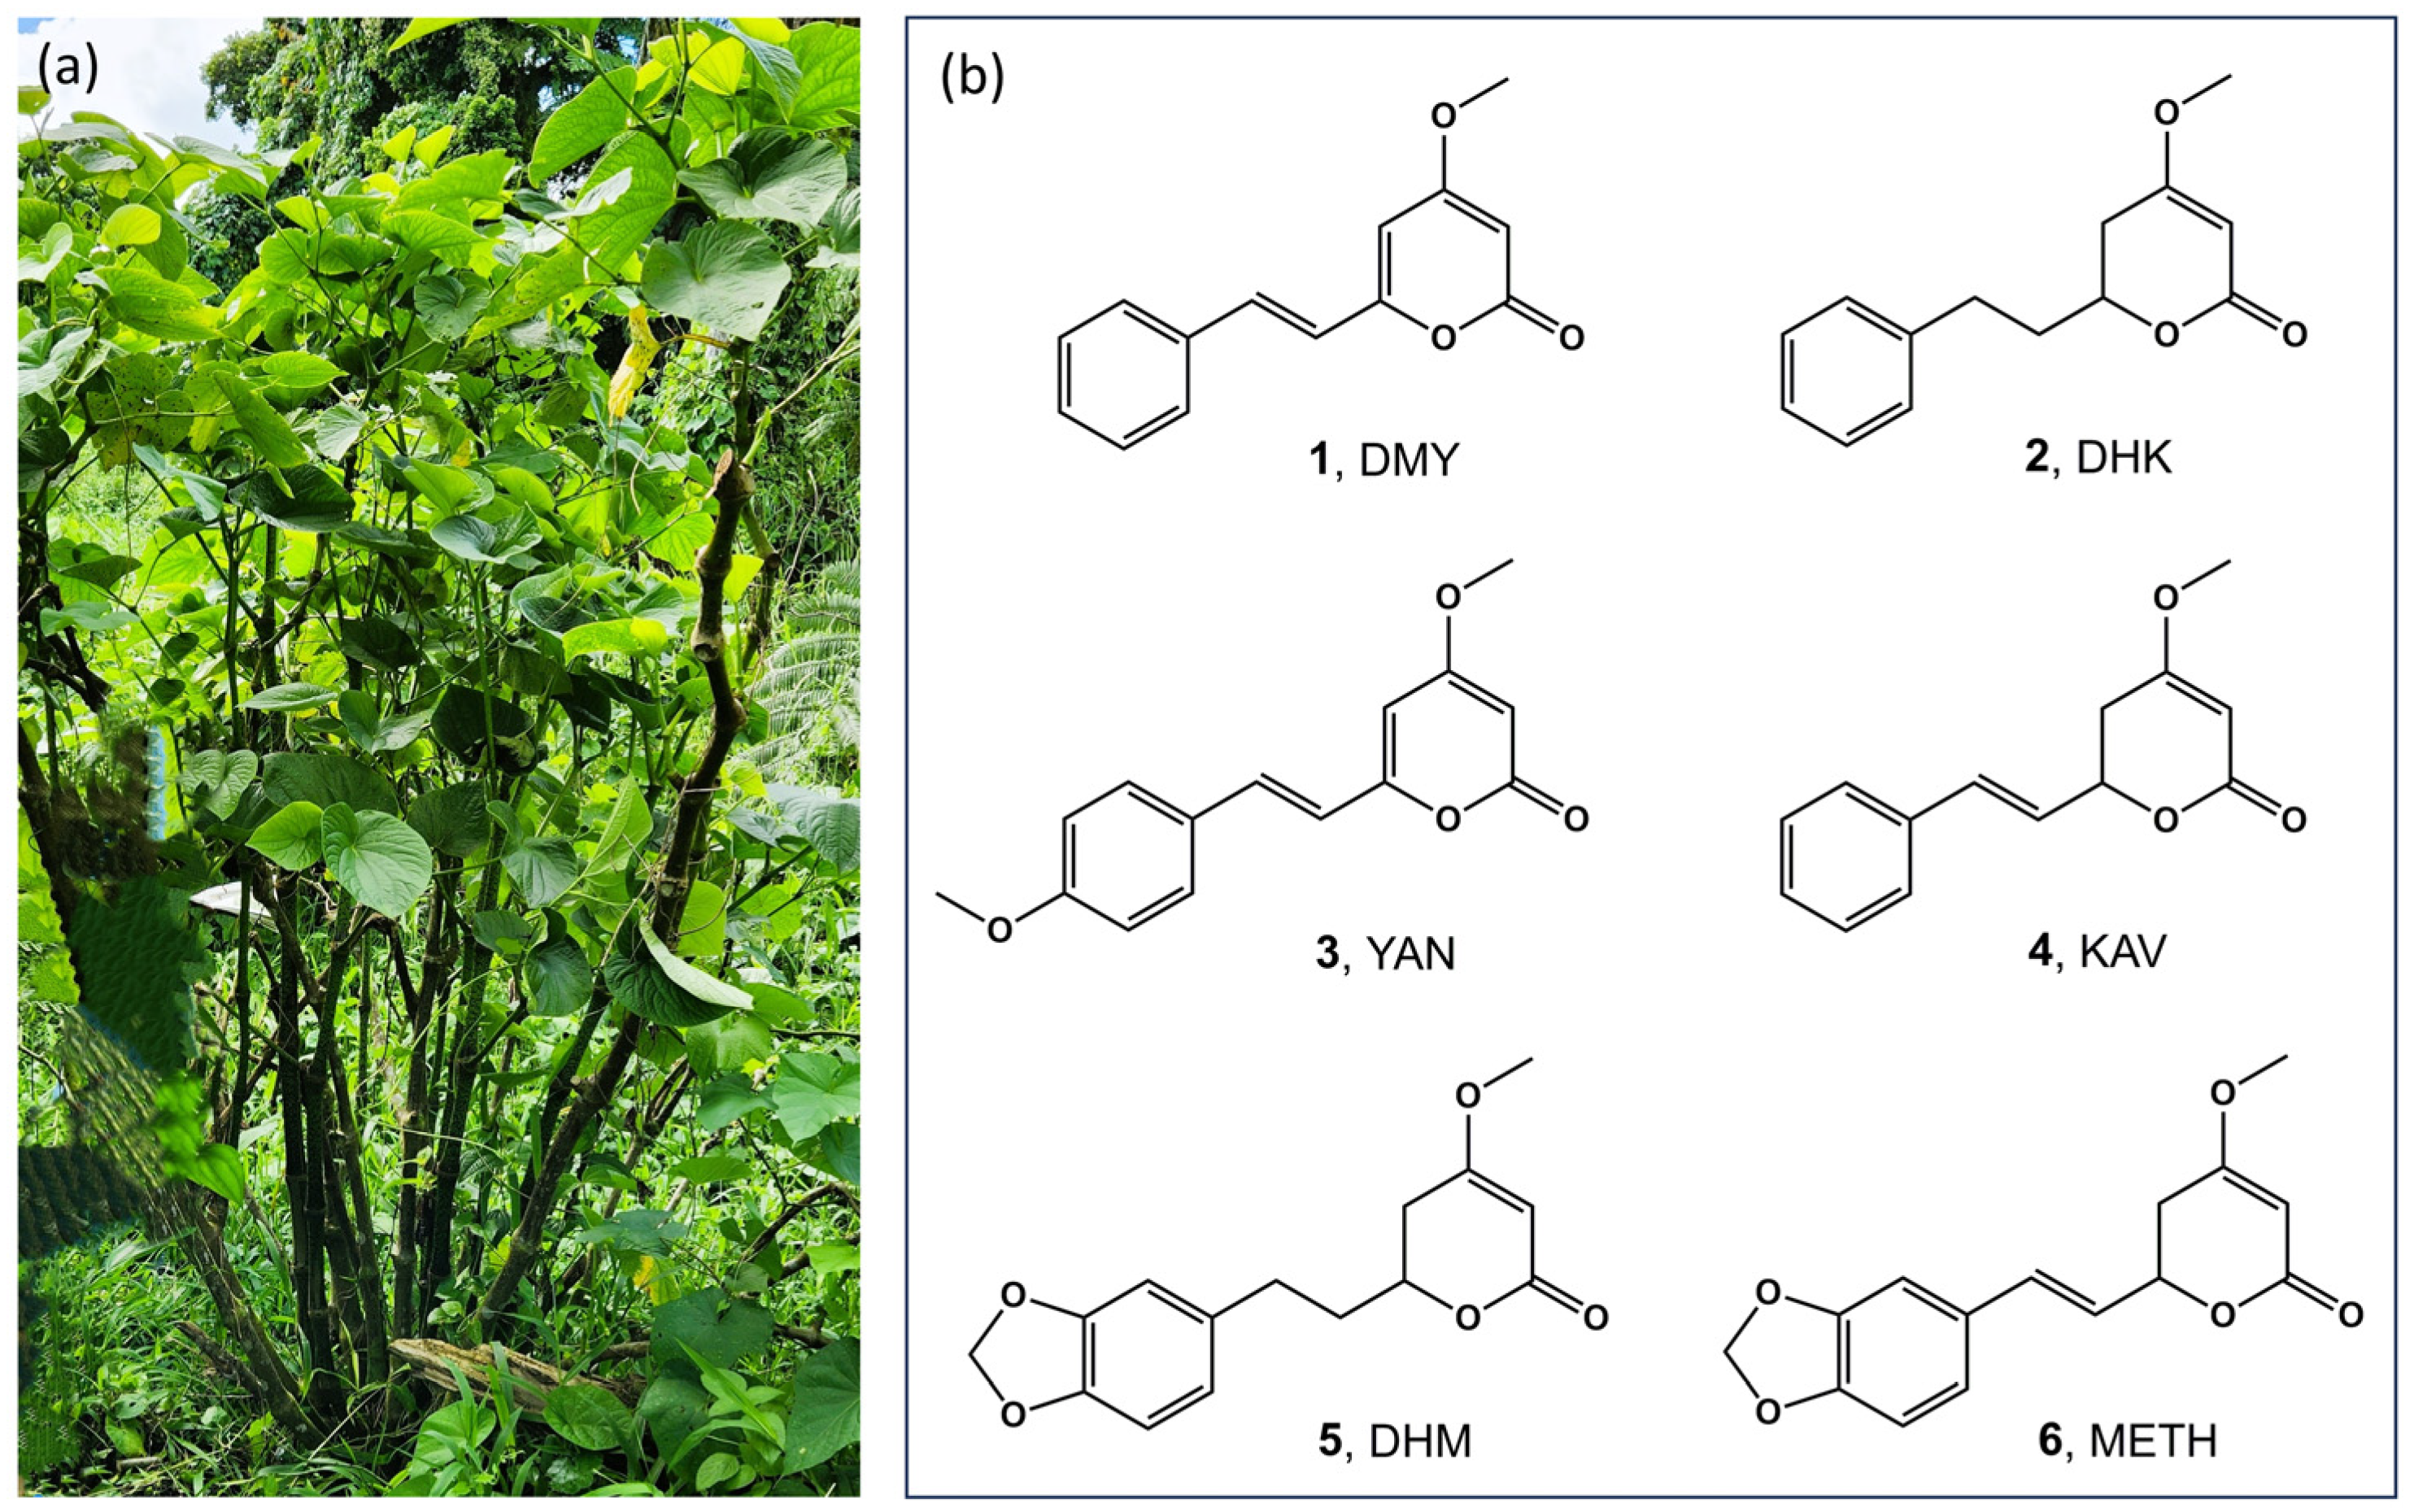
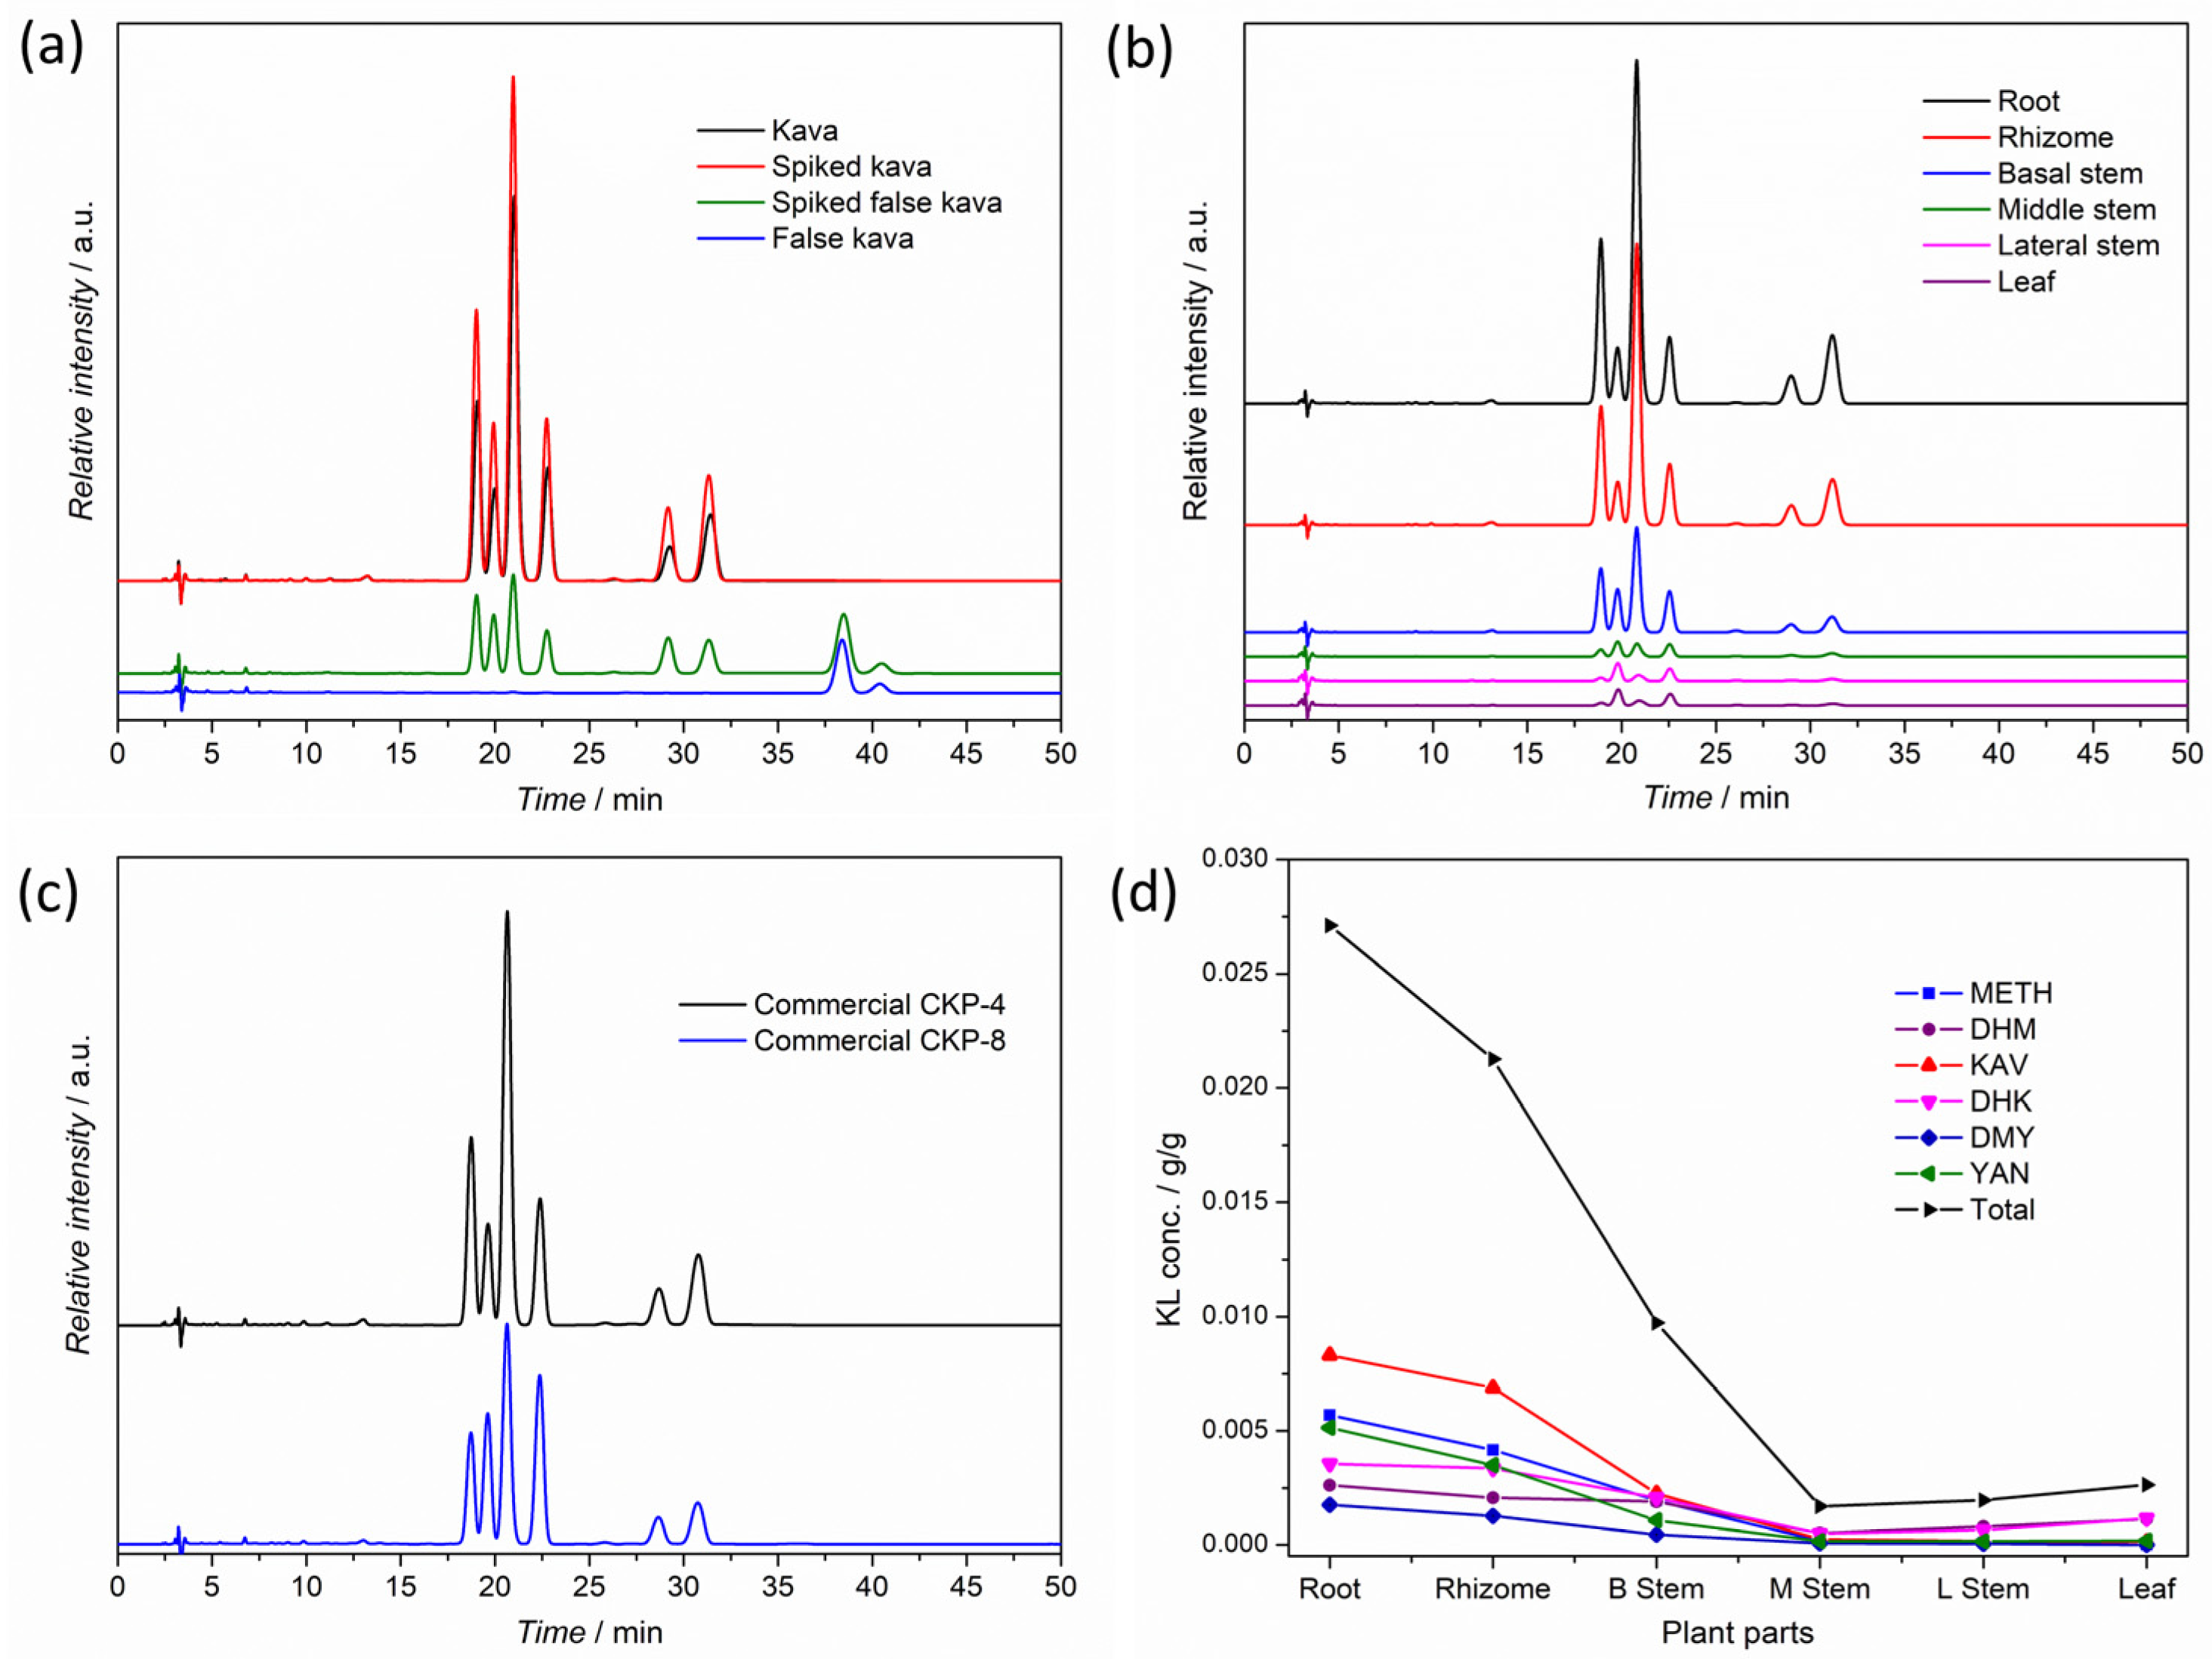
3.2. Kavalactone Content and Profile of a Selected Raw Kava Plant

To assess how the kavalactone content and profile change from the root up to the leaf of the plant and to obtain a raw plant reference, a two-year-old green raw kava plant (Dokobana Loa; a variant of Piper methysticum) was uprooted in Dakuivuna village (east Viti Levu, Fiji). Parts of the plant were ground and separated into two portions; one portion was extracted, and the other was dried and powdered, and finally extracted. The water content of plant organs was taken as the mass difference in plant parts before and after freeze-drying. The results are shown in Figure 4b,d and Figure S2, and Table 1. The total kavalactone content was found to be the highest in the plant’s root, progressively decreased towards the basal stem (measured between the first and second node of the plant), and was very low in the middle stem, lateral, and leaf. The KL concentration in the basal stem was only about a third of that of the root. The difference in the KL content of the root and rhizome increased upon drying due to the smaller water content of the rhizome compared to that of the root. Not only did the KL content decrease progressively from the root toward the leaf, but the lactone profile changed too (Table 1). Kavain was the major component in the root and rhizome, amounting to about a third of the total KL content; the KAV content was higher than that of the sum of DHK and DHM. In the basal stem, compared to the root and rhizome, the relative amount of DHK and DHM increased compared to that of KAV and became almost two times higher than that of KAV. DHK and DHM were the major lactone components in the middle stem, lateral, and leaf. We noted that freeze-drying was more effective for moisture removal from plant organs than oven-drying.

3.3. Kavalactone Content and Profile of Kava Roots and Rhizomes from the Market

Dried kava roots are sold in the local market in bundles with a piece of rhizome attached to them. The age, plant type, and origin of the plant, as well as the preparation of the bundle, viz., a single plant and variant or mixed, are at the sole discretion of the retailer. In general, retailers name the origin of the plant, but this must be treated cum grano salis. Six kava root bundles (RBs) were collected for this study, considering different cultivation areas. Two roots were randomly selected from each bundle, rhizomes were separated, and the roots and rhizomes were both analyzed. The results are shown in Table 2.
Not considering the two extreme cases, RB-5b and RB-6b, and RB-5a, the total KL content in the roots varied between 8 and 13% and in the rhizomes between 2 and 8%. The kavain content was between the third and fourth of that of the total KL. KAV had the highest concentration in the roots in these samples, followed by METH and YAN (the amount of the latter was comparable or slightly higher than that of METH in a couple of cases); KAV, METH, and YAN together represented 69–71% of the total KL content. The relative DHK and DHM contents compared to that of KAV were higher in the rhizomes than in the roots, although the KAV content remained the highest (see Table 2); the sum of KAV, METH, and YAN was 59–67%. It was also a characteristic of these plant organs that the KAV content of roots was higher than the sum of DHK and DHM. The roots were superior to rhizomes concerning the amount and profile of KLs. All these samples exhibited the chemical fingerprint of noble kava.
Sample RB-5a had a similar lactone profile to the samples discussed above, but the DHK content was relatively high, and the sum of the DHK and DHM content was slightly higher than that of the KAV. Sample RB-6b had a surprisingly low total KL content only 5.7%, and relatively high METH concentration; the DHK and DHM content was comparable to that of KAV. Sample RB-5b is a special case as it had a high total KL content, but a relatively low KAV content; DHK had the highest concentration among KLs in this sample, the sum of DHK and DHM was much higher than that of KAV, and KAV, METH, and YAN together represented only 54% of the total KL content in the root. It is clear that samples RB-5a and RB-5b are not from the same plant and not from the same variety. It can be concluded that samples RB-5a, RB-5b, and RB-6b, especially RB-5b, are not favorable for human consumption.

3.4. Kavalactone Content and Profile of Commercial Kava Powders

Packaged kava powder presents one of the processed forms of kava and is available to consumers locally as well as internationally. The implementation of detailed quality information on kava powder packages, however, is yet to come. We noted that there are good initiatives, such as the indication of the total KL content on these products by some of the retailers. To test commercial kava powder, eight kava powder packages sold under different brand names were purchased from local shops and supermarkets. The results are shown in Table 3.
According to our investigation, the total KL content was found to vary in packages CKP1-7 between 4.1 and 5.4%, and the KAV content was between the third and fourth of the total KL content. KAV had the highest concentration among KLs. The KAV concentration was, however, lower than that of the sum of DHK and DHM. The sum of KAV, METH, and YAN was between 60 and 64% of the total KL content. Compared to the KL profiles of roots and rhizomes above, CKP1-7 could be identified as mixtures of roots and rhizomes and possibly basal stems. CKP-8 had an unusual KL profile, namely a low total KL and KAV content and relatively high DHK and DHM concentration. DHK had the highest amount among KLs. The sum of KAV, METH, and YAN content was only 42% of that of total KLs. CKP-8 possibly contains the roots, rhizomes, and basal stems of one or more non-noble varieties. The CKP-8 lactone profile is significantly different than those of other products (see Table 3). A comparison of the chromatographic fingerprints of CKP-4 and CKP-8 is shown in Figure 4c, highlighting the difference between these two packaged products.

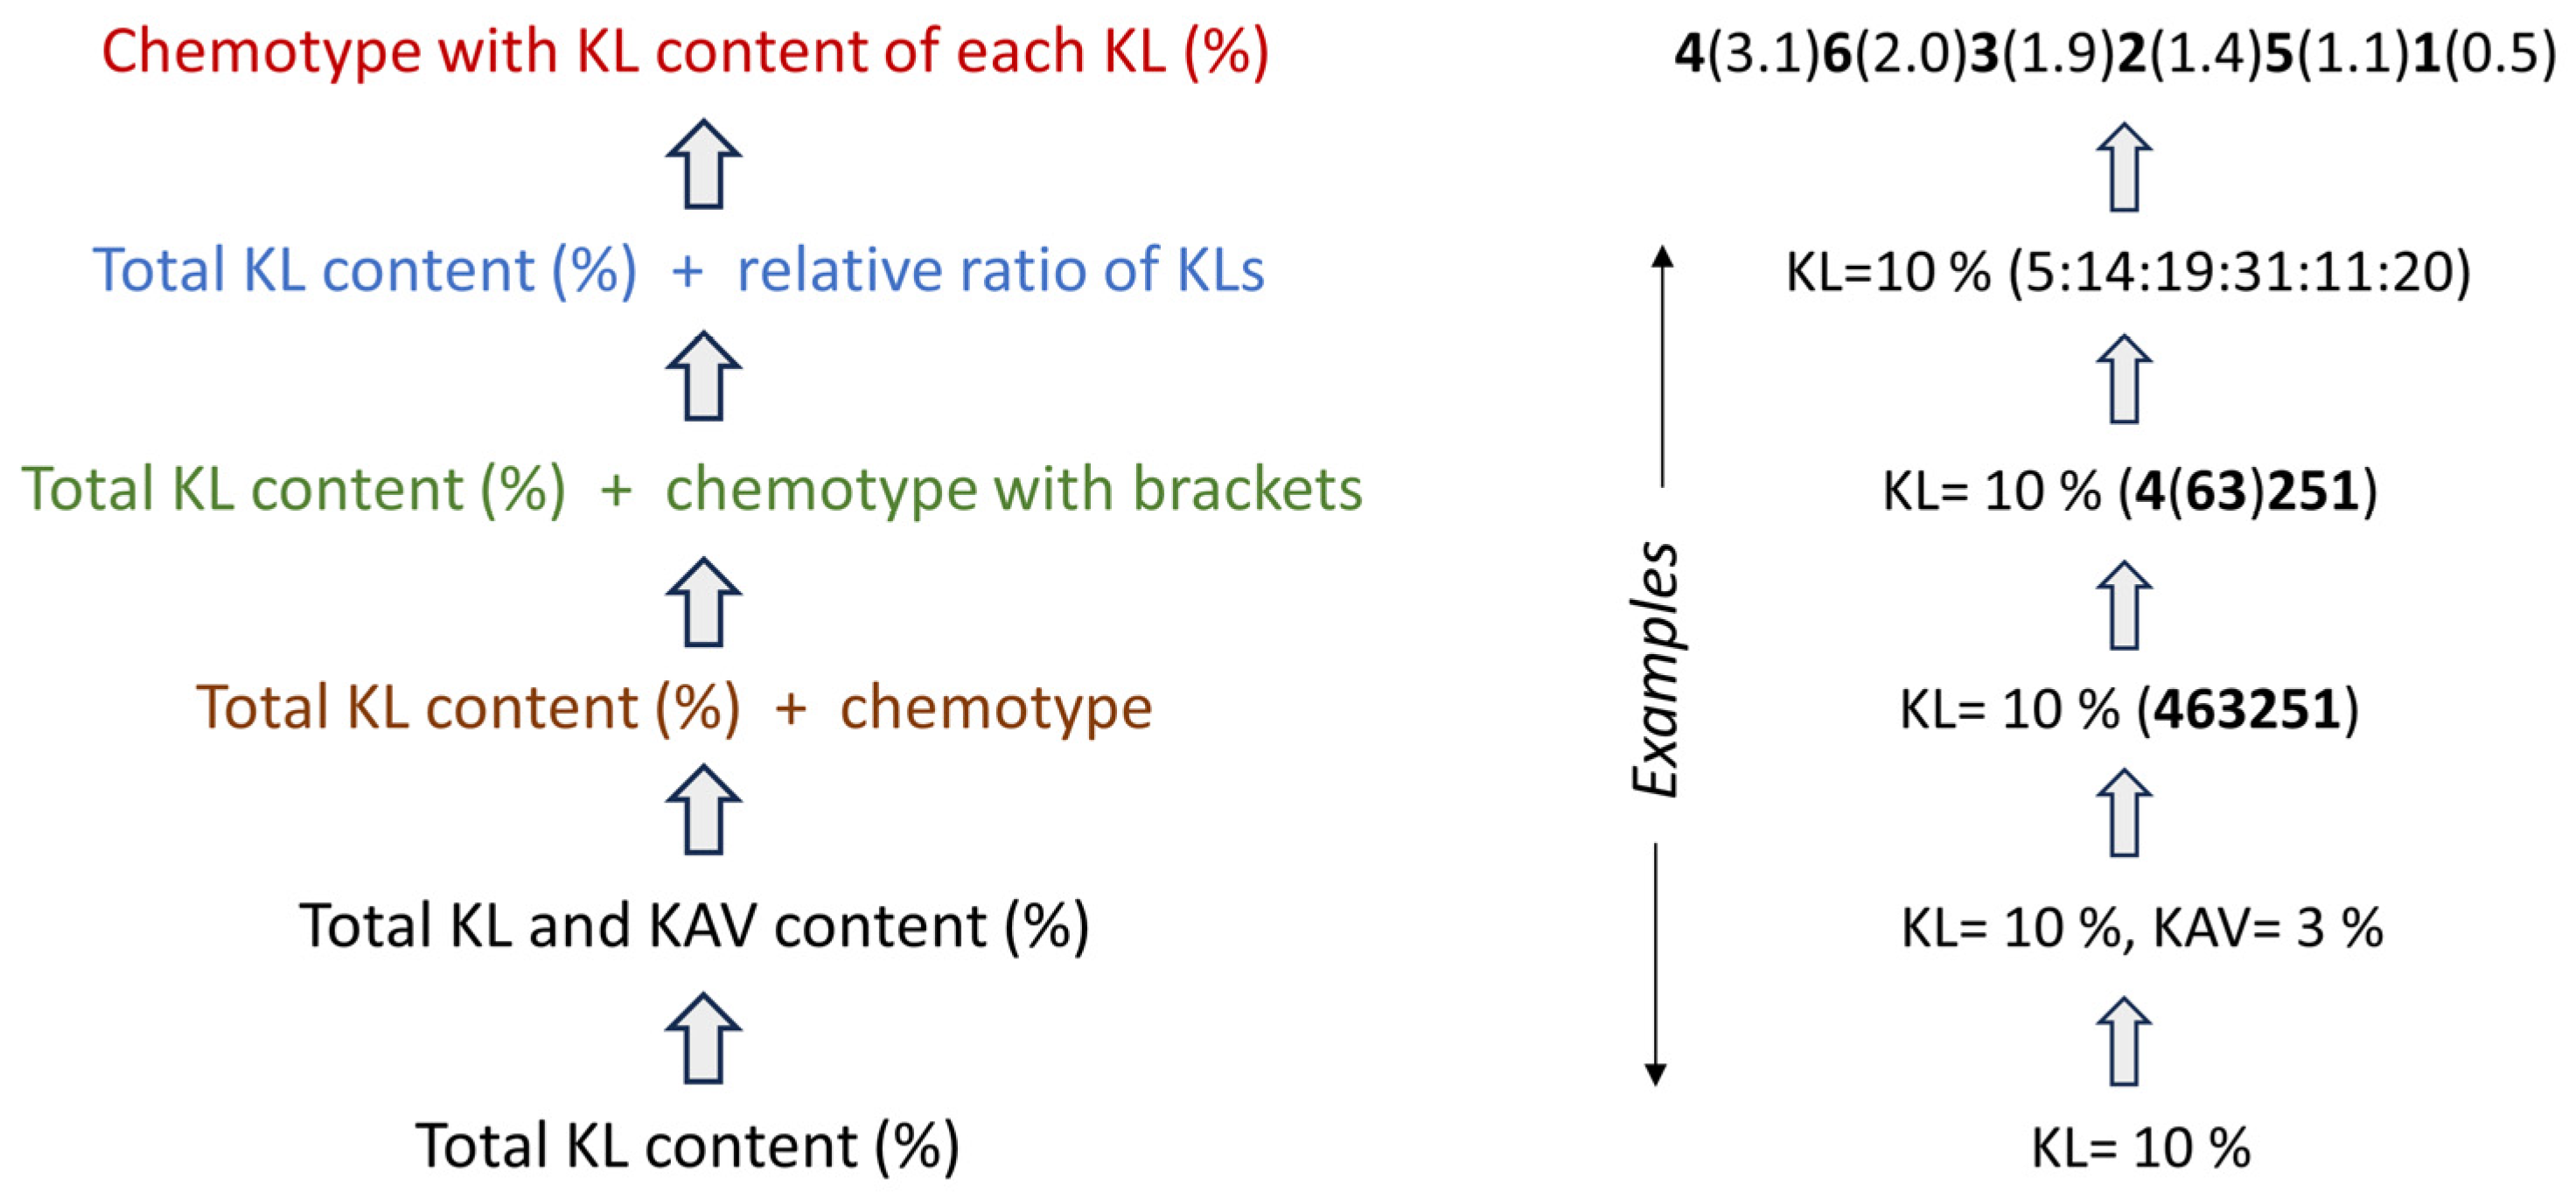
3.5. Chemotype of Kava Sold in the Fijian Market

In general, not considering the exceptional cases above, Fiji kava roots can be characterized as (1) those with a relatively high KAV concentration (highest among KLs), (2) those with a comparable YAN and METH content (the sum of these two is about 10–40% higher than that of KAV), (3) those with a low DHK content (40–50% of that of KAV), and (4) those with a low and comparable DHM and DMY concentration (20–30% of that of KAV). The sum of the DHK and DHM content is below that of KAV. The relatively high KAV and low DHM concentrations are advantageous for kava drinkers as variants that produce desirable effects [4].
It is interesting to compare the lactone profile of Fiji kava with those cultivated in Vanuatu. Lebot and his co-workers recently analyzed 72 roots of local noble varieties in Vanuatu [4] and found comparable KAV, YAN, and DMY content. The METH concentration was significantly lower than that of YAN, and the sum of the DHK and DHM content was below that of KAV. An interesting difference between Fiji kava roots and Vanuatu kava roots is the sum of the METH and DHM content of Fiji kava (90–110% of KAV), which is significantly higher than that in Vanuatu kava (62% of KAV [4]). These differences between the kavalactone profiles of Fiji and Vanuatu kava highlight the importance of regional factors in influencing kava quality and, more importantly, the need for a more detailed investigation of the kavalactone profile of various cultivars in various regions of Fiji, including the collection of genuine samples from farms. We consider our current work as the initiation of this project.

3.6. Suggestions for Improved Chemical Quality Code

The kava quality is of crucial importance to consumers’ safety. Our KL quantification of kava products sold in the local market highlights the need for quality control and quality assurance due to the KL profile variation in marketed products. It is obvious that kava chemical quality standardization must involve both quantitative and qualitative, namely lactone profile measures. The latter is more crucial for kava drinkers. As a quantitative requirement, Teschke and Lebot [3] suggested that dried kava roots should contain a minimum of 10% KLs, in total, with a minimum of 3% KAV, and dried rhizomes should contain a minimum of 5% total KLs with at least 1% KAV. In addition, the water content should be below 12%. These are important quality requirements; however, further tightening quality control is essential (see, e.g., RB-5b in Table 2, which fulfills these criteria but does not present quality kava for human consumption). The chemotype, in addition to the total lactone content, as introduced by Teschke and Lebot [3], provides a further add-on for quality assurance. The current chemotype code, however, could be further improved. One limitation of the current code is that it does not give information about the relative amount of KLs, only the relative order of their quantity. In addition, it is still not agreed in the scientific community if chemotyping should be based on the mass or the molar amounts of lactones; however, the two could be different if two KL concentrations are close to each other (see Table 1, Table 2 and Table 3). For minor improvements, we suggest that brackets should be used in the code for highlighting a comparable amount of KLs, e.g., within 10%. The further possible development for providing chemical quality information is to use the relative ratio of KLs. The chemotype can easily be derived from this, and, together with the total KL content, full chemical information can be provided. A simpler variant of this chemical code is the lactone code, with the amount of the lactone in parenthesis. The suggested quality code hierarchy, which may be used by kava producers, is shown in Figure 5.

4. Conclusions

The quality of kava sold in the local market of Fiji was evaluated in this work through the quantification of the six major kavalactones in kava root bundles and packaged kava powder. Our investigation confirms that mainly noble kava is sold on the local market; however, the observed relatively large variation in the KL content and profile, as well as the adulteration of products, indicate that quality remains an issue that needs to be better controlled. One way of implementing quality assurance would be the introduction of an obligatory chemical quality code, as suggested by Teschke and Lebot [3,17]. An improved code, also expressing the quantity of each lactone, could provide an even better ‘fingerprint’ that may link a specific kava product and associated qualities to a particular variety, plant organ, and cultivation area. To this end, further work is required, namely mapping kava in growing areas and collecting and analyzing genuine kava samples in Fiji. We note that we have initiated such work in collaboration with Phama Plus, and the results will be published in due time.

Supplementary Materials

The following supporting information can be downloaded at: https://www.mdpi.com/article/10.3390/beverages10010004/s1, Figure S1: Decomposition/isomerization of yangonin under daylight/artificial light; Figure S2: Kavalactone concentration in various parts of a freeze-dried green kava plant.

Author Contributions

Conceptualization, T.P.; methodology, T.P.; formal analysis, T.P. and D.D.D.; sample collection: D.D.D.; HPLC measurements: D.D.D.; UV measurements: T.P.; investigation, T.P. and D.D.D.; writing—original draft preparation, T.P.; writing—review and editing, T.P. and D.D.D.; visualization, T.P. and D.D.D.; supervision, T.P.; project administration, T.P. All authors have read and agreed to the published version of the manuscript.

Funding

This research was funded by DT Global Australia Pty. Ltd. (Adelaide, Australia) through the Pacific Horticultural and Agricultural Market Access (PHAMA) Plus Program, grant number FJ07 and the Fiji National University, grant number GI009.

Data Availability Statement

All relevant data are within the article and the Supplementary Materials. Additional information can be obtained from the corresponding author of this manuscript.

Acknowledgments

We thank Rohit Lal for donating a false kava plant (Taveuni, Fiji).

Conflicts of Interest

The authors declare no conflicts of interest. The funders had no role in the design of the study; in the collection, analyses, or interpretation of data; in the writing of the manuscript; or in the decision to publish the results.

References

  1. Bian, T.; Corral, P.; Wang, Y.; Botello, J.; Kingston, R.; Daniels, T.; Salloum, R.G.; Johnston, E.; Huo, Z.; Lu, J.; et al. Kava as a Clinical Nutrient: Promises and Challenges. Nutrients 2020, 12, 3044. [Google Scholar] [CrossRef] [PubMed]
  2. Lebot, V.; Merlin, M.; Lindstrom, L. Kava: The Pacific Elixir: The Definite Guide to Its Ethnobotany, History, and Chemistry; Healing Arts Press: Rochester, VT, USA, 1997. [Google Scholar]
  3. Teschke, R.; Lebot, V. Proposal for a Kava Quality Standardization Code. Food Chem. Toxicol. 2011, 49, 2503–2516. [Google Scholar] [CrossRef] [PubMed]
  4. Lebot, V.; Michalet, S.; Legendre, L. Kavalactones and Flavokavins Profiles Contribute to Quality Assessment of Kava (Piper methysticum G. Forst.), the Traditional Beverage of the Pacific. Beverages 2019, 5, 34. [Google Scholar] [CrossRef]
  5. Petersen, G.E.; Tang, Y.; Fields, C. Chemical and in vitro toxicity analysis of a supercritical fluid extract of Kava kava (Piper methysticum). J. Ethnopharm. 2019, 235, 301–308. [Google Scholar] [CrossRef] [PubMed]
  6. Bilia, A.R.; Scalise, L.; Bergonzi, M.C.; Vincieri, F.F. Analysis of kavalactones from Piper methysticum (kava-kava). J. Chromatogr. B 2004, 812, 203–214. [Google Scholar] [CrossRef]
  7. Fu, P.P.; Xia, Q.; Guo, L.; Yu, H.; Chan, P.-C. Toxicity of Kava Kava. J. Environ. Sci. Health Part C 2008, 26, 89–112. [Google Scholar] [CrossRef] [PubMed]
  8. Whitton, P.A.; Lau, A.; Salisbury, A.; Whitehouse, J.; Evans, C.S. Kava lactones and the kava-kava controversy. Phytochemistry 2003, 64, 673–679. [Google Scholar] [CrossRef] [PubMed]
  9. White, C.M. The Pharmacology, Pharmacokinetics, Efficacy, and Adverse Events Associated with Kava. J. Clin. Pharmacol. 2018, 58, 1396–1405. [Google Scholar] [CrossRef] [PubMed]
  10. Chetty, A. (Ministry of Agriculture, Suva, Fiji). Personal Communication. 2023. [Google Scholar]
  11. Pacific Data Hub. Kava Data. Available online: https://pacificdata.org/data/dataset/kava-df-kava/resource/f8c41e00-c5a8-44c0-80b1-7a4d7a8dc103 (accessed on 17 December 2023).
  12. Simeoni, P.; Lebot, V. Identification of factors determining kavalactone content and chemotype in Kava (Piper methysticum Forst. f.). Biochem. Syst. Ecol. 2002, 30, 413–424. [Google Scholar] [CrossRef]
  13. Fiji Kava Quality Manual. Available online: https://phamaplus.com.au/resources/technical-reports/fiji-kava-quality-manual/ (accessed on 10 October 2023).
  14. Zhang, N.; Wu, L.; Liu, X.; Shen, X. Plant-Derived Kavalactones and Their Bioactivities. Med. Res. 2018, 2, 170019. [Google Scholar] [CrossRef]
  15. Lebot, V.; Lévesque, J. The origin and distribution of kava (Piper methysticum Forst. f. Piperaceae): A phytochemical approach. Allertonia 1989, 5, 223–281. [Google Scholar]
  16. Lebot, V.; Merlin, M.D.; Lindstrom, L. Kava: The Pacific Drug; Yale University Press: New Haven, CT, USA, 1992. [Google Scholar]
  17. Lebot, V. An overview of kava production in the Pacific Islands: What we do know and what we don’t know. J. South Pac. Agric. 1997, 4, 55–62. [Google Scholar]
  18. Tang, Y.; Fields, C. A UHPLC-UV Method Development and Validation for Determining Kavalactones and Flavokavains in Piper methysticum (Kava). Molecules 2019, 24, 1245. [Google Scholar] [CrossRef] [PubMed]
  19. Shao, Y.; He, K.; Zheng, B.; Zheng, Q. Reversed-phase high-performance liquid chromatographic method for quantitative analysis of the six major kavalactones in Piper methysticum. J. Chromatogr. A 1998, 825, 1–8. [Google Scholar] [CrossRef]
  20. Xuan, T.D.; Fukuta, M.; Wei, A.C.; Elzaawely, A.A.; Khanh, T.D.; Tawata, S. Efficacy of extracting solvents to chemical components of kava (Piper methysticum) roots. J. Nat. Med. 2008, 62, 188–194. [Google Scholar] [CrossRef] [PubMed]
  21. Wang, J.; Qu, W.; Bittenbender, H.C.; Li, Q.X. Kavalactone content and chemotype of kava beverages prepared from roots and rhizomes of Isa and Mahakea varieties and extraction efficiency of kavalactones using different solvents. J. Food Sci. Technol. 2015, 52, 1164–1169. [Google Scholar] [CrossRef] [PubMed]
  22. Cote, C.S.; Kor, C.; Cohen, J.; Auclair, K. Composition and biological activity of traditional and commercial kava extracts. Biochem. Biophys. Res. Comm. 2004, 322, 147–152. [Google Scholar] [CrossRef] [PubMed]
  23. Glaser, J.A.; Foerst, D.L.; McKee, G.D.; Quave, S.A.; Budde, W.L. Trace analyses for wastewaters. Environ. Sci. Technol. 1981, 15, 1426–1435. [Google Scholar] [CrossRef]
Figure 1. (a) Photo of a kava plant and (b) chemical formula and labeling of the major kavalactones.
Beverages 10 00004 g001
Figure 2. (a) UV spectra of the six major kavalactones in ethanol, (b) chromatograms of a mixture of six major kavalactones recorded at various detector wavelengths, and (c) identifying the order of elution of the six major kavalactones by comparing chromatograms of the kavalactone mixture with those of individual kavalactones.
Beverages 10 00004 g002
Figure 3. (a) Extraction of a selected commercial kava powder with acetone, methanol, ethanol and water, (b) chromatographic peak intensity vs. extraction time using ethanol as the extractant, and (c,d) five consecutive extractions of a commercial kava powder with water and then with ethanol; (c) chromatograms and (d) chromatographic peak intensity at each consecutive extraction step.
Beverages 10 00004 g003
Figure 4. (a) Spiking a commercial kava powder, CKP-1, and the ‘false kava’ powder, (b,d) extraction of various parts of a green kava plant, (c) chromatographic ‘fingerprint’ of CKP-4 and CKP-8, and (d) kavalactone concentration in various parts of a green kava plant (B = basal, M = middle, L = lateral), (see Figure S2 for the freeze-dried plant extraction).
Beverages 10 00004 g004
Figure 5. Chemical quality code hierarchy.
Beverages 10 00004 g005
Table 1. Kavalactone (KL) content and chemotype of a Dokobana Loa plant (a variant of Piper methysticum) from Dakuivuna a.
Plant PartWater
Cont. (%)
Total KL Cont. (%)Kavain
Cont. (%)
Relative Mass Ratio of KLs a Chemotype
(Mass Based) b
Chemotype
(Mol Based) b
Green plant
Root73.52.71 ± 0.0190.83 ± 0.00221:43:62:100:32:694(63)2514(63)251
Rhizome65.92.13 ± 0.0310.69 ± 0.00419:49:51:100:30:6146(32)514(623)51
Basal stem71.90.97 ± 0.0420.23 ± 0.00520:92:48:100:84:86(42)(65)31(42)(65)31
Middle stem80.50.17 ± 0.0130.03 ± 0.00213:97:32:49:100:36(52)4(63)1(25)4(63)1
Lateral stem85.80.20 ± 0.0110.02 ± 0.0026:81:19:21:100:1352(43)61(52)4361
Leaf78.90.26 ± 0.0240.01 ± 0.0012:100:34:12:99:2(25)34(61)2534(61)
Freeze-dried
Root 10.31 ± 0.0133.05 ± 0.01625:43:65:100:33:714(63)2514(63)2(51)
Rhizome 6.63 ± 0.0472.17 ± 0.01118:52:48:100:30:5846(23)514(26)351
Basal stem 3.81 ± 0.0580.89 ± 0.00221:90:51:100:83:844(265)3142(65)31
Middle stem 1.00 ± 0.0310.15 ± 0.00713:95:35:51:100:37(52)4(63)1(25)4(36)1
Lateral stem 1.41 ± 0.0470.12 ± 0.0086:83:24:22:100:1452(34)61(52)(34)61
Leaf 1.50 ± 0.0430.07 ± 0.0012:99:43:12:100:3(52)34(61)(25)34(61)
Oven-dried
Root7.89.4 ± 0.0282.7 ± 0.04428:50:59:100:36:704632514632(51)
Rhizome8.46.0 ± 0.0781.9 ± 0.02519:53:46:100:33:634623514(62)351
a In the order of kavalactone codes 1 (DMY), 2 (DHK), 3 (YAN), 4 (KAV), 5 (DHM), and 6 (METH); b see numbering in Figure 1. Brackets are used when the kavalactone content for two lactones was close to each other, within about 10%, using the following formula: 0.1 > (A − B)/((A + B)/2), where A and B represent the two kavalactones.
Table 2. Measured kavalactone (KL) content and chemotype of roots and rhizomes of dried kava purchased on the local market a.
RB bWater
Cont. (%)
Total KL Cont. (%) cKavain
Cont. (%) d
Relative Mass Ratio of KLs eChemotype
(Mass Based) f
Chemotype
(Mol Based) f
RB-1a14.2/15.47.9/2.82.7/0.921:46:48:100:17:63/18:64:38:100:32:6646(32)15/4(62)35146(23)15/426351
RB-1b13.2/14.68.7/4.22.5/1.121:48:69:100:29:77/20:80:60:100:56:68463251/4263514(63)251/42(63)51
RB-2a11.8/13.59.9/5.23.1/1.733:42:54:100:27:61/26:49:51:100:31:57463215/4632514(63)215/4(63)2(51)
RB-2b11.3/13.210.2/5.83.0/1.622:45:68:100:32:68/22:76:63:100:44:654(36)251/42(63)514(36)251/42(36)51
RB-3a12.0/13.411.5/6.73.6/2.020:43:55:100:30:70/17:55:54:100:43:71463251/46(23)51463251/462351
RB-3b10.9/12.912.9/8.34.1/2.323:39:57:100:29:70/20:56:70:100:42:71463251/4(63)2514632(51)/4(36)251
RB-4a11.2/13.89.8/6.82.9/1.831:41:70:100:29:66/23:74:56:100:49:614(36)2(15)/42(63)51436215/42(63)51
RB-4b11.4/13.6 11.8/4.93.5/1.431:44:68:100:29:65/29:56:66:100:39:624(36)2(15)/4(36)251436215/4(326)(51)
RB-5a11.5/13.39.3/6.12.8/1.723:65:51:100:37:60/20:82:51:100:45:524(26)351/42(63)51426351/42(36)51
RB-5b11.3/12.517.7/3.85.7/1.133:100:76:91:65:63/22:100:42:70:80:56243(56)1/254631243(56)1/245631
RB-6a11.6/13.57.5/2.32.0/0.622:49:67:100:46:89/20:69:68:100:69:92463(25)1/46(523)1463251/462(35)1
RB-6b12.6/13.85.7/3.31.5/0.817:40:57:98:55:100/18:59:70:99:64:100(64)(35)21/(64)(35)21463521/463(25)1
a Values for roots and rhizomes are given in consecutive numbers and separated with “/”; b Root bundle (RB) number root ‘a’ or ‘b’ (salesmen claimed origin of Rabi, Saqani, Koro, Kadavu, Savusavu, Sevaci); c standard deviation is smaller than ±0.07 for all samples; d standard deviation is smaller than ±0.06 for all samples; e the order of kavalactone codes is 1 (DMY), 2 (DHK), 3 (YAN), 4 (KAV), 5 (DHM), and 6 (METH); f see numbering in Figure 1. Brackets are used when the kavalactone content for two lactones are close to each other, within about 10%, using the following formula: 0.1 > (A − B)/((A + B)/2), where A and B represent the two kavalactones.
Table 3. Measured kavalactone (KL) content and chemotype of commercial kava powder sold in the local market in Suva.
NumberMeasured
CKP aWater
Cont. (%)
Total KL Cont. (%)Kavain
Cont. (%)
Relative Mass
Ratio of KLs b
Chemotype
(Mass Based) c
Chemotype
(Mol Based) c
110.75.4 ± 0.061.5 ± 0.0223:65:53:100:46:684(62)351426351
211.85.0 ± 0.071.4 ± 0.0422:63:54:100:48:704623514(26)351
36.74.4 ± 0.061.2 ± 0.0324:64:54:100:44:664(62)351426351
49.33.8 ± 0.031.1 ± 0.0123:68:52:100:47:654(26)351426351
515.84.5 ± 0.051.3 ± 0.0122:71:51:100:51:64426(35)1426(35)1
66.04.8 ± 0.021.3 ± 0.0222:74:52:100:52:68426(53)1426(35)1
713.24.1 ± 0.061.2 ± 0.0325:57:56:100:37:634(623)514(263)51
89.83.0 ± 0.070.5 ± 0.0319:100:34:59:68:432546312(45)631
a CKP= commercial kava powder; b the order of kavalactone codes is 1 (DMY), 2 (DHK), 3 (YAN), 4 (KAV), 5 (DHM), and 6 (METH); c see numbering in Figure 1. Brackets are used when the kavalactone content for two lactones was close to each other, within about 10%, using the following formula: 0.1 > (A − B)/((A + B)/2), where A and B represent the two kavalactones.
Disclaimer/Publisher’s Note: The statements, opinions and data contained in all publications are solely those of the individual author(s) and contributor(s) and not of MDPI and/or the editor(s). MDPI and/or the editor(s) disclaim responsibility for any injury to people or property resulting from any ideas, methods, instructions or products referred to in the content.

