Article

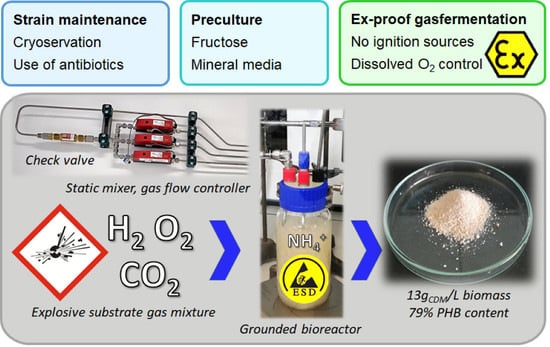
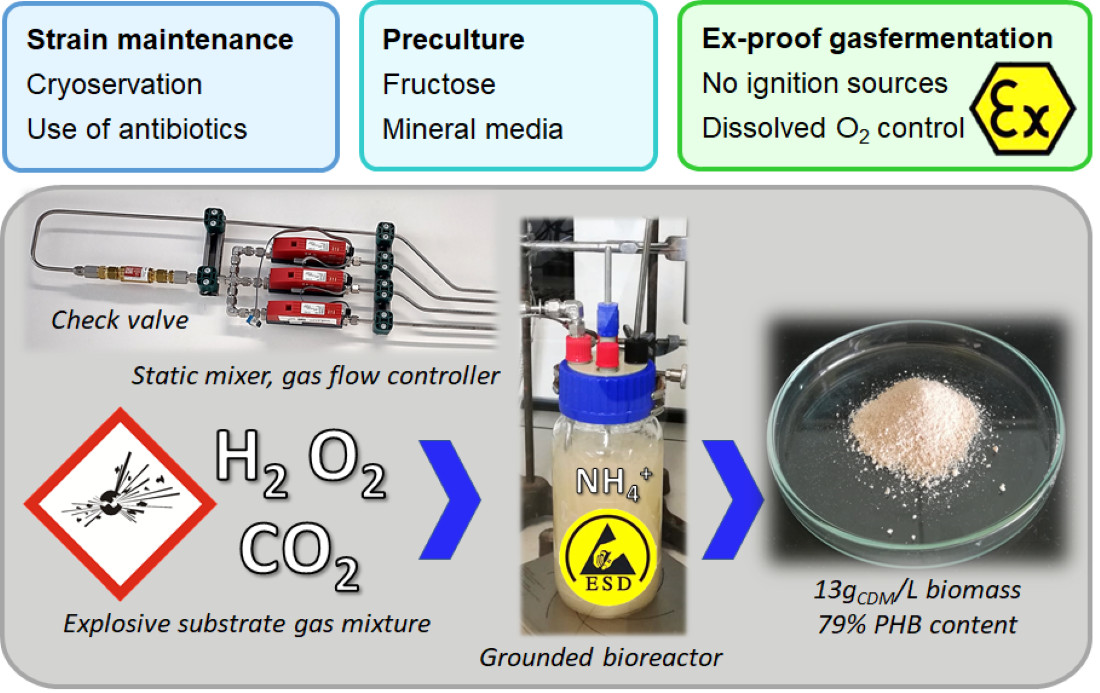
Lab-Scale Cultivation of Cupriavidus necator on Explosive Gas Mixtures: Carbon Dioxide Fixation into Polyhydroxybutyrate

1
Austrian Centre of Industrial Biotechnology (ACIB), Krenngasse 37, A-8010 Graz, Austria
2
Institute of Biotechnology and Biochemical Engineering, Graz University of Technology, NAWI Graz, Petersgasse 12/II, A-8010 Graz, Austria
*
Author to whom correspondence should be addressed.
Bioengineering 2022, 9(5), 204; https://doi.org/10.3390/bioengineering9050204
Submission received: 30 March 2022 / Revised: 29 April 2022 / Accepted: 5 May 2022 / Published: 10 May 2022
(This article belongs to the Special Issue Advances in Polyhydroxyalkanoate (PHA) Production, Volume 3)

Abstract

:
Aerobic, hydrogen oxidizing bacteria are capable of efficient, non-phototrophic CO2 assimilation, using H2 as a reducing agent. The presence of explosive gas mixtures requires strict safety measures for bioreactor and process design. Here, we report a simplified, reproducible, and safe cultivation method to produce Cupriavidus necator H16 on a gram scale. Conditions for long-term strain maintenance and mineral media composition were optimized. Cultivations on the gaseous substrates H2, O2, and CO2 were accomplished in an explosion-proof bioreactor situated in a strong, grounded fume hood. Cells grew under O2 control and H2 and CO2 excess. The starting gas mixture was H2:CO2:O2 in a ratio of 85:10:2 (partial pressure of O2 0.02 atm). Dissolved oxygen was measured online and was kept below 1.6 mg/L by a stepwise increase of the O2 supply. Use of gas compositions within the explosion limits of oxyhydrogen facilitated production of 13.1 ± 0.4 g/L total biomass (gram cell dry mass) with a content of 79 ± 2% poly-(R)-3-hydroxybutyrate in a simple cultivation set-up with dissolved oxygen as the single controlled parameter. Approximately 98% of the obtained PHB was formed from CO2.

Graphical Abstract

1. Introduction

CO2 emissions from fossil fuel combustion and further anthropogenic activities are the largest driver of global warming. Stripping the CO2 back out of waste streams and using it as carbon feedstock would close the carbon loop and spare fossil fuels. Therefore, CO2 emissions would be limited and climate change impacts mitigated. One major obstacle in CO2 reuse is the high stability of the molecule. Considerable energy input is needed to activate CO2 for further use and large-volume CO2 conversion processes are currently limited to a few industrial processes (e.g., urea, methanol, carbonate, and formic acid production) [1,2]. Nature has evolved highly sophisticated mechanisms for carbon fixation and utilization. The reducing energy for CO2 reduction is either obtained from light-dependent reactions or from oxidation of inorganic compounds. Aerobic hydrogen-oxidizing bacteria (HOBs or Knallgas bacteria) assimilate CO2 by H2 oxidation. Provision of the reducing power by H2 oxidation is an efficient route in non-phototrophic CO2 assimilation and promises higher growth rates while promoting drastically less land, fresh water, and mineral requirements as compared to photosynthetic organisms [3,4]. The HOB Cupriavidus necator was compared to the green microalga Neochloris oleoabundans in microbial CO2 fixation. C. necator has been reported to exhibit 3–6 times higher energy efficiencies and higher biomass yields in comparison to N. oleoabundans in microbial CO2 fixation [5]. C. necator can accumulate polyhadroxyalkanoate as carbon storage to levels of up to 82% of the cell’s dry weight (on CO2 under chemolithotrophic conditions) [6,7]. The metabolism is tractable by genetic engineering, and alternative products from CO2 such as tailor-made polyhydroxyalkanoates or versatile organic solvents become available [8,9,10,11]. However, applications of C. necator and other HOBs for CO2 fixation are still hesitant despite the increasing demand for cheap feedstocks. The largest published HOB cultivation of 23 L was reported in 1976 [12]. The main reason for slow implementation of chemolithotrophic cultivations is technical hurdles, and thus high implementation costs due to the explosiveness of H2 and O2 mixtures (low ignition energy ≥ 0.016 mJ). Gases must be mixed on-site (requiring several gas lines), labs need safety measures (gas sensors, check-valves, ventilated hoods, explosion doors, antistatic workwear, etc.), and equipment must be explosion-proof (avoidance of ignition sparks and electrostatic discharges). Construction measures are time-consuming and explosion-proof equipment is, as a rule of thumb, at least 10 times more expensive than standard equipment (magnetic stirrers, bioreactors etc.). Finally, some residual uncertainty regarding lab safety remains despite all safety measures. In the last several years, a restricted number of labs equipped for fermentations of explosive gas mixtures were reported (with no claim to completeness [10,13,14,15,16,17]). In parallel, several groups engineered HOB strains (first and foremost C. necator). However, labs focusing on molecular biotechnology are generally not equipped for oxyhydrogen cultivations (exceptions e.g., [10,11,13,18]). Therefore, newly developed strains were often grown in closed jars or bottles flushed with gases once or twice a day (e.g., [8,9,16,19]). Obviously, fast-growing HOB strains are nutrient-limited under these conditions and strain characterization is affected (difficulties in measuring growth and nutrient levels).
In the present study, we report on reproducible, safe, and easy-to-perform chemolithotrophic cultivations of HOBs. Conditions for long-term strain maintenance of C. necator H16 were optimized and mineral media composition for chemolithotrophic cultivation was studied. An ATEX compliant cultivation system was developed and used to cultivate C. necator on a gram scale. We note that ATEX directives are EU directives describing the minimum safety requirements for workplaces and equipment used in explosive atmospheres. Dissolved oxygen concentration (DO) is generally considered the most critical parameter in the autotrophic cultivation of HOBs [6,20]. Here, we compared different oxygen supply strategies: a constant oxygen supply adjusted to the oxygen need of the inoculum, a stepwise increased oxygen supply guided by the biomass formation over time, and a finely tuned oxygen supply guided by an implemented O2 dipping probe measuring the DO concentration. Our results pave the way towards a broader use of efficient, microbial CO2 assimilation.

2. Materials and Methods

2.1. Chemicals, Enzymatic Assays and Strains

The tryptic soy broth (TSB, CASO Buillon, X938.2) was from Carl Roth (Karlsruhe, Germany). The kanamycin sulfate (≥750 I.U./mg, T832.1), ampicillin sodium salt (≥97%, K029.5), chloramphenicol (≥98.5%, 3886.1), geneticin disulfate (Bio-Science grade, 2039.2), and erythromycin (≥98.0%, 4166.1) were from Carl Roth. The tetracycline (≥98.0%, 87128) was from Fluka (Vienna, Austria) and poly-(R)-3-hydroxybuttersäure (quality level 200, 363502) from Sigma-Aldrich (Vienna, Austria). Other chemicals were from Sigma-Aldrich/Fluka or Carl Roth and were of the highest purity available. An enzymatic assay for ammonium (K-AMIAR) was obtained from Megazyme International (Wicklow, Ireland). The strain C. necator H16 DSM 428 (aka ATCC 17699, NCIB 10442) was from DSMZ, Deutsche Sammlung für Mikroorganismen und Zellkulturen.

2.2. Growth Media

The TSB media was prepared with 30 g/L TSB supplemented and 50 mg/L kanamycin sulfate, if not mentioned otherwise (note that no additional C-source was added to TSB media). The mineral media (MM) was prepared as described by Atlić et al. [21] (Table 1) with small modifications. Kanamycin sulfate (end concentration 50 mg/L) was added to part 1 prior to autoclaving. Parts 1 to 5 were autoclaved separately, and part 6 was sterile filtered (0.2 μm). Parts were combined prior to cultivation. For media with B12, 0.01 to 10 mg/L B12 (sterile filtered) was added to the media. In chemolithotrophic cultivations, 2 g/L fructose were added. For agar plates, mineral media with 20 g/L agar-agar and 10 g/L fructose was used.

2.3. Heterotrophic Cultivations

For precultures, 300 mL baffled flasks (50 mL TSB or MM with fructose) were inoculated from agar plates and incubated at 30 °C and 110 rpm (Rotary shaker CERTOMAT BS-1) for 24 h. Main cultures (300 mL baffled flasks, 50 mL TSB media, or MM with fructose) were inoculated with 1 mL of preculture to start optical densities 600 nm (OD600) of ~0.2 and incubated at 30 °C and 110 rpm for 2 days, unless otherwise stated.

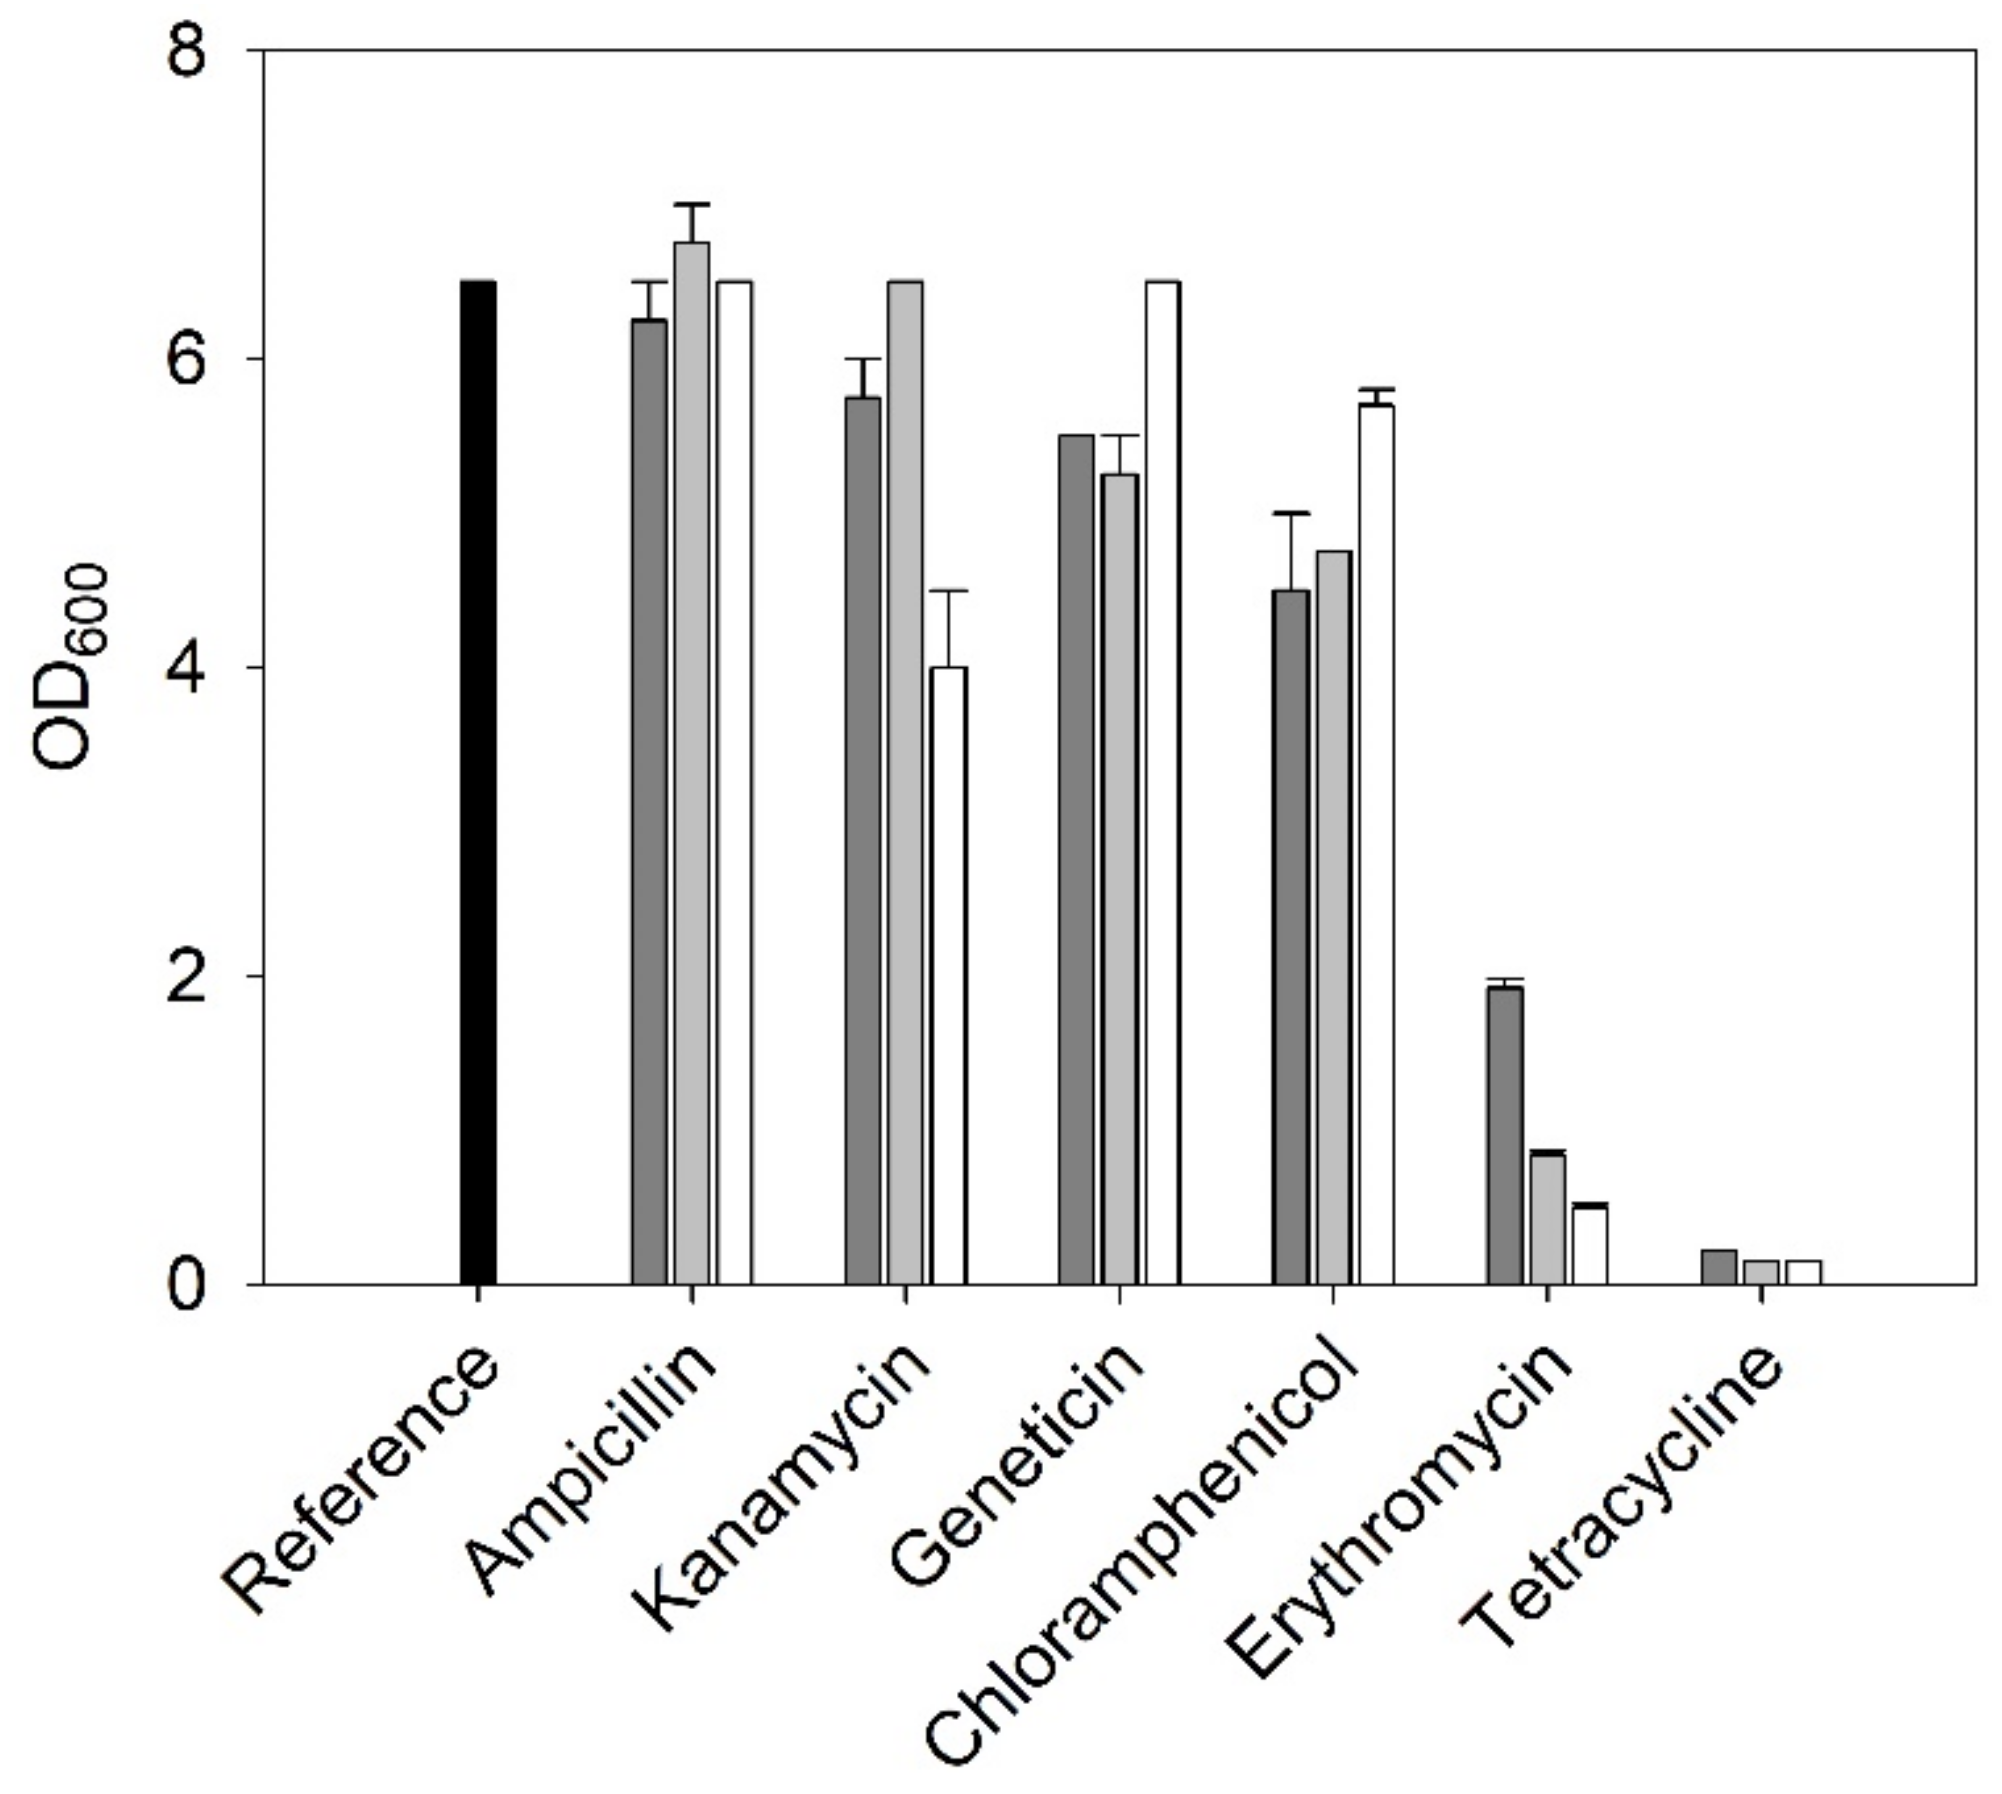
2.3.1. Antibiotic Resistances

TSB main cultures (300 mL baffled flasks) were used to study antibiotic resistances. The media was supplemented with six antibiotics, each applied at three different concentrations: kanamycin (50; 25; 10 mg/L), ampicillin (115; 58; 23 mg/L), chloramphenicol (34; 17; 6.8 mg/L), geneticin (50; 25; 10 mg/L), tetracycline (50; 25; 10 mg/L), and erythromycin (30; 15; 6 mg/L). All antibiotics were sterile filtered (0.2 μm) and added to the autoclaved media. Cultures without antibiotics served as reference. The OD600 was measured after 48 h. Experiments were done in duplicates.

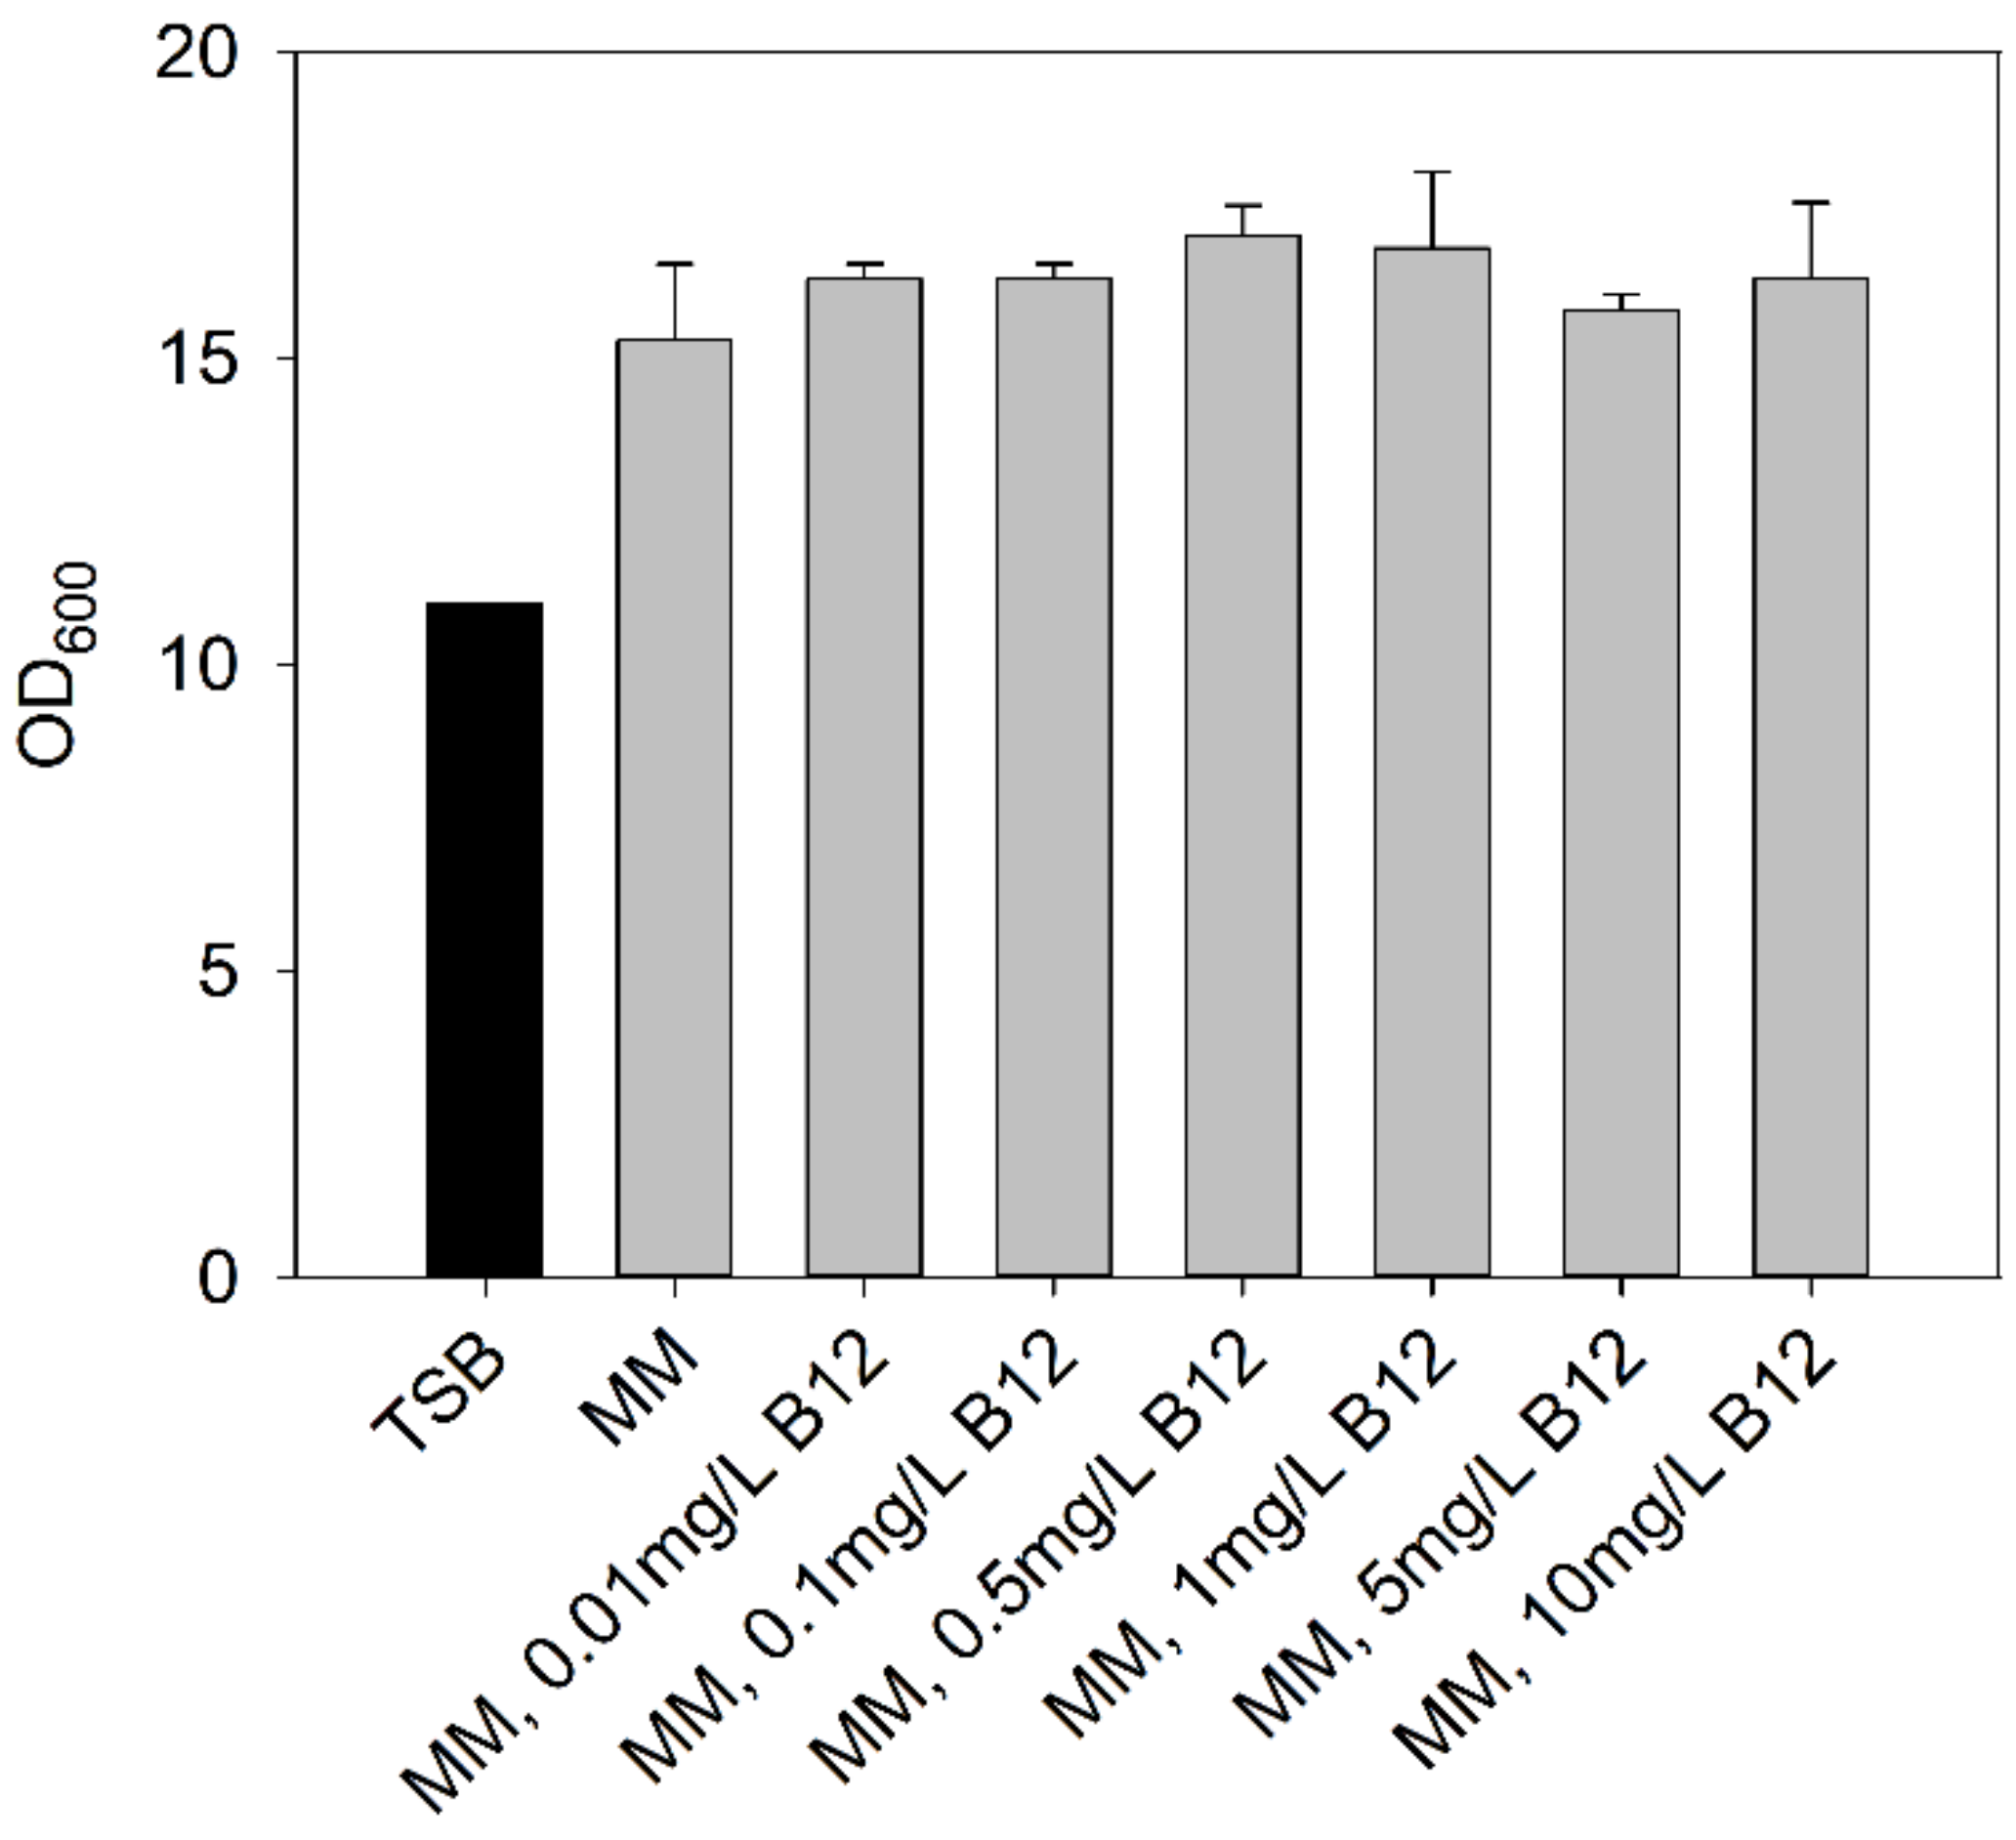
2.3.2. Comparison of TSB and MM

Precultures and main cultures were prepared with the respective media in 300 mL baffled flasks (50 mL TSB or MM with fructose). Experiments were done in duplicates.

2.3.3. Effect of Cultivation Temperature on Growth

Precultures were cultivated in 300 mL baffled flasks with 50 mL MM and incubated at 30 °C and 110 rpm for 24 h. Main cultures were either cultivated in 1 L baffled shaken flasks (with a magnetic bar of 70 × 10 mm, 250 mL of MM) or in a 1 L DURAN® GLS 80 wide-neck threaded glass bottle with a magnetic anchor stirrer (from DWK Life Sciences purchased at Roth, Germany) (950 mL MM). Mixing was accomplished by stirring at 400 rpm on magnetic stirrers. Main cultures were inoculated to OD600 of ~0.2. Cultures in 1 L baffled flasks were stirred at room temperature (22–24 °C) and 30 °C. The DURAN® GLS 80 bottle was stirred at room temperature. The OD600 was measured over time. Experiments were done in duplicates.

2.3.4. Determination of Optical Density (OD600) and Cell Dry Mass (CDM)

The wavelength for optical cell density measurements was set to 600 nm according to wavelength scans of pure TSB and MM media (Figure S1 in the Supplementary Information). Cell dry mass (CDM) was determined gravimetrically. Note that there was no differentiation between microbial biomass and stored polyhydroxybutyrate. The correlation factor of gCDM/OD600 was 0.246 with a R² of 0.965 (Figure S2 in the Supplementary Information).

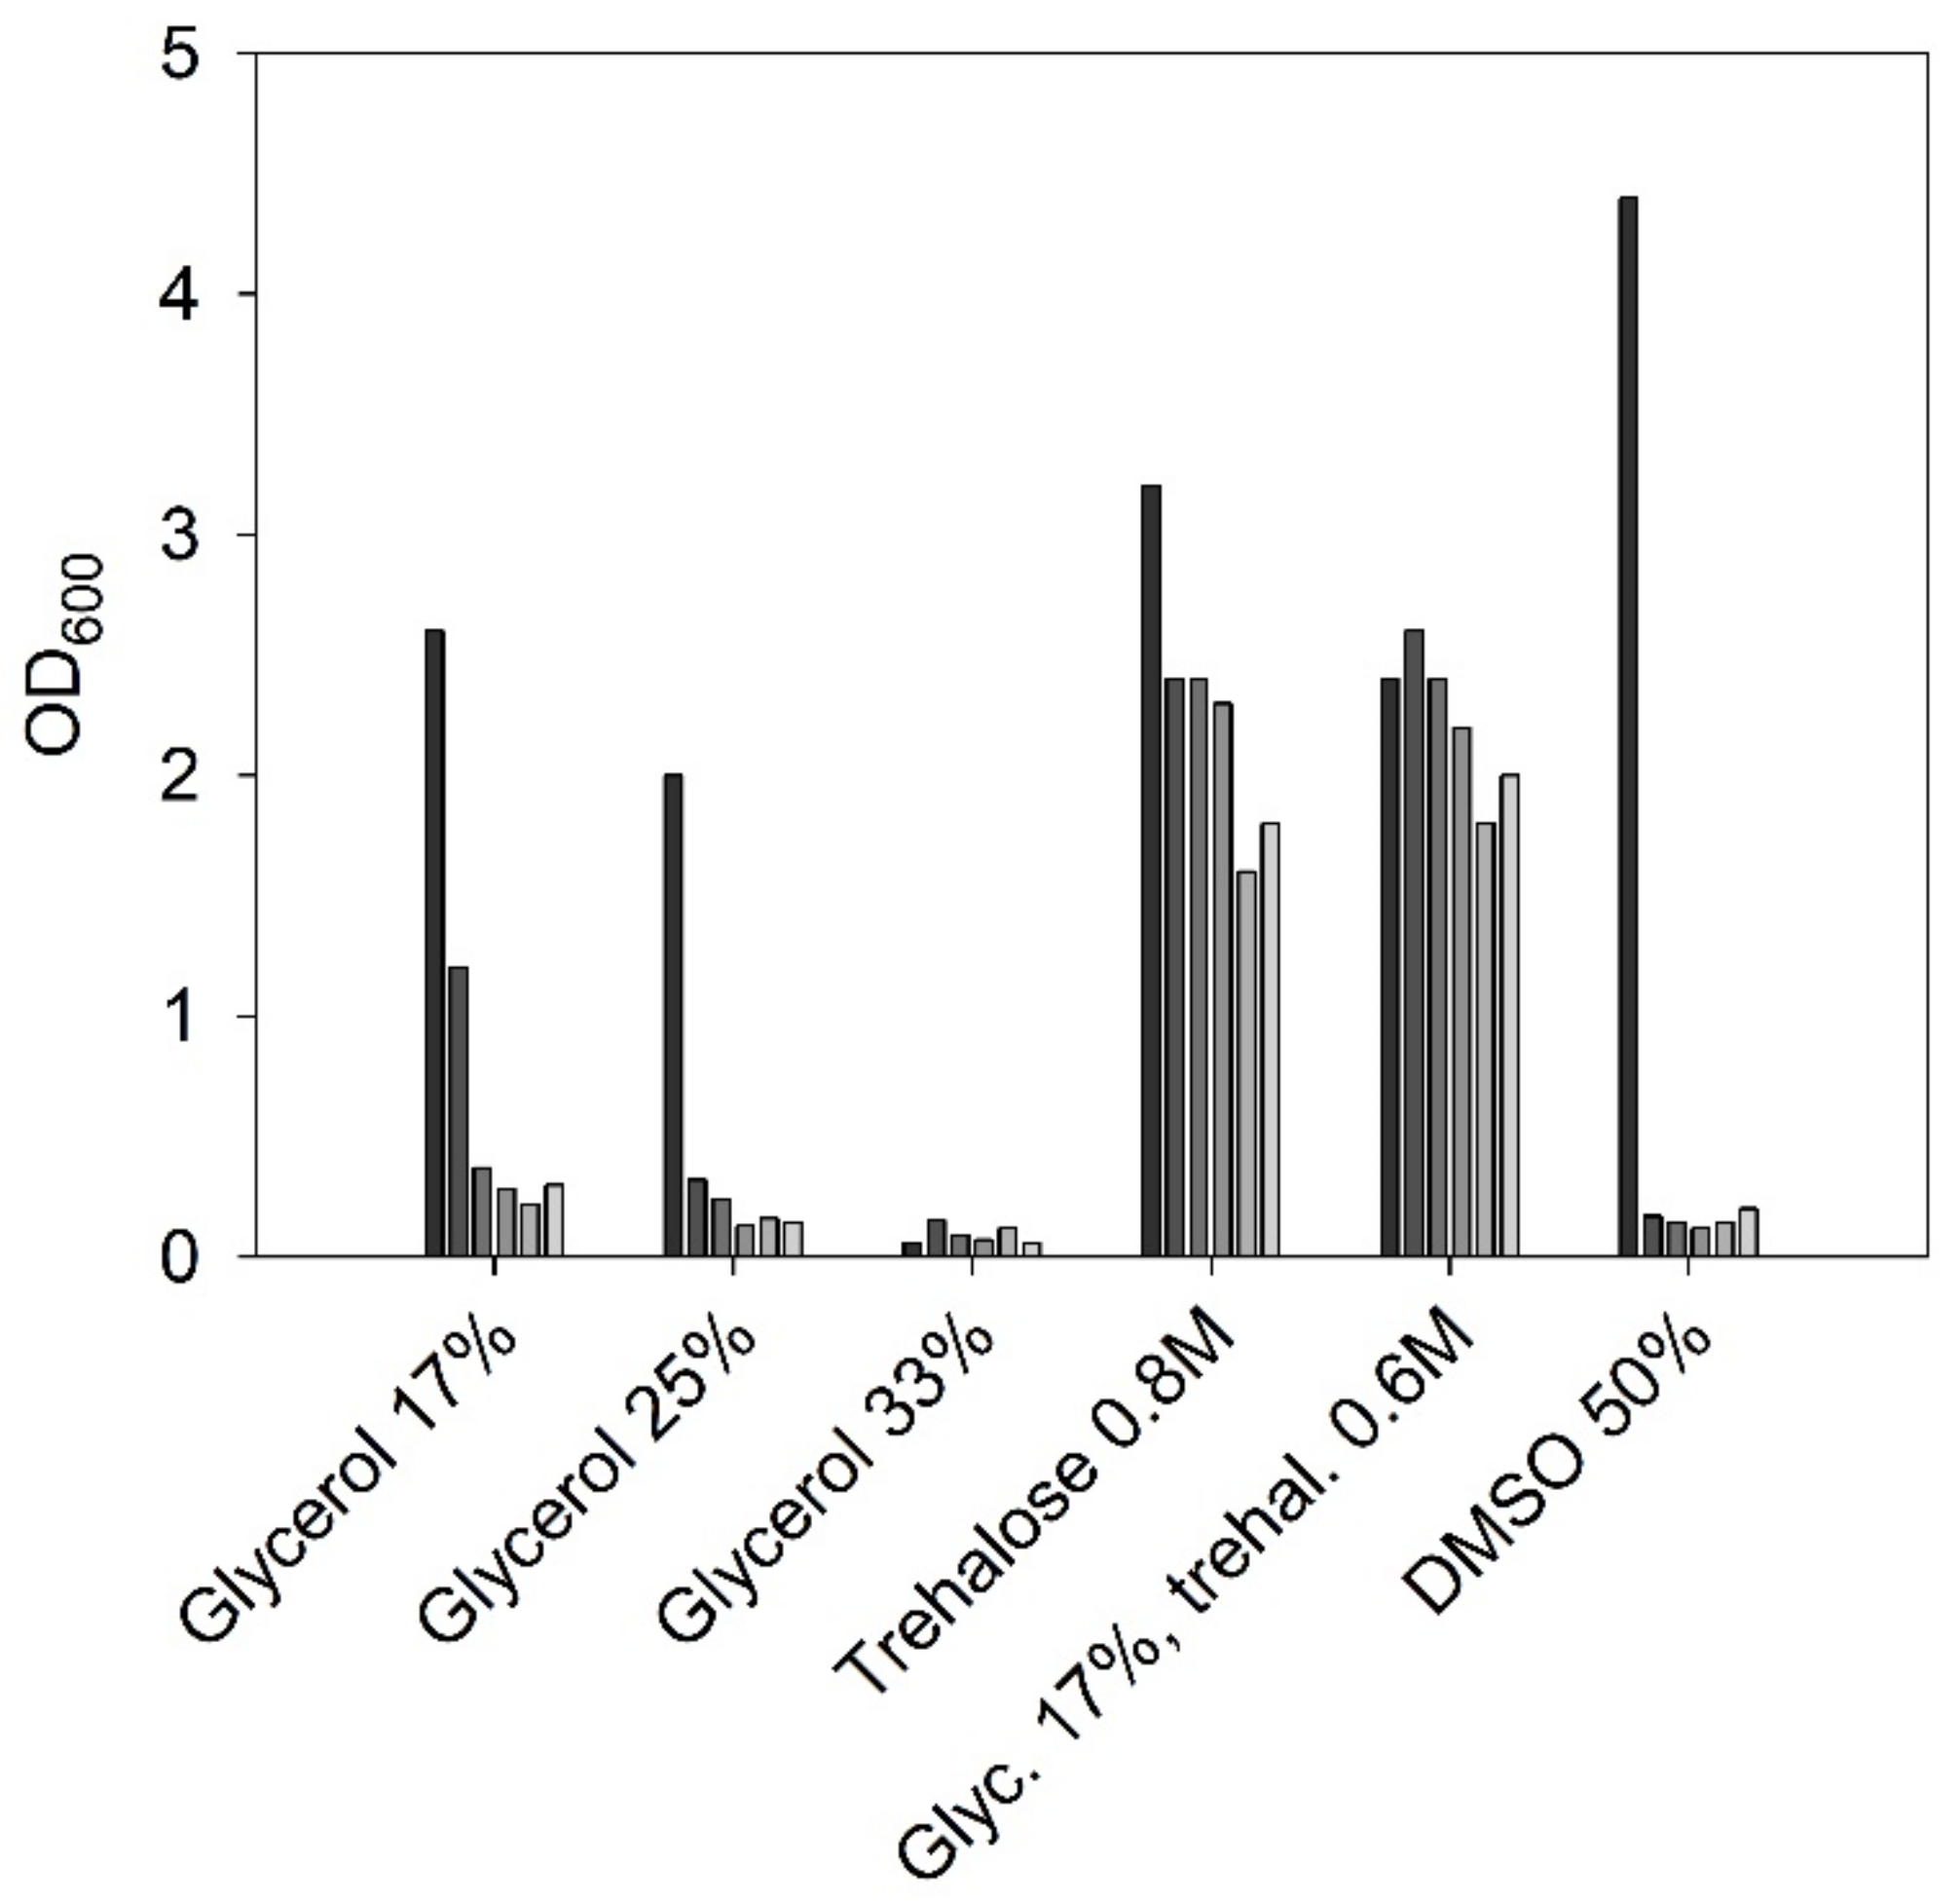
2.4. Preservation of C. necator H16

For short-term storage of up to 1 month, cells were maintained on TSB or minimal medium agar plates at 4 °C. For long-term storage, cryoservation solutions containing glycerol, trehalose, and DMSO were tested. Stock solutions of glycerol, trehalose, and DMSO were mixed with the cell suspension (overnight cultures in TSB media) to end concentrations of 17%, 25%, and 33% glycerol, 0.8 M trehalose, 17% glycerol + 0.6 M trehalose, or 50% DMSO. Cryoservation stocks (2 mL free-standing cryogenic vials, with outer thread from Carl Roth) were frozen in liquid N2 and stored at −80 °C. Every second month, 300 mL baffled flasks with 50 mL TSB media were inoculated with 75 μL cells from cryoservation stocks. After 24 h of cultivation, the OD600 was measured.

2.5. Chemolithotrophic Cultivation (Oxyhydrogen Cultivation)

Explosion safety to ensure personal and technical safety was considered according to Austrian and European standards (ATEX directive RL 1999/92/EG and RL 2014/34/EU). In Figure 1, a detailed scheme of the ex-safe cultivation set-up is displayed. Gas lines for the mixed substrate gas, the interior of the bioreactor, and the off-gas line were defined as ex-zone 0 (the area in which an explosive atmosphere is present continuously or for long periods). The remaining interior of the room and fume hood was defined as ex-zone 2 (no ex-zone 1 was defined due to strong ventilation by the fume hood, see below).

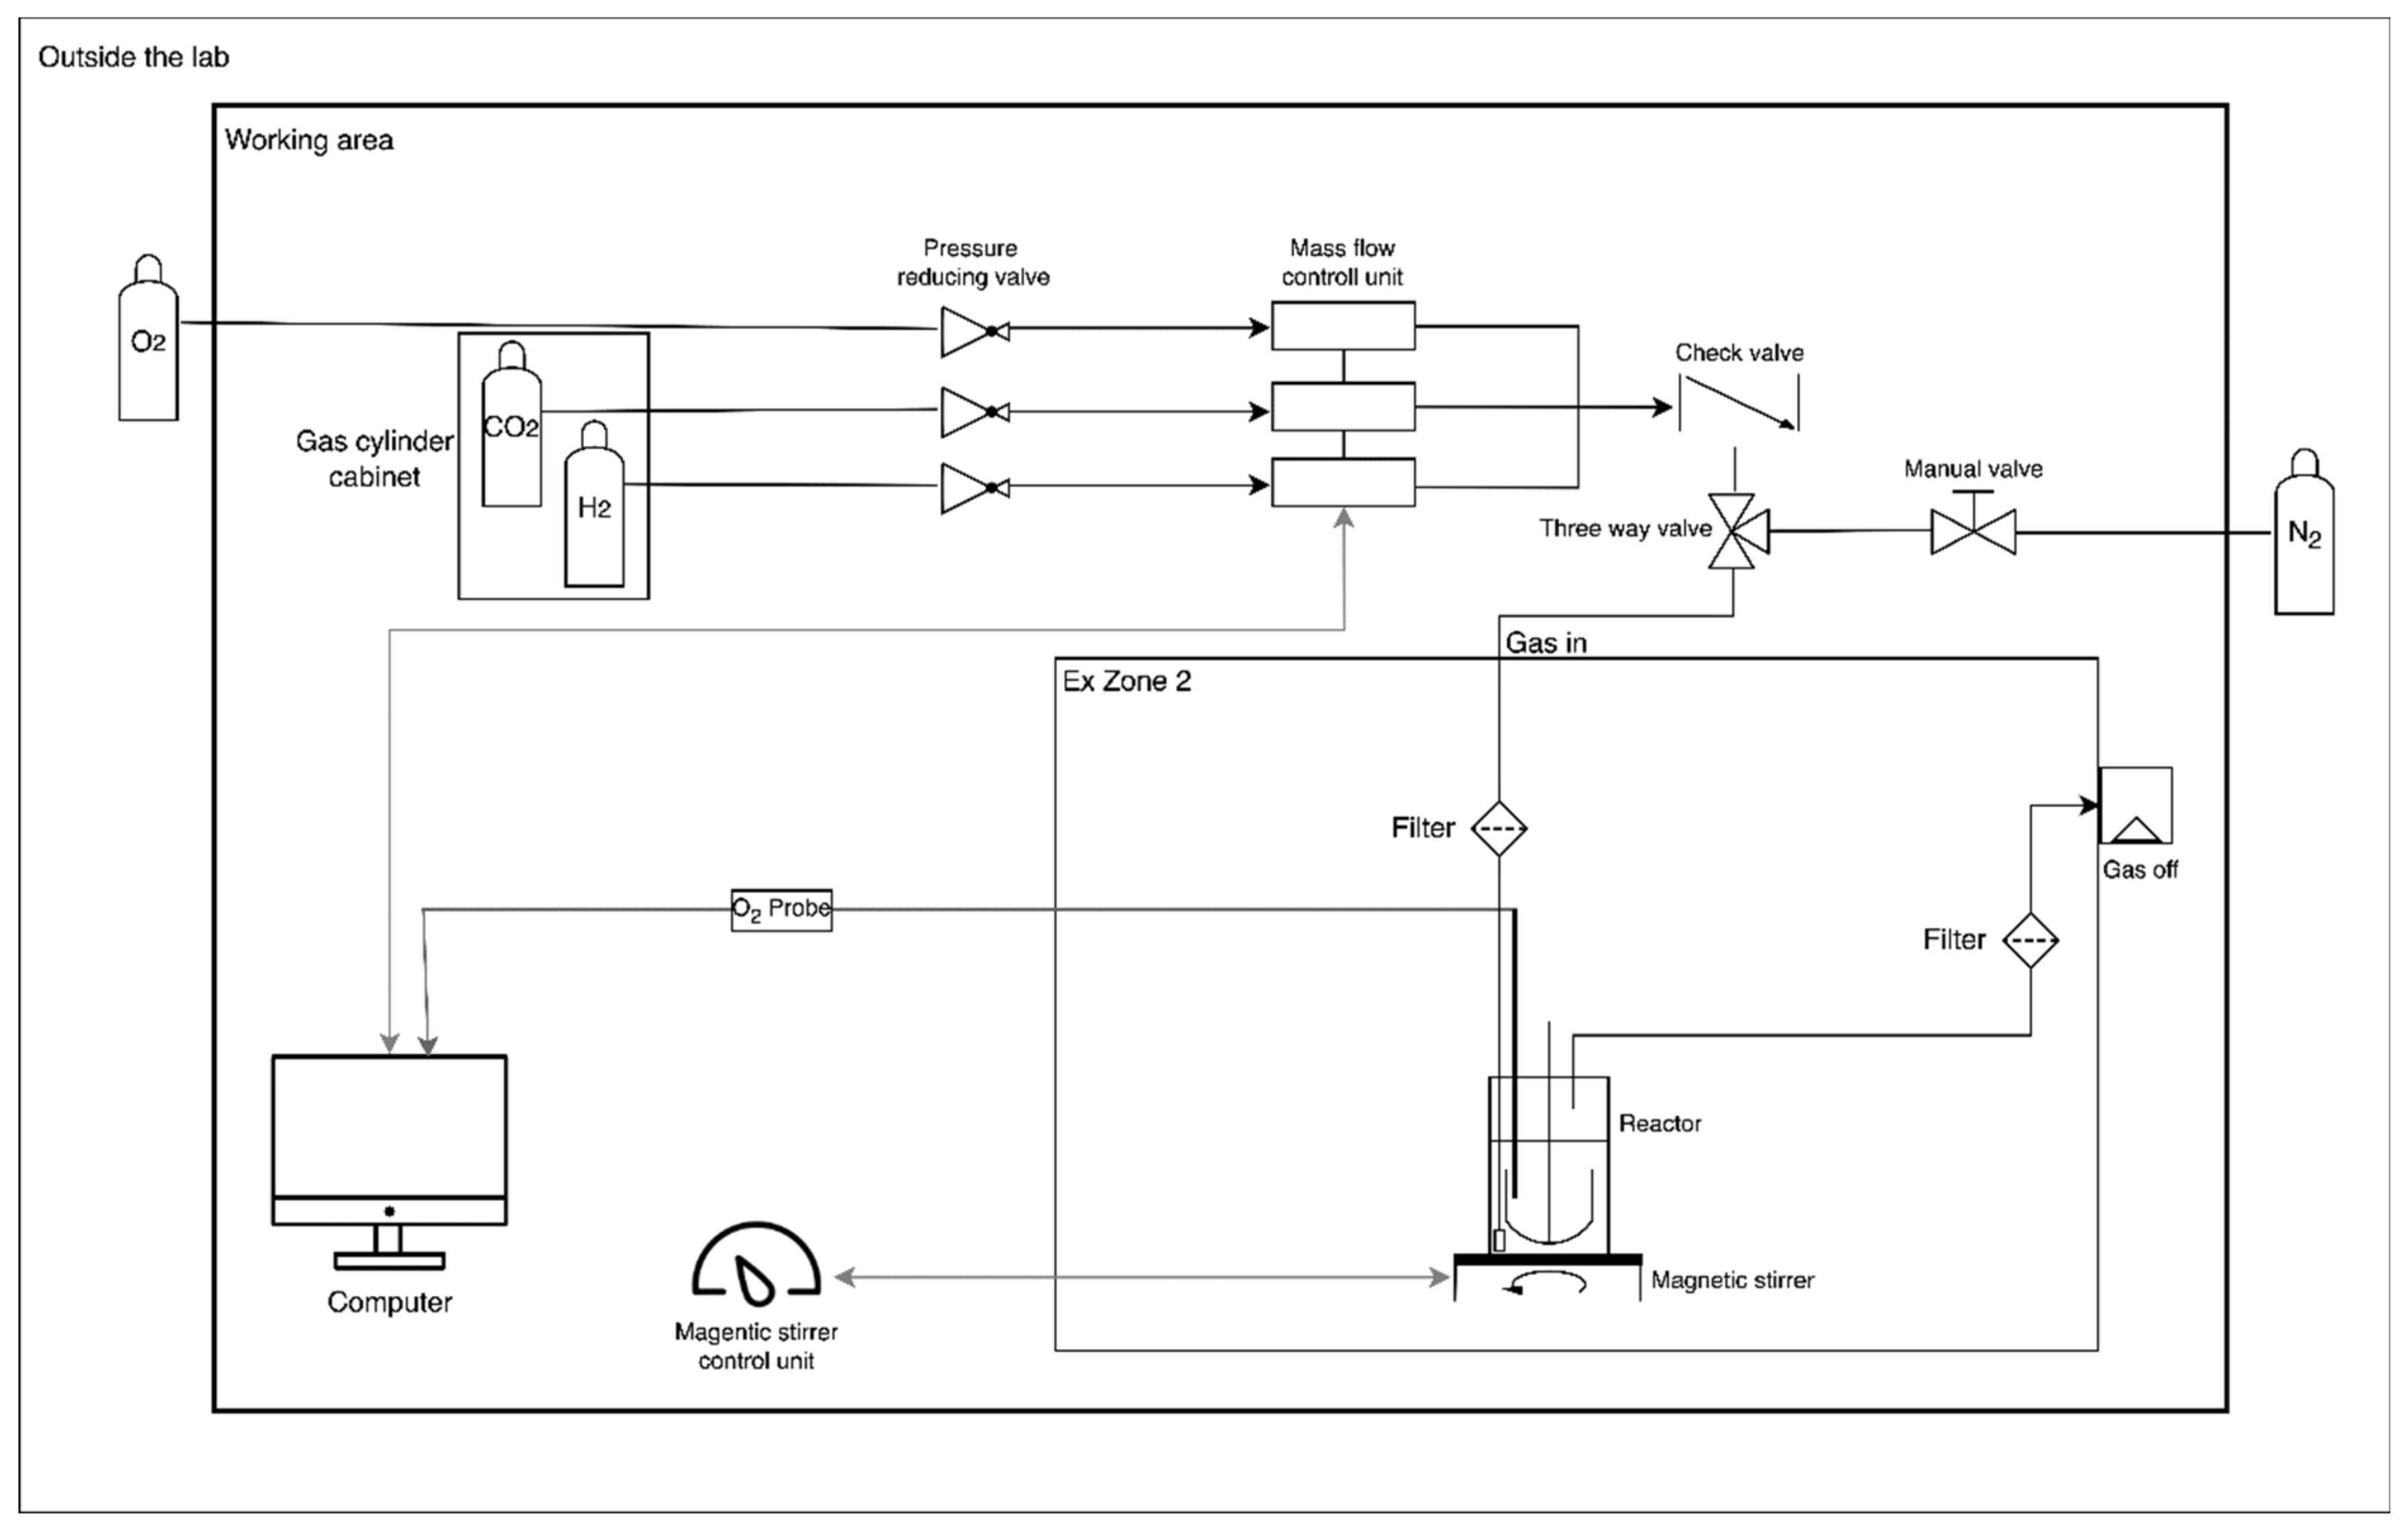
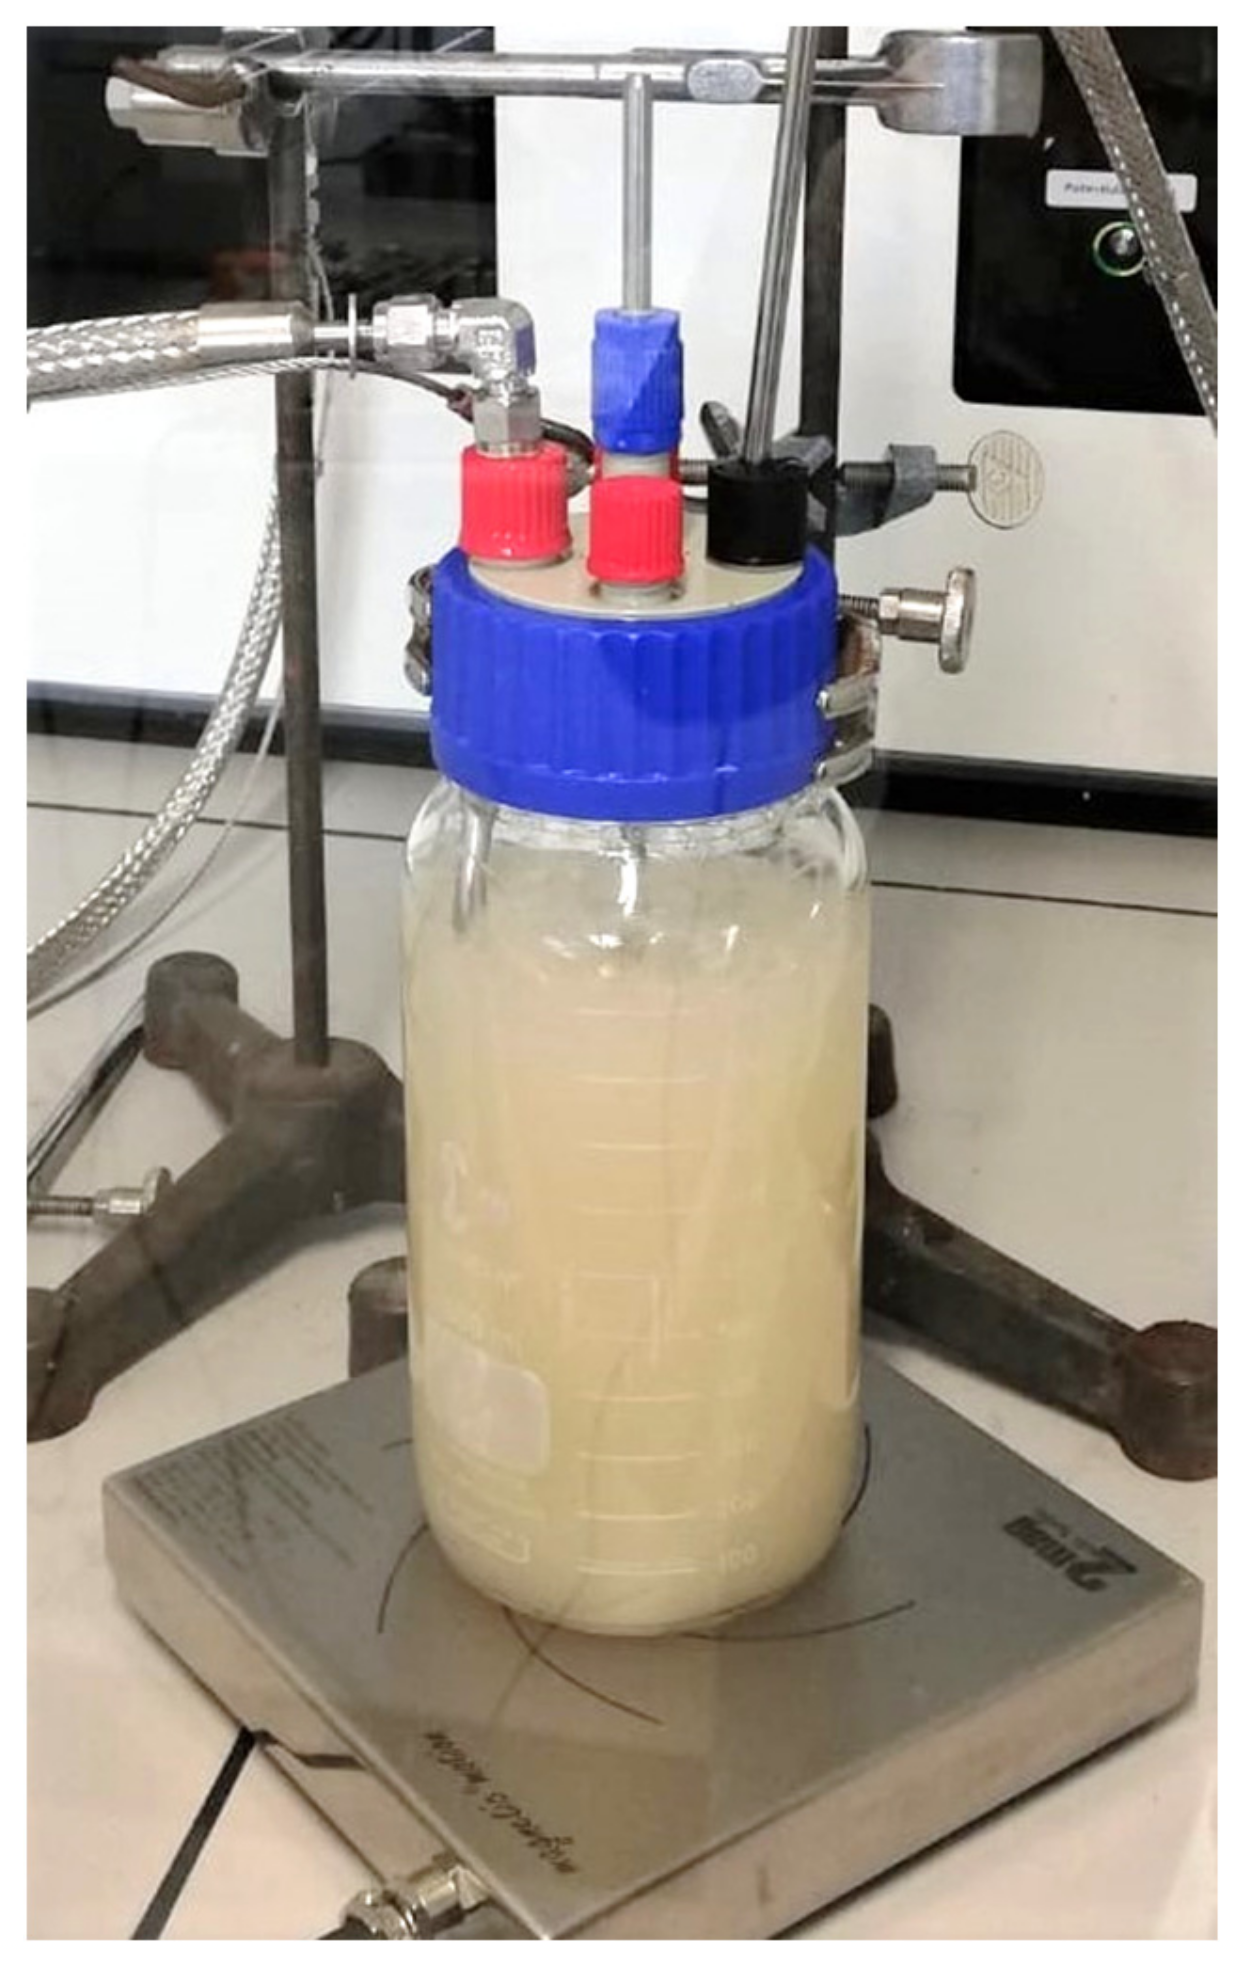
2.5.1. Installations and Equipment

The room had an antistatic floor and a pressure relief flap (40 × 40 cm). The room was equipped with two gas cylinder cabinets with pressure-reducing valves (O2 and H2 separated, cylinder cabinet for H2 ventilated with 60 m³/h), gas lines and gas mass flow controllers for CO2, H2, O2 (MFCs; red-y smart controller from Vögtling Instruments GmbH, Switzerland), and an additional gas line for the inert gas N2. Gas flow rates of CO2, H2, and O2 were adjusted online by the respective MFCs using the get red-y software (from BURDE•CO GmbH, Vienna, Austria). A RF 53 series check valve (Wittgas Gastechnik GmbH & Co KG, Witten, Germany) was installed directly after the gas mixer. The N2 was connected to the substrate gas line by a three-way valve to enable purging of the bioreactor prior to sampling. All gas cultivations were done under explosion-safe conditions in an ex-safe fume hood (559 m³/h; Secuflow from Waldner, Germany, Wangen, for use in zone 1 II2G/Gb according to ATEX directive RL 1999/92/EG). The fume hood had an H2 sensor coupled to an automatic 2/2-way magnetic valve (Tescom Europe Selnsdorf, Germany). Experimenters wore safety glasses, antistatic lab coats, antistatic shoes, and a portable gas detector (MSA Multi-Gaswarngerät Altair 4XR, Schloffer Arbeitsschutz GmbH, Hart bei Graz, Austria).
The gas cultivation setup is displayed in Figure 2. The substrate gas passed H2-tight, autoclavable, polyvinylidene fluoride filters (filter #12.32.5K 99.99% removal of 0.1 micron particles, stainless steel housing #SS117.201 purchased at BURDE•CO) prior and subsequent to the cultivation vessel. Off-gas was drained into the fume hood exhaust air. As the cultivation vessel, a stirred 1000 mL DURAN® GLS 80 wide-neck threaded glass bottle was used. A stirrer reactor cap GLS 80 with a magnetic anchor stirrer was attached (from DWK Life Sciences purchased at Roth, Germany). A magnetic stirrer atexMIXdrive (2 mag AG, Munich, Germany) ensured explosion-proof stirring. The substrate gas mixture was supplied through a 6 mm steel tube connected to a 5 mm silicon tube ending in a PTFE frit (product code 01018-22707, Agilent Technologies Österreich GmbH, Vienna, Austria). Online monitoring of dissolved oxygen (DO) was established using an oxygen-dipping probe DP-PSt3 from PreSens GmbH, Regensburg, Germany. The oxygen-dipping probe consisted of a polymer optical fiber (coated with an oxygen-sensitive foil at the end), covered in a high-grade steel tube (35 cm) to facilitate fitting of the probe into the reactor. The steel tube was connected to an equipotential socket in the hood. Read-out electronics were outside of the ventilated hood (facilitated by the 2.8 m fiber-optical cable). No ignition sources were in the ventilated hood. The outlet for the off-gas was a steel pipe connected to a gas-tight, flexible tube.

2.5.2. Determination of the Volumetric Oxygen Transfer Coefficient (kLa)

The kLa of the bioreactor was determined with the “static gassing-out” method [22]. The DO concentration was measured with the O2-dipping probe in MM without cells (see also Figures S3 and S4 in the Supplementary Information). First, the media was gassed with O2 for 30 min. The subsequently measured DO value represented the maximum amount of O2, referred to as O* and 100% oxygen saturation. (The read-out of the dipping probe was % oxygen saturation.) Next, the media was degassed with N2 for 30 min. Then, the O2 gas flow was set to 100, 200, and 400 mL/min at 340 rpm stirrer speed. The increasing DO concentration was measured over time and recorded (as % oxygen saturation).
The kLa was determined using the integrated form of Equation (1).
dDO dt = k L a O * DO   integration     ln O * DO = k L a   t
The response time of the O2-dipping probe (t90) was <40 s as specified by the manufacturer.

2.5.3. Calculation of Henry’s Law Constant Hcp and Oxygen Transfer Theory

O* is proportional to the partial pressure pO2 of O2 in the gas mixture and the Henry’s law constant Hcp (1.3 · 10−3 M/atm at 25 °C in pure water) as a proportionality factor (Equation (2)).
O * =   H cp p O 2  
In a typical cultivation medium, O2 solubility is considered 5 to 25% lower than in water. Here, we calculated a Hcp of 1.18 mM/atm (according to Schumpe et al. [23]).
The actual concentration of the DO in the bioreactor is a dynamic value constituted by the oxygen transfer rate (OTR) and the oxygen uptake rate (OUR). The OTR depends on O* (equilibrium O2 concentration), the liquid phase mass transfer coefficient kL and the specific exchange area a (gas–liquid interfacial area per unit of fluid) (Equation (1)).
The OUR depends on the biomass concentration X and the specific O2 consumption rate qO2 (Equation (3)).
dn dt =   q O 2 X   =   OUR
In a quasi-steady state, the OTR equals the OUR (Equation (4)).
OTR   =   OUR

2.5.4. Gas Cultivations

Gas cultivations were done either with constant gas flow rates (low and high pO2), with manually increased oxygen supply guided by the biomass concentration (biomass concentrations measured from samples taken over time) or with manually increased oxygen supply guided by the DO concentration (in situ measurement of DO concentration using the O2-dipping probe, referred to cultivations 1 to 4 in the text).
For all chemolithotrophic experiments, precultures were cultivated heterotrophically in MM with fructose overnight (end OD600 ~ 9). For the main culture, the autoclaved 1 L DURAN® bottle was filled with 950 mL MM and 50 mL preculture under sterile conditions (start OD600 < 1.4). If used, the O2-dipping probe was chemically sterilized with ethanol 70% (v/v) and fit into the reactor. The filled bioreactor was connected to the substrate gas and off-gas lines. Tightness of connections was checked with the purge gas N2 and a leak detector spray. H2, CO2, and O2 gas flows (NmL/min) were adjusted online. Total flow rates of 100 to 400 NmL/min were used. Two to three samples were taken per day. Prior (and subsequent) to opening the cultivation vessel, the substrate gas was switched off and the whole system was purged with N2 for 5 min. Samples were taken with a syringe with a 120 mm needle. Gas supply was summarized in Table 2. Note that individual partial pressures (and hence dissolved gas concentrations) do not depend on total gas flows according to Dalton’s law.
In experiments with increased oxygen supply, the O2 flow rate was manually adjusted using the get red-y software of gas mass flow controllers.

2.5.5. Sample Analysis with PHB Quantification

All samples were taken in duplicates. OD600 of samples was measured in quadruplicates. 5 mL of cell culture was transferred into 15 mL Sarstedt tubes and centrifuged for 30 min. The supernatants and pellets were stored at −20 °C for further analysis. The ammonium concentrations were determined in the supernatant with the Megazyme assay kit K-AMIAR according to the supplier’s manual. PHB content was analysed on GC. Samples were prepared according to Atlić et al. [21] with small modifications. Pellets were lyophilized and suspended in at least 10-fold pure EtOH (96%) (for small pellets, more EtOH was used to achieve sufficient mixing). Samples were stirred on a magnetic stirrer for 1 day at room temperature. After centrifugation for 30 min at 5000 rpm, the supernatant was discarded. Samples were dried at 70 °C for 2 h, transferred into glass vials with 30-fold chloroform (w/w) and stirred for 1 day at room temperature. PHB was precipitated by the addition of ice cold EtOH (96%) and filtered through a Whatman filter paper (HK26.1, Carl Roth). The filter cake was dried overnight at room temperature under the fume hood. Dry PHB was scratched from the weighted filter paper and transferred into new glass tubes. At this step, 11 ± 2% of purified PHB was lost. 2 mL of esterification mixture (94.9 mL MeOH, 5 mL H2SO4, 0.108 mL hexanoic acid, and 2 mL of chloroform were added, and the glass tubes were tightly closed. For transesterification, the samples were shaken at 95 °C in a water bath for 3.5 h. Tubes were cooled down to room temperature and 1 mL of NaHCO3 (10% w/v) was added. Samples were vortexed for 5 min. After 15 to 30 min, the organic phase was transferred into a GC vial using a glass Pasteur pipette and closed tightly. PHB content was analysed on GC using a ZB-5 column (Phenomenex, 30 m length, 0.32 mm inner diameter and 0.25 μm film thickness) and an FID detector according to Juengert et al. [24]. As reference, a standard curve with pure PHB was prepared (R² 0.9999). Standards were treated like the isolated PHB. PHB content in percent per CDM was calculated. The 11 ± 2% weight loss of PHB during transfer from the filter paper into the glass vial was considered. During the transfer from the Sarsted tube into the glass vial, less than 1% of cell dry matter was lost and not considered for PHB calculations.

3. Results

3.1. Heterotrophic cultivation

3.1.1. Antibiotic Resistances of C. necator H16

Addition of antibiotics is the most common strategy in the cultivation of microorganisms to prevent growth of contaminating microbes. Here, we decided to add an antibiotic as the bioreactor had to be opened for sampling. A range of strain-dependent resistances to antibiotics have been reported for native C. necator strains [25,26,27]. Fast adaptivity of C. necator might also lead to altered antibiotic resistances [28,29]. Therefore, resistances of the used C. necator H16 strain against six antibiotics generally used in the cultivation of microorganisms were probed, and the effect on culture density quantified after 2 days of cultivation (Figure 3). The addition of 115, 57.5, or 23 mg/L ampicillin and 50, 25, or 10 mg/L kanamycin or geneticin did not significantly affect growth. The presence of 34, 17, or 6.8 mg/L chloramphenicol slightly reduced OD600 after 2 days. OD600 of ~70% compared to the reference culture was obtained at the highest chloramphenicol concentration. The addition of 30, 15, or 6 mg/L erythromycin diminished culture densities to between 8 and 32% as compared to the reference. The presence of 50, 25, or 10 mg/L tetracycline totally inhibited growth. Kanamycin was chosen as the most suitable antibiotic in all further experiments for the following reasons: it does not inhibit the growth of C. necator at a concentration of 50 mg/L, it can be added to the medium prior to autoclaving, and it is used as a standard antibiotic in biotechnological labs.

3.1.2. Heterotrophic Cultivations Using Mineral Media (MM)

Chemolithotrophic growth facilitates formation of biomass from CO2, H2, O2, and ammonium salts without a further carbon source. Here, we used a mineral medium reported for heterotrophic cultivations of C. necator described by Atlić et al. [21] supplemented with tungsten (recommended by Cramm, [30]) (Table 1). As a C-source, 20 g/L fructose was added to the mineral medium. After 2 days of cultivation, OD600 values reached 19 and 11 with MM and TSB media, respectively. Motivated by a notion in Pohlmann et al. [31] that C. necator H16 is not able to produce vitamin B12 (though it can bypass vitamin B12-dependent reactions), we added 0.01 to 10 mg/L of vitamin B12 to the MM with fructose. No effect of B12 supplementation was seen (Figure 4).

3.1.3. Effect of Temperature on Growth Rate

Temperature control in an explosive atmosphere adds complexity to the cultivation system. Autotrophic cultivation at room temperature without temperature control was hence aimed at. Comparison of microbial growth in heterotrophic cultivations performed at room temperature (22–24 °C) and at 30 °C was used to study the effect of lower temperature on microbial growth. The maximum growth rate in MM was 1.4 times higher at 30 °C as compared to room temperature (μmax,30°C 0.17 ± 0.01 versus μmax,RT 0.13 ± 0.01 h−1). After 3 days, all cultures had reached optical densities (OD600) of 37 (for growth curves and rates, see Supplementary Information Table S1 and Figure S5).

3.1.4. Strain Maintenance

Setup of a reproducible oxyhydrogen cultivation system for C. necator requires stable short-term and long-term strain maintenance. Cultures grown on agar plates were storable at 4 °C for at least 4 weeks. Low recultivability from cryostocks kept at −80 °C with glycerol as cryoprotectant was observed. Therefore, recultivability of cells from cryostocks containing different cryoprotectants was tested. Recultivability after 1 to 11 months of cells stored in glycerol (33%, 25%, 17%), trehalose (0.8 M), DMSO (50% v/v), and glycerol and trehalose (17% glycerol, 0.6 M trehalose) is displayed in Figure 5. After 11 months, the highest recultivability in 0.8 M trehalose and 0.6 M trehalose with 17% glycerol was experienced.

3.2. Chemolithotrophic Cultivation

C. necator, as a HOB, forms biomass from CO2 as a carbon source using H2 as an electron donor and O2 as an electron acceptor. Reported substrate gas mixtures indicate ratios of 7:1:1, 7:2:1, or 65:25:10 (reviewed in 10). The two most evident problems connected with substrate gas mixtures containing H2 and O2 are their high explosion capability and low water solubility. Gases must be dissolved in the aqueous medium to be available for the cells, and the parameters of interest are therefore the dissolved gas concentrations [32]. The O2 concentration is of particular importance as growth of C. necator is reported to be inhibited at DO > 11.5 mg/L [33]. Previous results have indicated an extended lag phase when the DO was > 3 mg/L. The highest values for μ (and qO2) were observed with DO concentrations of ~2.6 mg/L [20].
The actual concentration of DO in the bioreactor is a dynamic value constituted by the oxygen transfer rate (OTR) and the oxygen uptake rate (OUR). An increasing biomass concentration at constant O2 supply leads to a decrease in the dissolved O2 concentration over time. For optimal growth, the O2 supply (OTR) needs to be increased to compensate for the increased biomass concentration and increased OUR.

3.2.1. Chemolithotrophic Cultivations with Constant Gas Flow

The substrate gas mixture was composed of H2:CO2:O2 in a ratio of 90:8:2 (total flow rate 400 NmL/min) and kept constant over the entire cultivation time. Gas supply was switched on after transfer of media (MM with 2 g/L fructose) and heterotrophically grown inoculum into the stirred bioreactor. A μmax of 0.008 h−1 and a final OD600 of 5 (1.2 gCDM/L) were obtained after 158 h (Figure 6) (μmax determination Supplementary Information Figure S6). The applied gas composition resulted in a pO2 of 0.0175 atm. According to Equation (2), with a Hcp of 1.18 mM/atm, the O* was calculated to be 0.7 mg/L. The linear shape of the growth curve indicated O2 limitation. However, gas cultivations starting with a relatively high O* of ~1.6 mg/L did not lead to chemolithotrophic growth of C. necator after 50 h (Supplementary Information Figure S7).

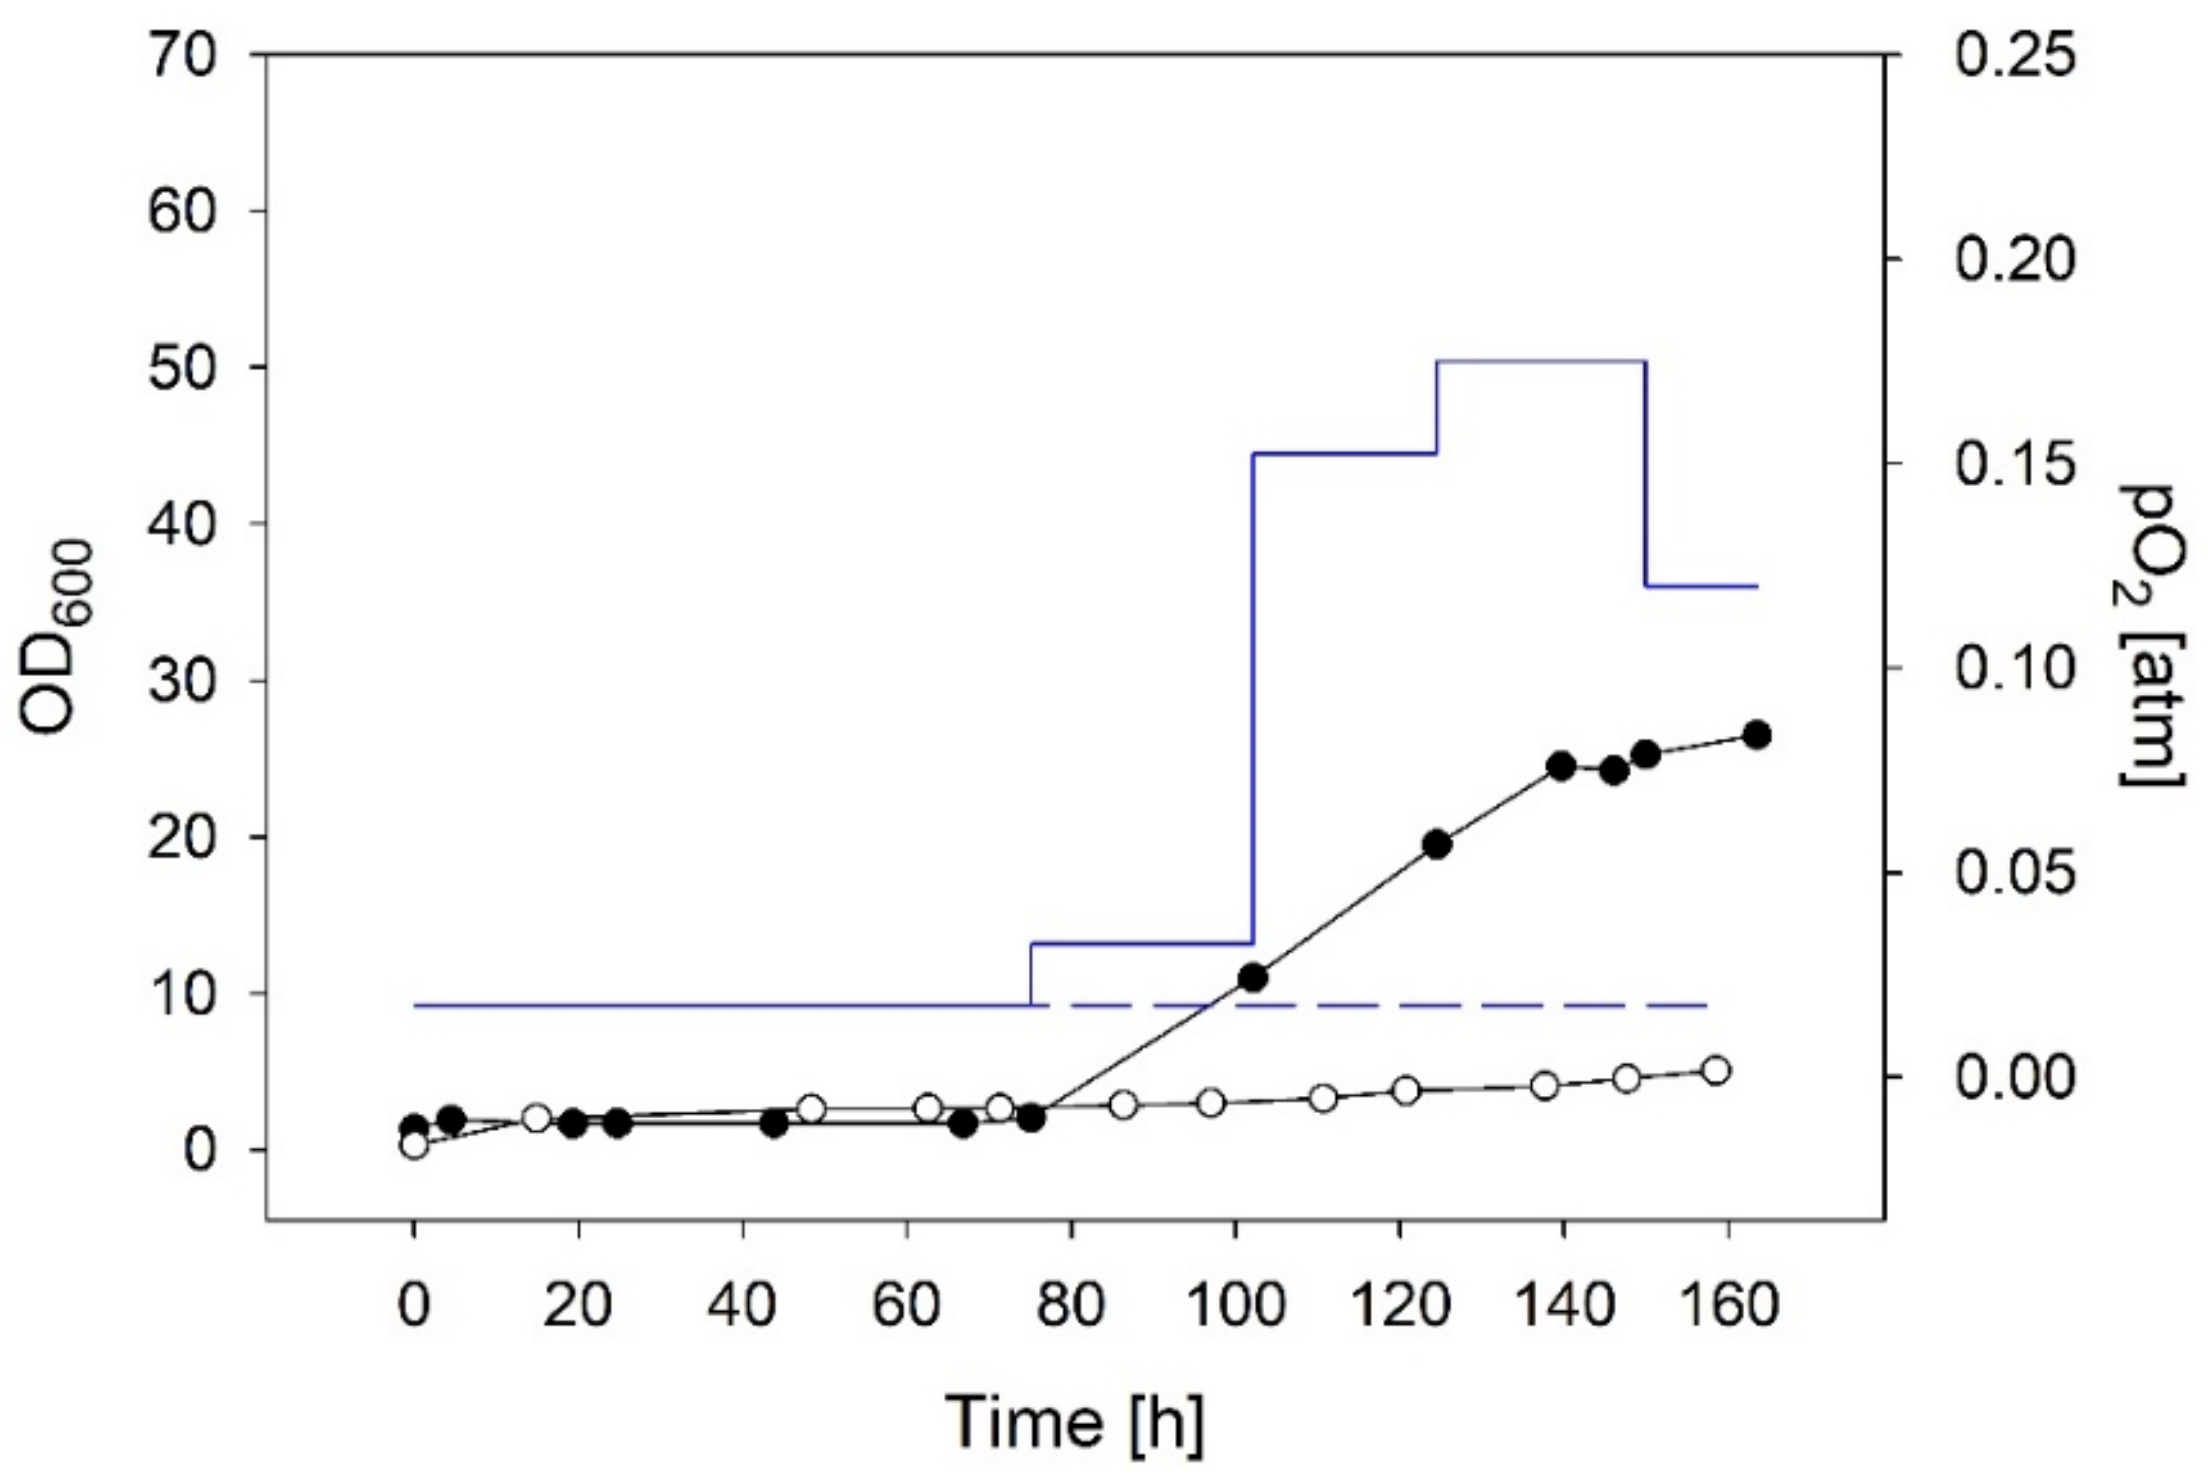
3.2.2. Chemolithotrophic Cultivations with Stepwise Increased Gas Flow Guided by the Biomass Concentration

Samples were taken over time, OD600 values were measured, and the biomass concentrations were calculated. An average qO2 of 1.4 mmol gCDM−1h−1 was anticipated because this value was at the lower end of qO2 values reported by Lu and Yu (2019) [15] and ensured low DO concentrations (below toxic levels) in autotrophic cultivations. OURs were calculated by multiplying current biomass concentrations (obtained from samples) with the average qO2 (Equation (3)). Assuming a quasi-steady state, the OTR equalled OUR (Equation (4)). The DO was set to zero which simplifies OTR to the product of kLa and O* (Equation (1)). The required O* was adjusted by the partial pressure of O2 mass flow (Equation (2); note that the O2 gas flow was reduced at 150 h as biomass formation rate decreased.) After 163 h, a final biomass concentration of 6.5 gCDM/L (OD600 26.5) and a μmax of 0.055 h−1 were obtained (Figure 6, μmax determination Supplementary Information Figure S6).

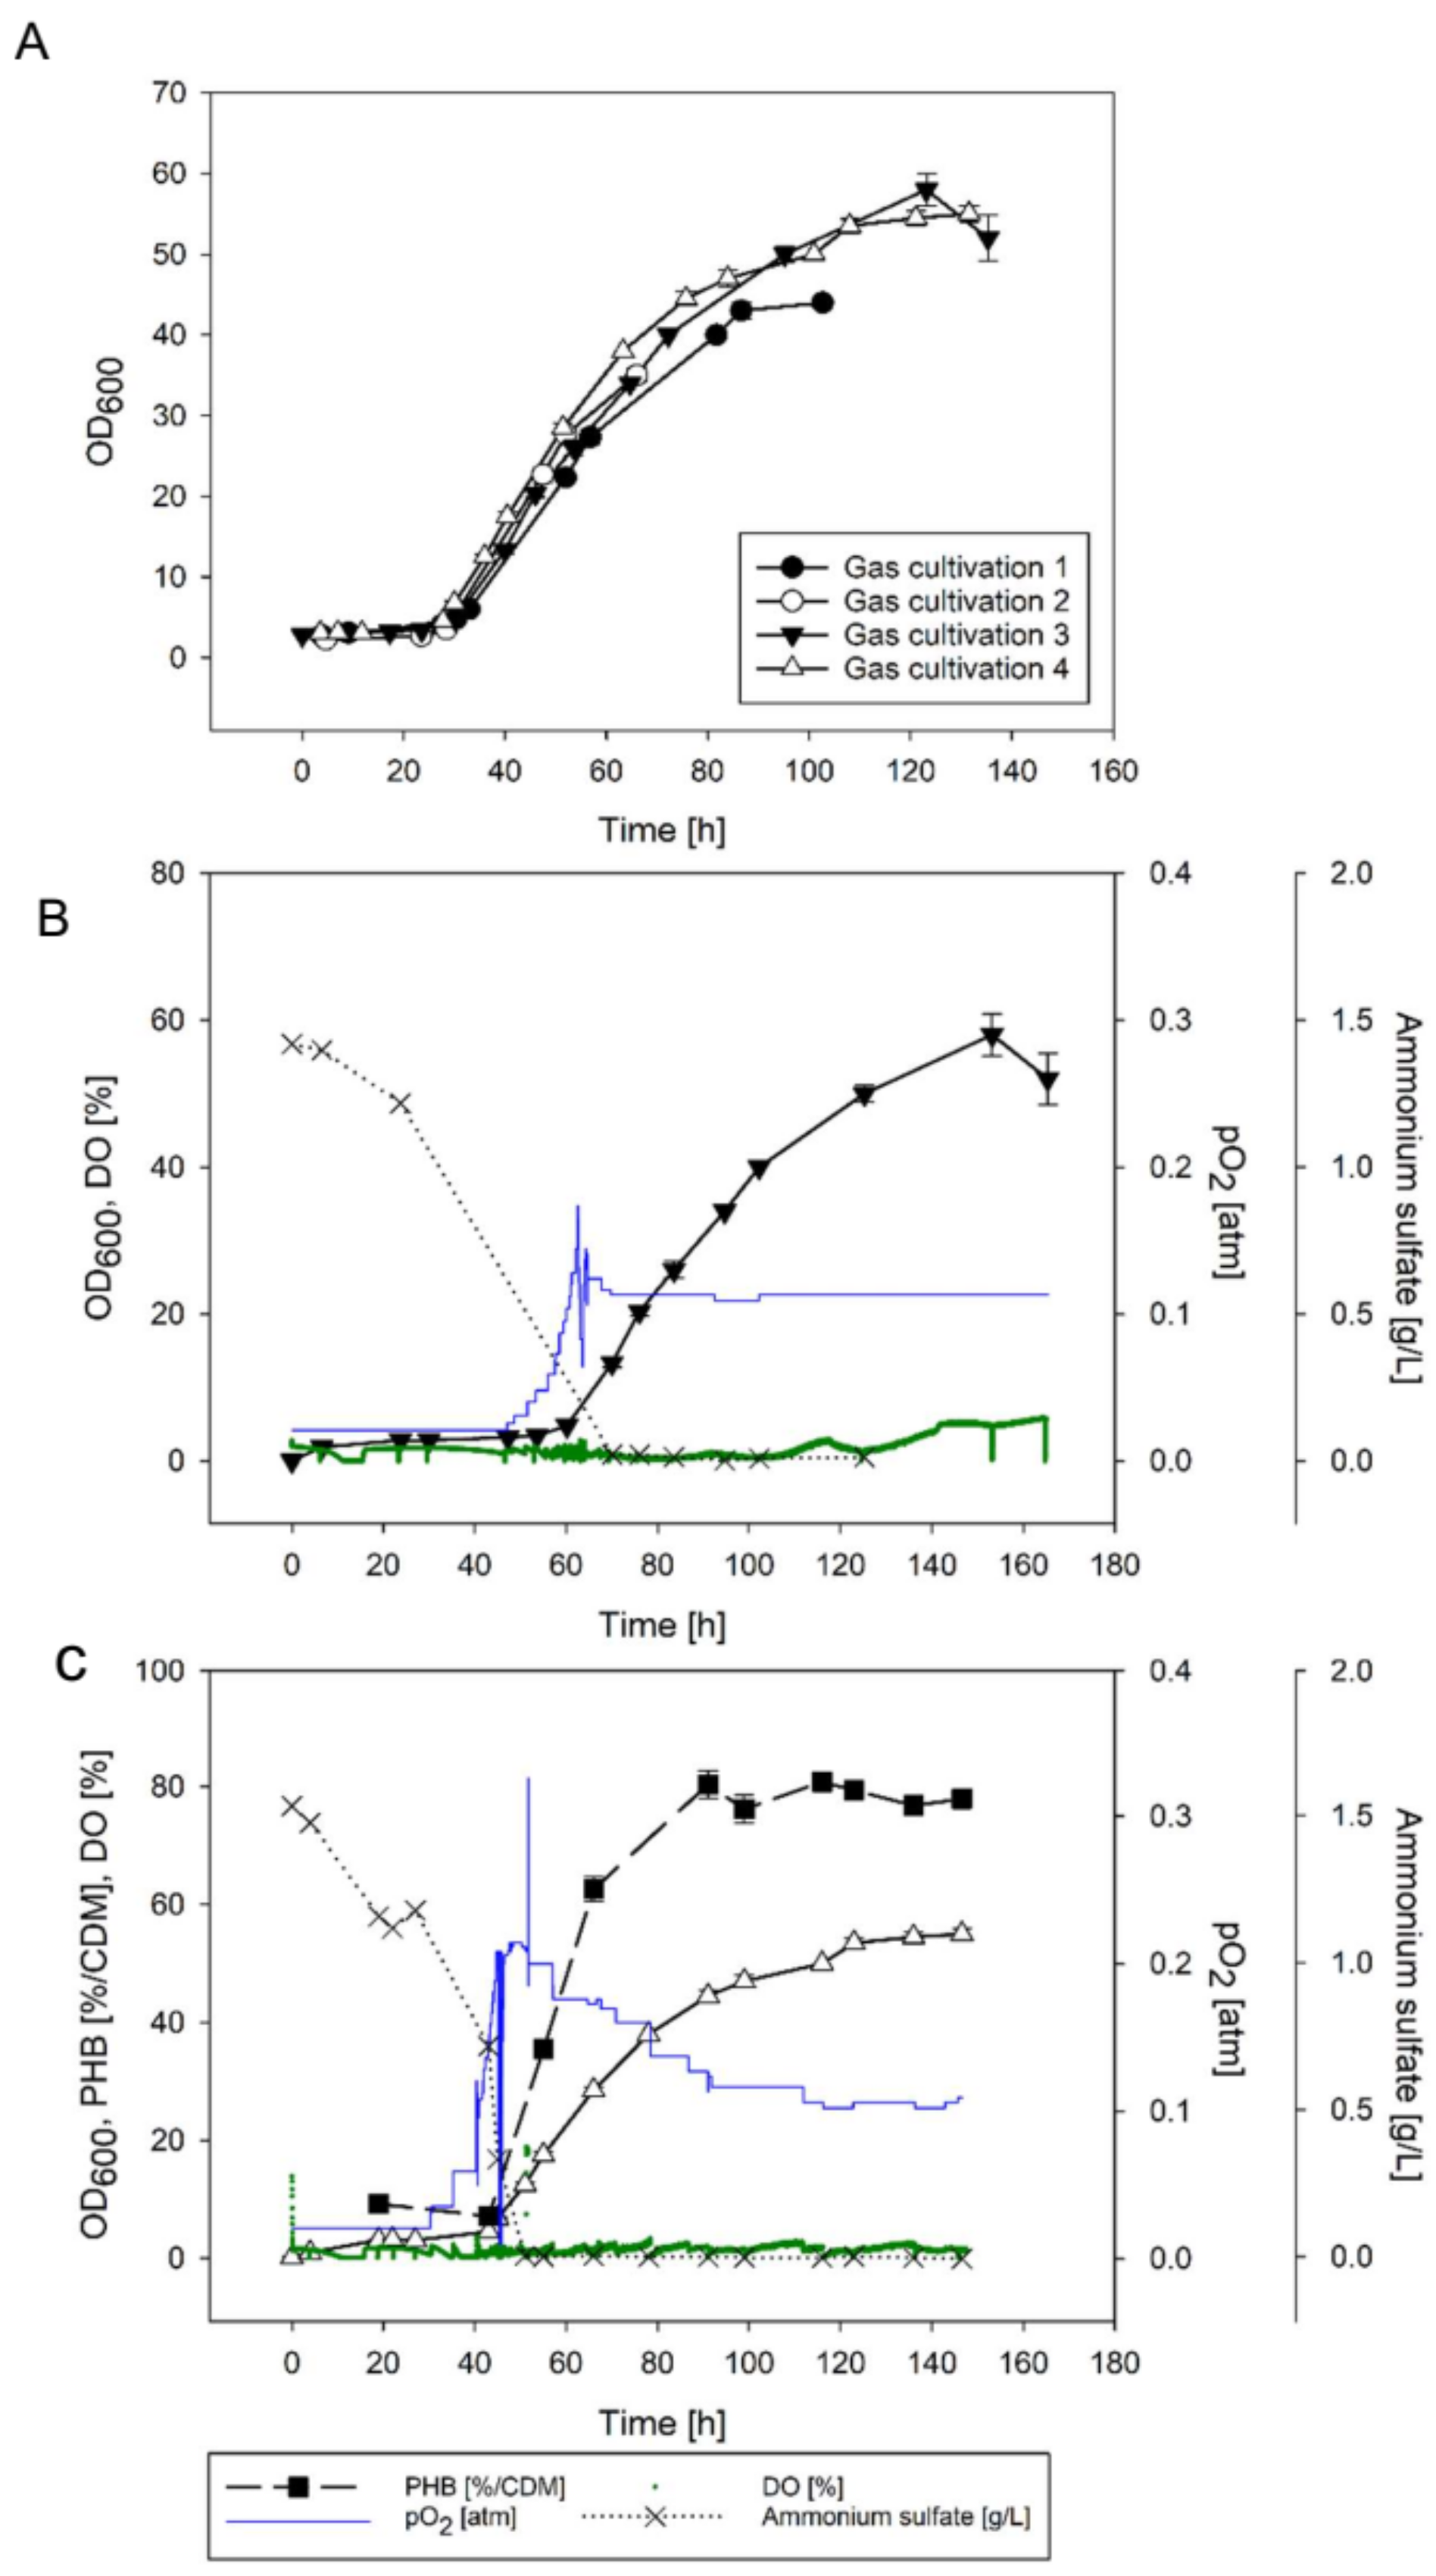
3.2.3. O2 Supply Guided by an O2 Sensor

Four gas cultivations with manually stepwise increased O2 mass flows guided by the DO concentration were performed (Figure 7A; all data of gas cultivations are summarized in the Supplementary Data). The starting substrate gas mixture in all four cultivations was composed of H2:CO2:O2 in a ratio of 85:10:2 (total flow rate 97 NmL/min, pO2 of 0.02 atm). The O2 consumption (seen as a drop in DO concentration) gave information about the consumption of C sources. The fructose was used up in the first ~20 h (e.g., in cultivation 4, the fructose was used up after 19 h at a cell dry mass of 0.76 gCDM/L; data not displayed). During a lag phase in O2 consumption of ~24 h, the cellular metabolism switched from heterotrophy to lithotrophy. CO2 assimilation was marked by a drop in the DO. From then, the O2 supply was manually increased over time but kept below ~1.1 mg/L. The pO2 was 0.12 to 0.15 atm after 50 to 60 h in all four cultivations at constant H2 and CO2 flow rates. After ~60 h of cultivation, biomass concentrations were ~2 gCDM/L and the ammonium was depleted (Figure 7B,C, Supplementary Information Figure S8). Growth curves indicated remarkable reproducibility and a mean maximal growth rate of 0.088 ± 0.010 h−1 (Figure 7A; determination of μmax Supplementary Information Figure S6). After 60 to 70 h of fermentation, growth rates decelerated. In cultivation 1, the H2 and CO2 flow rates were kept constant (Figure 7A and Supplementary Information Figure S8). In cultivations 2 (Supplementary Information Figure S8), 3 (Figure 7B), and 4 (Figure 7C), H2 and CO2 were increased to 200 and 20 NmL/min after 60 h to avoid H2 limitations. In all cultivations, the O2 flow rates were further increased after 60 h, but due to increasing DO concentrations, the O2 flow rates were back regulated again. Increases of H2 and CO2 gas flow rates to 200 and 20 NmL/min, respectively, had no significant effect on final cell dry mass (cultivations 3 and 4 in Figure 7B,C, cultivation 2 in Supplementary Information Figure S8). Final OD600 values of 53.5 ± 1.5 were obtained after ~150 h. The OD600 correlated to a mean cell dry mass of 13.1 ± 0.4 gCDM/L (mean value and deviation from the mean for gas cultivations 3 and 4). The PHB content in biomass samples was determined for cultivation 4. The PHB content started at 9% and steadily increased after the ammonium was depleted to 80% after 90 h (Figure 7C). The PHB content was constant (±1.6%) until the end of the gas cultivation.

3.2.4. pH Development in Chemolithotrophic Cultivations

In classic bioreactor systems, pH is monitored and computer-controlled by the addition of acid and base. pH-stat systems are equipped with a pH-probe and two peristaltic pumps for the correcting liquids. A value of 6.8 was previously used in heterotrophic and chemolithotrophic cultivations of C. necator (e.g., [21,34]). In the present chemolithotrophic cultivations, no correction of pH was required. The used MM media with fructose had a starting pH value of 6.8. pH values between 6.8 and 7.0 were measured in all samples taken from chemolithotrophic cultures.

4. Discussion

4.1. Chemolithotrophic Cultivation

Gas compositions vary widely in reported gas cultivations [12,15,35,36,37,38]. The decisive parameters are, however, the concentrations of gases that are dissolved in the aqueous phase and available for the cells [32]. CO2 dissolves easily in water (~1.4 g/L) but H2 and O2 have low solubilities of 1.6 and 40 mg/L, respectively (data for pure water at 25 °C and pi of 1). In the presented experiments, we used excesses of H2 and CO2 under O2-limiting conditions. The DO concentration is one of the most crucial parameters in the cultivation of C. necator [6,20,33,34]. The window of operation for DO concentrations in gas cultivations is relatively small. Due to the rapid growth of HOBs, their oxygen consumption increases rapidly over time. A constant oxygen supply adjusted to the oxygen need of the inoculum lead to fast oxygen limitation and a final OD600 of 5 (Figure 6). A stepwise increase guided by the biomass concentration (sampling offline) resulted in a final OD600 of 26.5, and a stepwise increase guided by the in situ measured DO resulted in a doubled OD600 of 56.5. Our findings are briefly summarized in Table 3.

4.1.1. Biological Limitations of DO Concentration

The organism C. necator displays an upper limit of 30 kPa (DO < ~11.5 mg/L) for O2 when grown under chemolithotrophic conditions [33]. Previous results have indicated an extended lag phase when the DO was >3 mg/L. The highest values for μ (and qO2) were observed with DO concentrations of ~2.6 mg/L. At DO concentrations of <1.9 and ≥7 mg/L, significantly lower values for μ (and qO2) were reported [20]. Under an O2 concentration of 3.2 kPa (DO < ~1.1 mg/L) C. necator grows under O2 limitation [33]. From a Monod model of an O2-limited chemolithotrophic growth curve, an affinity constant for O2 (KO2) of 0.12 mg/L was determined at the cellular level (at 31 °C, [39]). Under autotrophic conditions and O2 limitation, C. necator was reported to efficiently accumulate PHB while the formation of protein almost ceased [37]. O2 sensitivity of C. necator was attributed back to O2 inhibition of the involved [NiFe]-hydrogenases. Most [NiFe]-hydrogenases indicates inhibition by O2. The β-proteobacterium C. necator H16, however, hosts three relatively O2-tolerant [NiFe]-hydrogenases involved in energy conversion and H2 sensing under aerobic conditions [40].

4.1.2. Technological Limitations in Oxyhydrogen Cultivations

O2 transfer from gas into aqueous media is a well-known limitation in cultivation technology due to the low solubility of O2. In the cultivation of HOBs, the presence of H2 massively complicates processing. O2 and H2 form explosive gas mixtures with lower and upper explosion limits of 4 and 95.2% H2, respectively. The situation is aggravated by the very low ignition energy of 0.016 mJ and is therefore considered to be extremely ignitable. O2 concentrations of <6.9 or 5% were previously used as a strategy to maintain the O2 concentration below the lower explosion limit (6.9% v/v in the gas mixture) [10,35]. To promote a sufficiently high DO concentration, extremely high kLa-values [35] or increased pressure were used [10]. Alternatively, electrodes were introduced into the cultivation medium and, by applying sufficient potentials, water was in situ split into O2 and H2. In non-separated systems, both gaseous substrates were produced in situ and were constantly available [41,42,43,44]. The complete replacement of the terminal acceptor O2 by nitrate in autohydrogenotrophic growth of C. necator led to low μ of 0.02 h−1 [45].
In the present study, an alternative strategy was used: A simplified bioreactor without ignition sources facilitated the safe usage of gas mixtures that were within the explosion range of H2 and O2. The reactor was driven by an explosion-proof magnetic stirrer, the fume hood was grounded, the lab had an antistatic floor, and scientists were equipped during the gas cultivation with antistatic lab coats and shoes. With the chosen equipment, biomass concentrations of ~13.1 gCDM/L were reproducibly obtained despite low kLa-values of 20 to 33 h−1. The high biomass concentrations were achieved through tight regulation of the DO. While the DO was kept largely below 1.1 mg/L (Figure 7B,C and Supplementary Information Figure S8), the actual pi of O2 was stepwise increased from 0.02 to 0.14 in chemolithotrophic cultivations. Specific growth rates of maximally 0.09 h−1 were obtained. The very high μmax of 0.42 h−1 (and final biomass concentration of 91 gCDM/L) reported by Tanaka et al. [35] is explicable by the high kLa value of 2970 h−1. The study by Tanaka et al. from 1995 is considered the gold standard in autotrophic cultivation. However, complying with modern safety regulations, an oxygen concentration in the gas mixture of <6.9% O2 is not considered safe in the published setup for two main reasons: First, back then, a lower explosion limit of 6.9% O2 in oxyhydrogen mixtures was stated, whereas currently, a lower explosion limit of 4.8% O2 is stated [35,46]. Second, Tanaka et al. used either a bioreactor described as mini-jar fermenter (200 mL) from Able Co., Ltd., Tokyo, Japan [38] or a glass jar fermenter (2 L). From the description and schemes given by them, we assume that both bioreactors had a brush motor on top. Brush motors are considered possible ignition sources, and thus the oxygen concentration in the gas mixture would need to be lower than 4.8% (in the best case several fold lower) to comply with current safety regulations.

4.1.3. Online Analytics in Chemolithotrophic Cultivations

The use of sensor probes in cultivation broths that are constantly gassed by an explosive gas mixture is delicate. Dipping probes certified according to ATEX-RL 2014/34 for ex-zone 0 (Ex II 1G (Ga) IIC T3-T6 required when working with H2 and O2) are expensive and rare. There are several O2 sensors certified for ex-zone 0 but, to the best of our knowledge, none for CO2 or H2. Here, we used an O2-dipping probe based on an optical fiber. As safety measures, the read-out electronics were placed outside of the ventilated hood (safety distance of 2 m). The dipping probe was connected to an equipotential bonding to avoid discharges of static electricity. The dipping probe itself was completely sealed in a steal tube and directly connected to the optical fiber cable. No ignition source was inside the fermenter or the fume hood. The optical dipping probe connected to an equipotential bonding was, to the best of our knowledge, a safe method to measure the DO. High reproducibility of conditions in chemolithotrophic cultivations led to nearly superimposable growth curves illustrated in Figure 7A.

4.2. Polyhydroxyalkanoate from CO2

Bioplastic from CO2 has the dual advantages of CO2 assimilation and reduction of plastic products from fossil resources. C. necator has been previously proven to accumulate 78 to 82% poly-D-3-hydroxybutyrate (PHB) in two-stage cultivations at cell densities between 60 and 70 gCDM/L. The strategy followed a two-stage heterotrophic-chemolithotrophic cultivation using fructose as a carbon source in the heterotrophic phase [7]. The highest production rates of PHB were experienced under oxygen limitation in chemolithotrophic cultures. In heterotrophic cultures, ammonium limitation turned out as the best regime to force PHB accumulation (reviewed in [33]). Similarly, higher PHB contents (up to 82%) under oxygen limitation compared to nitrogen limitation were reported by Mozumder et al. [6]. More recently, C. necator was genetically engineered for the biosynthesis of copolymer polyhydroxyalkanoates from CO2 without organic precursor molecules [8,9,47]. In the present study (data from cultivation 4), we have observed that after 19 h, the fructose was depleted at a cell dry mass of 0.76gCDM/L. The cell dry mass at this timepoint had a PHB content of 9% (equal to 0.068 gPHB/L). At the end of cultivation 4, 13.1 gCDM/L containing 10.2 gPHB/L was obtained. We therefore assume that >98% of the obtained PHB was formed from CO2.

4.3. Development of the Mineral Medium for Autotrophic Cultivations

TSB is usually used for fast-growing microbes and as standard media for C. necator. The complex media contains 20 g/L peptone as organic N- and C-source. The cells would prefer peptone over CO2 if both were available in autotrophic cultivations. Therefore, we used TSB for heterotrophic cultivations and mineral media for all autotrophic cultivations and selected heterotrophic cultivations.
The highest biomass concentrations in chemolithotrophic cultivations of C. necator were previously reached by Tanaka et al. [35]. However, the use of tap water for preparation masked actual concentrations of trace elements. Repaske and Mayers [12] developed one of the first MMs for chemolithotrophic cultivation of C. necator and reported a final biomass concentration of 25 gCDM/L. Growth limitations were attributed to depletions in ammonium and trace elements. The media was further adapted in heterotrophic cultivations [48,49] and chemolithotrophic cultivations [50,51]. However, the media used by Lu and Yu [50] led to precipitations upon pH-adjustment. Therefore, we used a medium reported for heterotrophic cultivations of C. necator described by Atlić et al. [21] and added tungsten solution (recommended by Cramm [30]) (Table 1). The addition of B12 was motivated by a notion in Pohlmann et al. that C. necator H16 is not able to produce vitamin B12. Supplementation with B12 did not improve growth, stressing that the bacteria can bypass vitamin B12-dependent reactions [31].
We decided to add an antibiotic to suppress the growth of contaminating bacteria. Antibiotic resistances of C. necator strains are strain-dependent and are of special interest for genetic engineering strategies. The number of antibiotic resistances found in C. necator previously complicated the design of plasmids. Wild-type C. necator H16 is known to indicate a natural resistance towards the aminoglycoside antibiotic kanamycin applied at concentrations of ≤50 mg/L. Therefore, kanamycin concentrations from 200 to 350 mg/L were previously used for the selection of kanamycin resistance plasmids in C. necator H16 [25,51,52,53,54,55]. The presence of tetracycline (tetracycline antibiotic) inhibited the growth of C. necator in all used concentrations, also seen for C. necator strains isolated from soil [25]. Lacking tetracycline resistance in C. necator wild-type strains was exploited for the stabilization of tetracycline-resistance plasmids [53,54].

5. Conclusions

CO2 assimilation into biodegradable polymers is an attractive strategy to bind and recycle CO2, reduce the production of conventional plastic products, and spare fossil resources. The most prominent HOB, C. necator, can accumulate polyhydroxybutyrate from CO2 to levels of up to 82% of the cell’s dry weight ([6,7] this work). The metabolism of C. necator is tractable by genetic engineering, and alternative products (including polyhydroxyalkanoates with altered properties) made from CO2 become available [8,10,26,34,56]. One serious bottleneck in the development of new processes based on HOBs is the complexity of oxyhydrogen cultivations with respect to safety aspects, gas mass transfer, and analytics of gaseous substrates dissolved in the aqueous phase. An easy method to test, optimize, and compare growth conditions and strains (engineered and native) was presented. The method built upon an explosion-proof setup for the continuous supply of H2, CO2, and O2. Biomasses of 13.1 gCDM/L with 79% PHB (with approximately 98% of the obtained PHB formed from CO2) were easily obtainable with DO as a single controlled parameter. No feeding of salts and no pH and temperature control was required.

Supplementary Materials

The following supporting information can be downloaded at: https://www.mdpi.com/article/10.3390/bioengineering9050204/s1, Figure S1: Wavelength scan of water, TSB and mineral media; Figure S2: Correlation of OD600 to CDM in C. necator cultures; Figure S3: Gassing and bubble formation in the stirred 1000 mL DURAN® GLS 80 bioreactor; Figure S4: kLa values for the 1 L DURAN® GLS 80 bioreactor at gas flows of 100, 200 and 400 mL at 340 rpm; Figure S5: Heterotrophic cultivations at room temperature (22–24 °C, orange dots) and at 30 °C (grey dots) in 1 L baffled flasks (magnetic bar, stirring at 400 rpm); Figure S6: Determination of maximal growth rates from chemoautotrophic cultivations depicted in Figure 6 and Figure 7 (main part); Figure S7: Time curve of a gas fermentation with constant high O2 supply. OD600 values (black circles) and pO2 (blue line); Figure S8: Time curves of gas cultivations 1 (panel A) and 2 (panel B) with manual DO control using a dipping probe (supplementing Figure 7A main part); Table S1: Maximal growth rates (μmax h−1) obtained at room temperature or 30 °C.

Author Contributions

V.L. designed, performed, and analyzed chemolithotrophic cultivations, interpreted the data, and was involved in manuscript preparation. R.K. conceptualized the study, contributed to the design of experiments, interpreted the data, and drafted the manuscript. All authors have read and agreed to the published version of the manuscript.

Funding

The COMET center ACIB: Next Generation Bioproduction was funded by BMK, BMDW, SFG, Standortagentur Tirol, Government of Lower Austria und Vienna Business Agency in the framework of COMET—Competence Centers for Excellent Technologies. The COMET-Funding Program was managed by the Austrian Research Promotion Agency FFG (funding number 872161). Role of funding: employment of VL, financing cultivation equipment (portable).

Institutional Review Board Statement

Not applicable.

Informed Consent Statement

Not applicable.

Data Availability Statement

The data presented in this study is available in [Supplementary data.xls] file.

Acknowledgments

We thank the Faculty of Technical Chemistry, Chemical and Process Engineering, Biotechnology, Graz University of Technology for providing gas cultivation equipment (non-portable). We thank Vanja Subotic, Markus Raiber, Markus Sackl, and Heinz Strauß from the Institute of Thermal Engineering, Graz University of Technology for discussions and practical support in H2 handling and bioreactor setup. We thank Zdenek Petrasek for help with the oxygen-dipping probe.

Conflicts of Interest

The authors declare no conflict of interest.

References

  1. Jajesniak, P.; Ali, H.E.M.O.; Wong, T.S. Carbon dioxide capture and utilization using biological systems: Opportunities and challenges. J. Bioprocess. Biotech. 2014, 4, 155. [Google Scholar] [CrossRef]
  2. Olajire, A.A. Valorization of greenhouse carbon dioxide emissions into value-added products by catalytic processes. J CO2 Util. 2013, 3–4, 74–92. [Google Scholar] [CrossRef]
  3. Pander, B.; Mortimer, Z.; Woods, C.; McGregor, C.; Dempster, A.; Thomas, L.; Maliepaard, J.; Mansfield, R.; Rowe, P.; Krabben, P. Hydrogen oxidising bacteria for production of single-cell protein and other food and feed ingredients. Eng. Biol. 2020, 4, 21–24. [Google Scholar] [CrossRef]
  4. Sillman, J.; Nygren, L.; Kahiluoto, H.; Ruuskanen, V.; Tamminen, A.; Bajamundi, C.; Nappa, M.; Wuokko, M.; Lindh, T.; Vainikka, P.; et al. Bacterial protein for food and feed generated via renewable energy and direct air capture of CO2: Can it reduce land and water use? Glob. Food Sec. 2019, 22, 25–32. [Google Scholar] [CrossRef]
  5. Lu, Y.; Yu, J. Comparison analysis on the energy efficiencies and biomass yields in microbial CO2 fixation. Proc. Biochem. 2017, 62, 151–160. [Google Scholar] [CrossRef]
  6. Mozumder, S.I.; Garcia-Gonzalez, L.; DeWever, H.; Volcke, E.I.P. Poly(3-hydroxybutyrate) (PHB) production from CO2: Model development and process optimization. Biochem. Eng. J. 2015, 98, 107–116. [Google Scholar] [CrossRef]
  7. Taga, N.; Tanaka, K.; Ishizaki, A. Effects of rheological change by addition of carboxymethylcellulose in culture media of an air-lift fermentor on poly-D-3-hydroxybutyric acid productivity in autotrophic culture of hydrogen-oxidizing bacterium, Alcaligenes eutrophus. Biotechnol. Bioeng. 1997, 53, 529–533. [Google Scholar] [CrossRef]
  8. Nangle, S.N.; Ziesack, M.; Buckley, S.; Trivedi, D.; Lohe, D.M.; Nocera, D.G.; Silver, P.A. Valorization of CO2 through lithoautotrophic production of sustainable chemicals in Cupriavidus necator. Metab. Eng. 2020, 62, 207–220. [Google Scholar] [CrossRef]
  9. Tanaka, K.; Yoshida, K.; Orita, I.; Fukui, T. Biosynthesis of poly(3-hydroxybutyrate-co-3-hydroxyhexanoate) from CO2 by a recombinant Cupriavidus necator. Bioengineering 2021, 8, 179. [Google Scholar] [CrossRef]
  10. Garrigues, L.; Maignien, L.; Lombard, E.; Singh, J.; Guillouet, S.E. Isopropanol production from carbon dioxide in Cupriavidus necator in a pressurized bioreactor. N. Biotechnol. 2020, 56, 16–20. [Google Scholar] [CrossRef]
  11. Müller, J.; MacEachran, D.; Burd, H.; Sathitsuksanoh, N.; Bi, C.; Yeh, Y.-C.; Lee, T.S.; Hillson, N.J.; Chhabra, S.R.; Singer, S.W.; et al. Engineering of Ralstonia eutropha H16 for autotrophic and heterotrophic production of methyl ketones. Appl. Environ. Microbiol. 2013, 79, 4433–4439. [Google Scholar] [CrossRef] [PubMed] [Green Version]
  12. Repaske, R.; Mayer, R. Dense autotrophic cultures of Alcaligenes eutrophus. Appl. Environ. Microbiol. 1976, 32, 592–597. [Google Scholar] [CrossRef] [PubMed] [Green Version]
  13. Bommareddy, R.R.; Wang, Y.; Pearcy, N.; Hayes, M.; Lester, E.; Minton, N.P.; Conradie, A.V. A sustainable chemicals manufacturing paradigm using CO2 and renewable H2. iScience 2020, 23, 101218. [Google Scholar] [CrossRef] [PubMed]
  14. Lai, Y.H.; Lan, C.-W. Enhanced polyhydroxybutyrate production through incorporation of a hydrogen fuel cell and electro-fermentation system. Int. J. Hydrog. Energy 2021, 46, 16787–16800. [Google Scholar] [CrossRef]
  15. Lu, Y.; Yu, J. Biomass yield, reversal respiratory quotient, stoichiometric equations and bioenergetics. Biochem. Eng. J. 2019, 152, 107369. [Google Scholar] [CrossRef]
  16. Milker, S.; Sydow, A.; Torres-Monroy, I.; Jach, G.; Faust, F.; Kranz, L.; Tkatschuk, L.; Holtmann, D. Gram-scale production of the sesquiterpene α-humulene with Cupriavidus necator. Biotechnol. Bioeng. 2021, 118, 2694–2702. [Google Scholar] [CrossRef]
  17. Nyyssölä, A.; Ojala, L.S.; Wuokko, M.; Peddinti, G.; Tamminen, A.; Tsitko, I.; Nordlund, E.; Lienemann, M. Production of endotoxin-free microbial biomass for food applications by gas fermentation of gram-positive H2-oxidizing bacteria. ACS Food Sci. Technol. 2021, 1, 470–479. [Google Scholar] [CrossRef]
  18. Lütte, S.; Pohlmann, A.; Zaychikov, E.; Schwartz, E.; Becher, J.R.; Heumann, H.; Friedrich, B. Autotrophic production of stable-isotope-labeled arginine in Ralstonia eutropha strain H16. Appl. Environ. Microbiol. 2012, 78, 7884–7890. [Google Scholar] [CrossRef] [Green Version]
  19. Assil-Companioni, L.; Schmidt, S.; Heidinger, P.; Schwab, H.; Kourist, R. Hydrogen-driven cofactor regeneration for stereoselective whole-cell C=C bond reduction in Cupriavidus necator. ChemSusChem 2019, 12, 2361–2365. [Google Scholar] [CrossRef]
  20. Sonnleitner, B.; Heinzle, E.; Braunegg, G.; Lafferty, R.M. Formal kinetics of poly-β-hydroxybutyric acid (PHB) production in Alcaligenes eutrophus H 16 and Mycoplana rubra R 14 with respect to the dissolved oxygen tension in ammonium-limited batch cultures. Eur. J. Appl. Microbiol. Biotechnol. 1979, 7, 1–10. [Google Scholar] [CrossRef]
  21. Atlić, A.; Koller, M.; Scherzer, D.; Kutschera, C.; Grillo-Fernandes, E.; Horvat, P.; Chiellini, E.; Braunegg, G. Continuous production of poly([R]-3-hydroxybutyrate) by Cupriavidus necator in a multistage bioreactor cascade. Appl. Microbiol. Biotechnol. 2011, 91, 295–304. [Google Scholar] [CrossRef] [PubMed]
  22. Riet, K.V. Review of measuring methods and results in nonviscous gas-liquid mass transfer in stirred vessel. Ind. Eng. Chem. Process Des. Dev. 1979, 18, 357–364. [Google Scholar] [CrossRef]
  23. Schumpe, A.; Adler, I.; Deckwer, W.D. Solubility of oxygen in electrolyte solutions. Biotechnol. Bioeng. 1978, 20, 145–150. [Google Scholar] [CrossRef]
  24. Juengert, J.R.; Bresan, S.; Jendrossek, D. Determination of polyhydroxybutyrate content in Ralstonia eutropha using gas chromatography and nile red staining. Bio Protoc. 2018, 8, e2748. [Google Scholar] [CrossRef] [PubMed] [Green Version]
  25. Florentino, L.A.; Jaramillo, P.M.D.; Silva, K.; da Silva, J.S.; de Oliveira, S.M.; de Souza Moreira, F.M. Physiological and symbiotic diversity of Cupriavidus necator strains isolated from nodules of Leguminosae species. Sci. Agric. 2012, 69, 247–258. [Google Scholar] [CrossRef] [Green Version]
  26. Gruber, S.; Schwendenwein, D.; Magomedo, Z.; Thaler, E.; Hagen, J.; Schwab, H.; Heidinger, P. Design of inducible expression vectors for improved protein production in Ralstonia eutropha H16 derived host strains. J. Biotechnol. 2016, 235, 92–99. [Google Scholar] [CrossRef]
  27. Massip, C.; Coullaud-Gamel, M.; Gaudru, C.; Amoureux, L.; Doleans-Jordheim, A.; Hery-Arnaud, G.; Marchandin, H.; Oswald, E.; Segonds, C.; Guet-Revillet, H. In vitro activity of 20 antibiotics against Cupriavidus clinical strains. J. Antimicrob. Chemother. 2020, 75, 1654–1658. [Google Scholar] [CrossRef]
  28. González-Villanueva, M.; Galaiya, H.; Staniland, P.; Staniland, J.; Savill, I.; Wong, T.S.; Tee, K.L. Adaptive laboratory evolution of Cupriavidus necator H16 for carbon co-utilization with glycerol. Int. J. Mol. Sci. 2019, 20, 5737. [Google Scholar] [CrossRef] [Green Version]
  29. Novackova, I.; Kucera, D.; Porizka, J.; Pernicova, I.; Sedlacek, P.; Koller, M.; Kovalcik, A.; Obruca, S. Adaptation of Cupriavidus necator to levulinic acid for enhanced production of P(3HB-co-3HV) copolyesters. Biochem. Eng. J. 2019, 151, 107350. [Google Scholar] [CrossRef]
  30. Cramm, R. Genomic view of energy metabolism in Ralstonia eutropha H16. J. Mol. Microbiol. Biotechnol. 2009, 16, 38–52. [Google Scholar] [CrossRef]
  31. Pohlmann, A.; Fricke, W.; Reinecke, F.; Kusian, B.; Liesegang, H.; Cramm, R.; Eitinger, T.; Ewering, C.; Pötter, M.; Schwartz, E.; et al. Genome sequence of the bioplastic-producing “Knallgas” bacterium Ralstonia eutropha H16. Nat. Biotechnol. 2006, 24, 1257–1262. [Google Scholar] [CrossRef] [PubMed] [Green Version]
  32. Foster, J.F.; Litchfield, J.H. A continuous culture apparatus for the microbial utilization of hydrogen produced by electrolysis of water in closed-cycle space systems. Biotechnol. Bioeng. 1964, 6, 441–456. [Google Scholar] [CrossRef]
  33. Ishizaki, A.; Tanaka, K.; Taga, N. Microbial production of poly-D-3-hydroxybutyrate from CO2. Appl. Microbiol. Biotechnol. 2001, 57, 6–12. [Google Scholar] [CrossRef] [PubMed]
  34. Garcia-Gonzalez, L.; Mozumder, S.I.; Dubreuil, M.; Volcke, E.I.P.; DeWevera, H. Sustainable autotrophic production of polyhydroxybutyrate (PHB) from CO2 using a two-stage cultivation system. Catal. Today 2015, 257, 237–245. [Google Scholar] [CrossRef]
  35. Tanaka, K.; Ishizaki, A.; Kanamaru, T.; Kawano, T. Production of poly(D-3-hydroxybutyrate) from CO2, H2, and O2 by high cell density autotrophic cultivation of Alcaligenes eutrophus. Biotechnol. Bioeng. 1995, 45, 268–275. [Google Scholar] [CrossRef]
  36. Crépin, L.; Lombard, E.; Guillouet, S.E. Metabolic engineering of Cupriavidus necator for heterotrophic and autotrophic alka(e)ne production. Metab. Eng. 2016, 37, 92–101. [Google Scholar] [CrossRef] [Green Version]
  37. Ishizaki, A.; Tanaka, K. Production of poly-β-hydroxybutyric acid from carbon dioxide by Alcaligenes eutrophus ATCC 17697T. J. Ferment. Bioeng. 1991, 71, 254–257. [Google Scholar] [CrossRef]
  38. Ishizaki, A.; Tanaka, K. Batch culture of Alcaligenes eutrophus ATCC 17697 T using recycled gas closed circuit culture system. J. Ferment. Bioeng. 1990, 69, 170–174. [Google Scholar] [CrossRef]
  39. Siegel, R.S.; Ollis, D.F. Kinetics of growth of the hydrogen-oxidizing bacterium Alcaligenes eutrophus (ATCC 17707) in chemostat culture. Biotechnol. Bioeng. 1984, 26, 764–770. [Google Scholar] [CrossRef]
  40. Burgdorf, T.; Lenz, O.; Buhrke, T.; van der Linden, E.; Jones, A.K.; Albracht, S.P.J.; Friedrich, B. [NiFe]-Hydrogenases of Ralstonia eutropha H16: Modular enzymes for oxygen-tolerant biological hydrogen oxidation. J. Mol. Microbiol. 2005, 10, 181–196. [Google Scholar] [CrossRef]
  41. Li, Z.; Li, G.; Chen, X.; Xia, Z.; Yao, J.; Yang, B.; Lei, L.; Hou, Y. Water splitting–biosynthetic hybrid system for CO2 conversion using nickel nanoparticles embedded in N-doped carbon nanotubes. Chemsuschem 2018, 11, 2382–2387. [Google Scholar] [CrossRef] [PubMed]
  42. Krieg, T.; Sydow, A.; Faust, S.; Huth, I.; Holtmann, D. CO2 to terpenes: Autotrophic and electroautotrophic α-humulene production with Cupriavidus necator. Angew. Chem. Int. Ed. 2017, 57, 1879–1882. [Google Scholar] [CrossRef] [PubMed]
  43. Schuster, E.; Schlegel, H.G. Chemolithotrophic growth of Hydrogenomonas H16 using electrolytic production of hydrogen and oxygen in a chemostat. Arch. Mikrobiol. 1967, 58, 380–409. [Google Scholar] [CrossRef] [PubMed]
  44. Torella, J.P.; Gagliardi, C.J.; Chen, J.S.; Bediako, D.K.; Colon, B.; Way, J.C.; Silver, P.A.; Nocera, D.G. Efficient solar-to-fuels production from a hybrid microbial–water-splitting catalyst system. Proc. Natl. Acad. Sci. USA 2015, 112, 2337–2342. [Google Scholar] [CrossRef] [PubMed] [Green Version]
  45. Tiemeyer, A.; Link, H.; Weuster-Botz, D. Kinetic studies on autohydrogenotrophic growth of Ralstonia eutropha with nitrate as terminal electron acceptor. Appl. Microbiol. Biotechnol. 2007, 76, 75–81. [Google Scholar] [CrossRef]
  46. Schröder, V. Explosionsgrenzen von Wasserstoff und Wasserstoff/Methan-Gemischen. In Forschungsbericht Nr. 253; Bundesanstalt für Materialforschung und -prüfun: Berlin, Germany, 2003; pp. 1–40. ISSN 0938-5533. [Google Scholar]
  47. Miyahara, Y.; Yamamoto, M.; Thorbecke, R.; Mizuno, S.; Tsuge, T. Autotrophic biosynthesis of polyhydroxyalkanoate by Ralstonia eutropha from non-combustible gas mixture with low hydrogen content. Biotechnol. Lett. 2020, 42, 1655–1662. [Google Scholar] [CrossRef]
  48. Aragao, G.M.F.; Lindley, N.D.; Uribelarrea, J.L.; Pareilleux, A. Maintaining a controlled residual growth capacity increases the production of polyhydroxyalkanoate copolymers by Alcaligenes eutrophus. Biotechnol. Lett. 1996, 18, 937–942. [Google Scholar] [CrossRef]
  49. Ramsay, B.A.; Lomaliza, K.; Chavarie, C.; Dubé, B.; Bataille, P.; Ramsay, J.A. Production of poly-(β-hydroxybutyric-co-β-hydroxyvaleric) acids. Appl. Environ. Microbiol. 1990, 56, 2093–2098. [Google Scholar] [CrossRef] [Green Version]
  50. Lu, Y.; Yu, J. Gas mass transfer with microbial CO2 fixation and poly(3-hydroxybutyrate) synthesis in a packed bed bioreactor. Biochem. Eng. J. 2017, 122, 13–21. [Google Scholar] [CrossRef]
  51. Grousseau, E.; Lu, J.; Gorret, N.; Guillouet, S.E.; Sinskey, A.J. Isopropanol production with engineered Cupriavidus necator as bioproduction platform. Appl. Microbiol. Biotechnol. 2014, 98, 4277–4290. [Google Scholar] [CrossRef] [Green Version]
  52. Boy, C.; Lesage, J.; Alfenore, S.; Gorret, N.; Guillouet, S.E. Plasmid expression level heterogeneity monitoring via heterologous eGFP production at the single-cell level in Cupriavidus necator. Appl. Microbiol. Biotechnol. 2020, 104, 5899–5914. [Google Scholar] [CrossRef] [PubMed]
  53. Claassens, N.J.; Bordanaba-Florit, G.; Cotton, C.A.; De Maria, A.; Finger-Bou, M.; Friedeheim, L.; Giner-Laguarda, N.; Munar-Palmer, M.; Newell, W.; Scarinci, G.; et al. Replacing the Calvin cycle with the reductive glycine pathway in Cupriavidus necator. Metab. Eng. 2020, 62, 30–41. [Google Scholar] [CrossRef] [PubMed]
  54. Sydow, A.; Pannek, A.; Krieg, T.; Huth, I.; Guillouet, S.E.; Holtmann, D. Expanding the genetic tool box for Cupriavidus necator by a stabilized L-rhamnose inducible plasmid system. J. Biotechnol. 2017, 263, 1–10. [Google Scholar] [CrossRef] [PubMed]
  55. Wahl, A.; Schuth, N.; Pfeiffer, D.; Nussberger, S.; Jendrossek, D. PHB granules are attached to the nucleoid via PhaM in Ralstonia eutropha. BMC Microbiol. 2012, 12, 262. [Google Scholar] [CrossRef] [PubMed] [Green Version]
  56. Windhorst, C.; Gescher, J. Efficient biochemical production of acetoin from carbon dioxide using Cupriavidus necator H16. Biotechnol. Biofuels 2019, 12, 163. [Google Scholar] [CrossRef] [PubMed]
Figure 1. Scheme of gas cultivation setup. Flow diagram of installations and cultivation equipment. (Open-source program diagrams.net © 2005–2021 JGraph Ltd. was used for figure preparation).
Bioengineering 09 00204 g001
Figure 2. Explosion-proof bioreactor setup consisting of a 1 L DURAN® bottle with a magnetic anchor stirrer on a magnetic stirrer plate. Gas substrate is supplied by a steel tube with a PTFE frit at the end.
Bioengineering 09 00204 g002
Figure 3. OD600 values of C. necator cultures in the presence of six antibiotics. Dark gray bars illustrate lowest, light gray bars medium, and white bars highest antibiotics concentrations. Black bar refers to reference cultures without antibiotics. (2 days of cultivation in TSB at 30°C.).
Bioengineering 09 00204 g003
Figure 4. OD600 values of C. necator cultures in MM supplemented with B12. Black bar refers to cultures in TSB. (2 days of cultivation at 30 °C.)
Bioengineering 09 00204 g004
Figure 5. OD600 values of C. necator cultures inoculated directly with cells from cryoservation stocks. Bars indicate recultivability after 1, 3, 5, 7, 9, 11 months (starting with black bars, descending grey intensities). (1 day of cultivation in TSB at 30 °C).
Bioengineering 09 00204 g005
Figure 6. Time curves of gas cultivations with constant gas flow and stepwise increased pO2. Circles indicate OD600 values, blue lines pO2 (constant gas flow white circles and dashed line; stepwise increased pO2 black circles and full line).
Bioengineering 09 00204 g006
Figure 7. Time curves of gas cultivations with manual DO control using a dipping probe. Panel (A) indicates OD600 values over time of all four gas cultivations (starting points of gas cultivations in panel A were normalized to the start of CO2 assimilation). Panels (B,C) indicate gas cultivations 3 and 4, respectively (triangles indicate OD600 values from Figure 7A, pO2 blue line, DO in % (100% corresponds to full saturation with pure oxygen) illustrated as green dots, ammonium black crosses, PHB in % per CDM black squares). All data of gas cultivations are summarized in the Supplementary Data and the Supporting Information Figure S8.
Bioengineering 09 00204 g007
Table 1. Mineral media (MM) component list.
Substance g/L Part
KH2PO41.51
Na2HPO4·2H2O 4.5
(NH4)2SO41.52
MgSO4·7H2O 0.2
NH4Fe(III) citrate 0.053
CaCl2·2H2O 0.02
Tungsten solution 1 mL4
Fructose 205
Trace element solution 1 mL6
Tungsten solution
Na2WO4·2H2O 0.06
Trace element solution
H3BO30.6
CoCl2·6H2O 0.4
ZnSO4·7H2O 0.2
MnCl2·4H2O 0.06
NaMoO4·2H2O 0.06
NiCl2·6H2O 0.4
CuSO4·7H2O 0.02
Table 2. Partial pressures of H2, CO2, O2, and total gas flows in individual gas cultivations.
CultivationpH2:pCO2:pO2Total Flow Rate (NmL/min)Comment
Constant low O2 supply
Constant 90:8:2400-
Constant high O2 supply
Constant 85:10:5100-
Stepwise increase of O2 guided by the biomass
start 90:8:2
end 80:8:12
400Intermittent gas compositions are in the Supplementary Data file.
Stepwise increase of O2 guided by the DO probe
Cultivation 1start 85:10:2
end 71:7:21
start 97
end 140
All intermittent gas compositions are in the Supplementary Data file.
Cultivation 2start 85:10:2
end 80:8:12
start 97
end 250
Cultivation 3start 85:10:2
end 81:8:11
start 97
end 250
Cultivation 4start 85:10:2
end 81:8:11
start 97
end 250
Table 3. Comparison of different O2 supply strategies. Effect of starting pO2 and pO2 supply method.
CultivationpO2 (atm)μmax (h−1)Final OD600Comment
Constant low O2 supplyconstant at 0.020.0085.0Figure 6
Constant high O2 supplyconstant at 0.05not determined1.3Figure S7
Stepwise increase of O2 guided by the biomass start 0.02
end 0.12
0.05526.5Figure 6; biomass conc. measured offline, O2 supply increased manually
Stepwise increase of O2 guided by the DO probe
(cultivations 3, 4) *
start 0.02 ± 0.00
highest 0.19 ± 0.02
end 0.11 ± 0.00
0.095 ± 0.0153.5 ± 1.5Figure 7; DO measured online, O2 supply increased manually
* Note that cultivations 1 and 2 stopped at earlier timepoints and were hence not used for the summary. O2 supply is critical from a biological and technological point of view.
Publisher’s Note: MDPI stays neutral with regard to jurisdictional claims in published maps and institutional affiliations.

