


Investigation on Enamel and Dentine of Tooth through 1D Photonic Structure to Identify the Caries in Human Teeth

 , ,
, ,  , , ,
, , ,
Abstract
:1. Introduction
1.1. Teeth
1.2. TPI System
1.3. Transmission
2. Materials & Methods and Structure & Mechanism
3. Numerical Expression for Reflectance and Output Potential
4. Results
5. Discussion
6. Conclusions
Author Contributions
Funding
Institutional Review Board Statement
Informed Consent Statement
Data Availability Statement
Acknowledgments
Conflicts of Interest
References
- Braga, M.M. Are the approximal caries lesions in primary teeth a challenge to deal with? A critical appraisal of recent evidences in this field. In Emerging Trends in Oral Health Sciences and Dentistry; Virdi, M.C., Ed.; Intechopen: London, UK, 2015; pp. 83–116. [Google Scholar]
- Meira, K.R.S.; de Mattos Brito, C.S.; de Sousa, F.B. Predicting infiltration of the surface layer of natural enamel caries. Arch. Oral Biol 2015, 60, 883–893. [Google Scholar] [CrossRef] [PubMed]
- Ccahuana-Vásquez, R.A.; Cury, J.A. S. mutans, biofilm model to evaluate antimicrobial substances and enamel demineralization. Braz. Oral Res. 2010, 24, 135–141. [Google Scholar] [CrossRef] [PubMed] [Green Version]
- Wenzel, A. Digital radiography and caries diagnosis. Dentomaxillofacial Radiol. 1998, 27, 3–11. [Google Scholar] [CrossRef] [PubMed]
- Liu, H.; Yan, X.; Pandya, M.; Luan, X.; Diekwisch, T.G. Daughters of the enamel organ: Development, fate, and function of the stratum intermedium, stellate reticulum, and outer enamel epithelium. Stem Cells Dev. 2016, 25, 1580–1590. [Google Scholar] [CrossRef] [Green Version]
- Arnone, D.D.; Ciesla, C.M. Applications of terahertz technology to medical imaging. Terahertz Spectrosc. Appl. 1999, 3828, 209–219. [Google Scholar]
- Arnone, D.D.; Ciesla, C.; Pepper, M. Terahertz imaging comes into view. Phys. World 2000, 13, 35–40. [Google Scholar] [CrossRef]
- Hu, B.B.; Nuss, M.C. T-ray imaging. Opt. Lett. 1995, 20, 1716–1718. [Google Scholar] [CrossRef] [Green Version]
- Shen, H.; Wang, Z.; Wu, Y.; Yang, B. One-dimensional photonic crystals: Fabrication, responsiveness and emerging applications in 3D construction. RSC Adv. 2016, 6, 4505–4520. [Google Scholar] [CrossRef]
- Trane, L.; Jacobsen, R.H.; Uhd Jepsen, P.; Keiding, S.R. THz reflection spectroscopy of liquid water. Chem. Phys. Lett. 1995, 240, 330–333. [Google Scholar] [CrossRef]
- Queiroz, C.S.; Hara, A.T.; Leme, A.F.P.; Cury, J.A. PH-cycling model to evaluate the effect of low fluoride dentifrice on enamel de- and remineralization. Braz. Dent. J. 2008, 19, 21–29. [Google Scholar] [CrossRef]
- Duverger, O.; Ohara, T.; Shaffer, J.R.; Donahue, D.; Zerfas, P.; Dullnig, A.; Crecelius, C.; Beniash, E.; Marazita, M.L.; Morasso, M.I. Hair keratin mutations in tooth enamel increase dental decay risk. J. Clin. Investig. 2014, 124, 5219–5224. [Google Scholar] [CrossRef] [PubMed]
- Vieira, A.R.; MCHenry, T.B.; Daack-Hirsch, S.; Murray, J.C.; Marazita, M.L. Candidate gene/loci studies in cleft lip/palate and dental anomalies finds novel susceptibility genes for clefts. Genet. Med. 2008, 10, 668–674. [Google Scholar] [CrossRef] [PubMed] [Green Version]
- Tannure, P.N.; Küchler, E.C.; Lips, A.; Costa, M.D.E.C.; Luiz, R.R.; Granjeiro, J.M.; Vieira, A.R. Genetic variation in MMP20 contributes to higher caries experience. J. Dent. 2012, 40, 381–386. [Google Scholar] [CrossRef] [Green Version]
- Slayton, R.L.; Cooper, M.E.; Marazita, M.L. Tuftelin, mutans streptococci, and dental caries susceptibility. J. Dent. Res. 2005, 84, 711–714. [Google Scholar] [CrossRef] [PubMed]
- Ergöz, N.; Seymen, F.; Gencay, K.; Tamay, Z.; Deeley, K.; Vinski, S.; Vieira, A.R. Genetic variation in ameloblastin is associated with caries in asthmatic children. Eur. Arch. Paediatr. Dent. 2014, 15, 211–216. [Google Scholar] [CrossRef] [PubMed]
- Deeley, K.; Letra, A.; Rose, E.K.; Brandon, C.A.; Resick, J.M.; Marazita, M.L.; Vieira, A.R. Possible association of amelogenin to high caries experience in a Guatemalan-Mayan population. Caries Res. 2008, 42, 8–13. [Google Scholar] [CrossRef] [Green Version]
- Kumar, B.A.; Ahu, S.K.S.; AlAi, G.P. Investigation of Six Contamination Parameters Via a Two-dimensional (2-D) Photonic Structure (PhC) Using an Infrared (IR) Laser Beam. Lasers Eng. 2022, 52, 1–6. [Google Scholar]
- Sethi, K.K.; Boobhalon, V.; Sahu, S.K.; Palai, G. Realization of novel corona virus kit using silicon based 2D photonic structure via finite difference time domain method; Microsystem Technologies. Microsyst. Technol. 2021, 27, 3279–3284. [Google Scholar] [CrossRef]
- Hecht, E. Optics, 3rd ed.; Addison Wesley: Boston, MA, USA, 1998. [Google Scholar]
- Markelz, A.G.; Roitberg, A.; Heilweil, E.J. Pulsed terahertz spectroscopy of DNA, bovine serum albumin and collagen between 0.1 and 2.0 THz. Chem. Phys. Lett. 2000, 320, 42–48. [Google Scholar] [CrossRef]
- Mittleman, D.M.; Hunsche, S.; Boivin, L.; Nuss, M.C. T-ray tomography. Opt. Lett. 1997, 22, 904–906. [Google Scholar] [CrossRef]
- Mittleman, D.M.; Jacobsen, R.H.; Nuss, M.C. T-ray imaging. IEEE J. Sel. Top. Quantum Electron. 1996, 2, 679–692. [Google Scholar] [CrossRef] [Green Version]
- Ilinykh, V.A.; Matyushkin, L.B. Sol-gel fabrication of one-dimensional photonic crystals with predicted transmission spectra. J. Phys. Conf. Ser. 2016, 741, 012008. [Google Scholar] [CrossRef]
- Shen, B.; Linko, V.; Dietz, H.; Toppari, J.J. Dielectrophoretic trapping of multilayer DNA origami nanostructures and DNA origami-induced local destruction of silicon dioxide. Electrophoresis 2015, 36, 255–262. [Google Scholar] [CrossRef] [PubMed] [Green Version]
- Dou, Y.; Han, J.; Wang, T.; Wei, M.; Evans, D.G.; Duan, X. Fabrication of MMO–TiO2 one-dimensional photonic crystal and its application as a colorimetric sensor. J. Mater. Chem. 2012, 22, 14001. [Google Scholar] [CrossRef]
- Alam, M.K.; Dhasarathan, V.; Natesan, A.; Nambi, R.; Zaman, M.U.; Ganji, K.K.; Basri, R.; Munisekhar, M.S.; Nagarajappa, A.K.; Abutayyem, H. Human Teeth Disease Detection Using Refractive Index Based Surface Plasmon Resonance Biosensor. Coatings 2022, 12, 1398. [Google Scholar] [CrossRef]
- Liu, Z.; Sun, H.; Li, Y.; Zhang, J.; Ning, C.Z. Fabrication of 1D Photonic Crystal on a Single Erbium Chloride Silicate Nanowire and Microcavity Laser Design. In Proceedings of the CLEO 2015, San Jose, CA, USA, 10–15 May 2015; OSA Technical Digest (online). Optica Publishing Group: San Jose, CA, USA, 2015; p. SW4I.2. [Google Scholar]
- Ilinykh, V.A.; Matyushkin, L.B. Fabrication of one-dimensional photonic crystals by sol-gel method. In Proceedings of the 2016 IEEE NW Russia Young Researchers in Electrical and Electronic Engineering Conference (EIConRusNW), St. Petersburg, Russia, 2–3 February 2016; pp. 47–50. [Google Scholar] [CrossRef]
- Gutierrez, C.F.R.; Hernandez, H.D.M.; Cabrera, I.A.L.; García, M.E.R. Design, fabrication, and optical characterization of one-dimensional photonic crystals based on porous silicon assisted by in-situ photoacoustics. Sci. Rep. 2019, 9, 14732. [Google Scholar] [CrossRef] [Green Version]
- González-García, L.; Colodrero, S.; Míguez, H.; González-Elipe, A.R. Single-step fabrication process of 1-D photonic crystals coupled to nanocolumnar TiO2 layers to improve DSC efficiency. Opt. Express 2015, 23, A1642. [Google Scholar] [CrossRef]
- Litzenburger, F.; Heck, K.; Kaisarly, D.; Kunzelmann, K. Diagnostic validity of early proximal caries detection using near-infrared imaging technology on 3D range data of posterior teeth. Clin. Oral Investig. 2022, 26, 543–553. [Google Scholar] [CrossRef]
- Al-Dossari, M.; Awasthi, S.K.; Mohamed, A.M.; Abd El-Gawaad, N.S.; Sabra, W.; Aly, A.H. Bio-Alcohol Sensor Based on One-Dimensional Photonic Crystals for Detection of Organic Materials in Wastewater. Materials 2022, 15, 4012. [Google Scholar] [CrossRef]
- Sayed, H.; Alamri, S.; Matar, Z. Salinity sensor based on 1D photonic crystals by tamm resonance with different geometrical shapes. Plasmonics 2022, 17, 409–422. [Google Scholar] [CrossRef]


| Specimen | Deformation Size (µm) | Refractive Indices |
|---|---|---|
| Normal Enamels | Normal | 2.2 |
| Abnormal Enamels | A | 3.2 |
| B | 3.0 | |
| C | 3.4 | |
| D | 2.9 | |
| Normal Dentine | Normal | 1.9 |
| Abnormal Dentine | A | 2.6 |
| B | 2.5 | |
| C | 2.8 | |
| D | 2.65 |
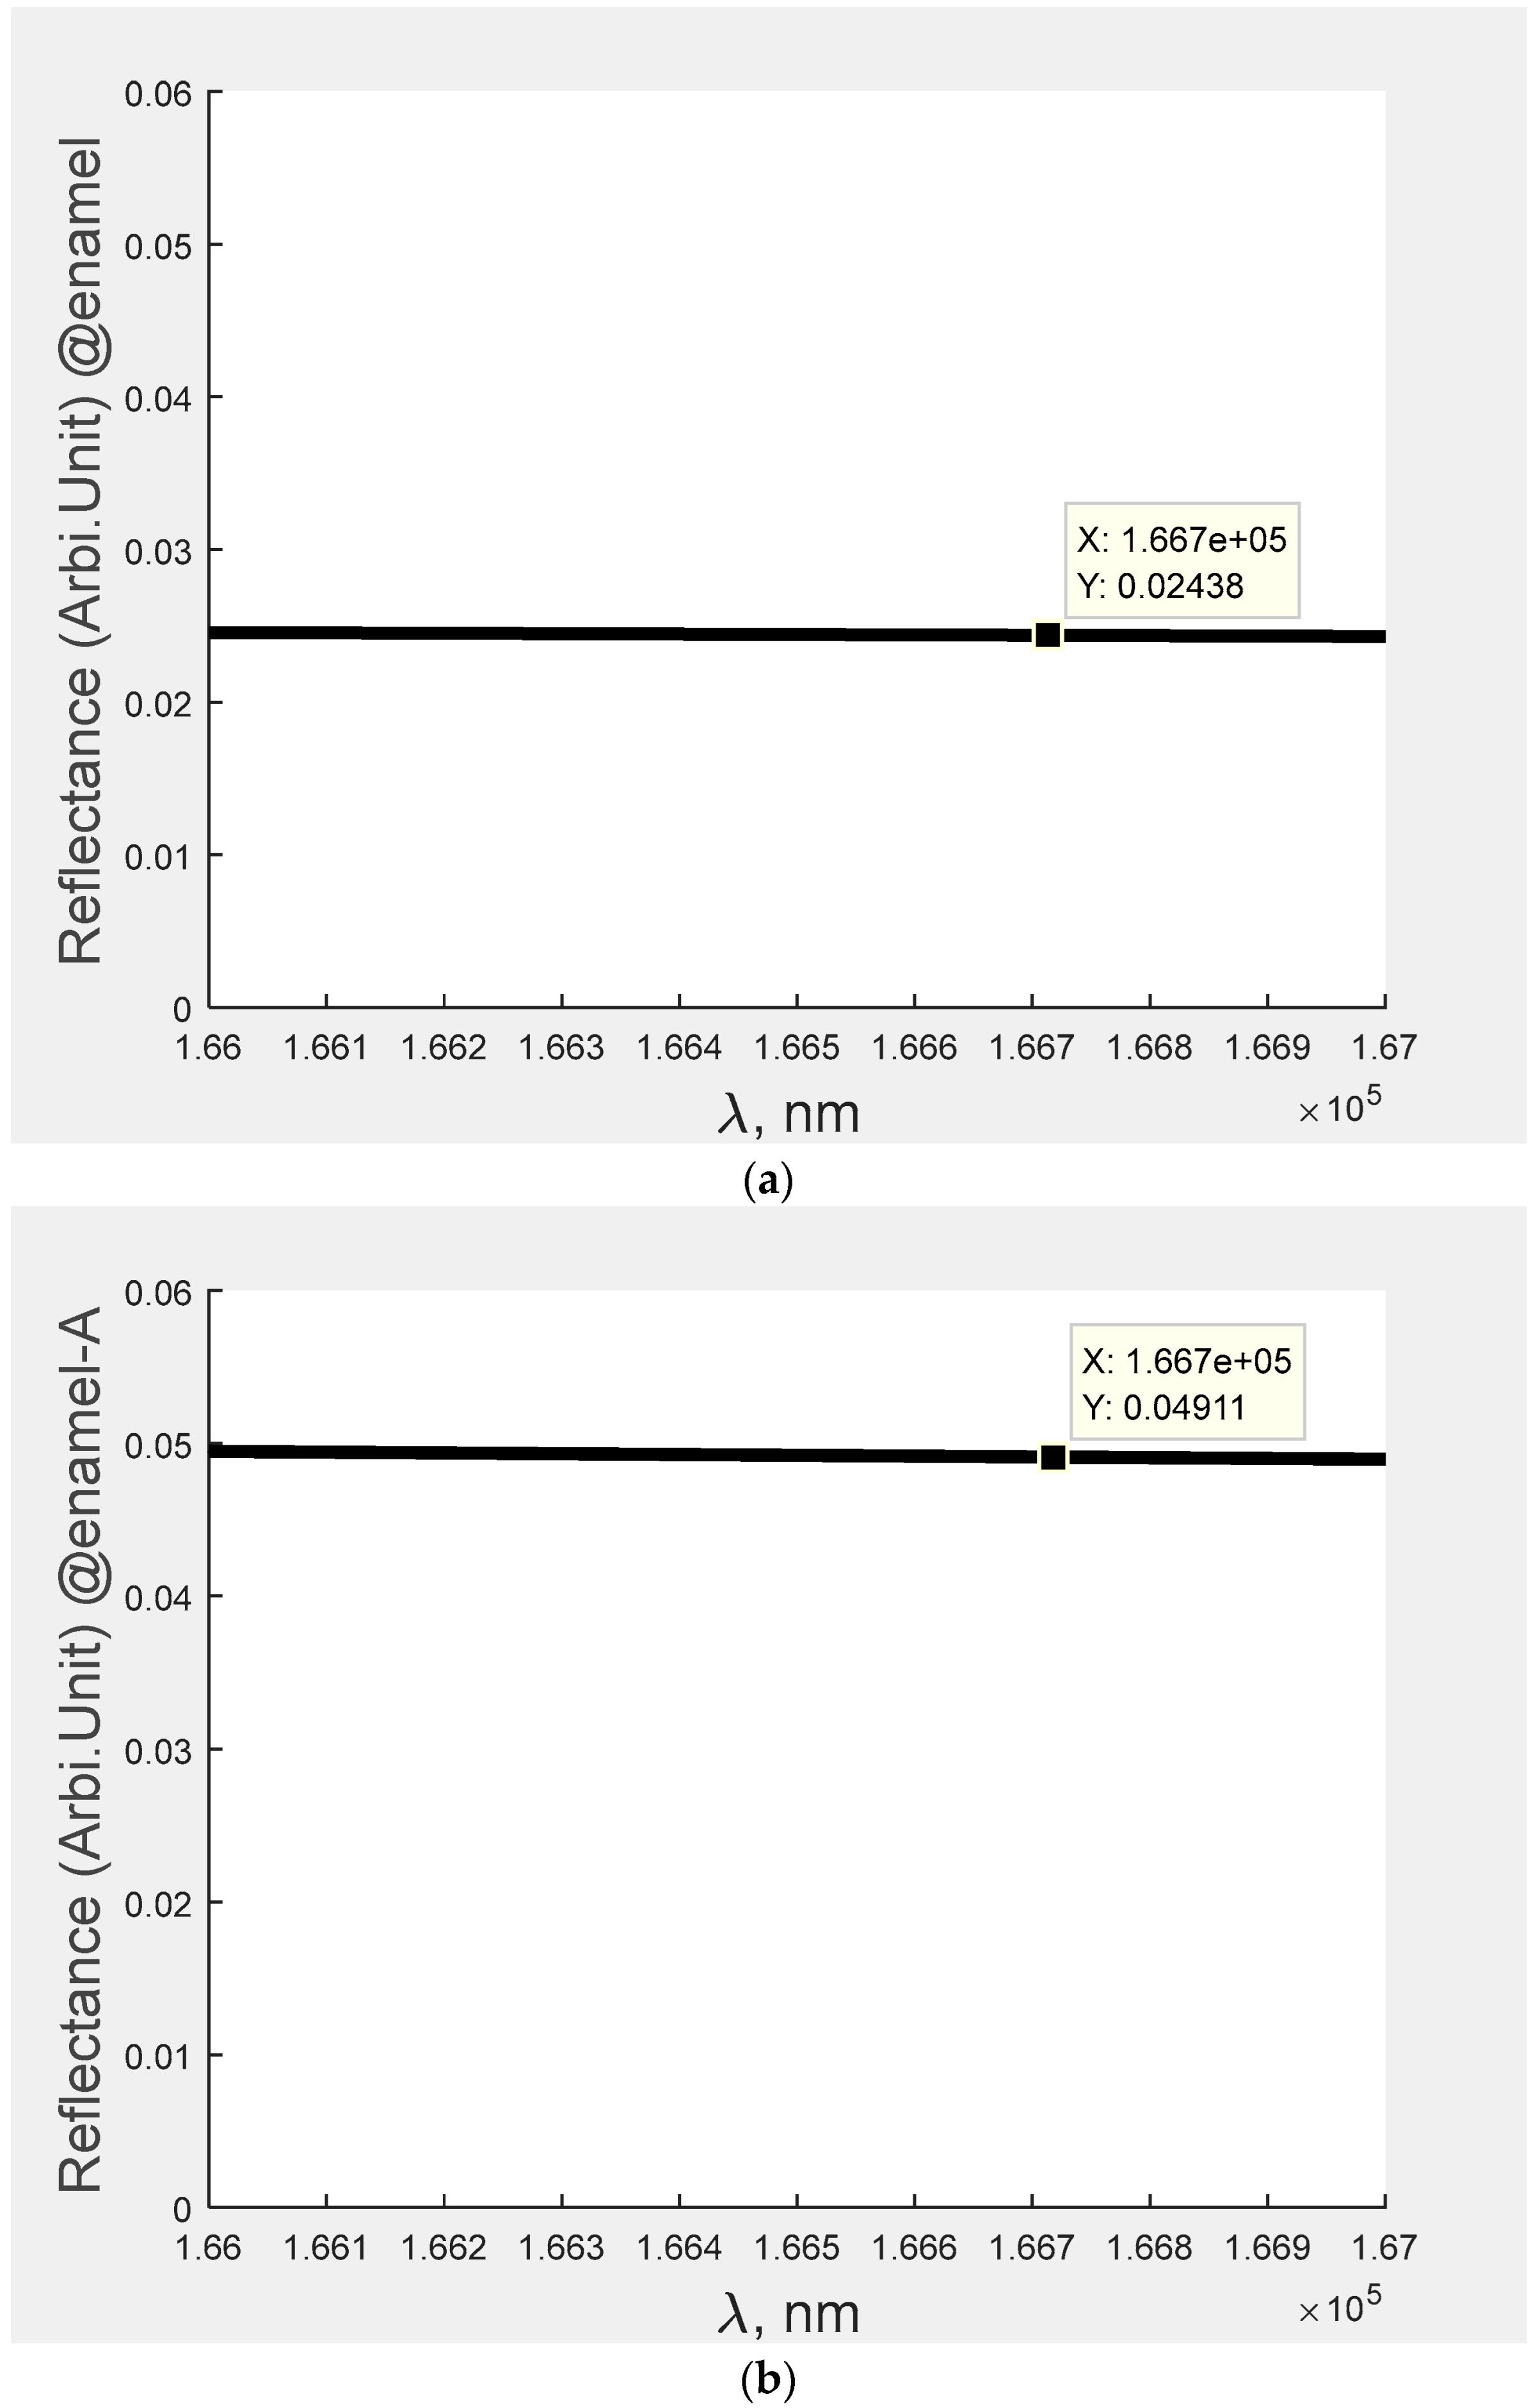
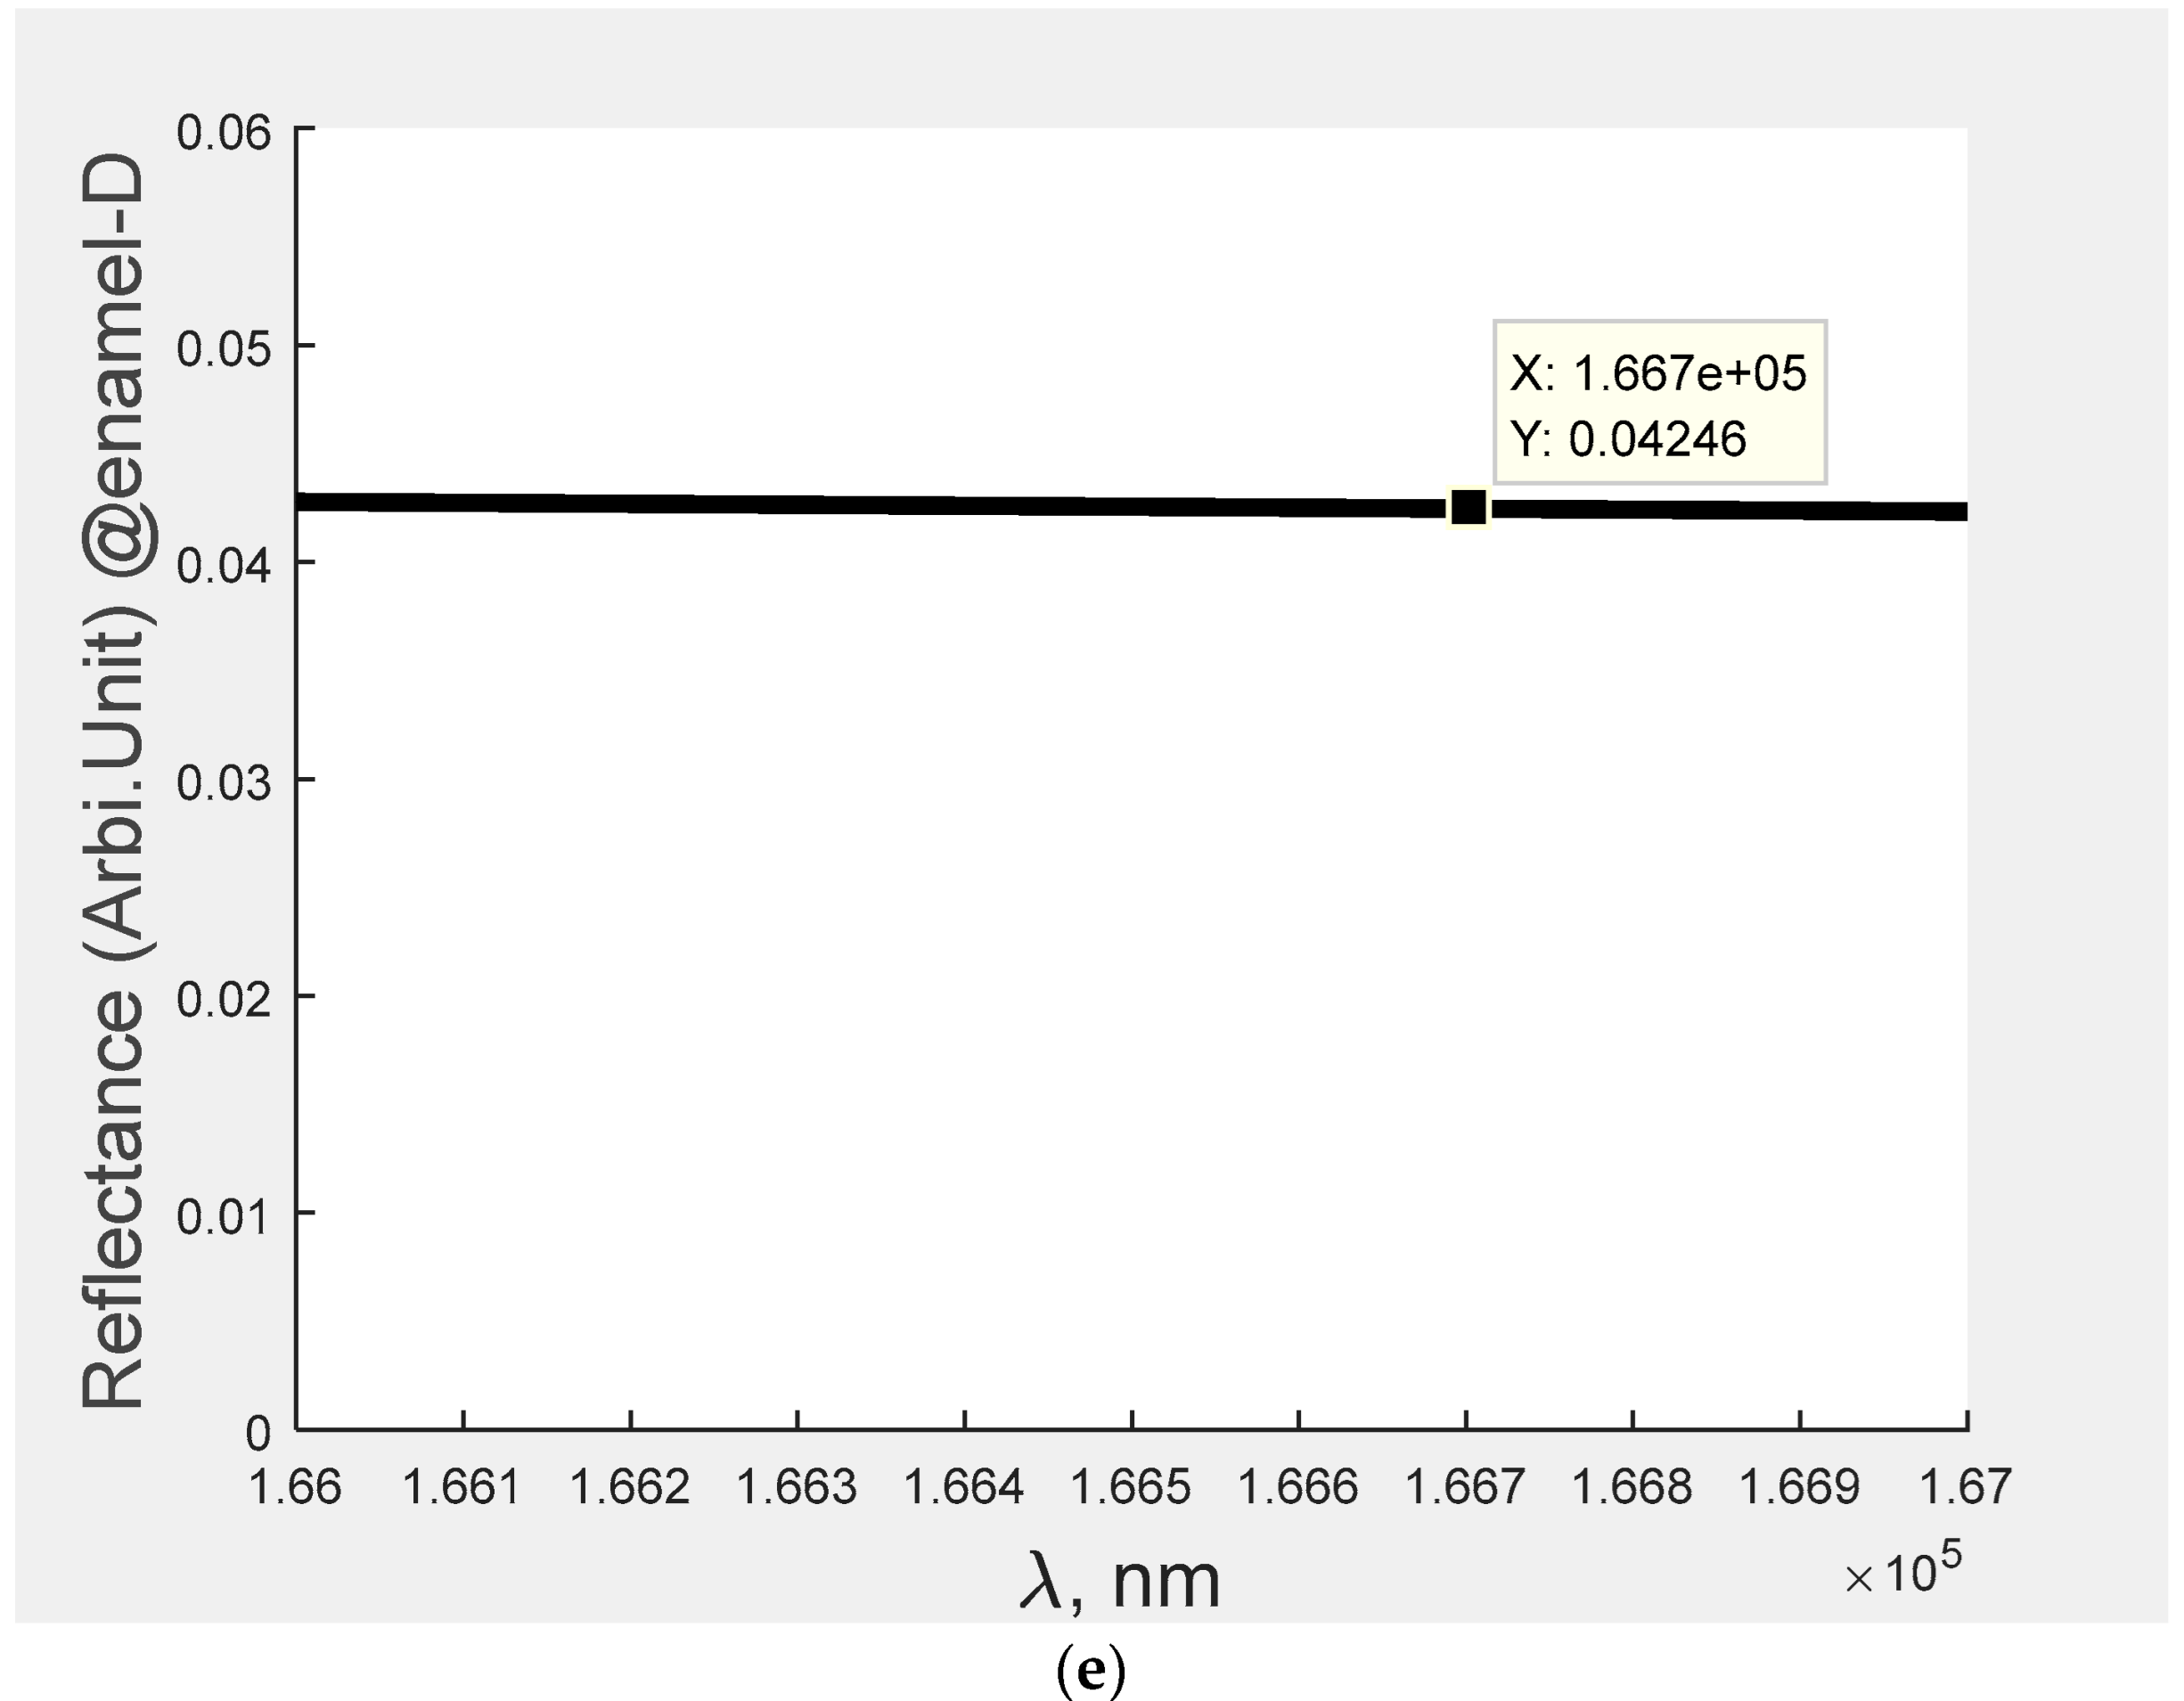
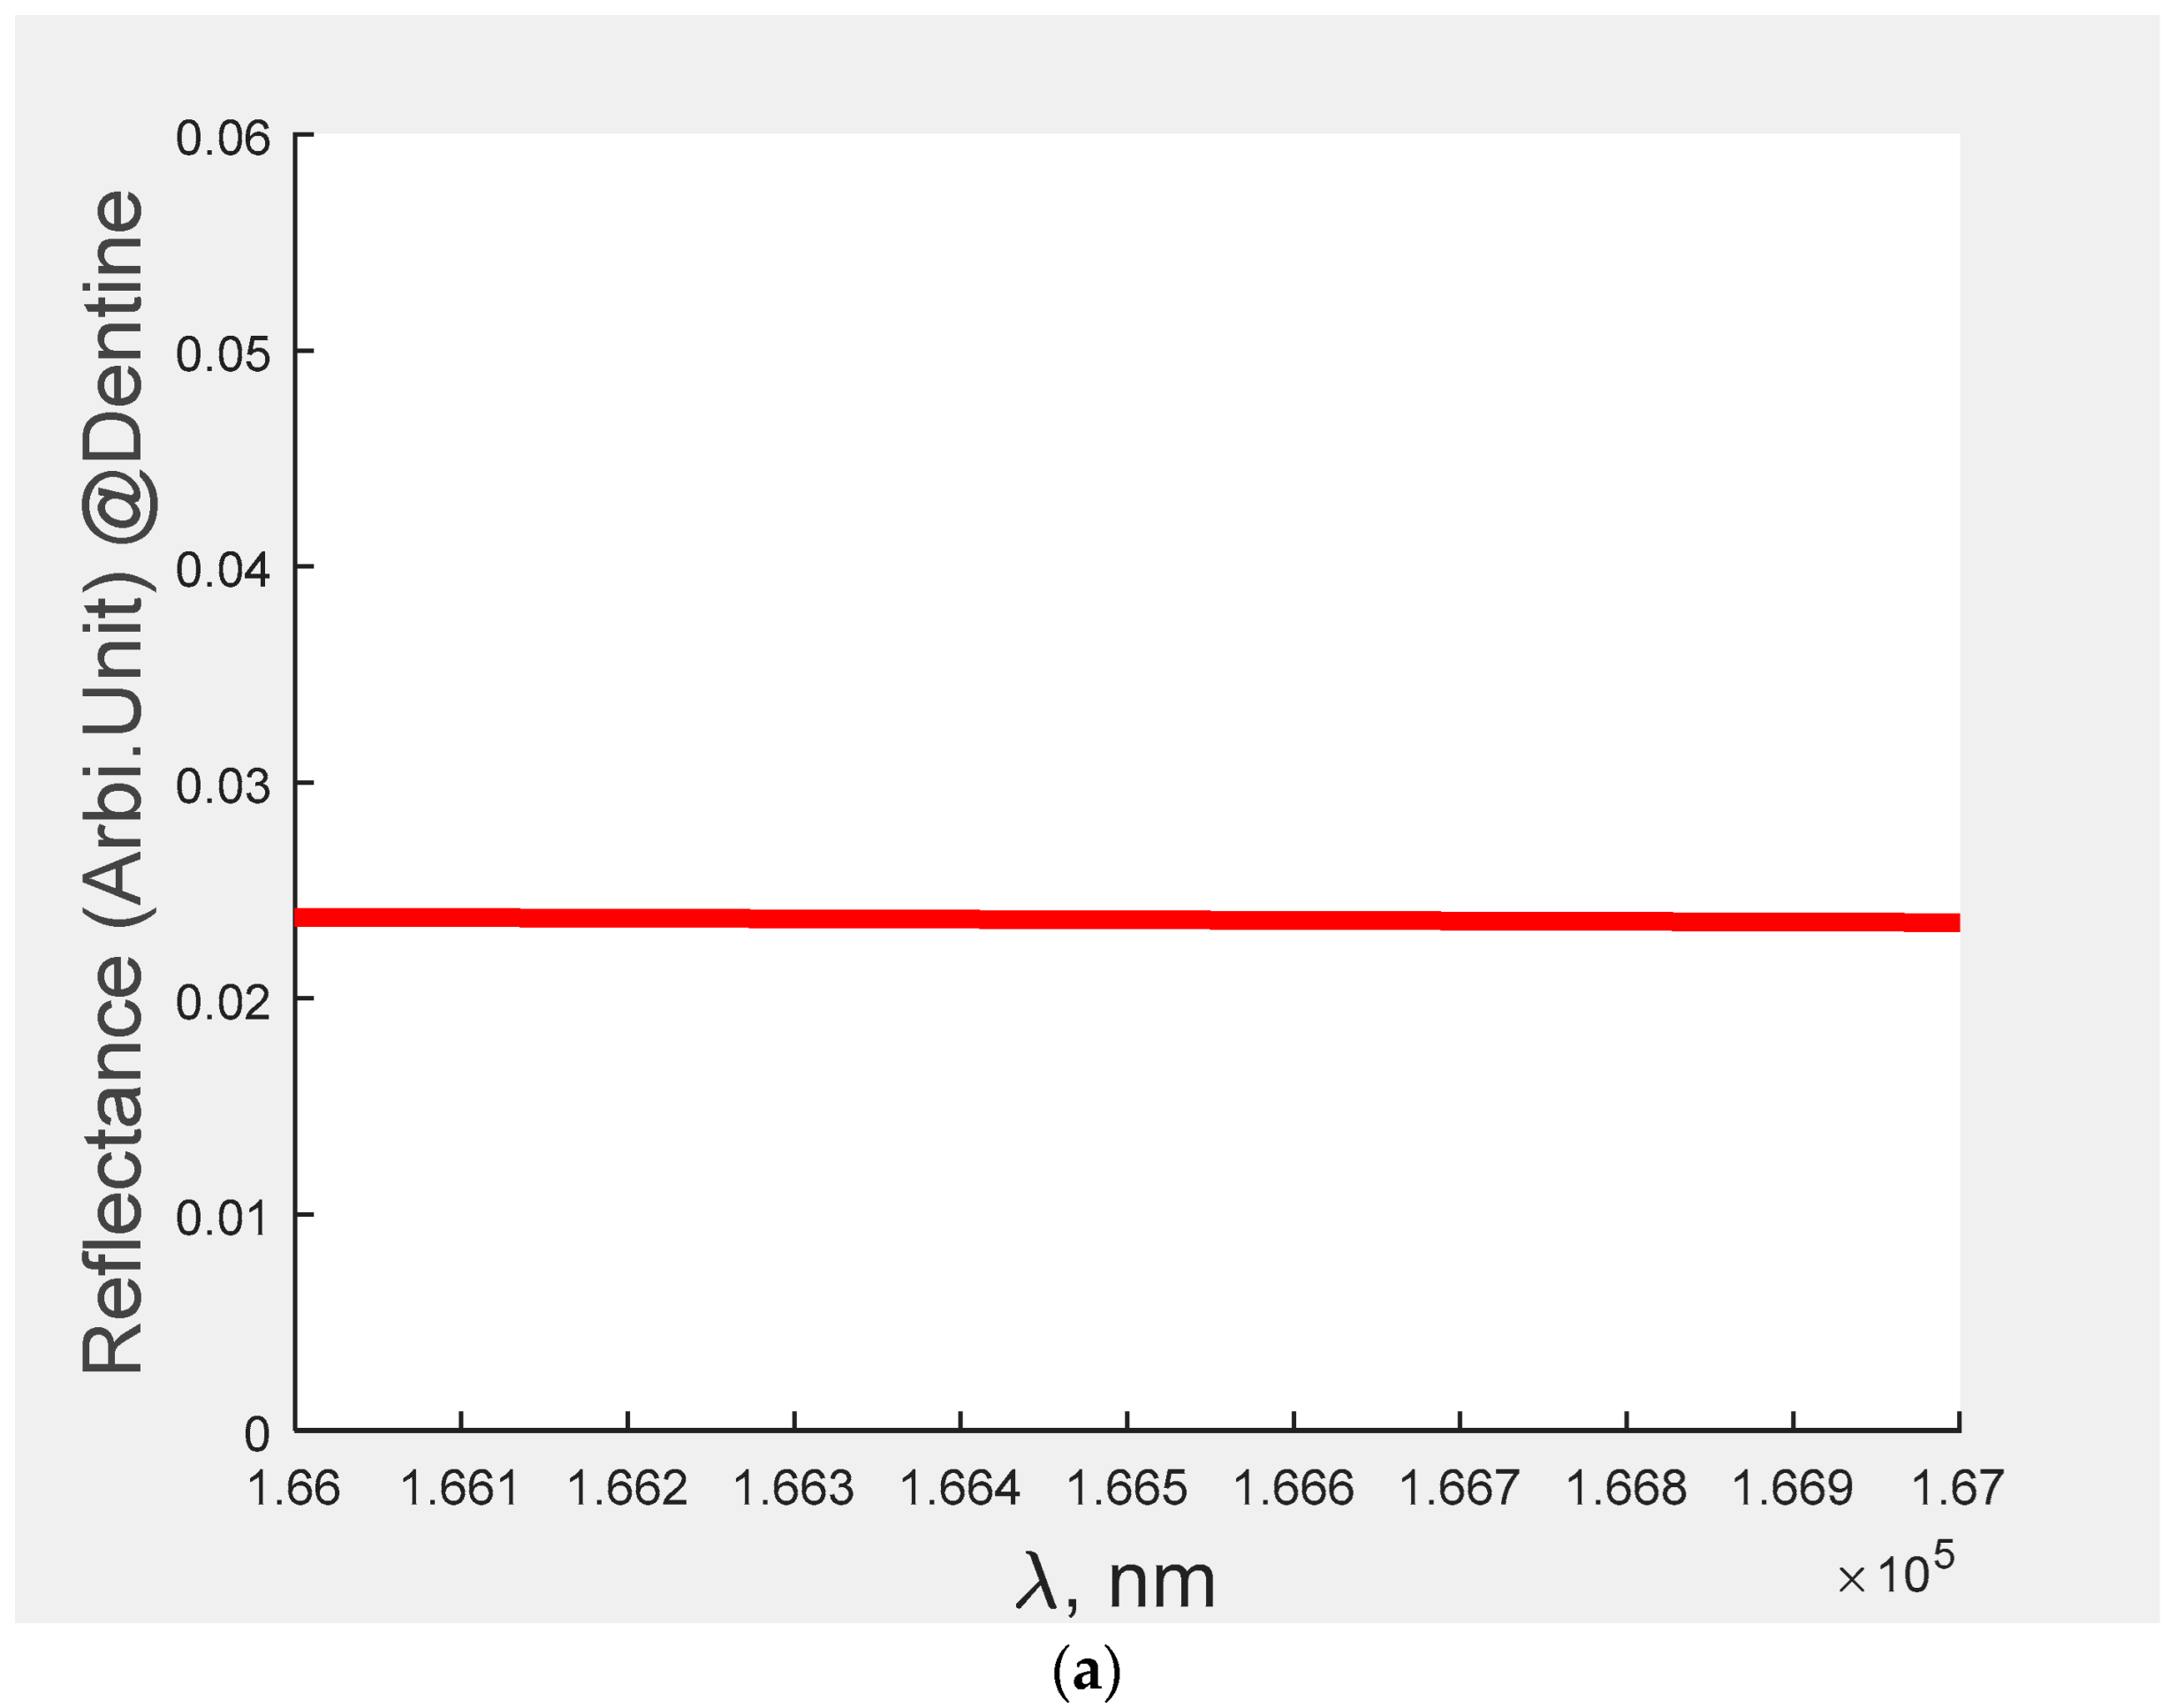
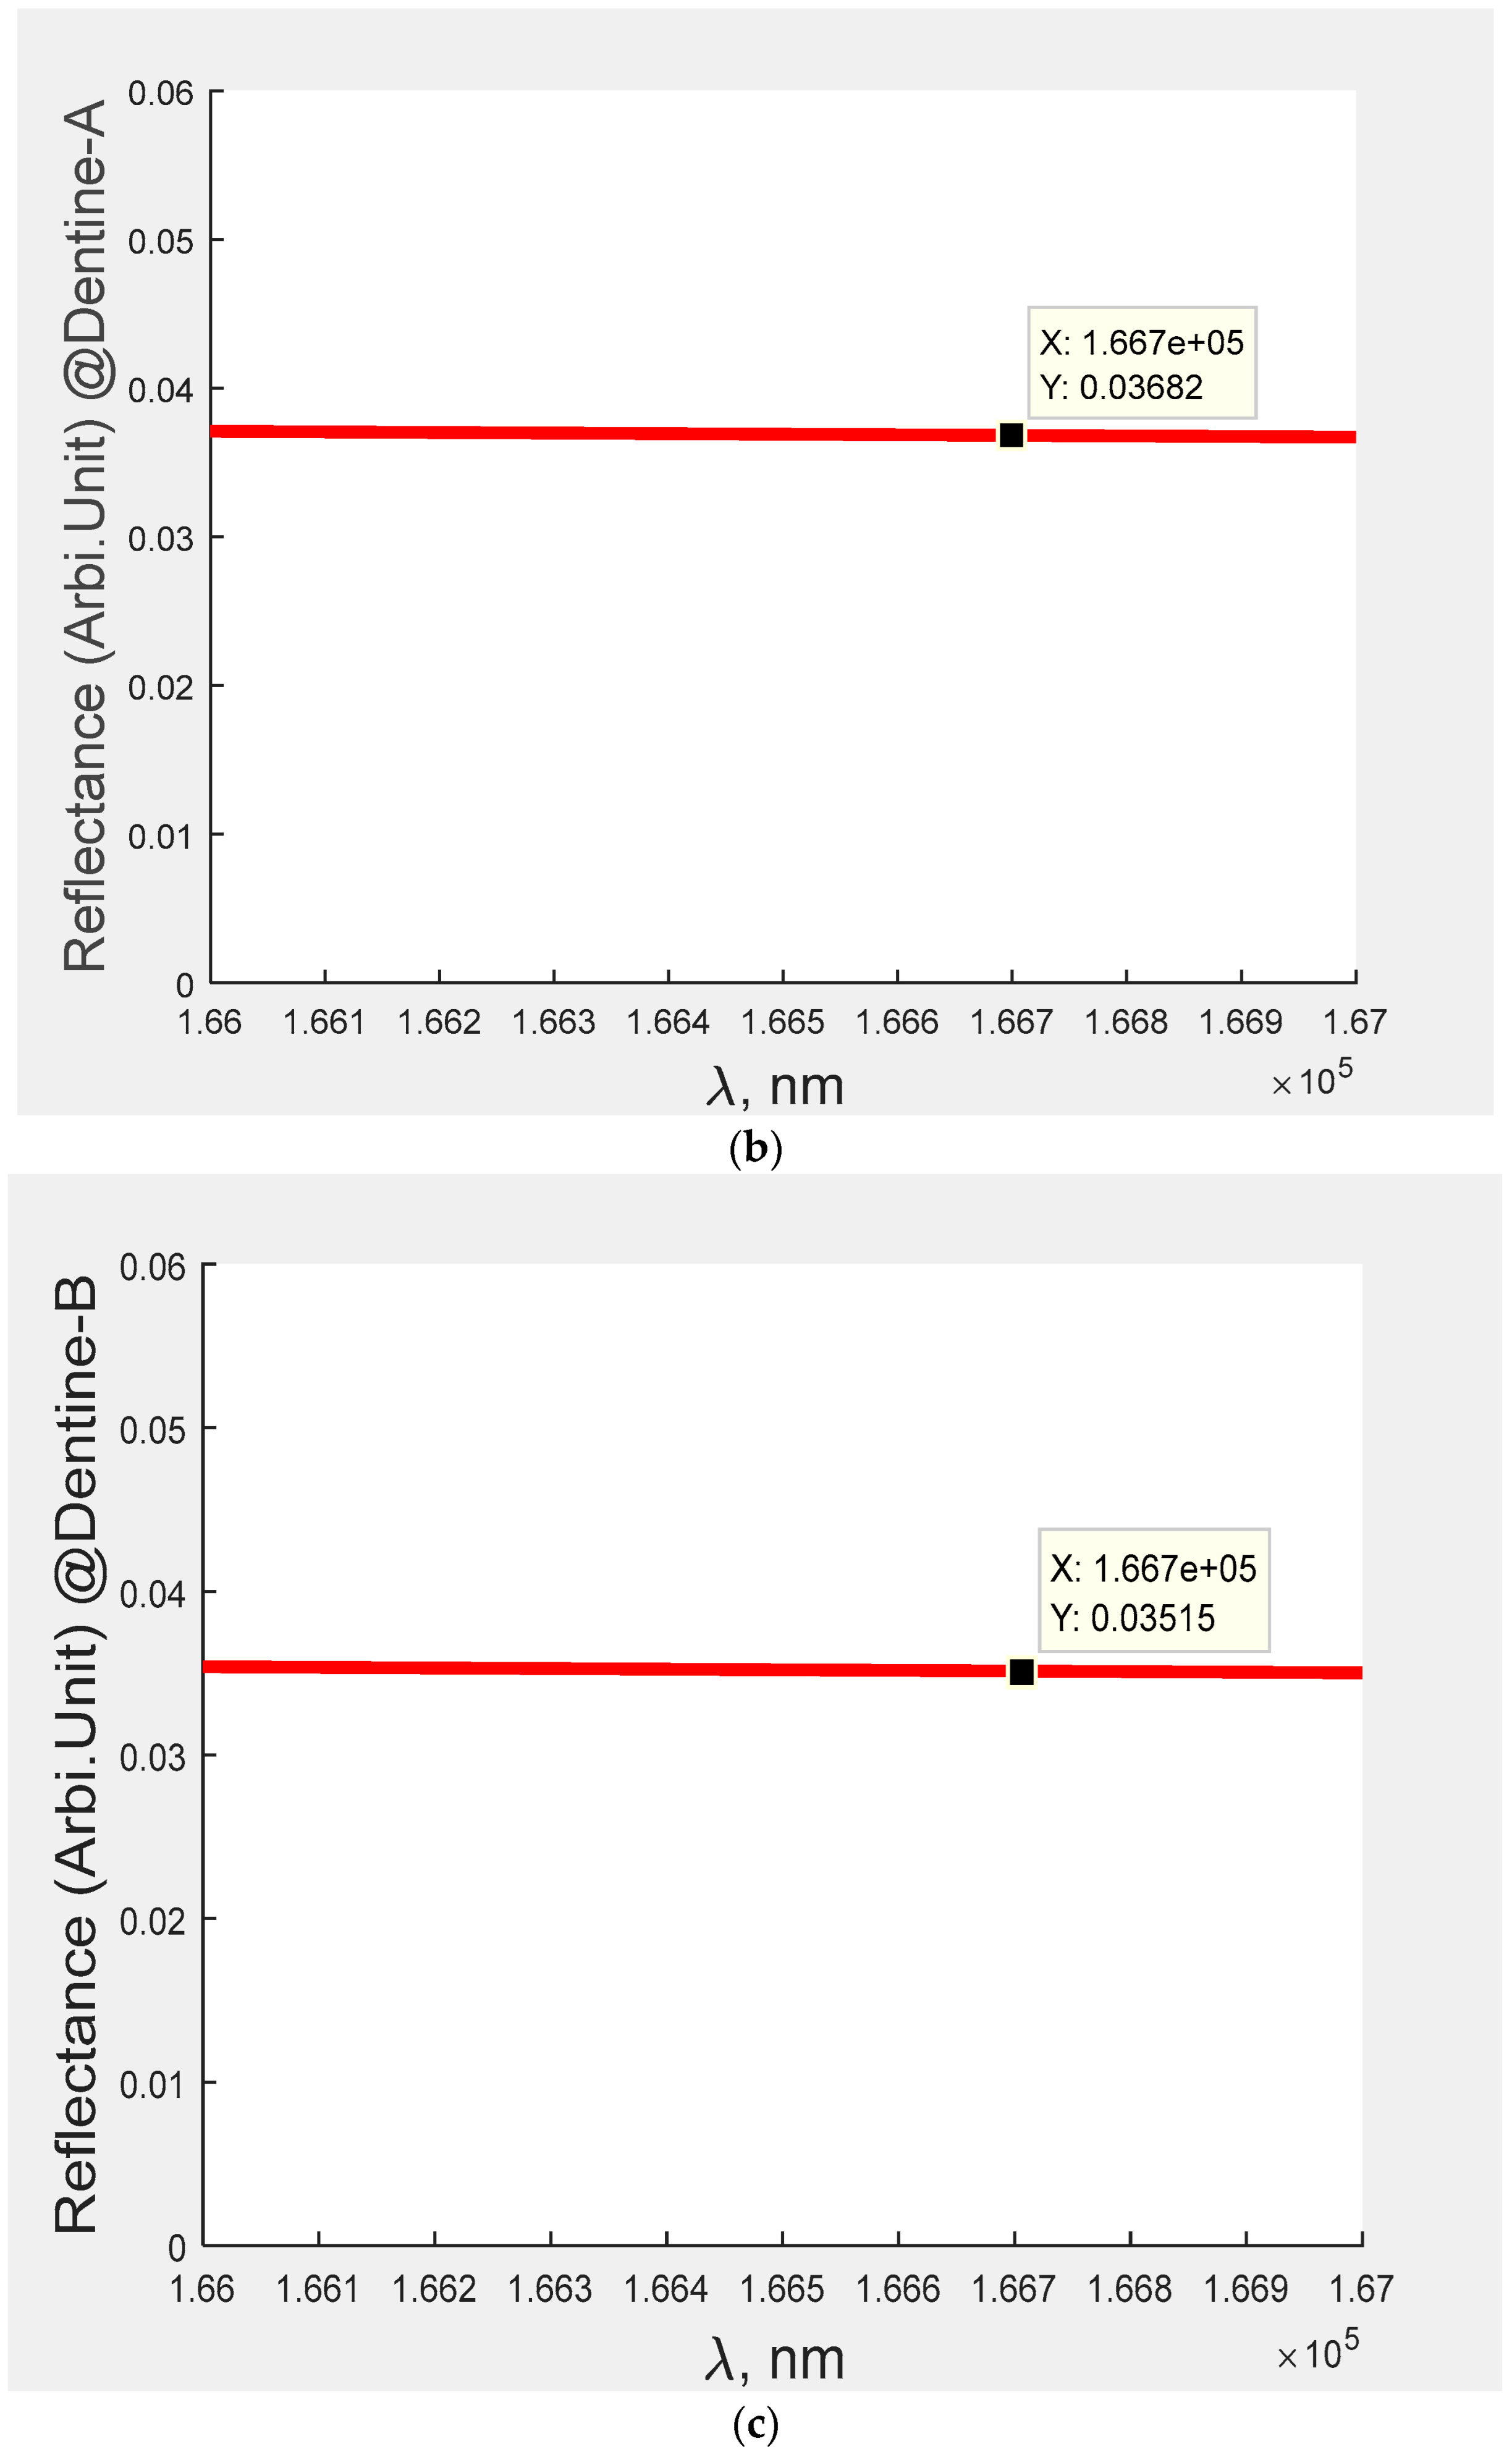
| Specimen | Deformation Size (µm) | ReflectanceEnamel | ReflectanceDentine |
|---|---|---|---|
| Normal | Normal | 0.02438 | 0.0235 |
| Abnormal | A | 0.04911 | 0.03682 |
| B | 0.04456 | 0.03515 | |
| C | 0.05417 | 0.03597 | |
| D | 0.04246 | 0.03514 |
Publisher’s Note: MDPI stays neutral with regard to jurisdictional claims in published maps and institutional affiliations. |
© 2022 by the authors. Licensee MDPI, Basel, Switzerland. This article is an open access article distributed under the terms and conditions of the Creative Commons Attribution (CC BY) license (https://creativecommons.org/licenses/by/4.0/).
Share and Cite
Alam, M.K.; Dhasarathan, V.; Aly, M.H.; Zaman, M.U.; Ganji, K.K.; Basri, R.; Munisekhar, M.S.; Nagarajappa, A.K. Investigation on Enamel and Dentine of Tooth through 1D Photonic Structure to Identify the Caries in Human Teeth. Bioengineering 2022, 9, 788. https://doi.org/10.3390/bioengineering9120788
Alam MK, Dhasarathan V, Aly MH, Zaman MU, Ganji KK, Basri R, Munisekhar MS, Nagarajappa AK. Investigation on Enamel and Dentine of Tooth through 1D Photonic Structure to Identify the Caries in Human Teeth. Bioengineering. 2022; 9(12):788. https://doi.org/10.3390/bioengineering9120788
Chicago/Turabian StyleAlam, Mohammad Khursheed, Vigneswaran Dhasarathan, Moustafa H. Aly, Mahmud Uz Zaman, Kiran Kumar Ganji, Rehana Basri, Manay Srinivas Munisekhar, and Anil Kumar Nagarajappa. 2022. "Investigation on Enamel and Dentine of Tooth through 1D Photonic Structure to Identify the Caries in Human Teeth" Bioengineering 9, no. 12: 788. https://doi.org/10.3390/bioengineering9120788