
Traumatic Brain Injury Biomarkers, Simulations and Kinetics


Abstract
:1. Introduction
2. Biomarkers
2.1. GFAP
2.2. UCH-L1
2.3. MAP-2
2.4. NF-L
2.5. T-Tau
2.6. S100B
2.7. Aβ42
2.8. NSE
2.9. CRP
2.10. IL-6
2.11. Cortisol
2.12. CCL11
3. Biomarkers from Clinical Trials
3.1. Clinical Evaluation
3.1.1. NF-L TBI Diagnosis
3.1.2. T-Tau TBI Diagnosis
3.1.3. UCH-L1 TBI Diagnosis
3.1.4. GFAP TBI Diagnosis
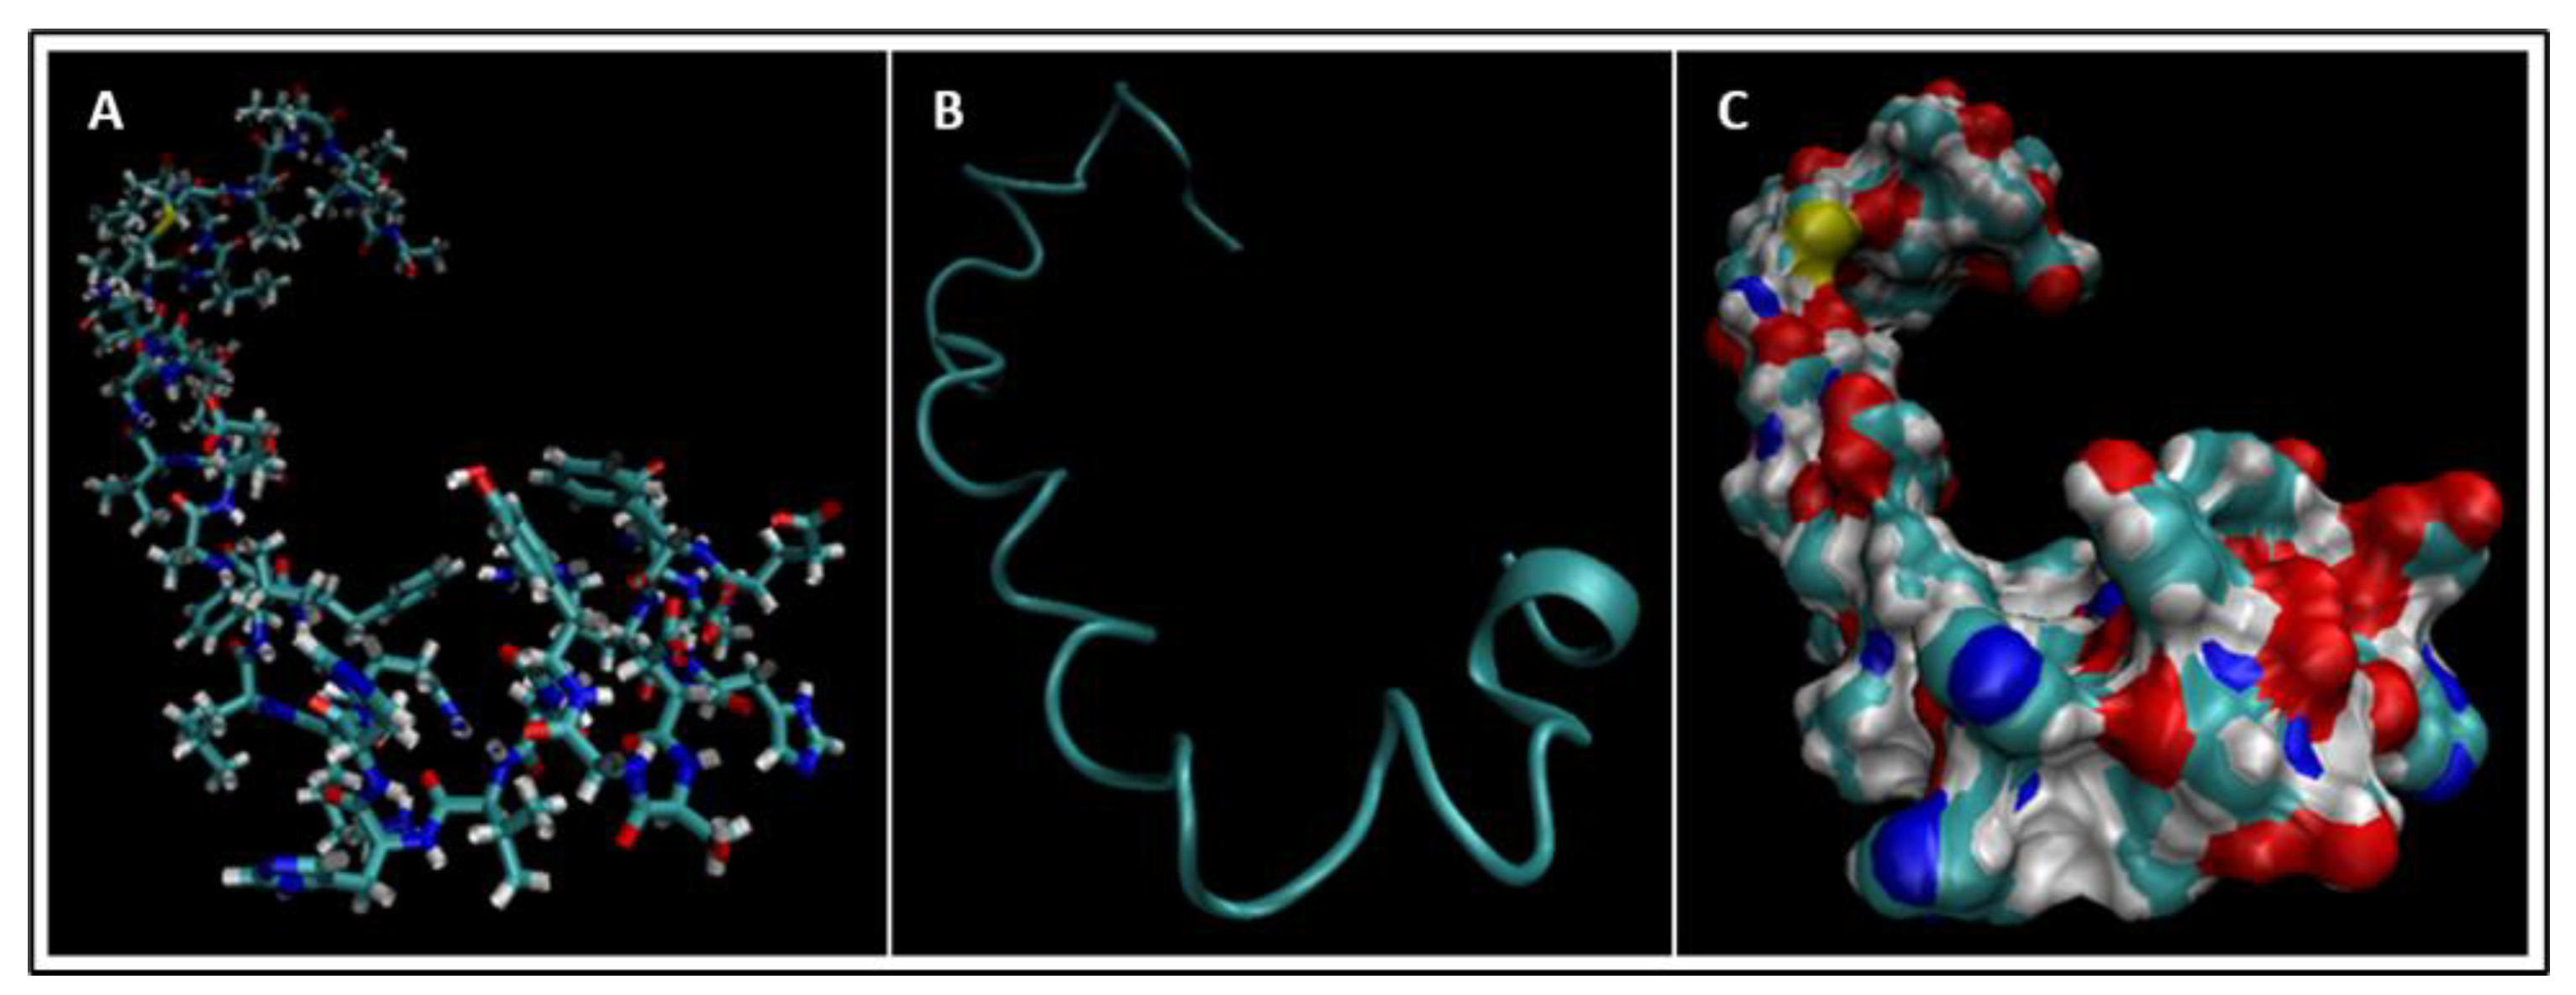
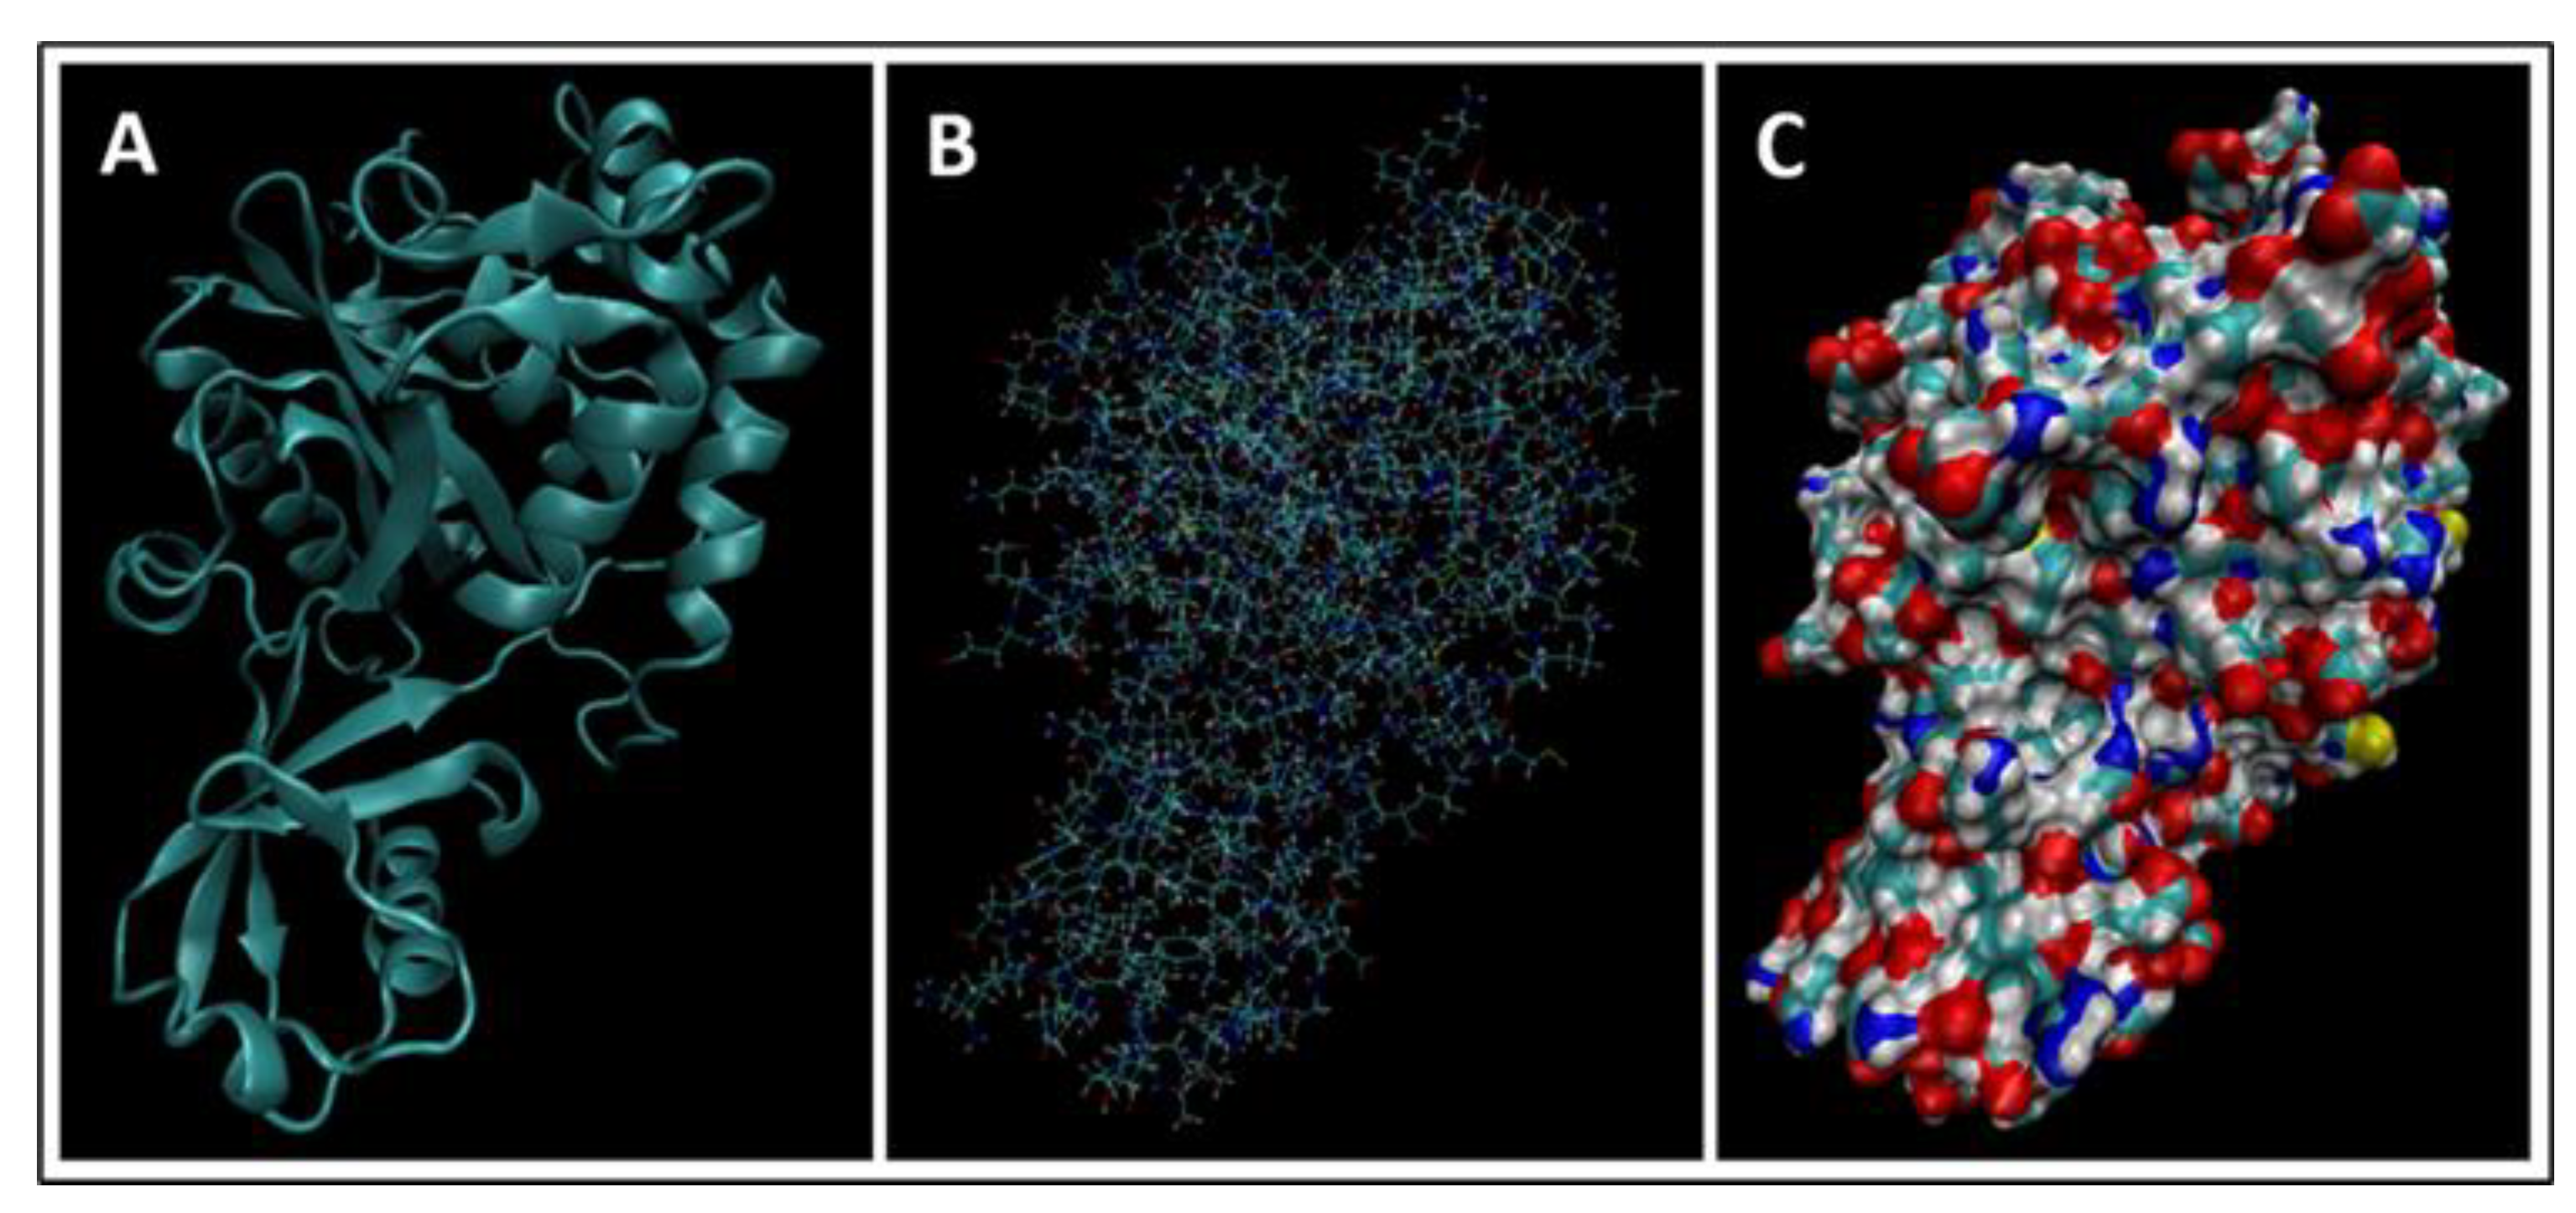
4. Molecular Dynamics Simulations
4.1. Biomarkers
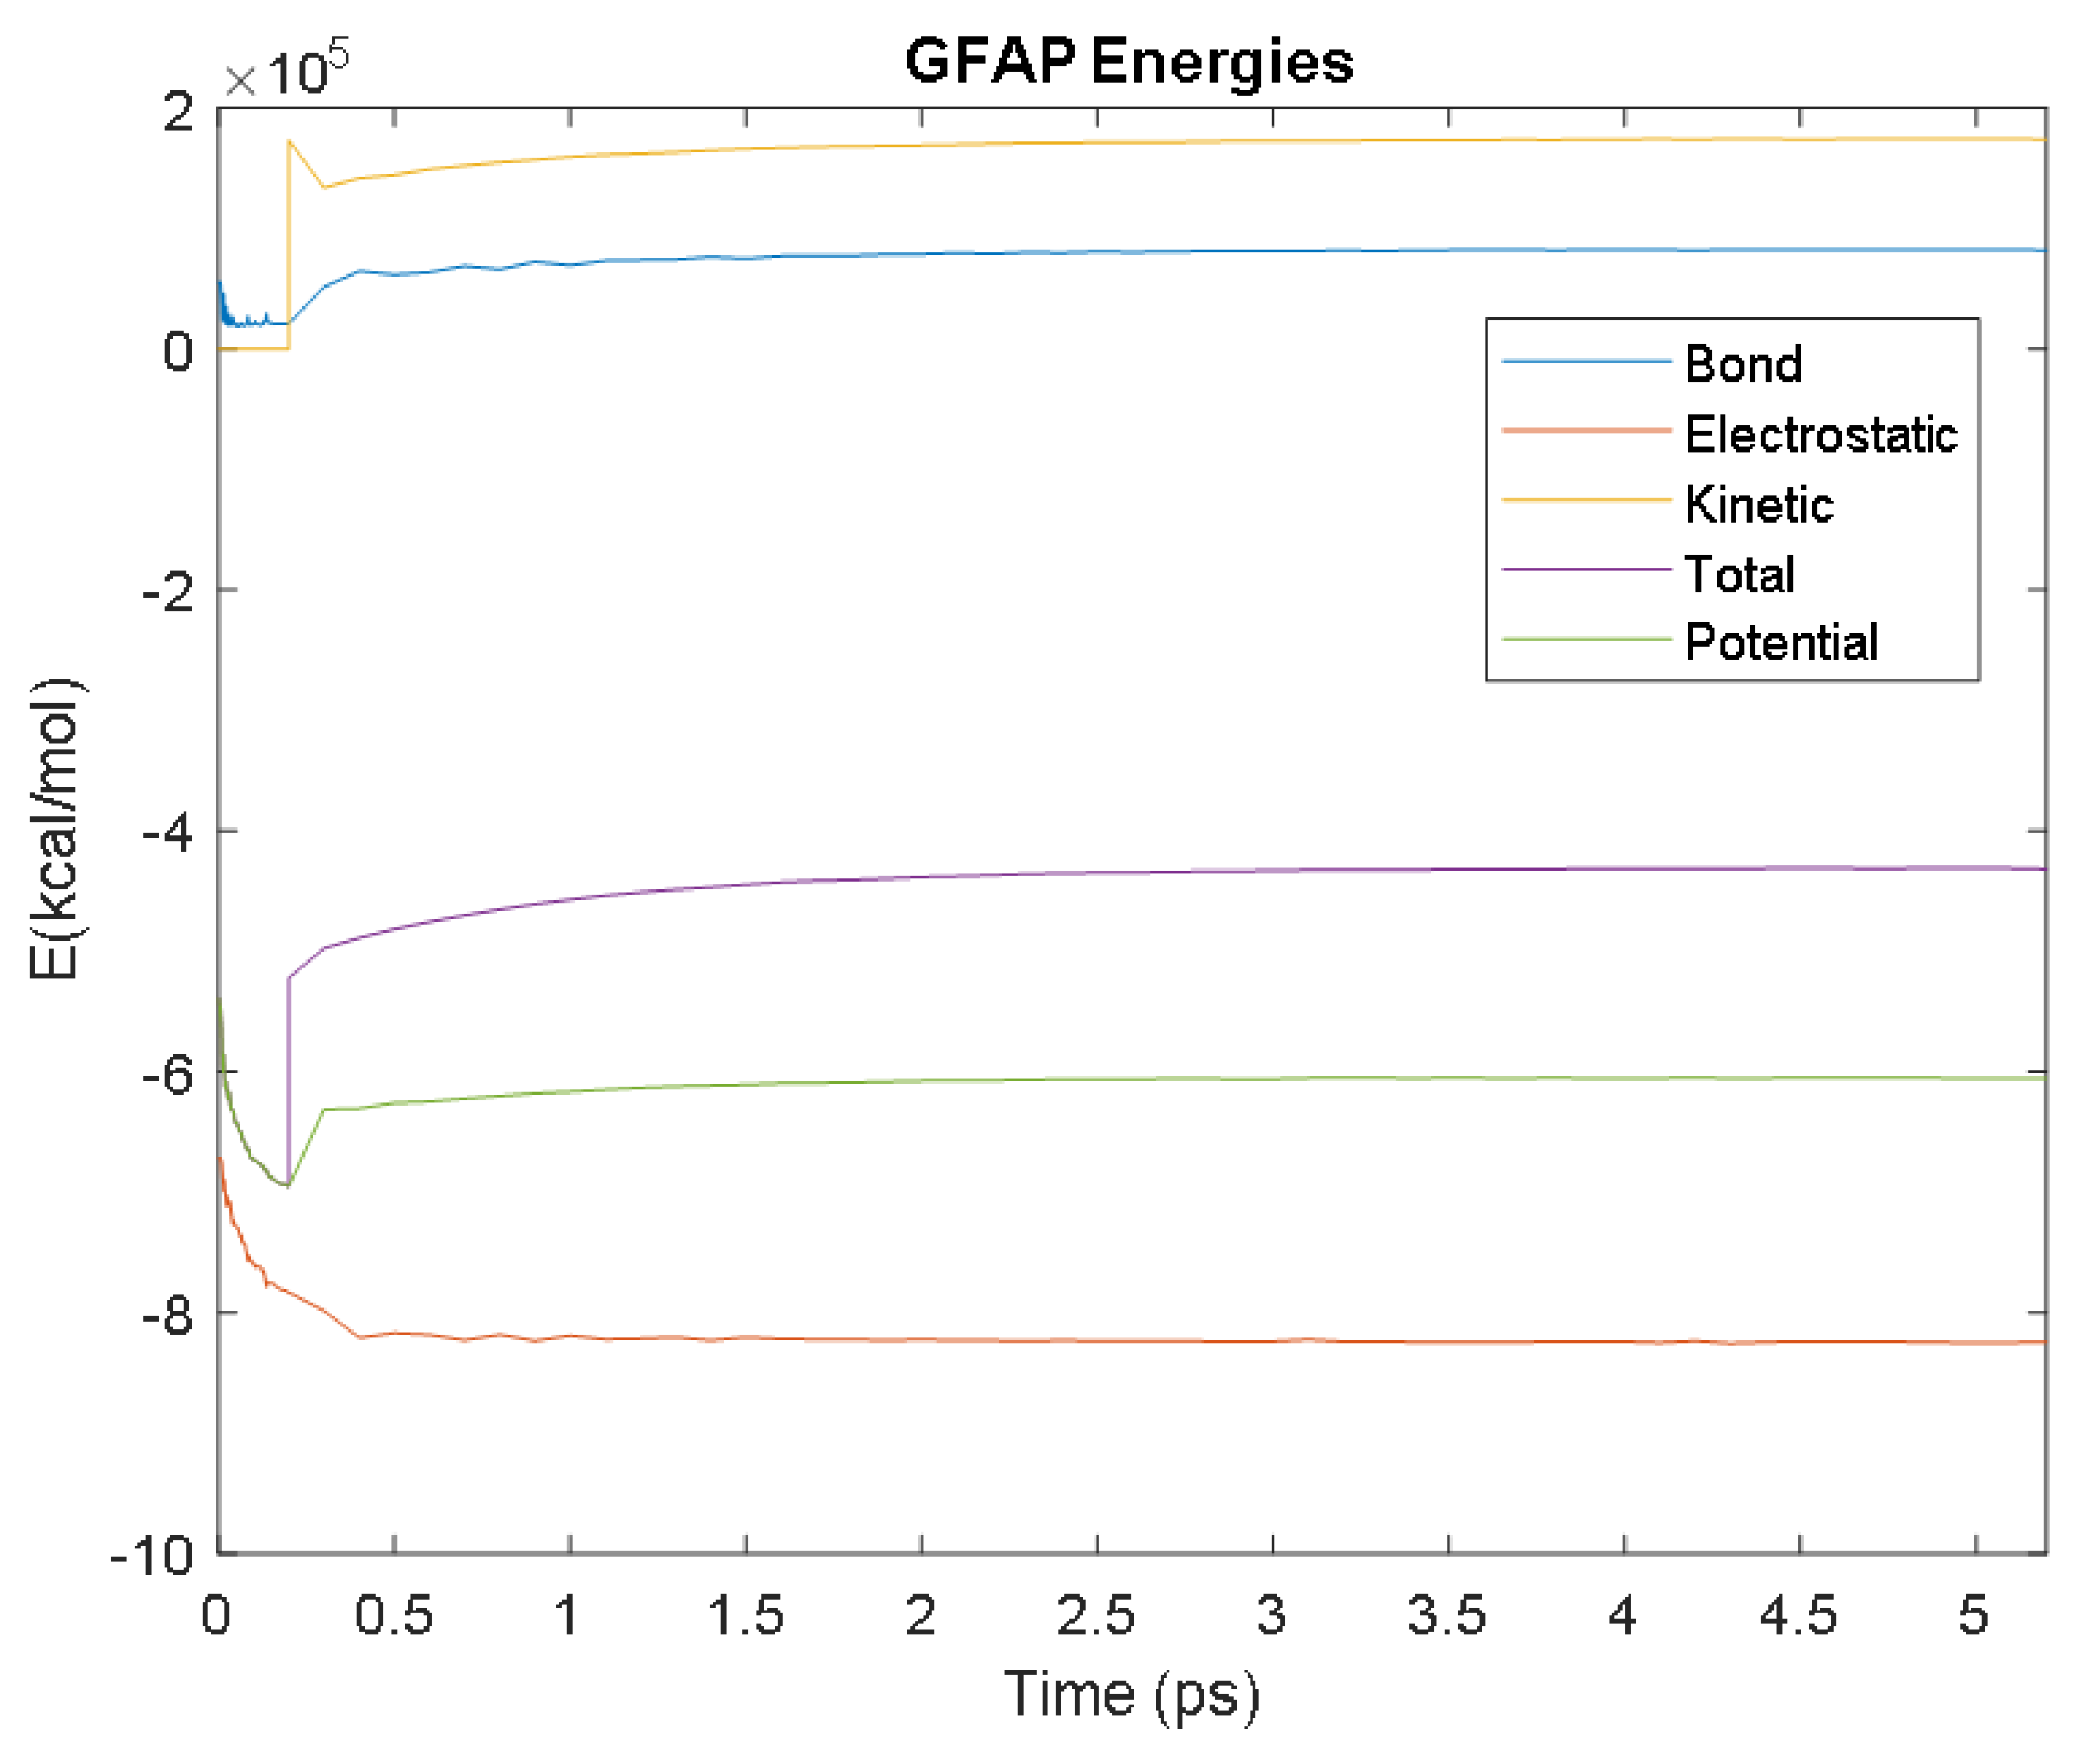
4.2. Molecular Energy and Orbital Diagrams
5. Blood–Brain Barrier
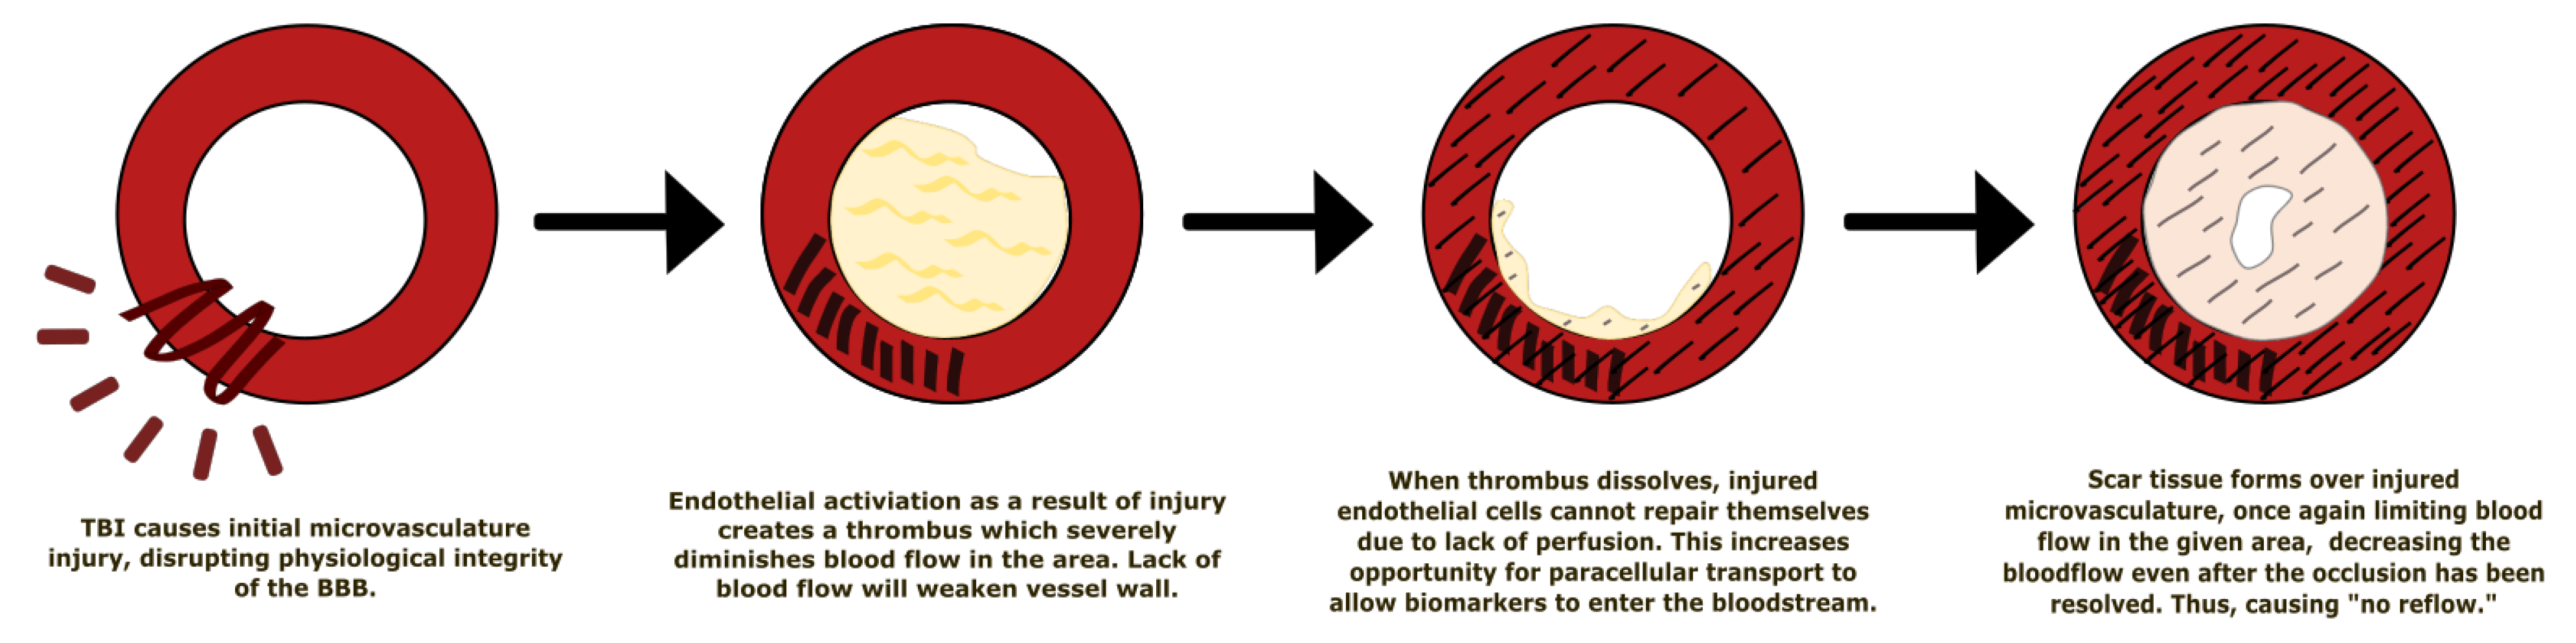
5.1. Effect of Traumatic Brain Injury on the Blood–Brain Barrier
5.2. Metabolic Pathways of Biomarkers of TBIs
5.2.1. GFAP
5.2.2. NF-L: There Are Four Major Proteins Involved in the Formation of Neurofilaments
5.2.3. Total Tau
5.2.4. UCH-L1
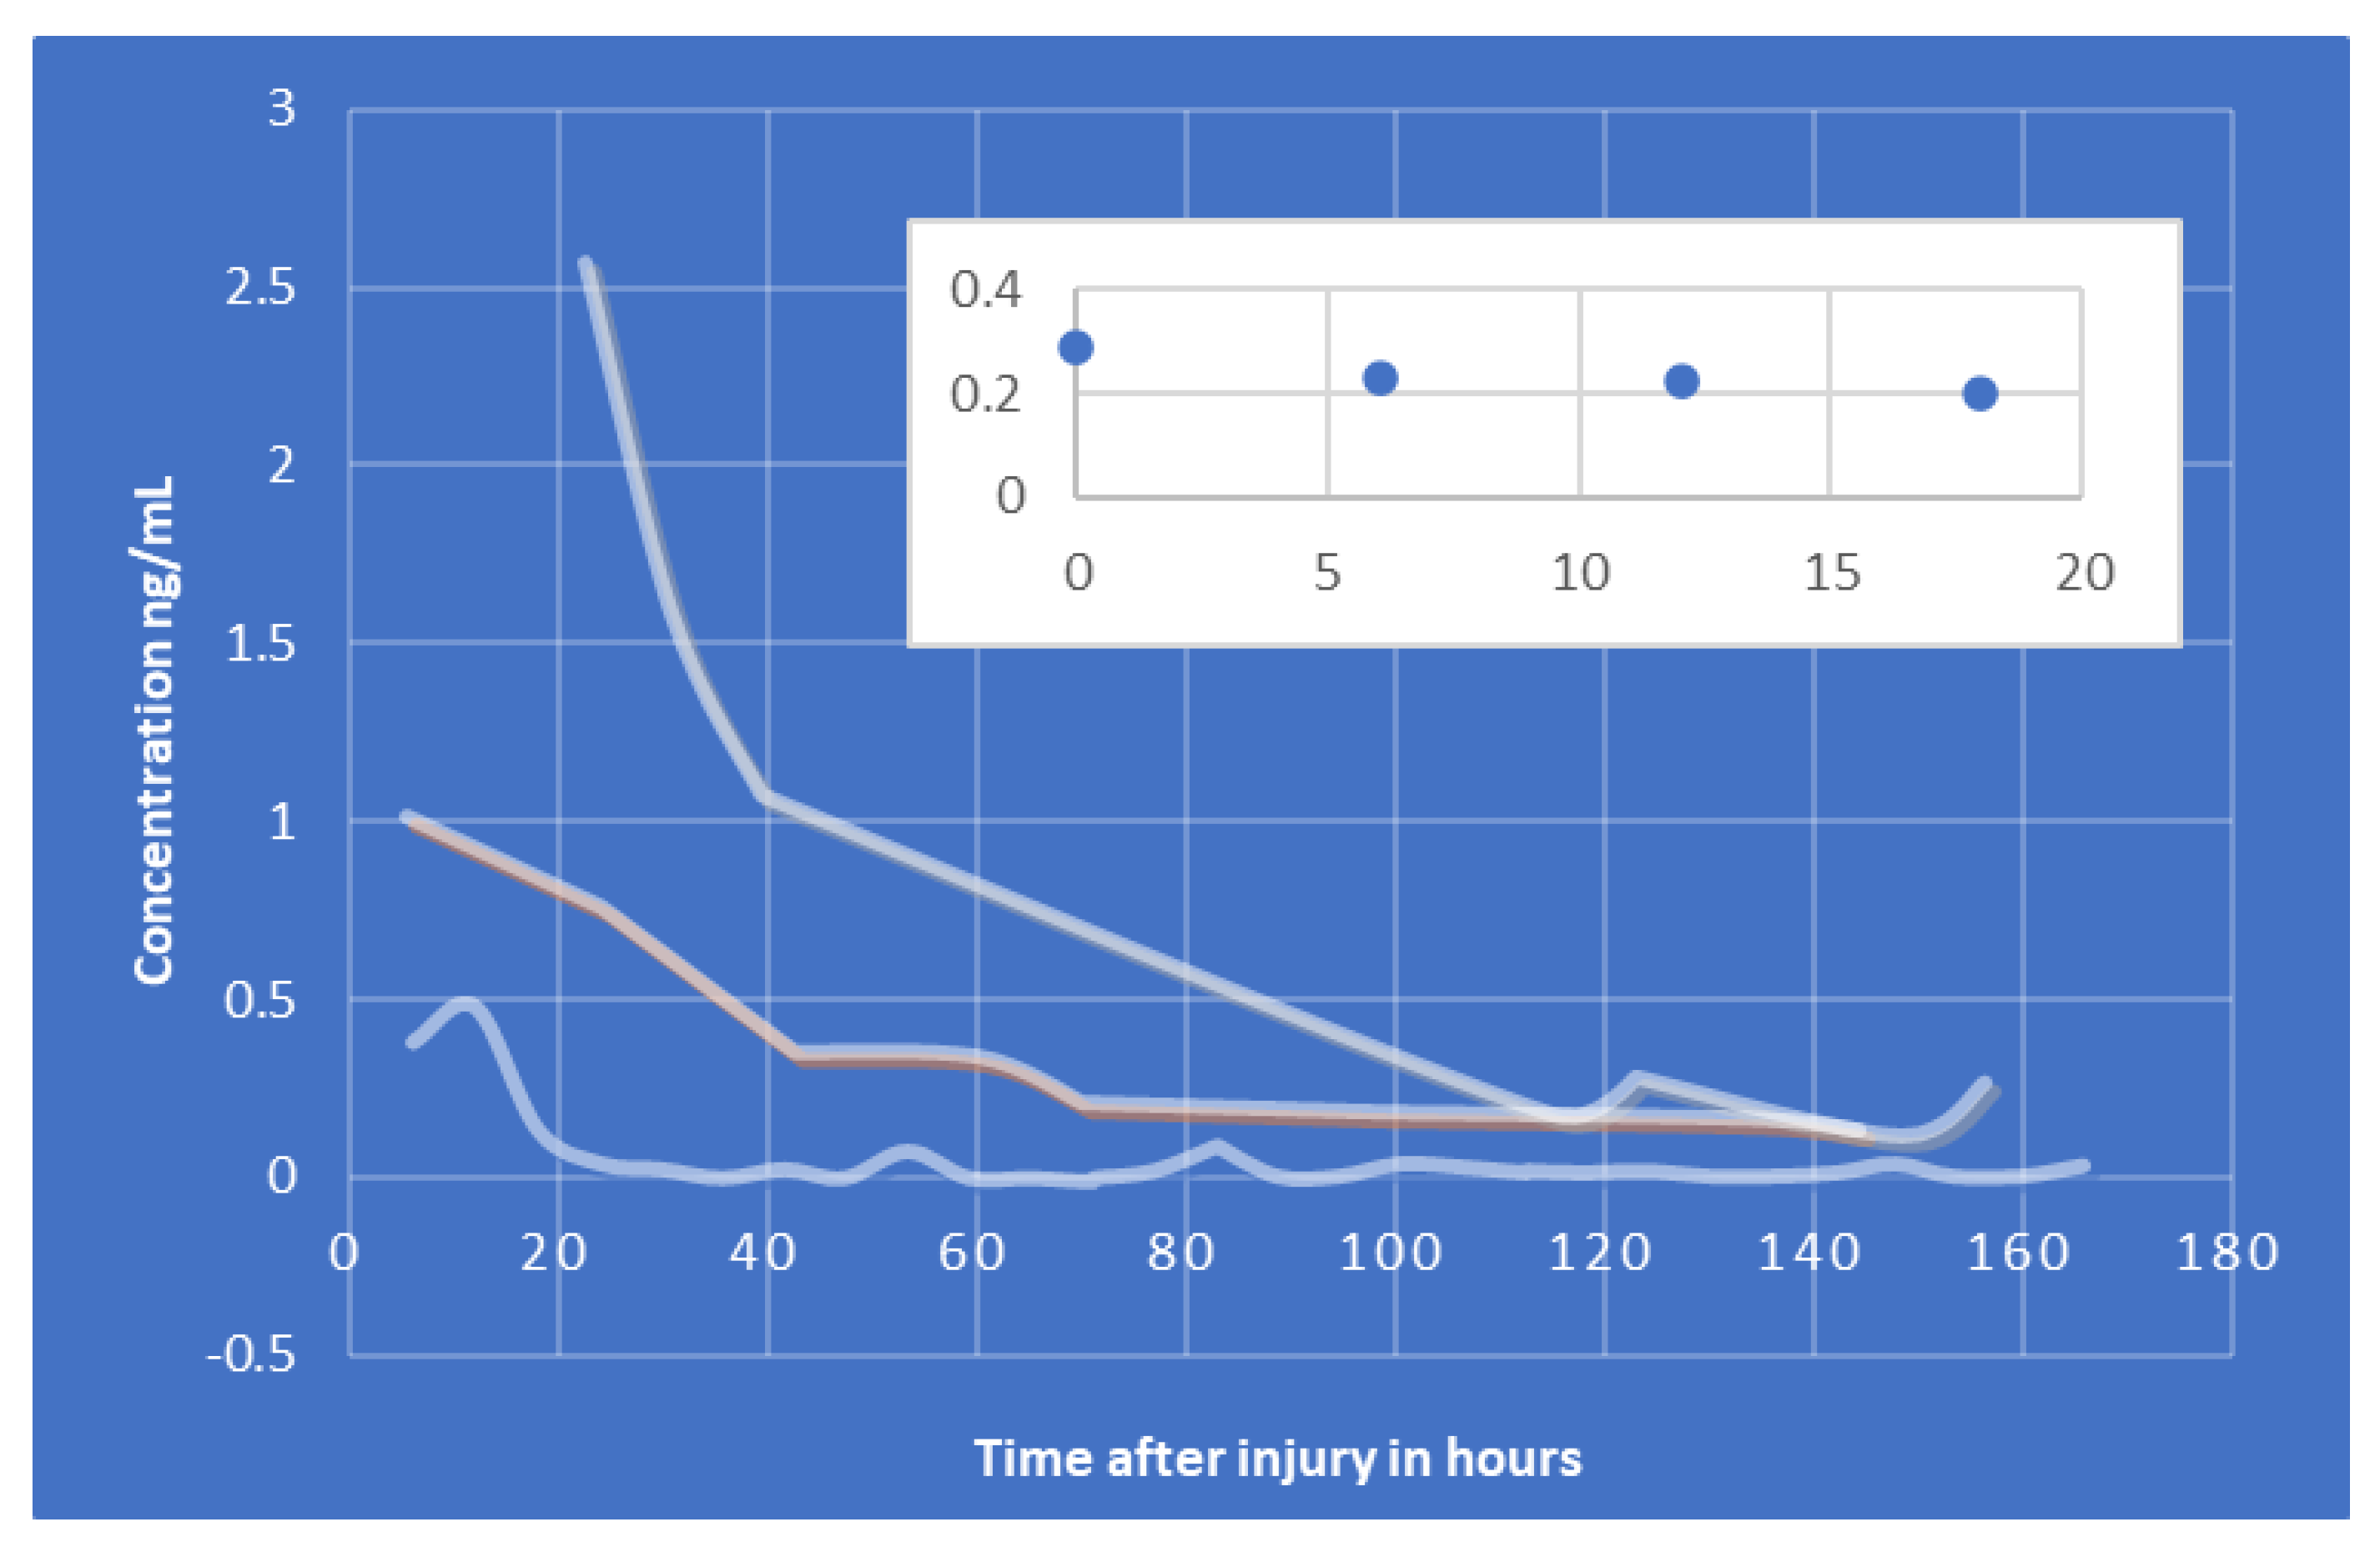
6. Kinetics of Biomarkers in TBI/CTE/PTSD
6.1. Kinetic Parameters of Selected Biomarkers
6.2. Biomarker Kinetics
6.2.1. S100B
6.2.2. GFAP
6.2.3. UCH-L1
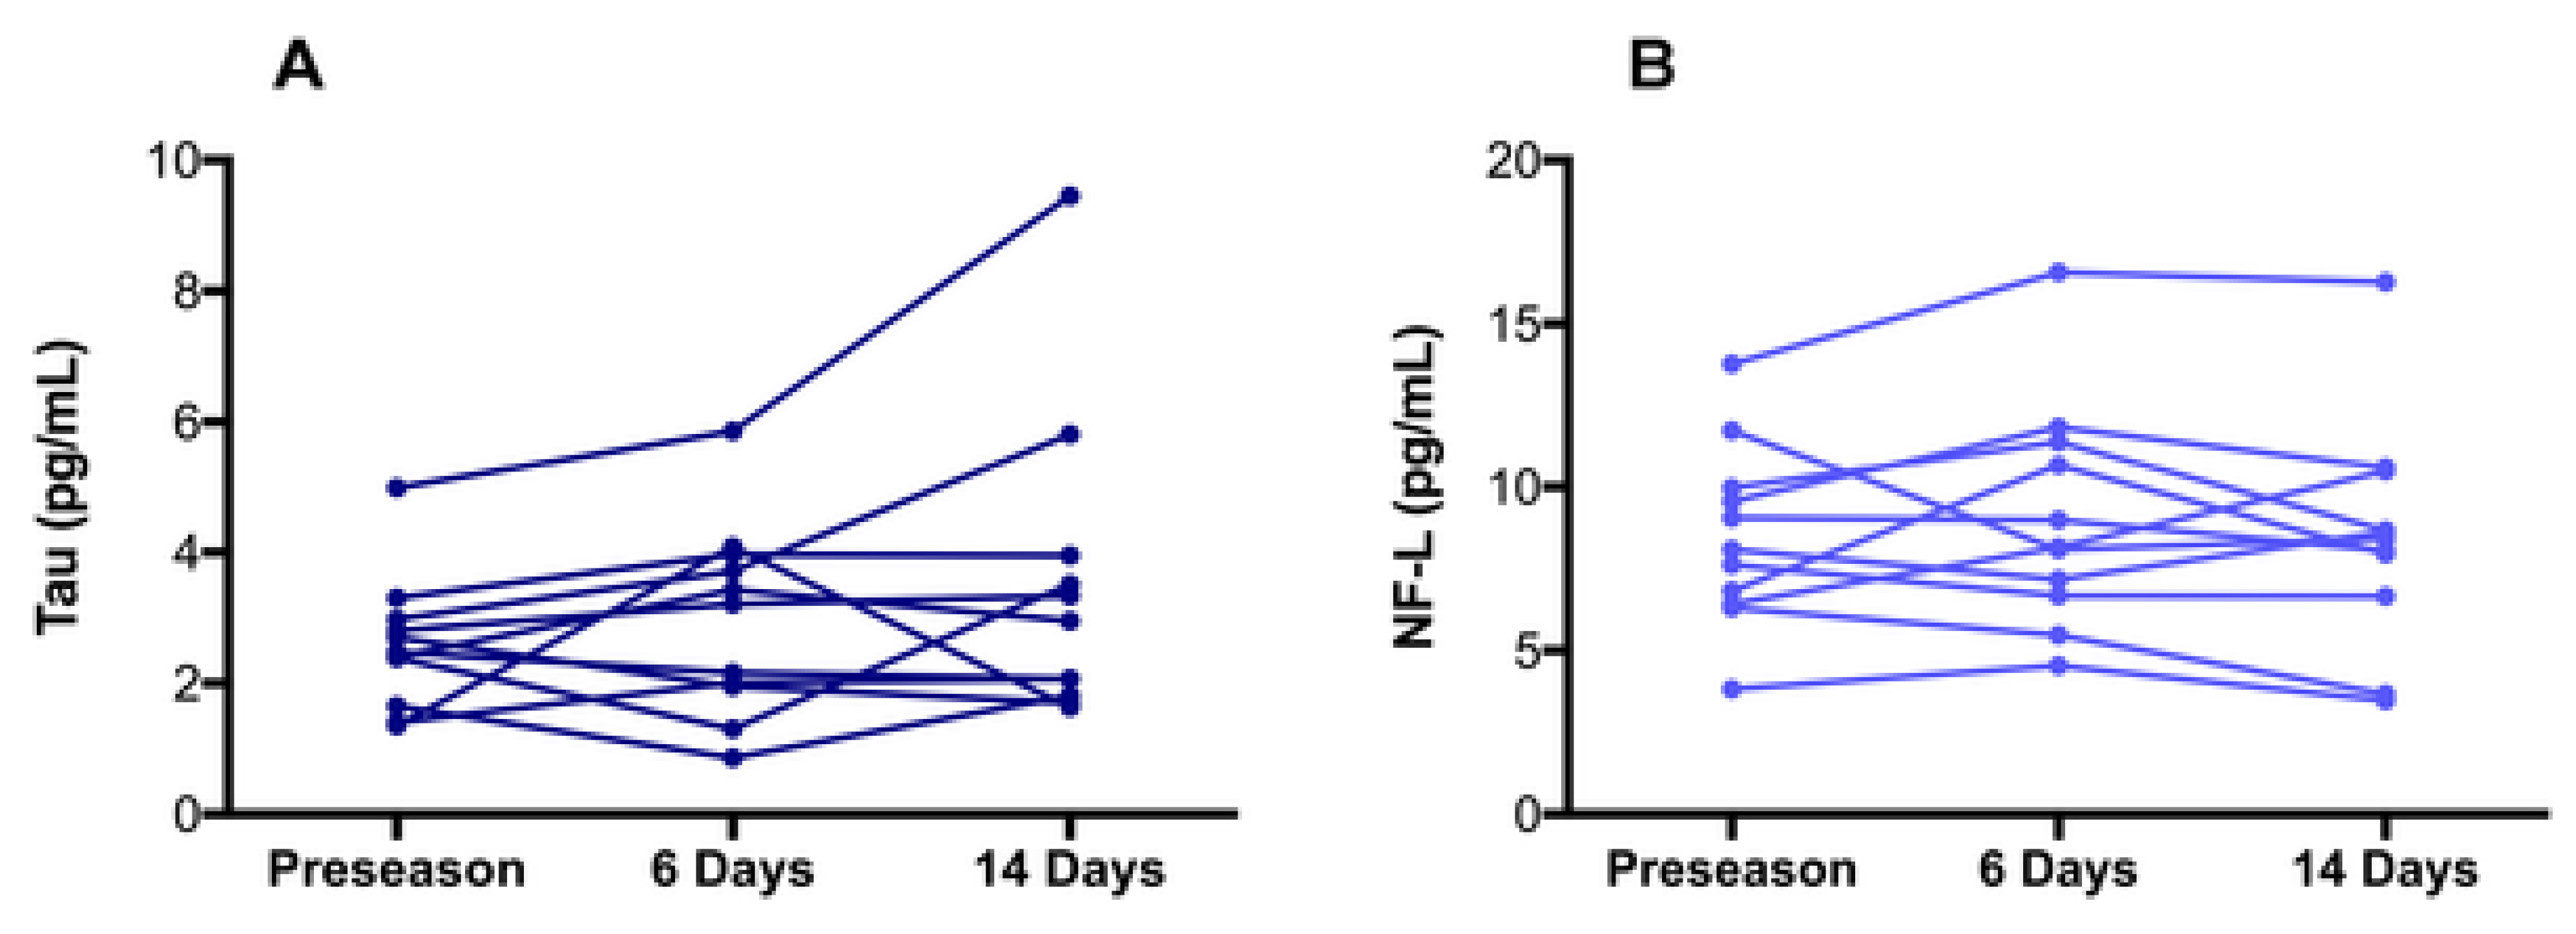
6.2.4. NF-L
6.2.5. Total Tau
7. Conclusions
Author Contributions
Funding
Conflicts of Interest
Appendix A

| Reference | No. of Patients | Inclusion Criteria | Exclusion Criteria | TBI Severity | Time of Injury | Biomarkers |
|---|---|---|---|---|---|---|
| [62] | 109 | Military personnel and veterans | Psychosis; schizophrenia; schizoaffective disorder; bipolar disorder; contraindication to MRI scanning | All | Median 5 years | Serum tau, NFL, and amyloid-beta 40 and 42 |
| [63] | 98 | Military personnel deployed within the previous 18 months | Recent history of drug or alcohol abuse; current severe medical condition requiring long-term treatments; severe psychiatric conditions; severe neurological disorders | All | Most at least 18 months prior to the study | Plasma total tau |
| [68] | 155 | Patient in the ED of an adult level 1 trauma center; between 4 and 100 years old; had suspected head trauma requiring a head CT scan upon admission; available blood samples collected within 32 h of injury | Unidentified time of injury; history of head trauma 6 months prior to study; participating in another clinical study; active psychiatric, neurologic, and/or developmental disorders; admitted to the hospital’s special care unit; prisoners; persons in custody | All | 0–8 h and 12–32 h | Serum GFAP, UCH-L1, and S100B |
| [80] NCT01132898 | 91 | 18 years old or older; speak and write English; diagnosed with non-penetrating TBI; enrolled in study within 1 year of injury | Pregnancy; contraindication to MRI; history of significant psychiatric or neurologic conditions | All | 1 year | Extracellular vesicle GFAP and NFL |
| [81] | 488 | Service members and veterans; history of a TBI one year or more prior to study enrollment | Significant neurologic or psychiatric conditions | All | 1 year or more | Serum total tau, GFAP, NFL, and UCH-L1 |
| [82] | 230 | Subacute and chronic TBI patients; at least 18 years old; clinical diagnosis of nonpenetrating TBI; injury occurring within 1 year of enrollment | Contraindications to MRI; history of major neurologic or psychiatric conditions; pregnancy | All | 30 days to 5 years | Serum NFL, GFAP, UCH-L1, and tau |
| [83] | 343 | Patients with mTBI recruited from the emergency departments of a level 1 trauma center and an out-patient clinic | Not fluent in Norwegian; pre-existing neurological, psychiatric, somatic, or substance use disorder; history of complicated TBI; presence of other major interfering trauma; presentation more than 40 h after injury | mTBI | Acute to 12 months | Plasma NFL, GFAP and tau |
| [84] | 195 | History of Operation Enduring Freedom/Operation Iraqi Freedom/Operation New Dawn deployment; history of combat exposure during any deployment; aged 18 years or older | History of moderate or severe TBI; history of major neurologic or psychiatric disorder | mTBI | Median 6.83–9.53 years | Exosomal and plasma NFL, TNF-alpha, IL-6, IL-10, and VEGF |
| [85] NCT01565551 | 107 | External force trauma to the head; presentation to the ED of a participating trauma center; a clinically indicated brain CT scan within 24 h of injury | Pregnancy; comorbid life-threatening disease; incarceration; on psychiatric hold; non-English speaking | All | Less than 24 h | Plasma GFAP, UCH-L1, NFL, and total tau |
| [86] | 21 | 18 years old or older; diagnosed with nonpenetrating moderate-to-severe TBI | Pregnancy; GCS equal to 3 associated with bilateral fixed and dilated pupils; normal head CT; interfering neurological comorbidities | moderate-severe TBI | up to 5 days | Serum exosomal GFAP, UCH-L1, NFL, and total tau |
| [87] NCT01565551 | 169 | Presented to a participating level 1 trauma center within 24 h of injury; received a head CT scan upon admission to trauma center; 16 years old or older; able to provide informed consent | non-English speaking; pregnant; in custody; undergoing psychiatric evaluation; contraindications to MRI; pre-existing interfering medical or neurological conditions | mTBI | Less than 24 h | Plasma p-tau, total tau, and GFAP |
| [88] | 584 | Adult trauma patients that presented to the ED of a level 1 trauma center within 4 h of injury | younger than 18 years old; no history of trauma as their primary event; had known dementia, chronic psychosis, or active central nervous system pathology; pregnant; incarcerated; had a systolic blood pressure less than 100 mm Hg. | mild moderate TBI | less than 4 h to 180 h | Serum GFAP and UCH-L1 |
| [89] NCT01990768 | 243 | Head trauma patients presenting in the ED of one of 20 trauma centers; blunt or penetrating TBI; moderate-to-severe TBI; prehospital systolic blood pressure greater than 90 mm Hg; prehospital intravenous access; 15 years or older (or weight 50 kg or more if age unknown); estimated time lapse of less than 2 h between injury and hospital arrival | Prehospital GCS of 3 with no reactive pupil; estimated time from injury to start of study of more than 2 h; unknown time of injury; clinical suspicion of seizure activity; acute MI or stroke; known history of confounding medical conditions; CPR by EMS prior to randomization; burns more than 20% TBSA; prisoners; pregnancy; prehospital pro-coagulant drug given prior to randomization; opting out of the study | mod-sev TBI | 0 to 24 h | Serum UCH-L1, GFAP, and MAP-2 |
References
- Vicini, A.; Goswami, T. Simulation of Skull Fracture Due to Falls. Biomed. J. Sci. Tech. Res. 2019, 23, 17469–17473. [Google Scholar]
- Krausz, A.D.; Korley, F.K.; Burns, M.A. The Current State of Traumatic Brain Injury Biomarker Measurement Methods. Biosensors 2021, 11, 319. [Google Scholar] [CrossRef] [PubMed]
- Kulbe, R.J.; Geddes, J.W. Current status of fluid biomarkers in mild traumatic brain injury. Exp. Neurol. 2016, 275, 334–352. [Google Scholar] [CrossRef] [PubMed] [Green Version]
- Cnossen, M.C.; Scholten, A.C.; Lingsma, H.F.; Synnot, A.; Haagsma, J.; Steyerberg, E.W.; Polinder, S. Predictors of Major Depression and Posttraumatic Stress Disorder Following Traumatic Brain Injury: A Systematic Review and Meta-Analysis. J. Neuropsychiatry Clin. Neurosci. 2017, 29, 206–224. [Google Scholar] [CrossRef]
- Papa, L.; Robicsek, S.A.; Brophy, G.M.; Wang, K.K.W.; Hannay, H.J.; Heaton, S.; Schmalfuss, I.; Gabrielli, A.; Hayes, R.L.; Robertson, C.S. Temporal Profile of Microtubule-Associated Protein 2: A Novel Indicator of Diffuse Brain Injury Severity and Early Mortality after Brain Trauma. J. Neurotrauma. 2018, 35, 32–40. [Google Scholar] [CrossRef]
- Shahim, P.; Gren, M.; Liman, V.; Andreasson, U.; Norgren, N.; Tegner, Y.; Mattsson, N.; Andreasen, N.; Öst, M.; Zetterberg, H.; et al. Serum neurofilament light protein predicts clinical outcome in traumatic brain injury. Sci. Rep. 2016, 6, 36791. [Google Scholar]
- Yue, J.K.; Yuh, E.L.; Korley, F.K.; Winkler, E.A.; Sun, X.; Puffer, R.C.; Deng, H.; Choy, W.; Chandra, A.; Taylor, S.R.; et al. Association between plasma GFAP concentrations and MRI abnormalities in patients with CT-negative traumatic brain injury in the track-TBI cohort: A prospective multicentre study. Lancet Neurol. 2019, 18, 953–961. [Google Scholar] [CrossRef]
- Biberthaler, P.; Musaelyan, K.; Krieg, S.; Meyer, B.; Stimmer, H.; Zapf, J.; Matthey, F.V.; Chandran, R.; Marino, J.A.; Beligere, G.; et al. Evaluation of acute glial fibrillary acidic protein and ubiquitin C-terminal hydrolase-L1 plasma levels in traumatic brain injury patients with and without intracranial lesions. Neurotrauma Rep. 2021, 2, 617–625. [Google Scholar] [CrossRef]
- Bogoslovsky, T.; Wilson, D.; Chen, Y.; Hanlon, D.; Gill, J.; Jeromin, A.; Song, L.; Moore, C.; Gong, Y.; Kenney, K.; et al. Increases of plasma levels of glial fibrillary acidic protein, tau, and amyloid β up to 90 days after Traumatic Brain Injury. J. Neurotrauma 2017, 34, 66–73. [Google Scholar] [CrossRef] [Green Version]
- Gill, J.; Mustapic, M.; Diaz-Arrastia, R.; Lange, R.; Gulyani, S.; Diehl, T.; Motamedi, V.; Osier, N.; Stern, R.A.; Kapogiannis, D. Higher exosomal tau, amyloid-beta 42 and IL-10 are associated with mild TBIs and chronic symptoms in military personnel. Brain Inj. 2018, 32, 1277–1284. [Google Scholar] [CrossRef]
- Chen, M.; Soosaipillai, A.; Fraser, D.D.; Diamandis, E.P. Discovery of novel plasma biomarker ratios to discriminate traumatic brain injury. Harv. Dataverse 2019, 8, 1695. [Google Scholar] [CrossRef] [PubMed] [Green Version]
- Ved, R.; Zaben, M. Biomarkers for traumatic brain injury. J. Neurol. 2018, 265, 1241–1243. [Google Scholar] [CrossRef] [PubMed]
- Xu, M.L.; Yue, J.K.; Korley, F.K.; Puccio, A.M.; Yuh, E.L.; Sun, M.X.; Rabinowitz, M.; Vassar, M.M.; Taylor, S.R.; Winkler, E.A.; et al. High sensitivity C-Reactive protein is a prognostic biomarker of six month disability after traumatic brain injury: Results from the TRACK-TBI study. J. Neurotrauma 2021, 38, 918–927. [Google Scholar] [CrossRef] [PubMed]
- Schiavi, P.; Iaccarino, C.; Compagnone, C.; Servadei, F. Blood derived biochemical markers and early clinical trends after severe traumatic brain injury—Utility or futility. World Neurosurg. 2014, 81, 59–61. [Google Scholar] [CrossRef]
- Rodney, T.; Taylor, P.; Dunbar, K.; Perrin, N.; Lai, C.; Roy, M.; Gill, J. High IL-6 in military personnel relates to multiple traumatic brain injuries and post traumatic stress disorder. Behav. Brain Res. 2020, 392, 112715. [Google Scholar] [CrossRef]
- Van Voorhees, E.E.; Dennis, M.F.; Calhoun, P.S.; Beckham, J.C. Association of DHEA, DHEAS, and cortisol with childhood trauma exposure and post-traumatic stress disorder. Int. Clin. Psychopharmacol. 2014, 29, 56–62. [Google Scholar] [CrossRef]
- Cherry, J.D.; Stein, T.D.; Tripodis, Y.; Alvarez, V.E.; Huber, B.R.; Au, R.; Kiernan, P.T.; Daneshvar, D.H.; Mez, J.; Solomon, T.M.; et al. CCL11 is increased in the CNS in chronic traumatic encephalopathy but not in alzheimer’s disease. PLoS ONE 2017, 12, e0185541. [Google Scholar] [CrossRef]
- Waterhouse, A.; Bertoni, M.; Bienert, S.; Studer, G.; Tauriello, G.; Gumienny, R.; Heer, F.T.; de Beer, T.A.P.; Rempfer, C.; Bordoli, L.; et al. SWISS-MODEL: Homology modelling of protein structures and complexes. Nucleic Acids Res. 2018, 46, W296–W303. [Google Scholar] [CrossRef] [Green Version]
- Bienert, S.; Waterhouse, A.; de Beer, T.A.P.; Tauriello, G.; Studer, G.; Bordoli, L.; Schwede, T. The SWISS-MODEL Repository—New features and functionality. Nucleic Acids Res. 2017, 45, D313–D319. [Google Scholar] [CrossRef] [Green Version]
- Guex, N.; Peitsch, M.C.; Schwede, T. Automated comparative protein structure modeling with SWISS-MODEL and Swiss-PdbViewer: A historical perspective. Electrophoresis 2009, 30, S162–S173. [Google Scholar] [CrossRef]
- Studer, G.; Rempfer, C.; Waterhouse, A.M.; Gumienny, G.; Haas, J.; Schwede, T. QMEANDisCo—Distance constraints applied on model quality estimation. Bioinformatics 2020, 36, 1765–1771. [Google Scholar] [CrossRef] [PubMed]
- Bertoni, M.; Kiefer, F.; Biasini, M.; Bordoli, L.; Schwede, T. Modeling protein quaternary structure of homo- and hetero-oligomers beyond binary interactions by homology. Sci. Rep. 2017, 7, 10480. [Google Scholar] [CrossRef] [PubMed]
- Diaz-Arrastia, R.; Wang, K.K.; Papa, L.; Sorani, M.D.; Yue, J.K.; Puccio, A.M.; McMahon, P.J.; Inoue, T.; Yuh, E.L.; Lingsma, H.F.; et al. Acute Biomarkers of Traumatic Brain Injury: Relationship between Plasma Levels of Ubiquitin C-Terminal Hydrolase-L1 and Glial Fibrillary Acidic Protein. J. Neurotrauma 2014, 31, 19–25. [Google Scholar] [CrossRef]
- Available online: https://www.uniprot.org/uniprot/P14136 (accessed on 17 July 2022).
- Mondello, S.; Linnet, A.; Buki, A.; Robicsek, S.; Gabrielli, A.; Tepas, J.; Papa, L.; Brophy, G.M.; Tortella, F.; Hayes, R.L.; et al. Clinical utility of serum levels of Ubiquitin C- terminal hydrolase as a biomarker for severe traumatic brain injury. Neurosurgery 2012, 70, 666–675. [Google Scholar] [CrossRef] [PubMed] [Green Version]
- Available online: https://www.uniprot.org/uniprot/P09936ii (accessed on 17 July 2022).
- Kim, Y.; Jang, Y.; Kim, J.; Kim, N.; Noh, S.; Kim, H.; Queenan, B.N.; Bellmore, R.; Mun, J.Y.; Park, H.; et al. Microtubule-associated protein 2 mediates induction of long-term potentiation in hippocampal neurons. Fed. Am. Soc. Exp. Biol. J. 2020, 34, 6965–6983. [Google Scholar] [CrossRef] [PubMed] [Green Version]
- Available online: https://www.uniprot.org/uniprot/P11137#sequences (accessed on 17 July 2022).
- Yuan, A.; Nixon, R.A. Neurofilament proteins as biomarkers to monitor neurological diseases and the efficacy of therapies. Front. Neurosci. 2021, 15, 1242. [Google Scholar] [CrossRef] [PubMed]
- Available online: https://www.uniprot.org/uniprot/P07196 (accessed on 17 July 2022).
- Feinstein, H.E.; Benbow, S.J.; LaPointe, N.E.; Patel, N.; Ramachandran, S.; Do, T.D.; Gaylord, M.R.; Huskey, N.E.; Dressler, N.; Korff, M.; et al. Oligomerization of the Microtubule Associated Protein Tau is Mediated by its N-Terminal Sequences: Implications for Normal and Pathological Tau Action. J. Neurochem. 2016, 137, 939–954. [Google Scholar] [CrossRef] [Green Version]
- Available online: https://www.ncbi.nlm.nih.gov/protein/NP_058525.1 (accessed on 17 July 2022).
- Rothermundt, M.; Peters, M.; Prehn, J.H.M.; Arolt, V. S100B in brain damage and neurodegeneration. Microsc. Res. Tech. 2003, 60, 614–632. [Google Scholar] [CrossRef]
- Available online: https://www.uniprot.org/uniprotkb/P04271/entry (accessed on 17 July 2022).
- Sturchio, A.; Dwivedi, A.K.; Young, C.B.; Malm, T.; Marsili, L.; Sharma, J.S.; Mahajan, A.; Hill, E.J.; EL Andaloussi, S.; Poston, K.L.; et al. High cerebrospinal amyloid-β 42 is associated with normal cognition in individuals with brain amyloidosis. eClinicalMedicine 2021, 38, 100988. [Google Scholar] [CrossRef]
- Available online: https://www.genscript.com/peptide/RP10017-_Amyloid_1_42_human.html (accessed on 17 July 2022).
- Haque, A.; Polcyn, R.; Matzelle, D.; Banik, N.L. New insights into the role of neuron-specific enolase in neuro-inflammation, neurodegeneration, and neuroprotection. Brain Sci. 2018, 8, 33. [Google Scholar] [CrossRef] [Green Version]
- Available online: https://www.uniprot.org/uniprot/P09104#sequences (accessed on 17 July 2022).
- Wang, Z.; Wang, X.; Zou, H.; Dai, Z.; Feng, S.; Zhang, M.; Xiao, G.; Liu, Z.; Cheng, Q. The basic characteristics of the Pentraxin family and their functions in tumor progression. Front. Immunol. 2020, 11, 1757. [Google Scholar] [CrossRef] [PubMed]
- Available online: https://www.uniprot.org/uniprot/P02741#sequences (accessed on 17 July 2022).
- Sanchis, P.; Fernández-Gayol, O.; Vizueta, J.; Comes, G.; Canal, C.; Escrig, A.; Molinero, A.; Giralt, M.; Hidalgo, J. Microglial cell-derived interleukin-6 influences behavior and inflammatory response in the brain following traumatic brain injury. Glia 2019, 68, 999–1016. [Google Scholar] [CrossRef] [PubMed]
- Available online: https://www.uniprot.org/uniprot/P05231#sequences (accessed on 17 July 2022).
- Available online: http://www.chemspider.com/Chemical-Structure.5551.html (accessed on 17 July 2022).
- Teixeira, A.L.; Gama, C.S.; Rocha, N.P. Revisiting the Role of Eotaxin-1/CCL11 in Psychiatric Disorders. Front. Psychiatry 2018, 9, 241. [Google Scholar] [CrossRef] [PubMed]
- Available online: https://www.uniprot.org/uniprotkb/Q6I9T4/entry (accessed on 17 July 2022).
- Available online: https://www.phosphosite.org/proteinAction.action?id=3398&showAllSites=true (accessed on 17 July 2022).
- Available online: https://www.phosphosite.org/proteinAction.action?id=9333&showAllSites=true (accessed on 17 July 2022).
- Available online: https://www.phosphosite.org/proteinAction.action?id=1132&showAllSites=true (accessed on 17 July 2022).
- Available online: https://www.phosphosite.org/proteinAction.action?id=4709&showAllSites=true (accessed on 17 July 2022).
- Mandelkow, E.-M.; Mandelkow, E. Biochemistry and cell biology of tau protein in neurofibrillary degeneration. Cold Spring Harb. Perspect. Med. 2012, 2, a006247. [Google Scholar] [CrossRef] [PubMed] [Green Version]
- Available online: https://www.phosphosite.org/proteinAction.action?id=1060&showAllSites=true (accessed on 17 July 2022).
- Available online: https://www.phosphosite.org/proteinAction.action?id=13785&showAllSites=true (accessed on 17 July 2022).
- Jiang, D.; Rauda, I.; Han, S.; Chen, S.; Zhao, F. Aggregation Pathways of the Amyloid β(1–42) Peptide Depend on Its Colloidal Stability and Ordered β-Sheet Stacking. Langmuir 2012, 28, 12711–12721. [Google Scholar] [CrossRef] [Green Version]
- Available online: https://www.phosphosite.org/proteinAction.action?id=4116&showAllSites=true (accessed on 17 July 2022).
- Available online: https://www.phosphosite.org/proteinAction.action?id=5126327&showAllSites=true (accessed on 17 July 2022).
- Available online: https://www.phosphosite.org/proteinAction.action?id=18622&showAllSites=true (accessed on 17 July 2022).
- Available online: https://www.phosphosite.org/proteinAction.action?id=3290968&showAllSites=true (accessed on 17 July 2022).
- Yuan, A.; Nixon, R.A. Specialized Roles of Neurofilament Proteins in Synapses: Relevance to Neuropsychiatric Disorders. Brain Res. Bull. 2016, 126, 334–346. [Google Scholar] [CrossRef] [Green Version]
- Kevenaar, J.; Hoogenraad, C. The axonal cytoskeleton: From organization to function. Front. Mol. Neurosci. 2015, 8, 44. [Google Scholar] [CrossRef] [Green Version]
- Yuan, A.; Rao, M.V.; Veeranna; Nixon, R.A. Neurofilaments and Neurofilament Proteins in Health and Disease. Cold Spring Harb. Perspect. Biol. 2017, 9, a018309. [Google Scholar] [CrossRef] [Green Version]
- Sato, C.; Barthélemy, N.R.; Mawuenyega, K.G.; Patterson, B.W.; Gordon, B.A.; Jockel-Balsarotti, J.; Sullivan, M.; Crisp, M.J.; Kasten, T.; Kirmess, K.M.; et al. Tau Kinetics in Neurons and the Human Central Nervous System. Neuron 2018, 97, 1284–1298.e7. [Google Scholar] [CrossRef] [Green Version]
- Pattinson, C.L.; Shahim, P.; Taylor, P.; Dunbar, K.; Guedes, V.A.; Motamedi, V.; Lai, C.; Devoto, C.; Peyer, J.; Roy, M.J.; et al. Elevated Tau in Military Personnel Relates to Chronic Symptoms Following Traumatic Brain Injury. J. Head Trauma Rehabil. 2020, 35, 66–73. [Google Scholar] [CrossRef]
- Olivera, A.; Lejbmanm, N.; Jeromin, A.; French, L.M.; Kim, H.S.; Cashion, A.; Mysliwiec, V.; Diaz-Arrastia, R.; Gill, J. Peripheral Total Tau in Military Personnel Who Sustain Traumatic Brain Injuries During Deployment. JAMA Neurol. 2015, 72, 1109–1116. [Google Scholar] [CrossRef] [PubMed]
- Edwards, G.; Gonzales, I.M.; Soto, C. Amyloid-beta and tau pathology following repetitive mild traumatic brain injury. Biochem. Biophys. Res. Commun. 2017, 483, 1137–1142. [Google Scholar] [CrossRef] [PubMed]
- Krabill, A.D.; Chen, H.; Hussain, S.; Feng, C.; Abdullah, A.; Das, C.; Aryal, U.K.; Post, C.B.; Wendt, M.K.; Galardy, P.J.; et al. Ubiquitin C-terminal hydrolase L1: Biochemical and Cellular Characterization of a Covalent Cyanopyrrolidine-Based Inhibitor. ChemBioChem 2020, 21, 712–722. [Google Scholar] [CrossRef] [PubMed]
- Luo, L. Actin cytoskeleton regulation in neuronal morphogenesis and structural plasticity. Annu. Rev. Cell Dev. Biol. 2002, 18, 601–635. [Google Scholar] [CrossRef] [Green Version]
- Messing, A.; Brenner, M. GFAP at 50. ASN Neuro 2020, 12, 1759091420949680. [Google Scholar] [CrossRef]
- Mahan, M.Y.; Thorpe, M.; Ahmadi, A.; Abdallah, T.; Casey, H.; Sturtevant, D.; Judge-Yoakam, S.; Hoover, C.; Rafter, D.; Miner, J.; et al. Glial Fibrillary Acidic Protein (GFAP) Outperforms S100 Calcium-Binding Protein B (S100B) and Ubiquitin C-Terminal Hydrolase L1 (UCH-L1) as Predictor for Positive Computed Tomography of the Head in Trauma Subjects. World Neurosurg. 2019, 128, e434–e444. [Google Scholar] [CrossRef]
- Czeiter, E.; Mondello, S.; Kovacs, N.; Sandor, J.; Gabrielli, A.; Schmid, K.; Tortella, F.; Wang, K.K.W.; Hayes, R.L.; Barzo, P.; et al. Brain Injury Biomarkers May Improve the Predictive Power of the IMPACT Outcome Calculator. J. Neurotrauma 2012, 29, 1770–1778. [Google Scholar] [CrossRef] [Green Version]
- Pergande, M.R.; Cologna, S. Isoelectric point separations of Peptides and Proteins. Proteomes 2017, 5, 4. [Google Scholar] [CrossRef] [Green Version]
- Ghai, V.; Fallen, S.; Baxter, D.; Scherler, K.; Kim, T.K.; Zhou, Y.; Meabon, J.S.; Logsdon, A.F.; Banks, W.A.; Schindler, A.G.; et al. Alterations in Plasma microRNA and Protein Levels in War Veterans with Chronic Mild Traumatic Brain Injury. J. Neurotrauma 2020, 37, 1418–1430. [Google Scholar] [CrossRef]
- Eierud, C.; Nathan, D.E.; Bonavia, G.H.; Ollinger, J.; Riedy, G. Cortical thinning in military blast compared to non-blast persistent mild traumatic brain injuries. Neuroimage Clin. 2019, 22, 101793. [Google Scholar] [CrossRef]
- Çevik, S.; Özgenç, M.M.; Güneyk, A.; Evran, Ş.; Akkaya, E.; Çalış, F.; Katar, S.; Soyalp, C.; Hanımoğlu, H.; Kaynar, M.Y. NRGN, S100B and GFAP levels are significantly increased in patients with structural lesions resulting from mild traumatic brain injuries. Clin. Neurol. Neurosurg. 2019, 183, 105380. [Google Scholar] [CrossRef] [PubMed]
- Okonkwo, D.O.; Puffer, R.C.; Puccio, A.M.; Yuh, E.L.; Yue, J.K.; Diaz-Arrastia, R.; Korley, F.K.; Wang, K.K.W.; Sun, X.; Taylor, S.R.; et al. Point-of-Care Platform Blood Biomarker Testing of Glial Fibrillary Acidic Protein versus S100 Calcium-Binding Protein B for Prediction of Traumatic Brain Injuries: A Transforming Research and Clinical Knowledge in Traumatic Brain Injury Study. J. Neurotrauma 2020, 37, 2460–2467. [Google Scholar] [CrossRef] [PubMed]
- Fiandaca, M.S.; Mapstone, M.; Mahmoodi, A.; Gross, T.; Macciardi, F.; Cheema, A.K.; Merchant-Borna, K.; Bazarian, J.; Federoff, H.J. Plasma metabolomic biomarkers accurately classify acute mild traumatic brain injury from controls. PLoS ONE 2018, 13, e0195318. [Google Scholar] [CrossRef] [PubMed] [Green Version]
- Meabon, J.S.; Huber, B.R.; Cross, D.J.; Richards, T.L.; Minoshima, S.; Pagulayan, K.F.; Li, G.; Meeker, K.D.; Kraemer, B.C.; Petrie, E.C.; et al. Repetitive blast exposure in mice and combat veterans causes persistent cerebellar dysfunction. Sci. Transl. Med. 2016, 8, 321ra6. [Google Scholar] [CrossRef] [PubMed] [Green Version]
- Alosco, M.L.; Mariani, M.L.; Adler, C.H.; Balcer, L.J.; Bernick, C.; Au, R.; Banks, S.J.; Barr, W.B.; Bouix, S.; Cantu, R.C.; et al. Developing methods to detect and diagnose chronic traumatic encephalopathy during life: Rationale, design, and methodology for the DIAGNOSE CTE Research Project. Alzheimers Res. Ther. 2021, 13, 136. [Google Scholar] [CrossRef]
- Gilmore, C.S.; Marquardt, C.A.; Kang, S.S.; Sponheim, S.R. Reduced P3b brain response during sustained visual attention is associated with remote blast mTBI and current PTSD in U.S. military veterans. Behav. Brain Res. 2018, 340, 174–182. [Google Scholar] [CrossRef]
- Clinical Trials Identifier: NCT04543162. unpublish work.
- Flynn, S.; Leete, J.; Shahim, P.; Pattinson, C.; Guedes, V.A.; Lai, C.; Devoto, C.; Qu, B.X.; Greer, K.; Moore, B.; et al. Extracellular vesicle concentrations of glial fibrillary acidic protein and neurofilament light measured 1 year after Traumatic Brain Injury. Sci. Rep. 2021, 11, 3896. [Google Scholar] [CrossRef]
- Lippa, S.M.; Gill, J.; Brickell, T.A.; French, L.M.; Lange, R.T. Blood biomarkers relate to cognitive performance years after traumatic brain injury in service members and Veterans. J. Int. Neuropsychol. Soc. 2020, 27, 508–514. [Google Scholar] [CrossRef]
- Shahim, P.; Politis, A.; van der Merwe, A.; Moore, B.; Ekanayake, V.; Lippa, S.M.; Chou, Y.Y.; Pham, D.L.; Butman, J.A.; Diaz-Arrastia, R.; et al. Time course and diagnostic utility of NF-L, Tau, GFAP, and Uch-L1 in subacute and chronic TBI. Neurology 2020, 95, e623–e636. [Google Scholar] [CrossRef]
- Clarke, G.J.; Skandsen, T.; Zetterberg, H.; Einarsen, C.E.; Feyling, C.; Follestad, T.; Vik, A.; Blennow, K.; Håberg, A.K. One-year prospective study of plasma biomarkers from CNS in patients with mild traumatic brain injury. Front. Neurol. 2021, 12, 643743. [Google Scholar] [CrossRef]
- Guedes, V.A.; Kenney, K.; Shahim, P.; Qu, B.X.; Lai, C.; Devoto, C.; Walker, W.C.; Nolen, T.; Diaz-Arrastia, R.; Gill, J.M.; et al. Exosomal Neurofilament Light. Neurology 2020, 94, e2412–e2423. [Google Scholar] [CrossRef] [PubMed]
- Korley, F.K.; Yue, J.K.; Wilson, D.H.; Hrusovsky, K.; Diaz-Arrastia, R.; Ferguson, A.R.; Yuh, E.L.; Mukherjee, P.; Wang, K.K.; Valadka, A.B.; et al. Performance evaluation of a multiplex assay for simultaneous detection of four clinically relevant traumatic brain injury biomarkers. J. Neurotrauma 2019, 36, 182–187. [Google Scholar] [CrossRef] [PubMed]
- Mondello, S.; Guedes, V.A.; Lai, C.; Czeiter, E.; Amrein, K.; Kobeissy, F.; Mechref, Y.; Jeromin, A.; Mithani, S.; Martin, C.; et al. Circulating brain injury exosomal proteins following moderate-to-severe traumatic brain injury: Temporal profile, outcome prediction and therapy implications. Cells 2020, 9, 977. [Google Scholar] [CrossRef] [PubMed] [Green Version]
- Gardner, R.C.; Rubenstein, R.; Wang, K.K.W.; Korley, F.K.; Yue, J.K.; Yuh, E.L.; Mukherje, P.; Valadka, A.B.; Okonkwo, D.O.; Diaz-Arrastia, R.; et al. Age-related differences in diagnostic accuracy of plasma glial fibrillary acidic protein and tau for identifying acute intracranial trauma on computed tomography: A track-TBI study. J. Neurotrauma 2018, 35, 2341–2350. [Google Scholar] [CrossRef]
- Papa, L.; Brophy, G.M.; Welch, R.D.; Lewis, L.M.; Braga, C.F.; Tan, C.N.; Ameli, N.J.; Lopez, M.A.; Haeussler, C.A.; Mendez Giordano, D.I.; et al. Time course and diagnostic accuracy of glial and neuronal blood biomarkers GFAP and Uch-L1 in a large cohort of trauma patients with and without mild traumatic brain injury. JAMA Neurol. 2016, 73, 551–560. [Google Scholar] [CrossRef] [Green Version]
- Anderson, T.N.; Hwang, J.; Munar, M.; Papa, L.; Hinson, H.E.; Vaughan, A.; Rowell, S.E. Blood-based biomarkers for prediction of intracranial hemorrhage and outcome in patients with moderate or severe traumatic brain injury. J. Trauma Acute Care Surg. 2020, 89, 80–86. [Google Scholar] [CrossRef]
- Muoio, V.; Persson, P.B.; Sendeski, M.M. The neurovascular unit—Concept review. Acta Physiol. 2014, 210, 790–798. [Google Scholar] [CrossRef] [PubMed]
- Abbott, N.; Rönnbäck, L.; Hansson, E. Astrocyte–endothelial interactions at the blood–brain barrier. Nat. Rev. Neurosci. 2006, 7, 41–53. [Google Scholar] [CrossRef]
- Traumatic Brain Injury. Johns Hopkins Medicine. Available online: https://www.hopkinsmedicine.org/health/conditions-and-diseases/traumatic-brain-injury (accessed on 13 June 2022).
- Schwarzmaier, S.M.; Kim, S.-W.; Trabold, R.; Plesnila, N. Temporal profile of thrombogenesis in the cerebral microcirculation after traumatic brain injury in mice. J. Neurotrauma 2010, 27, 121–130. [Google Scholar] [CrossRef] [PubMed]
- Eeckhout, E.; Kern, M.J. The coronary no-reflow phenomenon: A review of mechanisms and therapies. Eur. Heart J. 2001, 22, 729–739. [Google Scholar] [CrossRef] [PubMed] [Green Version]
- Reffelmann, T.; Kloner, R.A. The “no-reflow” phenomenon: Basic science and clinical correlates. Heart 2002, 87, 162–168. [Google Scholar] [CrossRef] [PubMed] [Green Version]
- Rezkalla, S.H.; Kloner, R.A. No-Reflow Phenomenon. Circulation 2002, 105, 656–662. [Google Scholar] [CrossRef]
- Mertsch, K.; Blasig, I.; Grune, T. 4-Hydroxynonenal impairs the permeability of an in vitro rat blood–brain barrier. Neurosci. Lett. 2001, 314, 135–138. [Google Scholar] [CrossRef]
- Schreibelt, G.; Kooij, G.; Reijerkerk, A.; van Doorn, R.; Gringhuis, S.I.; van der Pol, S.; Weksler, B.B.; Romero, I.A.; Couraud, P.-O.; Piontek, J.; et al. Reactive oxygen species alter brain endothelial tight junction dynamics via RhoA, PI3 kinase, and PKB signaling. FASEB J. 2007, 21, 3666–3676. [Google Scholar] [CrossRef] [PubMed] [Green Version]
- Visse, R.; Nagase, H. Matrix Metalloproteinases and Tissue Inhibitors of Metalloproteinases. Circ. Res. 2003, 92, 827–839. [Google Scholar] [CrossRef] [Green Version]
- Rosenberg, G.A.; Cunningham, L.A.; Wallace, J.; Alexander, S.; Estrada, E.Y.; Grossetete, M.; Razhagi, A.; Miller, K.; Gearing, A. Immunohistochemistry of matrix metalloproteinases in reperfusion injury to rat brain: Activation of MMP-9 linked to stromelysin-1 and microglia in cell cultures. Brain Res. 2001, 893, 104–112. [Google Scholar] [CrossRef]
- Chodobski, A.; Chung, I.; Koźniewska, E.; Ivanenko, T.; Chang, W.; Harrington, J.F.; Duncan, J.A.; Szmydynger-Chodobska, J. Early neutrophilic expression of vascular endothelial growth factor after traumatic brain injury. Neuroscience 2003, 122, 853–867. [Google Scholar] [CrossRef]
- Argaw, A.T.; Gurfein, B.T.; Zhang, Y.; Zameer, A.; John, G.R. VEGF-mediated disruption of endothelial CLN-5 promotes blood-brain barrier breakdown. Proc. Natl. Acad. Sci. USA 2009, 106, 1977–1982. [Google Scholar] [CrossRef] [Green Version]
- Price, L.; Wilson, C.; Grant, G. Blood–Brain Barrier Pathophysiology following Traumatic Brain Injury. In Translational Research in Traumatic Brain Injury; Laskowitz, D., Grant, G., Eds.; CRC Press/Taylor and Francis Group: Boca Raton, FL, USA, 2016; Chapter 4. Available online: https://www.ncbi.nlm.nih.gov/books/NBK326726/ (accessed on 10 June 2022).
- Taheri, S.; Gasparovic, C.; Shah, N.J.; Rosenberg, G.A. Quantitative measurement of blood-brain barrier permeability in human using dynamic contrast-enhanced MRI with fast T1 mapping. Magn. Reson. Med. 2010, 65, 1036–1042. Magn. Reson. Med. 2011, 65, 1508. [Google Scholar] [CrossRef]
- Nag, S.; Venugopalan, R.; Stewart, D.J. Increased caveolin-1 expression precedes decreased expression of occludin and claudin-5 during blood–brain barrier breakdown. Acta Neuropathol. 2007, 114, 459–469. [Google Scholar] [CrossRef]
- Lin, J.L.; Huang, Y.H.; Shen, Y.C.; Huang, H.C.; Liu, P.H. Ascorbic acid prevents blood-brain barrier disruption and sensory deficit caused by sustained compression of primary somatosensory cortex. J. Cereb. Blood Flow Metab. 2010, 30, 1121–1136. [Google Scholar] [CrossRef] [PubMed] [Green Version]
- Gao, W.; Zhang, Z.; Lv, X.; Wu, Q.; Yan, J.; Mao, G.; Xing, W. Neurofilament light chain level in traumatic brain injury: A system review and meta-analysis. Medicine 2020, 99, e22363. [Google Scholar] [CrossRef] [PubMed]
- Glial Fibrillary Acidic Protein-Astrocyte Specific Marker. CUSABIO. 2016. Available online: https://www.cusabio.com/c-20968.html (accessed on 18 May 2022).
- Cabezas, R.; Avila, M.; Gonzalez, J.; El-Bachá, R.S.; Báez, E.; García-Segura, L.M.; Jurado Coronel, J.C.; Capani, F.; Cardona-Gomez, G.P.; Barreto, G.E. Astrocytic modulation of blood brain barrier: Perspectives on Parkinson’s disease. Front. Cell. Neurosci. 2014, 8, 211. [Google Scholar] [CrossRef] [PubMed] [Green Version]
- Griffin, J.M.; Fackelmeier, B.; Fong, D.M.; Mouravlev, A.; Young, D.; O’Carroll, S.J. Astrocyte-selective AAV gene therapy through the endogenous GFAP promoter results in robust transduction in the rat spinal cord following injury. Gene 2019, 26, 198–210. [Google Scholar] [CrossRef]
- Gaetani, L.; Blennow, K.; Calabresi, P.; Di Filippo, M.; Parnetti, L.; Zetterberg, H. Neurofilament light chain as a biomarker in neurological disorders. J. Neurol. Neurosurg. Psychiatry 2019, 90, 870–881. [Google Scholar] [CrossRef]
- Huizinga, R.; van der Star, B.J.; Kipp, M.; Jong, R.; Gerritsen, W.; Clarner, T.; Puentes, F.; Dijkstra, C.D.; van der Valk, P.; Amor, S. Phagocytosis of neuronal debris by microglia is associated with neuronal damage in multiple sclerosis. Glia 2012, 60, 422–431. [Google Scholar] [CrossRef]
- Hellerhoff, I.; King, J.A.; Tam, F.I.; Pauligk, S.; Seidel, M.; Geisler, D.; Bahnsen, K.; Kretschmann, N.; Akgun, K.; Roessner, V.; et al. Differential longitudinal changes of neuronal and glial damage markers in anorexia nervosa after partial weight restoration. Transl. Psychiatry 2021, 11, 86. [Google Scholar] [CrossRef]
- Eisenbaum, M.; Pearson, A.; Gratkowski, A.; Mouzon, B.; Mullan, M.; Crawford, F.; Ojo, J.; Bachmeier, C. Influence of traumatic brain injury on extracellular tau elimination at the blood–brain barrier. Fluids Barriers CNS 2021, 18, 48. [Google Scholar] [CrossRef]
- McGarry, K., Jr.; Boelk, A.N.; Moyer, R.A.; Beske, P.H.; Harvilchuck, J.A.; Platoff, G., Jr.; Yeung, D.T.; Babin, M.C. Changes in Circulating Levels of the Traumatic Brain Injury Biomarkers S100B and UCH-L1 in Soman Exposed Sprague Dawley Rats; Battelle Memorial Institute Columbus United States: Columbus, OH, USA, 2020. [Google Scholar] [CrossRef]
- Donato, R. Functional roles of S100 proteins, calcium-binding proteins of the EF-hand type. Biochim Biophys Acta. 1999, 1450, 191–231. [Google Scholar] [CrossRef] [Green Version]
- Azizi, S.; Hier, D.B.; Allen, B.; Obafemi-Ajayi, T.; Olbricht, G.R.; Thimgan, M.S.; Wunsch, D.C., II. A Kinetic Model for Blood Biomarker Levels After Mild Traumatic Brain Injury. Front. Neurol. 2021, 12, 668606. [Google Scholar] [CrossRef]
- Thelin, E.P.; Zeiler, F.A.; Ercole, A.; Mondello, S.; Büki, A.; Bellander, B.-M.; Helmy, A.; Menon, D.K.; Nelson, D.W. Serial Sampling of Serum Protein Biomarkers for Monitoring Human Traumatic Brain Injury Dynamics: A Systematic Review. Front. Neurol. 2017, 8, 300. [Google Scholar] [CrossRef] [PubMed]
- Hier, D.B.; Obafemi-Ajayi, T.; Thimgan, M.S.; Olbricht, G.R.; Azizi, S.; Allen, B.; Hadi, B.A.; Wunsch, D.C. Blood biomarkers for mild traumatic brain injury: A selective review of unresolved issues. Biomark. Res. 2021, 9, 70. [Google Scholar] [CrossRef]
- Ehrlich, S.; Burghardt, R.; Weiss, D.; Salbach-Andrae, H.; Craciun, E.M.; Goldhahn, K.; Klapp, B.F.; Lehmkuhl, U. Glial and neuronal damage markers in patients with anorexia nervosa. J. Neural. Transm. 2008, 115, 921–927. [Google Scholar] [CrossRef] [PubMed]
- Michaelis, L.; Menten, M.L. Die Kinetik der Invertinwirkung. (Translation: The kinetics of invertase activity). Biochemische Zeitschrift 1913, 49, 333–369. [Google Scholar]
- Kawata, K.; Liu, C.Y.; Merkel, S.F.; Ramirez, S.H.; Tierney, R.T.; Langford, D. Blood biomarkers for brain injury: What are we measuring? Neurosci. Biobehav. Rev. 2016, 68, 460–473. [Google Scholar] [CrossRef] [PubMed] [Green Version]
- Kim, H.J.; Tsao, J.W.; Stanfill, A.G. The current state of biomarkers of mild traumatic brain injury. JCI Insight 2018, 3, e97105. [Google Scholar] [CrossRef] [PubMed]
- Plog, B.A.; Dashnaw, M.L.; Hitomi, E.; Peng, W.; Liao, Y.; Lou, N.; Deane, R.; Nedergaard, M. Biomarkers of traumatic injury are transported from brain to blood via the glymphatic system. J. Neurosci. 2015, 35, 518–526. [Google Scholar] [CrossRef] [Green Version]
- Coleman, M.P.; Ribchester, R.R. Programmed axon death, synaptic dysfunction and the ubiquitin proteasome system. Curr. Drug Targets CNS Neurol. Disord. 2004, 3, 227–238. [Google Scholar] [CrossRef]
- Ghaith, H.S.; Nawar, A.A.; Gabra, M.D.; Abdelrahman, M.E.; Nafady, M.H.; Bahbah, E.I.; Ebada, M.A.; Ashraf, G.M.; Negida, A.; Barreto, G.E. A Literature Review of Traumatic Brain Injury Biomarkers. Mol. Neurobiol. 2022, 59, 4141–4158. [Google Scholar] [CrossRef]
- Welch, R.D.; Ellis, M.; Lewis, L.M.; Ayaz, S.I.; Mika, V.H.; Millis, S.; Papa, L. Modeling the Kinetics of Serum Glial Fibrillary Acidic Protein, Ubiquitin Carboxyl-Terminal Hydrolase-L1, and S100B Concentrations in Patients with Traumatic Brain Injury. J. Neurotrauma 2017, 34, 1957–1971. [Google Scholar] [CrossRef]
- Dash, P.K.; Zhao, J.; Hergenroeder, G.; Moore, A.N. Biomarkers for the diagnosis, prognosis, and evaluation of treatment efficacy for traumatic brain injury. Neurotherapeutics 2010, 7, 100–114. [Google Scholar] [CrossRef] [PubMed] [Green Version]
- Adrian, H.; Mårten, K.; Salla, N.; Lasse, V. Biomarkers of traumatic brain injury: Temporal changes in body fluids. Eneuro 2016, 3, 0294-16.2016. [Google Scholar] [CrossRef] [PubMed]
- Yokobori, S.; Hosein, K.; Burks, S.; Sharma, I.; Gajavelli, S.; Bullock, R. Biomarkers for the clinical differential diagnosis in traumatic brain injury--a systematic review. CNS Neurosci. Ther. 2013, 19, 556–565. [Google Scholar] [CrossRef] [PubMed]
- Hainfellner, J.A.; Voigtländer, T.; Ströbel, T.; Mazal, P.R.; Maddalena, A.S.; Aguzzi, A.; Budka, H. Fibroblasts can express glial fibrillary acidic protein (GFAP) in vivo. J. Neuropathol. Exp. Neurol. 2001, 60, 449–461. [Google Scholar] [CrossRef] [PubMed] [Green Version]
- Posti, J.P.; Hossain, I.; Takala, R.S.; Liedes, H.; Newcombe, V.; Outtrim, J.; Katila, A.J.; Frantzén, J.; Ala-Seppälä, H.; Coles, J.P.; et al. Glial Fibrillary Acidic Protein and Ubiquitin C-Terminal Hydrolase-L1 Are Not Specific Biomarkers for Mild CT-Negative Traumatic Brain Injury. J. Neurotrauma 2017, 34, 1427–1438, epub ahead of print. [Google Scholar] [CrossRef]
- Bishop, P.; Rocca, D.; Henley, J.M. Ubiquitin C-terminal hydrolase L1 (UCH-L1): Structure, distribution and roles in brain function and dysfunction. Biochem. J. 2016, 473, 2453–2462. [Google Scholar] [CrossRef] [Green Version]
- Papa, L.; Zonfrillo, M.R.; Ramirez, J.; Silvestri, S.; Giordano, P.; Braga, C.F.; Tan, C.N.; Ameli, N.J.; Lopez, M.; Mittal, M.K. Performance of Glial Fibrillary Acidic Protein in Detecting Traumatic Intracranial Lesions on Computed Tomography in Children and Youth With Mild Head Trauma. Acad. Emerg. Med. 2015, 22, 1274–1282. [Google Scholar] [CrossRef] [Green Version]
- Barro, C.; Chitnis, T.; Weiner, H.L. Blood neurofilament light: A critical review of its application to neurologic disease. Ann. Clin. Transl. Neurol. 2020, 7, 2508–2523. [Google Scholar] [CrossRef]
- Mehta, T.; Fayyaz, M.; Giler, G.E.; Kaur, H.; Raikwar, S.P.; Kempuraj, D.; Selvakumar, G.P.; Ahmed, M.E.; Thangavel, R.; Zaheer, S.; et al. Current Trends in Biomarkers for Traumatic Brain Injury. Open Access J. Neurol. Neurosurg. 2020, 12, 86–94. [Google Scholar]
- Mondello, S.; Gabrielli, A.; Catani, S.; D’Ippolito, M.; Jeromin, A.; Ciaramella, A.; Bossù, P.; Schmid, K.; Tortella, F.; Wang, K.K.; et al. Increased levels of serum MAP-2 at 6-months correlate with improved outcome in survivors of severe traumatic brain injury. Brain Inj. 2012, 26, 1629–1635. [Google Scholar] [CrossRef]
- Goyal, A.; Failla, M.D.; Niyonkuru, C.; Amin, K.; Fabio, A.; Berger, R.P.; Wagner, A.K. S100b as a prognostic biomarker in outcome prediction for patients with severe traumatic brain injury. J. Neurotrauma 2013, 30, 946–957. [Google Scholar] [CrossRef] [PubMed] [Green Version]
- Kleindienst, A.; Schmidt, C.; Parsch, H.; Emtmann, I.; Xu, Y.; Buchfelder, M. The passage of S100B from brain to blood is not specifically related to the blood-brain barrier integrity. Cardiovasc. Psychiatr. Neurol. 2010, 2010, 801295. [Google Scholar] [CrossRef] [PubMed]
- Di Battista, A.P.; Buonora, J.E.; Rhind, S.G.; Hutchison, M.G.; Baker, A.J.; Rizoli, S.B.; Diaz-Arrastia, R.; Mueller, G.P. Blood biomarkers in moderate-to-severe traumatic brain injury: Potential utility of a multi-marker approach in characterizing outcome. Front. Neurol. 2015, 6, 110. [Google Scholar] [CrossRef] [PubMed]
- Siman, R.; Toraskar, N.; Dang, A.; McNeil, E.; McGarvey, M.; Plaum, J.; Maloney, E.; Grady, M.S. A panel of neuron-enriched proteins as markers for traumatic brain injury in humans. J Neurotrauma 2009, 26, 1867–1877. [Google Scholar] [CrossRef]
- Brophy, G.M.; Mondello, S.; Papa, L.; Robicsek, S.A.; Gabrielli, A.; Tepas, J.; Buki, A.; Robertson, C.; Tortella, F.C.; Hayes, R.L.; et al. Biokinetic analysis of ubiquitin C-terminal hydrolase-L1 (UCH-L1) in severe traumatic brain injury patient biofluids. J. Neurotrauma 2011, 28, 861–870. [Google Scholar] [CrossRef] [Green Version]
- Kou, Z.; Gattu, R.; Kobeissy, F.; Welch, R.D.; O’Neil, B.J.; Woodard, J.L.; Ayaz, S.I.; Kulek, A.; Kas-Shamoun, R.; Mika, V.; et al. Combining biochemical and imaging markers to improve diagnosis and characterization of mild traumatic brain injury in the acute setting: Results from a pilot study. PLoS ONE 2013, 8, e80296. [Google Scholar]
- Wallace, C.; Zetterberg, H.; Blennow, K.; van Donkelaar, P. No change in plasma tau and serum neurofilament light concentrations in adolescent athletes following sport-related concussion. PLoS ONE 2015, 13, e0206466. [Google Scholar] [CrossRef] [Green Version]
- Breit, M.; Netzer, M.; Weinberger, K.M.; Baumgartner, C. Modeling and Classification of Kinetic Patterns of Dynamic Metabolic Biomarkers in Physical Activity. PLoS Comput. Biol. 2018, 11, e1004454. [Google Scholar] [CrossRef] [Green Version]
- Kendall IVicini, A.; Goswami, T. Rheological model for force transmission through the helmet and concussion sensitivity. Int. J. Neurorehabilit. 2014, 13, 1. Available online: http://omicsgroup.org/journals/rheological-model-of-force-transmission-through-2376-0281-1000132.pdf (accessed on 18 July 2022).
- Vicini, A.; Goswami, T. Sensitivity analysis of skull fracture. Biomater. Biomech. Bioeng. 2015, 3, 47–57. [Google Scholar] [CrossRef] [Green Version]
- Blackmore, M.E.; Goswami, T.; Chancey, C. Cervical Spinal Injuries and Risk Assessment, Injury and Skeletal Biomechanics; InTech Publisher: London, UK, 2012; ISBN 979-953-307-1000-7. [Google Scholar]
- Patel, A.; Goswami, T. Comparison of Intracranial Pressure by Lateral and Frontal Impacts—Validation of Computational Model; InTech Publisher: London, UK, 2012; ISBN 979-953-307-1000-7. [Google Scholar]
- Hamandi, F.; Whitney, A.; Stouffer, M.; Prayson, M.; Goswami, T. Cyclic Damage Accumulation in the Femoral Constructs Made with Cephalomedullary Nails. Front. Bioeng. Biotechnol. Sect.-Biomech. 2020, 8, 593609. [Google Scholar] [CrossRef] [PubMed]
- Ingawale, S.; Johnson, M.; Goswami, T. A biomechanical evaluation of the mandible under cyclic compressive loads. Ital. J. Maxillofac. Surg. 2014, 25, 55–63. [Google Scholar]
- Available online: https://www.fda.gov/news-events/press-announcements/fda-authorizes-marketing-first-blood-test-aid-evaluation-concussion-adults (accessed on 1 October 2022).
- Mondello, S.; Kobeissy, F.; Vestri, A.; Hayes, R.L.; Kochanek, P.M.; Berger, R.P. Serum Concentrations of Ubiquitin C-Terminal Hydrolase-L1 and Glial Fibrillary Acidic Protein after Pediatric Traumatic Brain Injury. Sci. Rep. 2016, 6, 28203. [Google Scholar] [CrossRef] [PubMed]
- Honda, M.; Tsuruta, R.; Kaneko, T.; Kasaoka, S.; Yagi, T.; Todani, M.; Fujita, M.; Izumi, T.; Maekawa, T. Serum glial fibrillary acidic protein is a highly specific biomarker for traumatic brain injury in humans compared with S-100B and neuron-specific enolase. J. Trauma 2010, 69, 104–109. [Google Scholar] [CrossRef] [PubMed]
- Wang, K.K.W.; Kobeissy, F.H.; Shakkour, Z.; Tyndall, J.A. Thorough overview of ubiquitin C-terminal hydrolase-L1 and glial fibrillary acidic protein as tandem biomarkers recently cleared by US Food and Drug Administration for the evaluation of intracranial injuries among patients with traumatic brain injury. Acute Med. Surg. 2021, 8, e622. [Google Scholar] [CrossRef] [PubMed]
- Available online: https://www.accessdata.fda.gov/cdrh_docs/reviews/DEN170045.pdf (accessed on 1 August 2022).


| Biomarker | Condition | Findings |
|---|---|---|
| GFAP | TBI | Excellent indicator of TBI as well as abnormal CT or MRI findings [7,8]. |
| UCH-L1 | TBI | Very good early predictor of TBI and abnormal CT findings, [8]. |
| MAP-2 | TBI | Early levels have limited predictive ability of abnormal CT results but good predictive ability of early mortality[5] |
| NF-L | TBI | Good indicator of TBI and abnormal CT findings [6]. |
| Total tau | TBI | Decent indicator of abnormal CT findings [9]. |
| S100B | TBI | Not specific to TBI and not indicative of abnormal CT [8]. |
| Aβ42 | TBI | Decent indicator of mTBI but not correlated with post-concussive or behavioral symptoms [10]. |
| NSE | TBI | Good indicator of TBI but not directly correlated with TBI severity [11,12]. |
| CRP | TBI | Non-specific to TBI, but good predictor of 6-month neurological outcome after TBI [13,14] |
| IL-6 | TBI and PTSD | Correlated with number of previous TBIs and with PTSD symptoms in people with repetitive TBIs[15] |
| Cortisol | PTSD | Levels, not correlated with either TBI/PTSD/CTE, significantly correlated with a history of trauma[16] |
| CCL11 | CTE | Limited evidence of strong differentiation between CTE subjects and non-CTE subjects, but not associated with CTE severity [17]. |
| Biomarker | Weight (kDa) | Amino Acid Length | Basal Isoelectric Point |
|---|---|---|---|
| GFAP [24,46] | 49.88 | 432 | 5.42 |
| UCH-L1 [26,47] | 24.824 | 223 | 5.33 |
| MAP-2 [28,48] | 199.526 | 1827 | 4.82 |
| NF-L [30,49] | 61.517 | 310 | 4.64 |
| Total tau [50,51] | 36.7–49.5 | 352–441 | ~6.3 |
| S100B [34,52] | 10.713 | 92 | 4.5 |
| Ab42 [36,53] | 4.514 | 42 | 5.5 |
| NSE [38,54] | 47.269 | 434 | 4.91 |
| CRP [40,55] | 25.039 | 224 | 5.45 |
| IL-6 [42,56] | 23.718 | 212 | 6.17 |
| Cortisol [43] | 0.362 | N/A | -- |
| CCL11 [45,57] | 10.732 | 97 | 9.98 |
| Biomarkers | Condition | Findings |
|---|---|---|
| miRNA (plasma) | TBI | There was a significant elevation of miRNAs in the TBI study population. Three miRNAs may be particularly useful in identifying chronic TBIs [71]. |
| miRNA (EV) | TBI | Potential indicator of chronic blast-related TBI, dozens of miRNA identified but needs further investigation [71]. |
| CRP (plasma) | TBI | Indicator for TBI, shown through iTRAQ and validated with ELISA [71]. |
| MME (plasma) | TBI | Potential indicator for chronic mTBI, strong indicator in long-term TBI patients. |
| Cortical thinning (imaging) | TBI | Strong indicator to differentiate between blast-related TBI and non-blast-related TBI. However, this is still a neuroimaging biomarker [72]. |
| NRGN (blood) | TBI | Potential indicator of mTBI in pediatric patients [73]. |
| S100B (blood) | TBI | Limited diagnostic use for mTBI patients due lack of specificity; increased levels in multiple extracranial pathologies [73,74]. Serum concentration in blood samples drawn less than 3 h after trauma is an accurate predictor of a normal CT scan for mTBI patients [79] |
| GFAP (blood) | TBI | Not specific enough as a diagnostic indicator due to high levels in multiple types of brain injuries [73] Greater indicator than S100B, especially for injuries with delayed treatment such as military personnel in combat situations [72] Additional trial in progress [79] |
| Metabolic Panel ((FA 2-OH C16:0, FA C18:0, TUDCA, PE ae C36:4, PE aa C38:6, and LysoPC a C20:4) | TBI | Potentially strong indicator of mTBI for recent injuries up to 7 days post injury [75] |
| FDG on PET (imaging) | TBI | Indicator of neuronal activity; number of blast exposure correlates with FDG uptake in veterans [76] |
| P-tau on PET(imaging) | CTE | Neuropathological evidence correlating p-tau in an irregular pattern to ante-mortem cognitive and neuropsychiatric symptoms of CTE [77] |
| P3b ERP (neurologic testing) | TBI + PTSD | Diminished P3b amplitude during DS-CPT is a strong potential indicator of blast-related mTBI and/or PTSD after combat trauma, but is unable to differentiate between mTBI and PTSD [78] |
| Electrostatic | Bond | Kinetic | Potential | Total | ||
|---|---|---|---|---|---|---|
| Aβ42 | Time (ps) | 2.7 | 4 | 2.9 | 1.9 | 2.8 |
| Avg. Value (kcal/mol) | −32,784.33 | 3480.92 | 7455.66 | −23,434.85 | −15,997.53 | |
| CRP | Time (ps) | 2.2 | 3.2 | 3 | 2.4 | 2.6 |
| Avg. Value (kcal/mol) | −1,019,308.27 | 109,340.86 | 232,063.93 | −723,307.82 | −491,584.45 | |
| GFAP | Time (ps) | 1 | 3.3 | 3.1 | 2.8 | 2.9 |
| Avg. Value (kcal/mol) | −823,609.83 | 82,245.14 | 173,754.06 | −605,439.31 | −431,757.93 | |
| IL-6 | Time (ps) | 2.9 | 3.8 | 3.6 | 2.1 | 3.3 |
| Avg. Value (kcal/mol) | −64,264.60 | 6949.12 | 14,990.33 | −45,343.51 | −30,407.70 | |
| NSE | Time (ps) | 2.9 | 3.7 | 3.2 | 1.9 | 2.5 |
| Avg. Value (kcal/mol) | −241,850.97 | 26,823.98 | 57,205.73 | −168,420.32 | −111,428.98 | |
| PHF Tau | Time (ps) | 3.2 | 3.8 | 2.7 | 1.9 | 2.1 |
| Avg. Value (kcal/mol) | −213,881.08 | 24,239.10 | 51,936.30 | −146,812.80 | −95,005.53 | |
| S100B | Time (ps) | 4 | 3.5 | 2 | 0.7 | 1.4 |
| Avg. Value (kcal/mol) | −65,958.61 | 6900.85 | 14,928.18 | −46,223.02 | −31,437.77 | |
| SF Tau | Time (ps) | 1.6 | 3.4 | 2.7 | 2.6 | 2.6 |
| Avg. Value (kcal/mol) | −209,627.89 | 23,856.03 | 51,337.40 | −144,155.15 | −92,829.63 | |
| UCH-L1 | Time (ps) | 1.8 | 3.2 | 2.9 | 2.4 | 2.7 |
| Avg. Value (kcal/mol) | −175,430.48 | 18,957.84 | 40,291.56 | −123,831.34 | −83,573.74 |
| Biomarker. | Detectable | Peak | Longevity | Half-Life | Order | References |
|---|---|---|---|---|---|---|
| S100B | 1st: ~6 h 2nd: ~48 h | Gradual decline over first 48 h, 2nd peak then subsequent decline ~96 h | ~2–6 h mTbI ~24 h severe TBI | First-order, exponential decay * | [122] | |
| GFAP | <1 h | ~20 h | ~168 h (7 days) | 24–48 h | [122] | |
| UCH-L1 | <1 h | ~6–8 h | Gradual decrease over 48 h | 7–10 h | [122,125,126,127] | |
| NF-L | ~6 h ** | Continuous increase for up to 10 days *** | [128] | |||
| Total Tau | <1 h | <1 h | Steady decline over 12 h, levels detectable up to 18 months | ~36 h | [122] | |
| MAP-2 | ~6 h | N/A | Stable for 24 h | [129,130] | ||
| CCL-II | ~24 h |
| Biomarker | Origin | Extra Cerebral Source | Sample Source | Indication | Comments | References |
|---|---|---|---|---|---|---|
| S100B | Astrocytes | Adipocytes, chondrocytes, cardiac and skeletal muscle, melanoma | CSF, blood serum | mTBI, BBB disruption | Not specific enough to TBI | [118,122,126] |
| GFAP | Astrocytes Fibroblasts | N/A | CSF, serum | Increased with intracranial pressure, | [122,131,132] | |
| UCH-L1 | Neurons | Lung tumors, testis/ovaries | CSF | Breakdown of BBB, serum levels correlated to severity of injury and mortality | Potential for prognostic and diagnostic use | [122,126,129,133] |
| NF-L | Neurons (axon) | N/A | CSF, blood serum | Neural death, axon disintegration, severe TBI | Potential long-term indicator; age, diabetes, BMI, and pregnancy noted to alter levels of NF-L | [126,134,135] |
| Total Tau | Neurons (axon), Astrocytes | N/A | CSF, blood serum | Severity of injury and mortality | CSF appears to be more accurate than blood serum | [122,126,134,136] |
| MAP-2 | Dendrites | Dendritic injury | Severe TBI patients had high levels present after 6 months | [130,137] | ||
| CCL-II |
| Biomarker | Homology Figures | MD Simulations Figures | Metabolic pathway BBB | Bond Energy kcal/mol | No. of H Bonds | Length of Amino Acid |
|---|---|---|---|---|---|---|
| S100B | 1.6 | 16, 26 | - | 6900 | 167 | 92 |
| GFAP | 1.1 | 18, 28 | 4.2.1 | 82,245 | 873 | 432 |
| UCHL1 | 1.2 | 19, 29 | 4.2.4 | 18,957 | 336 | 223 |
| NF-L | 1.4 | - | 4.2.2 | - | ||
| Tau | 1.5 | 20, 30 | 4.2.3 | 23,856–24,239 | 456–462 | 397 |
Publisher’s Note: MDPI stays neutral with regard to jurisdictional claims in published maps and institutional affiliations. |
© 2022 by the authors. Licensee MDPI, Basel, Switzerland. This article is an open access article distributed under the terms and conditions of the Creative Commons Attribution (CC BY) license (https://creativecommons.org/licenses/by/4.0/).
Share and Cite
Hicks, C.; Dhiman, A.; Barrymore, C.; Goswami, T. Traumatic Brain Injury Biomarkers, Simulations and Kinetics. Bioengineering 2022, 9, 612. https://doi.org/10.3390/bioengineering9110612
Hicks C, Dhiman A, Barrymore C, Goswami T. Traumatic Brain Injury Biomarkers, Simulations and Kinetics. Bioengineering. 2022; 9(11):612. https://doi.org/10.3390/bioengineering9110612
Chicago/Turabian StyleHicks, Celeste, Akshima Dhiman, Chauntel Barrymore, and Tarun Goswami. 2022. "Traumatic Brain Injury Biomarkers, Simulations and Kinetics" Bioengineering 9, no. 11: 612. https://doi.org/10.3390/bioengineering9110612