


Proteo-Molecular Investigation of Cultivated Rice, Wild Rice, and Barley Provides Clues of Defense Responses against Rhizoctonia solani Infection

 ,
,  , ,
, ,
Abstract
: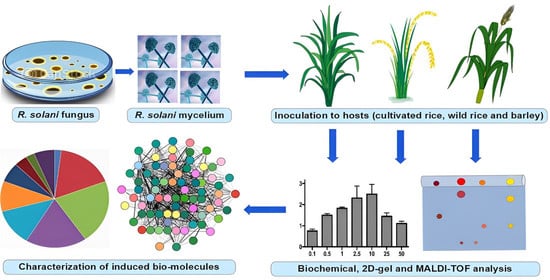
1. Introduction
2. Materials and Methods
2.1. R. solani Isolate, Plant Materials and Inoculation Procedure
2.2. Estimation of Total Phenol Content, Peroxidase (PO) and β-1, 3-Glucanase
2.3. Protein Extraction for 2D Analysis
2.4. Isoelectric Focusing (IEF) and Polyacrylamide Gel Electrophoresis (PAGE)
2.5. Image Acquisition, Spot Digestion and Identification
2.6. Protein Analysis and Chromosome Localization of Differentially Expressed Protein
2.7. Co-Expression Network and Gene Ontology Analysis
2.8. Data Analysis
3. Results
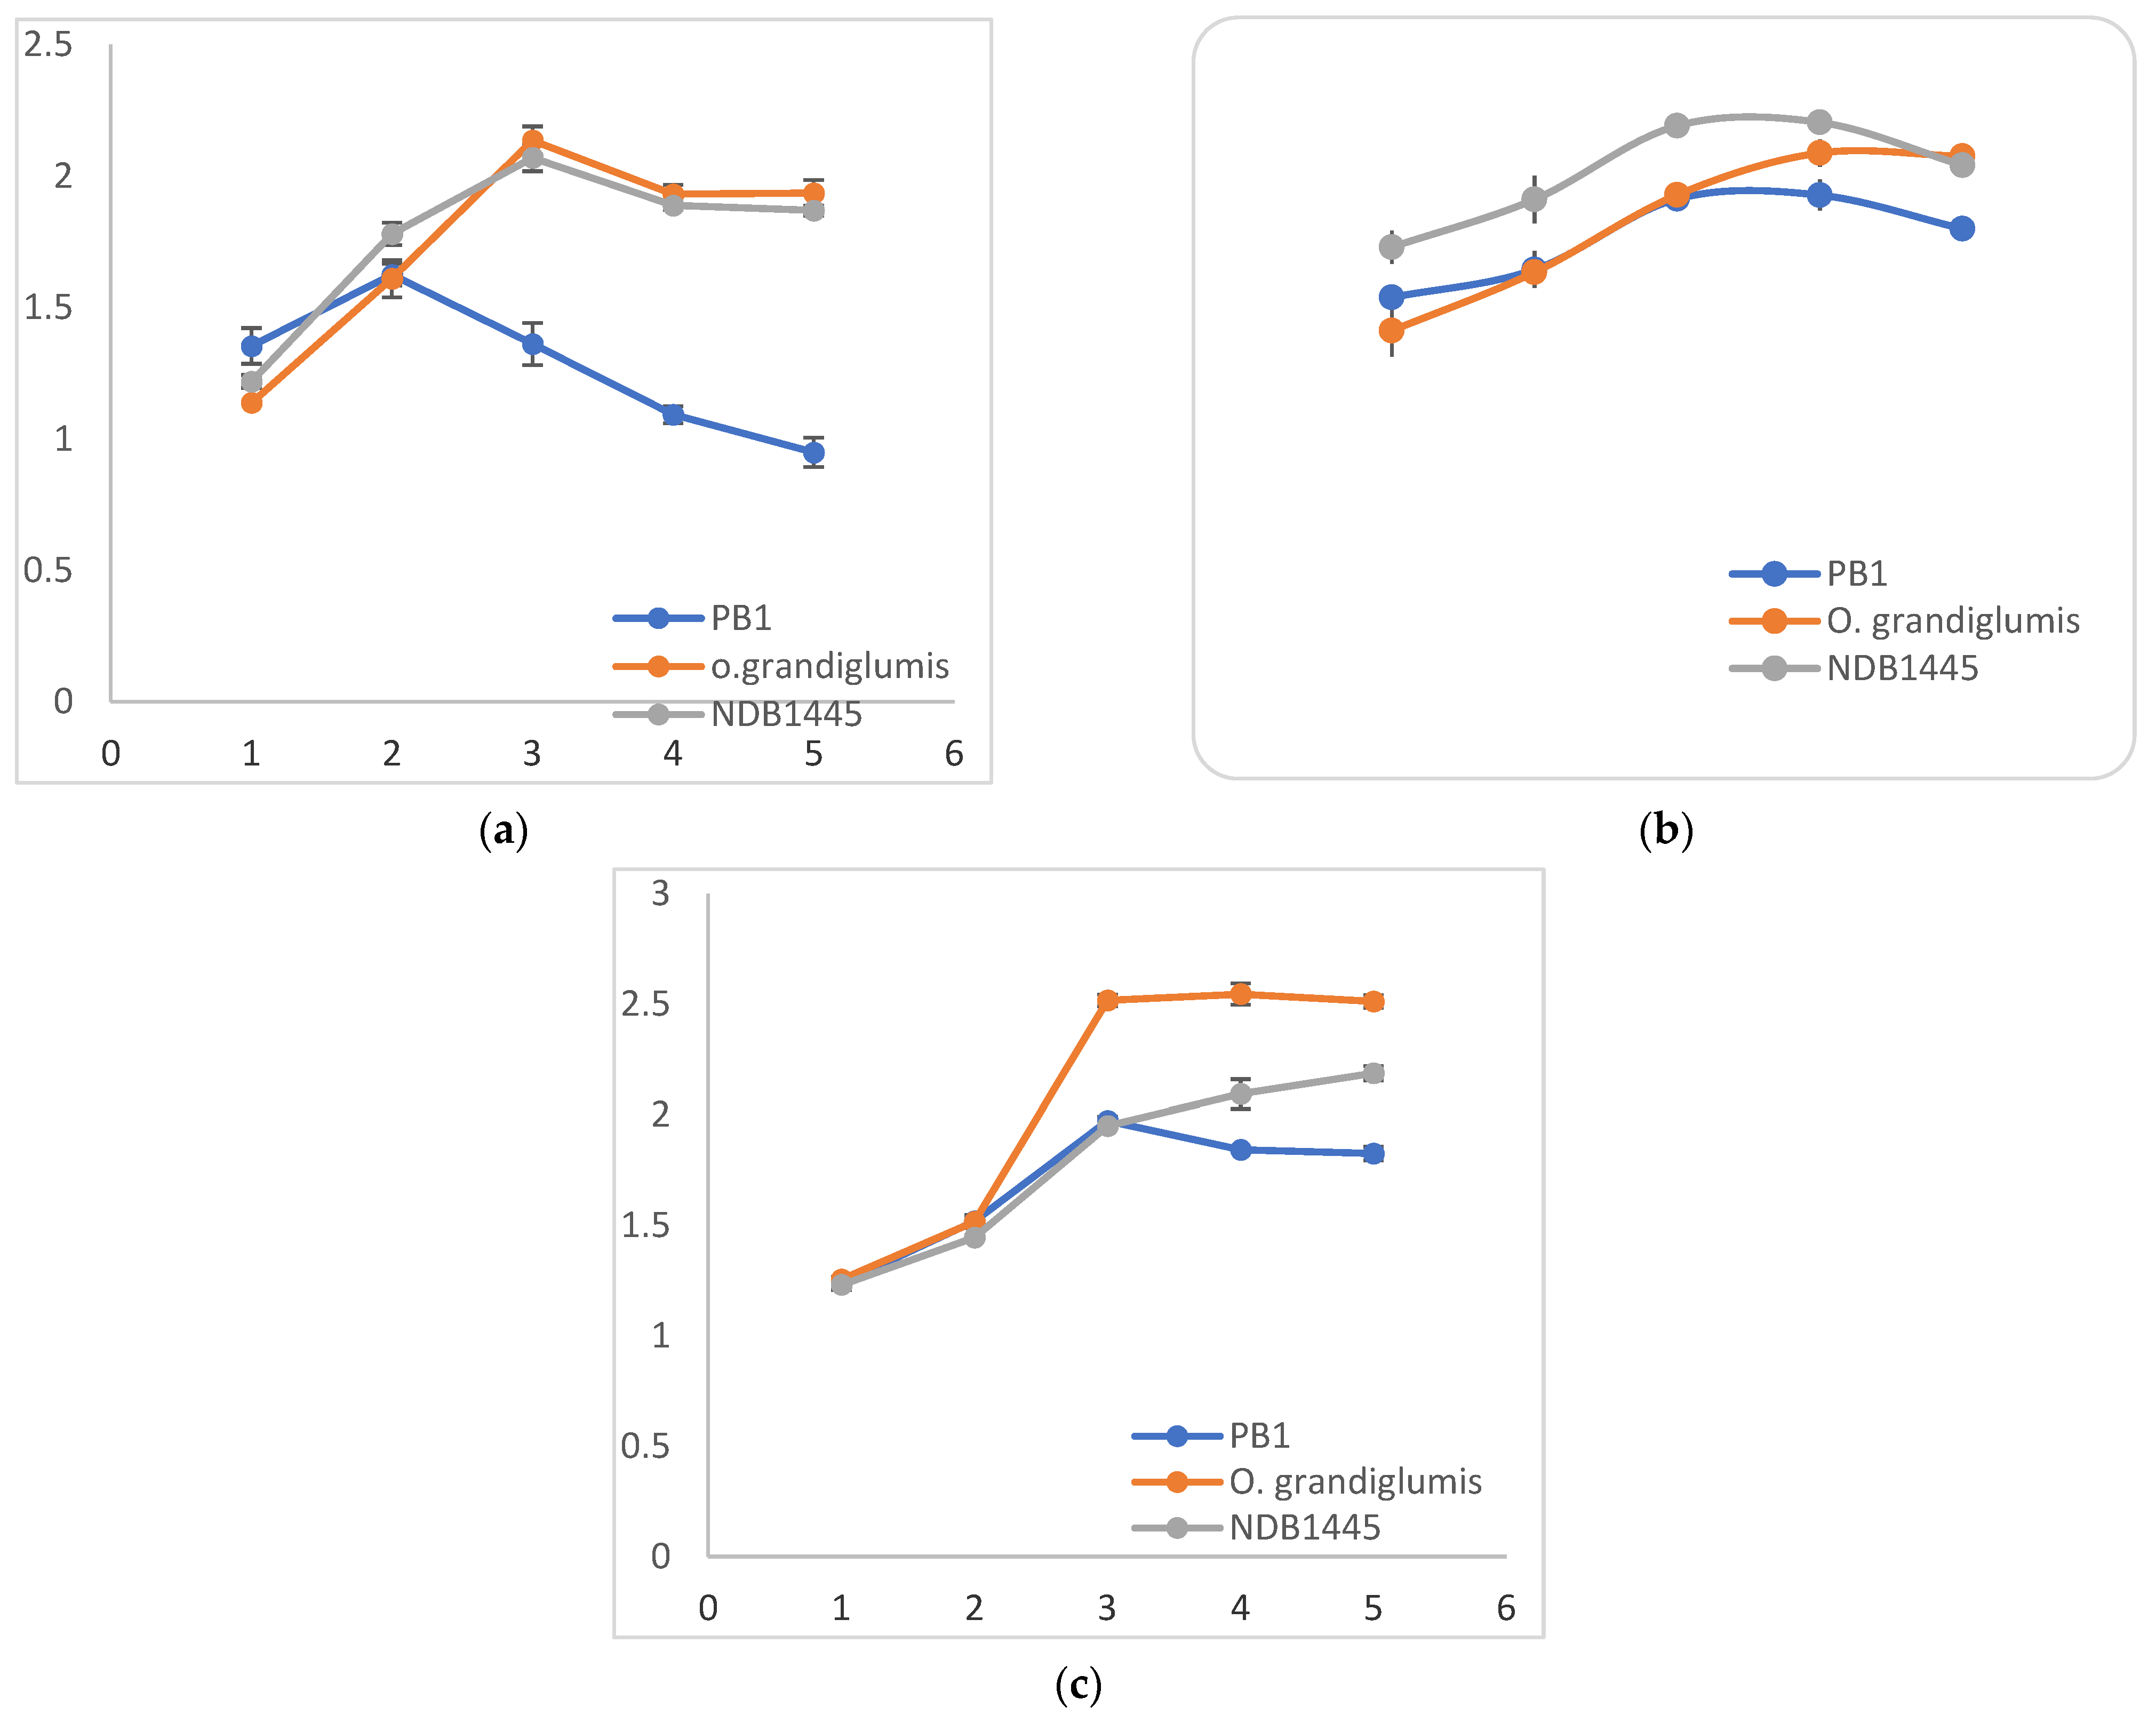
3.1. Biochemical Assay
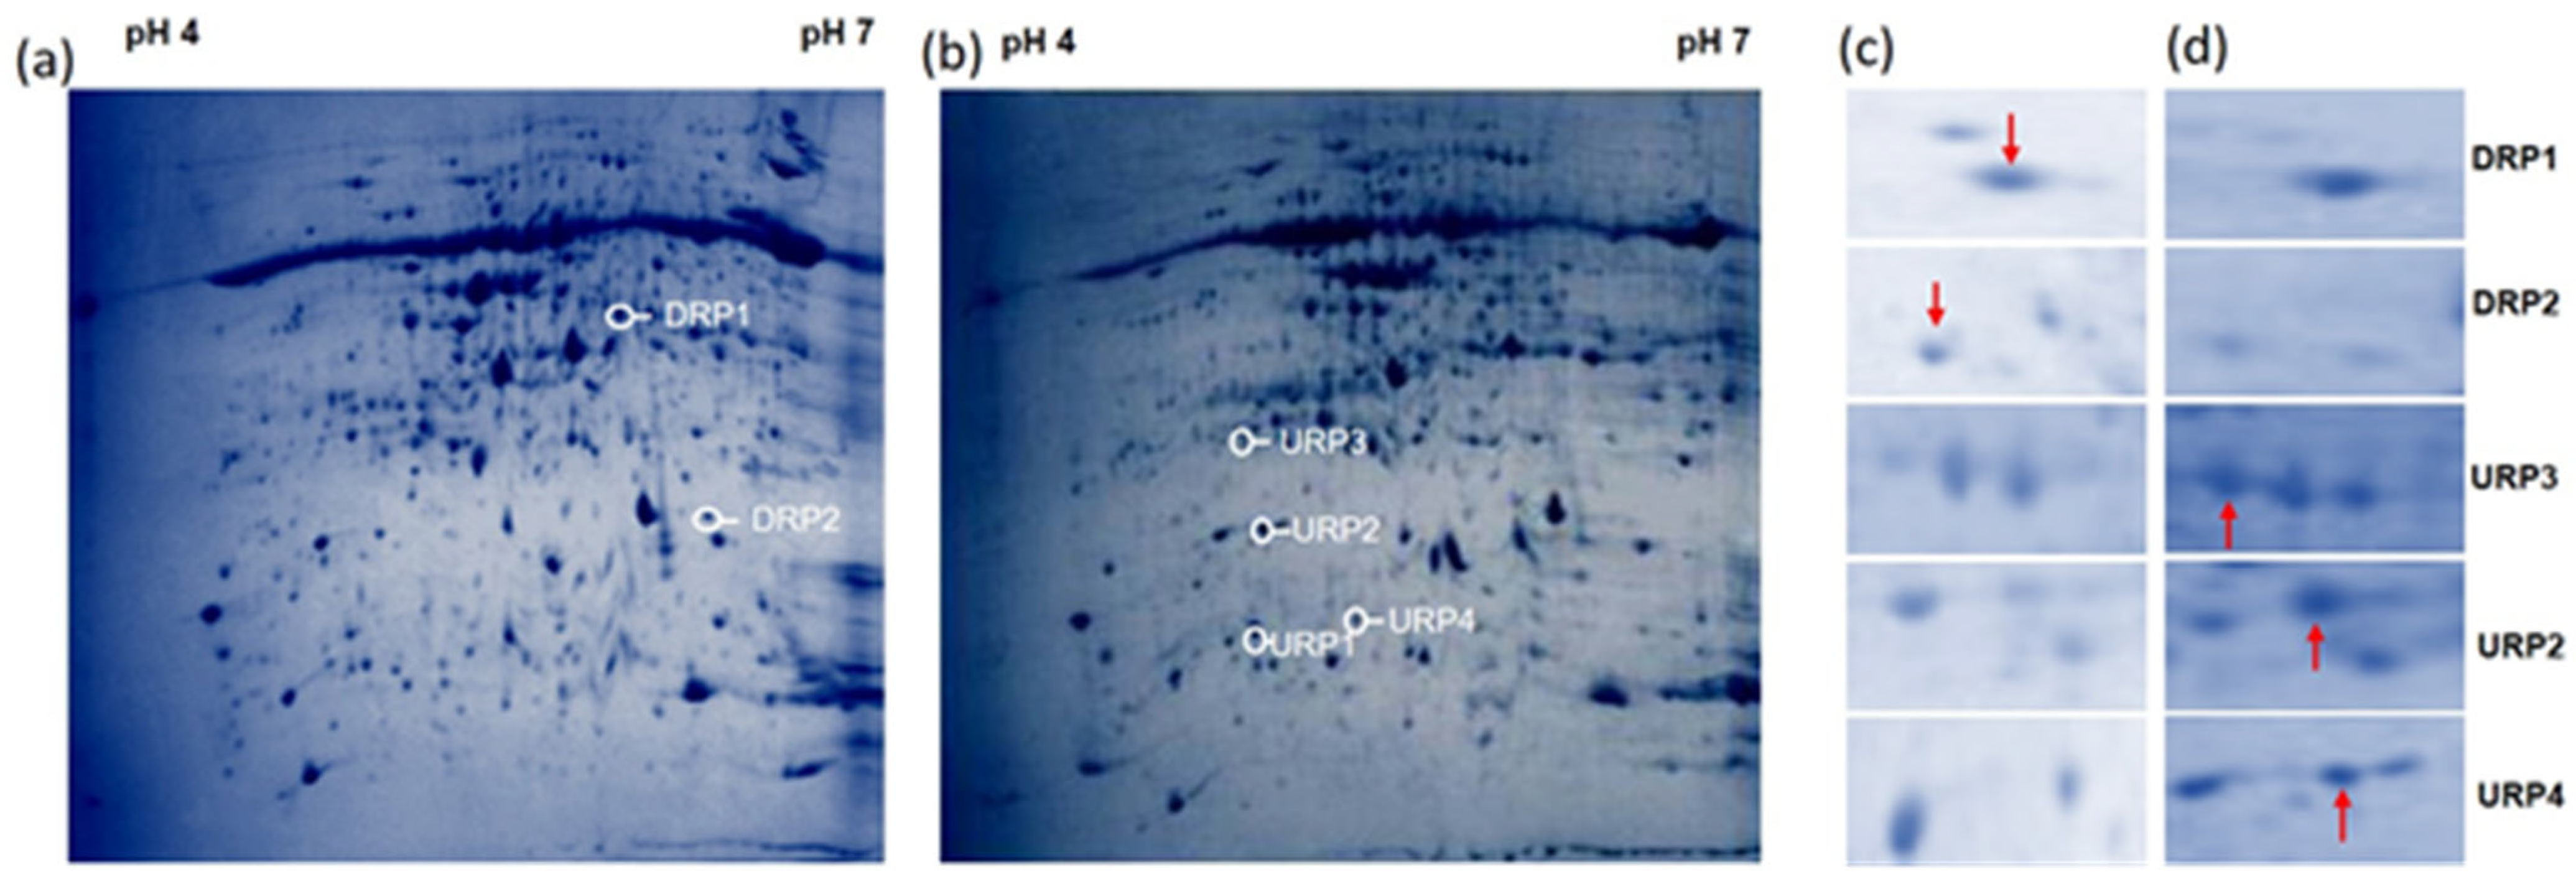
3.2. R. solani Induced Proteome Shift in Cultivated Rice, Wild Rice, and Barley
3.3. Chromosome Location of Differentially Expressed Protein on the Chromosomes
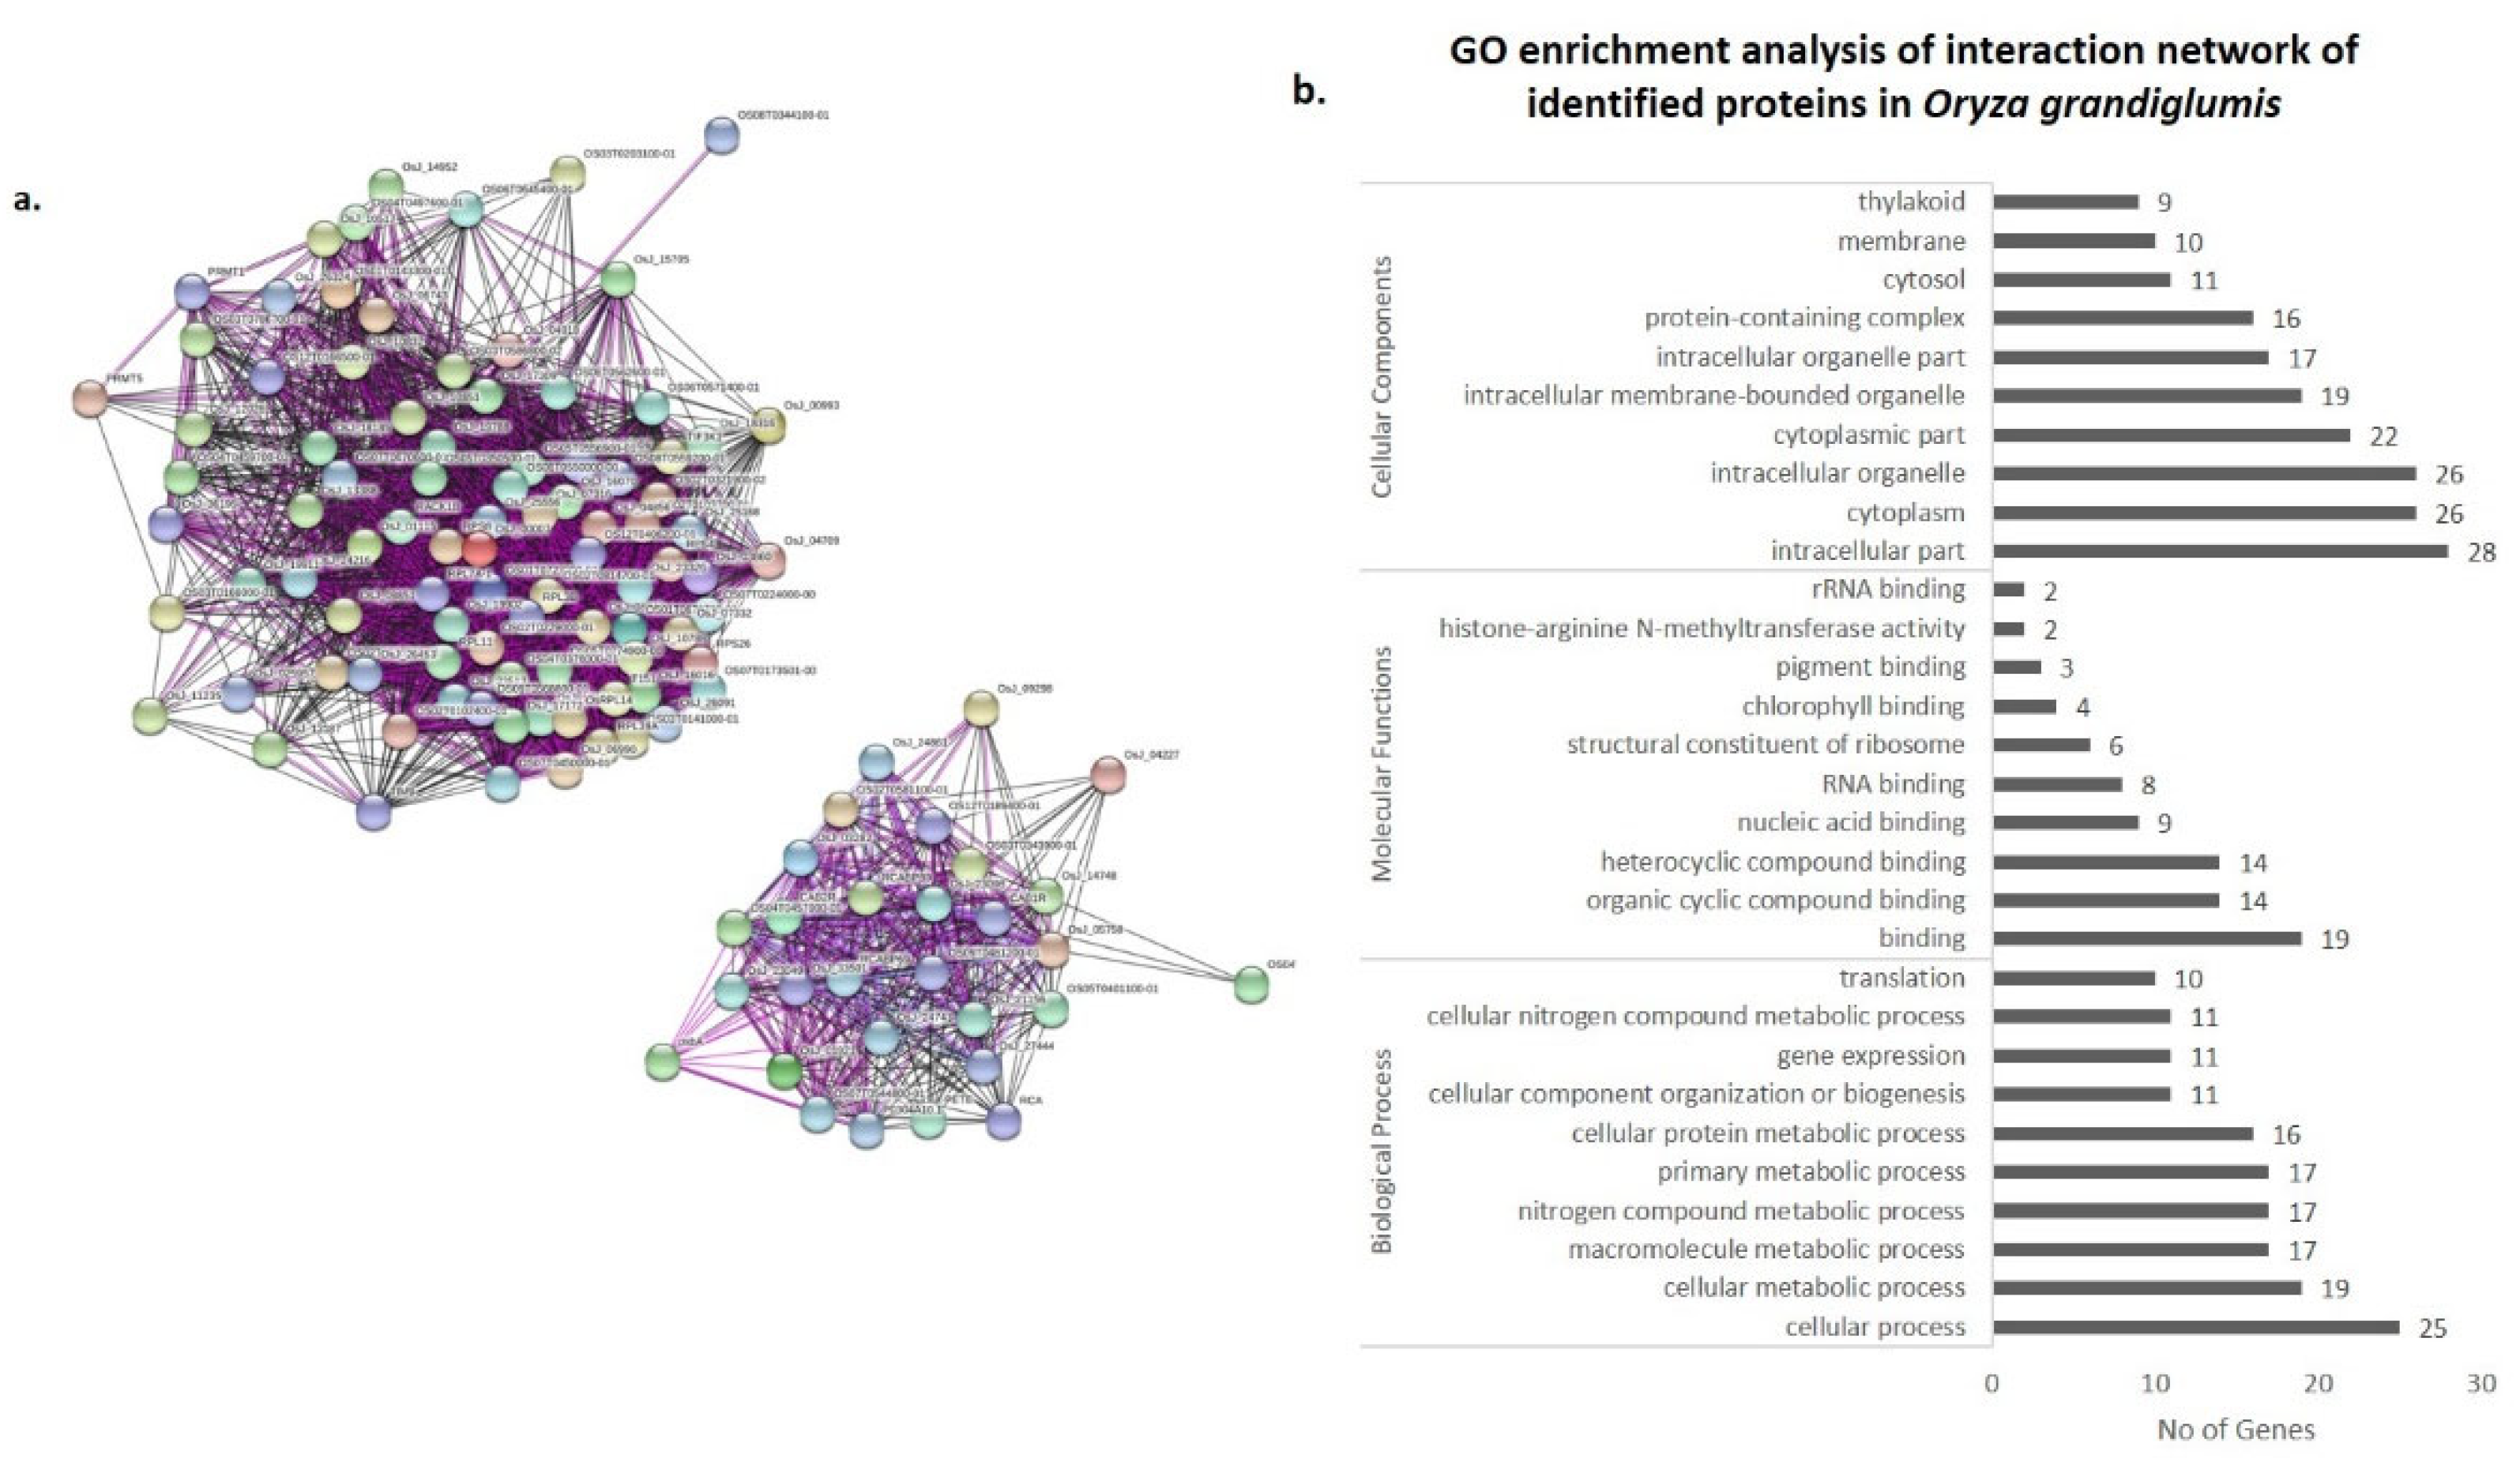
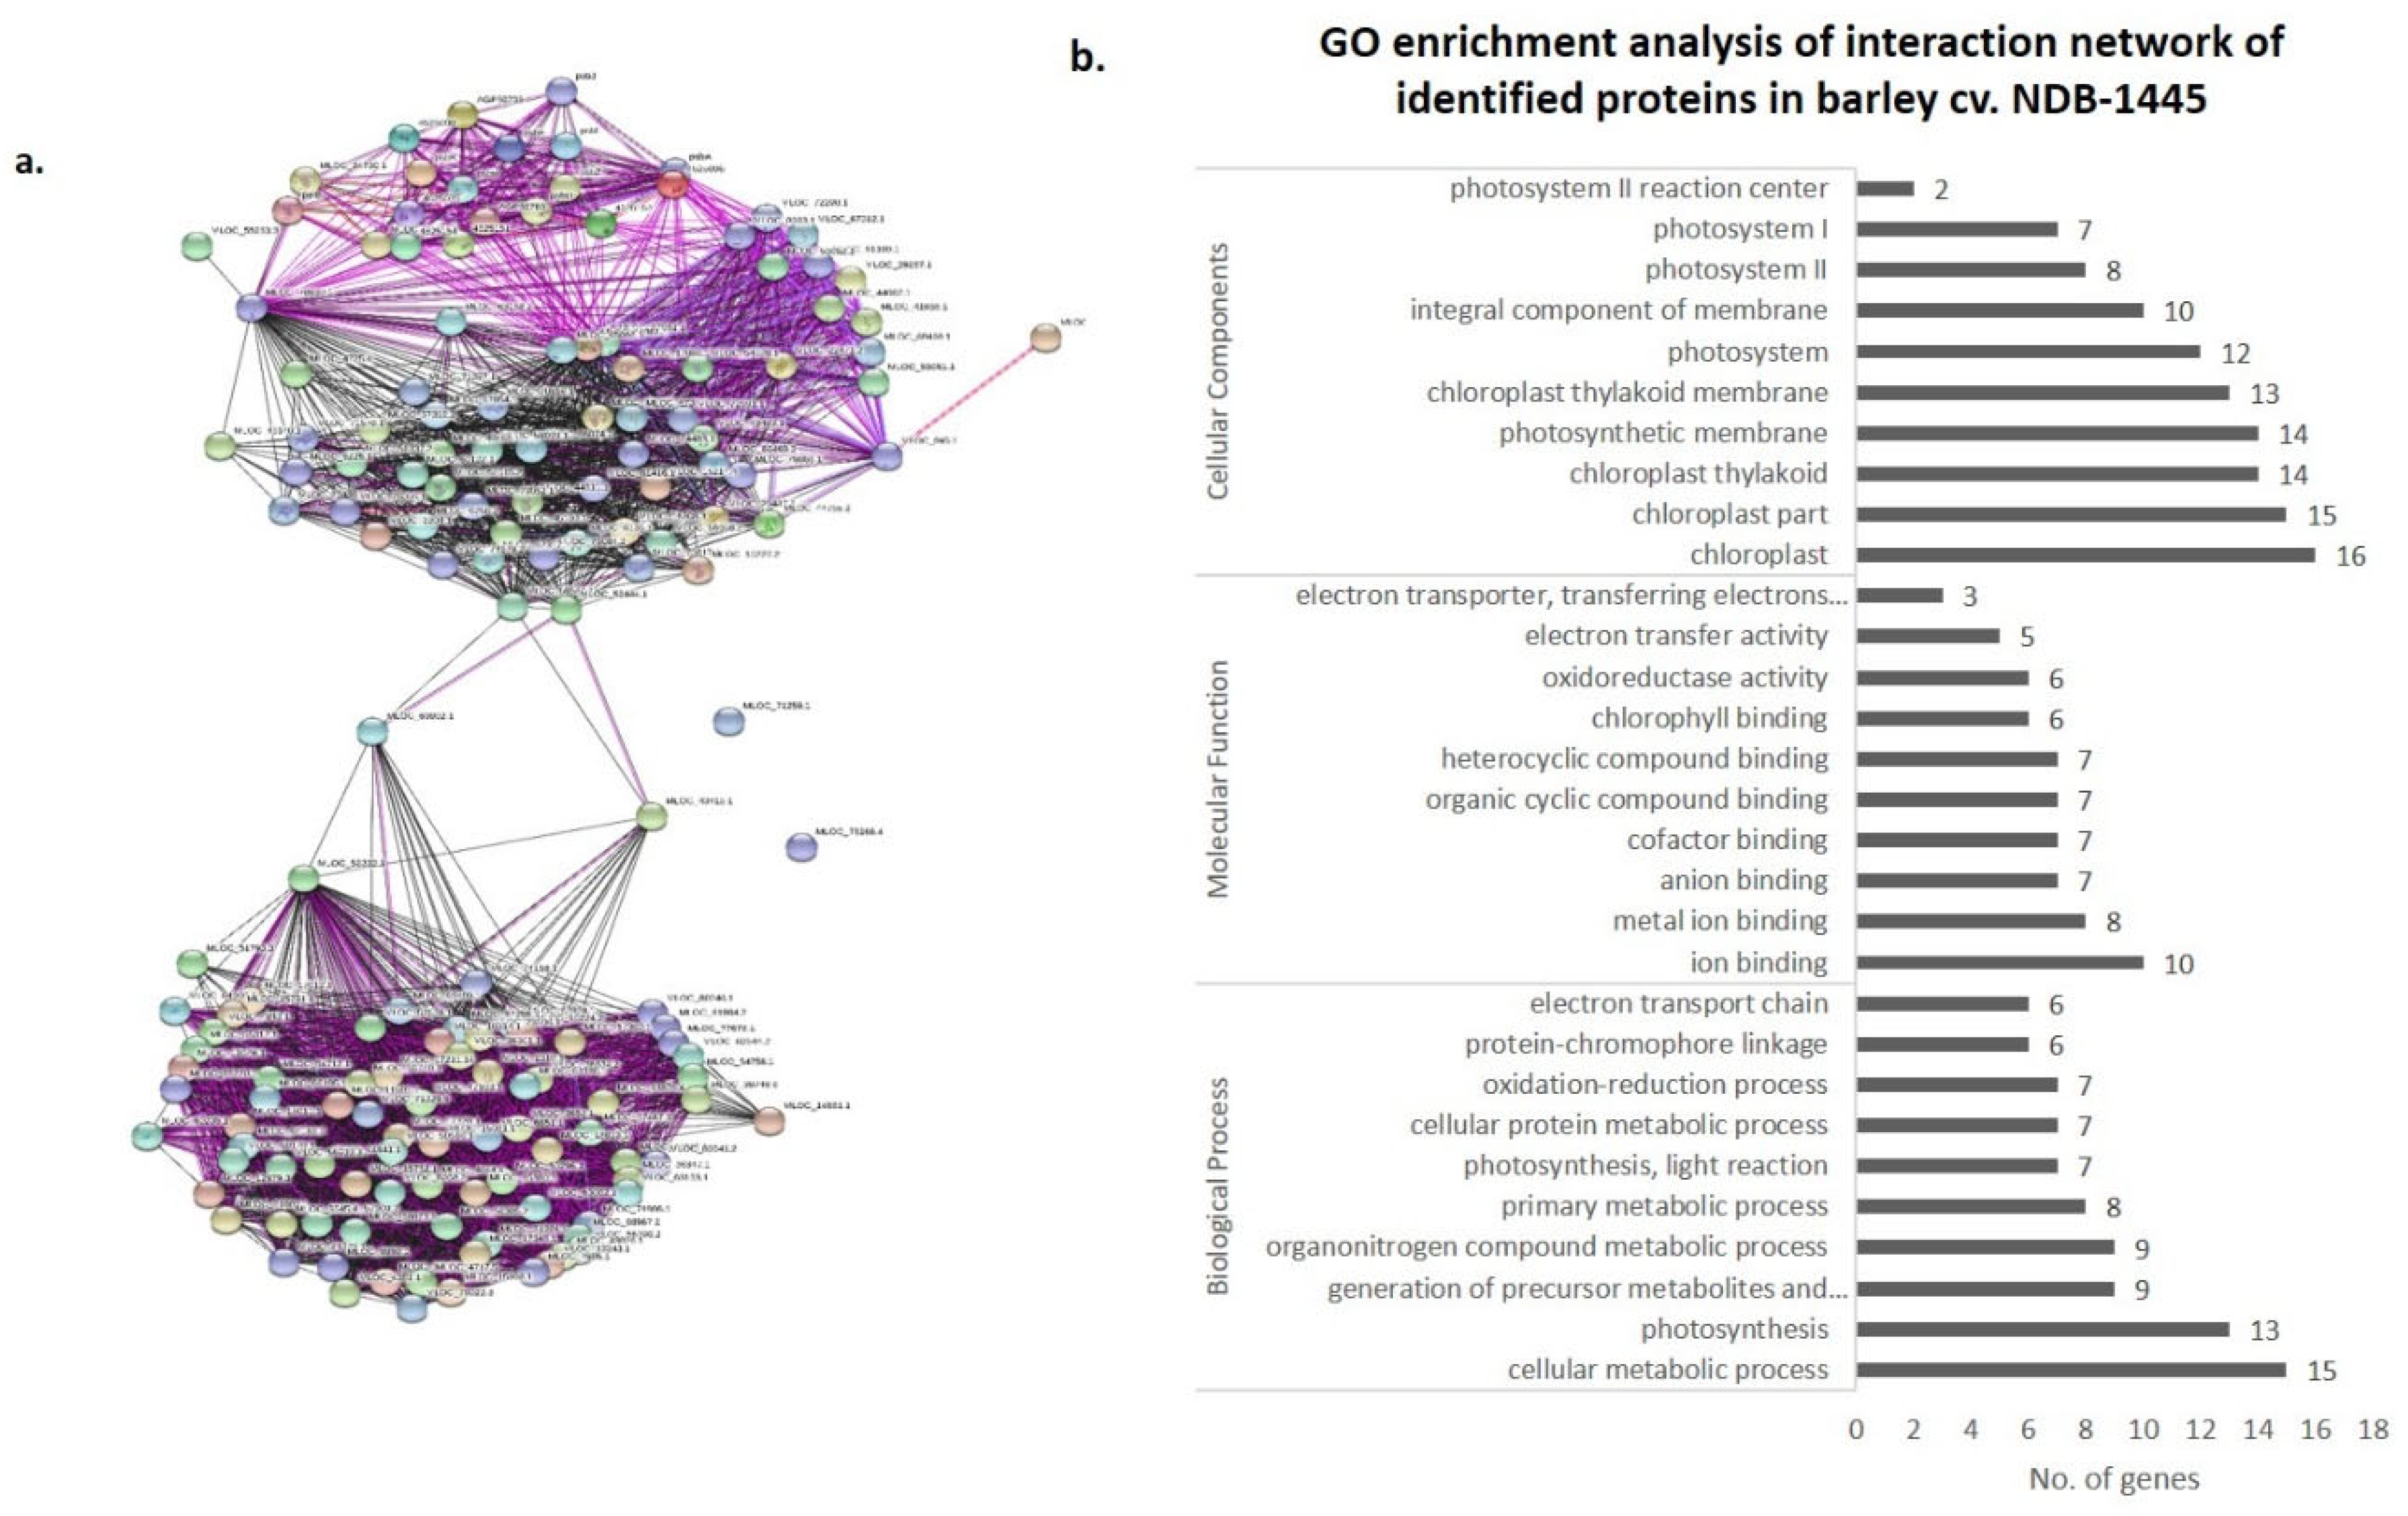
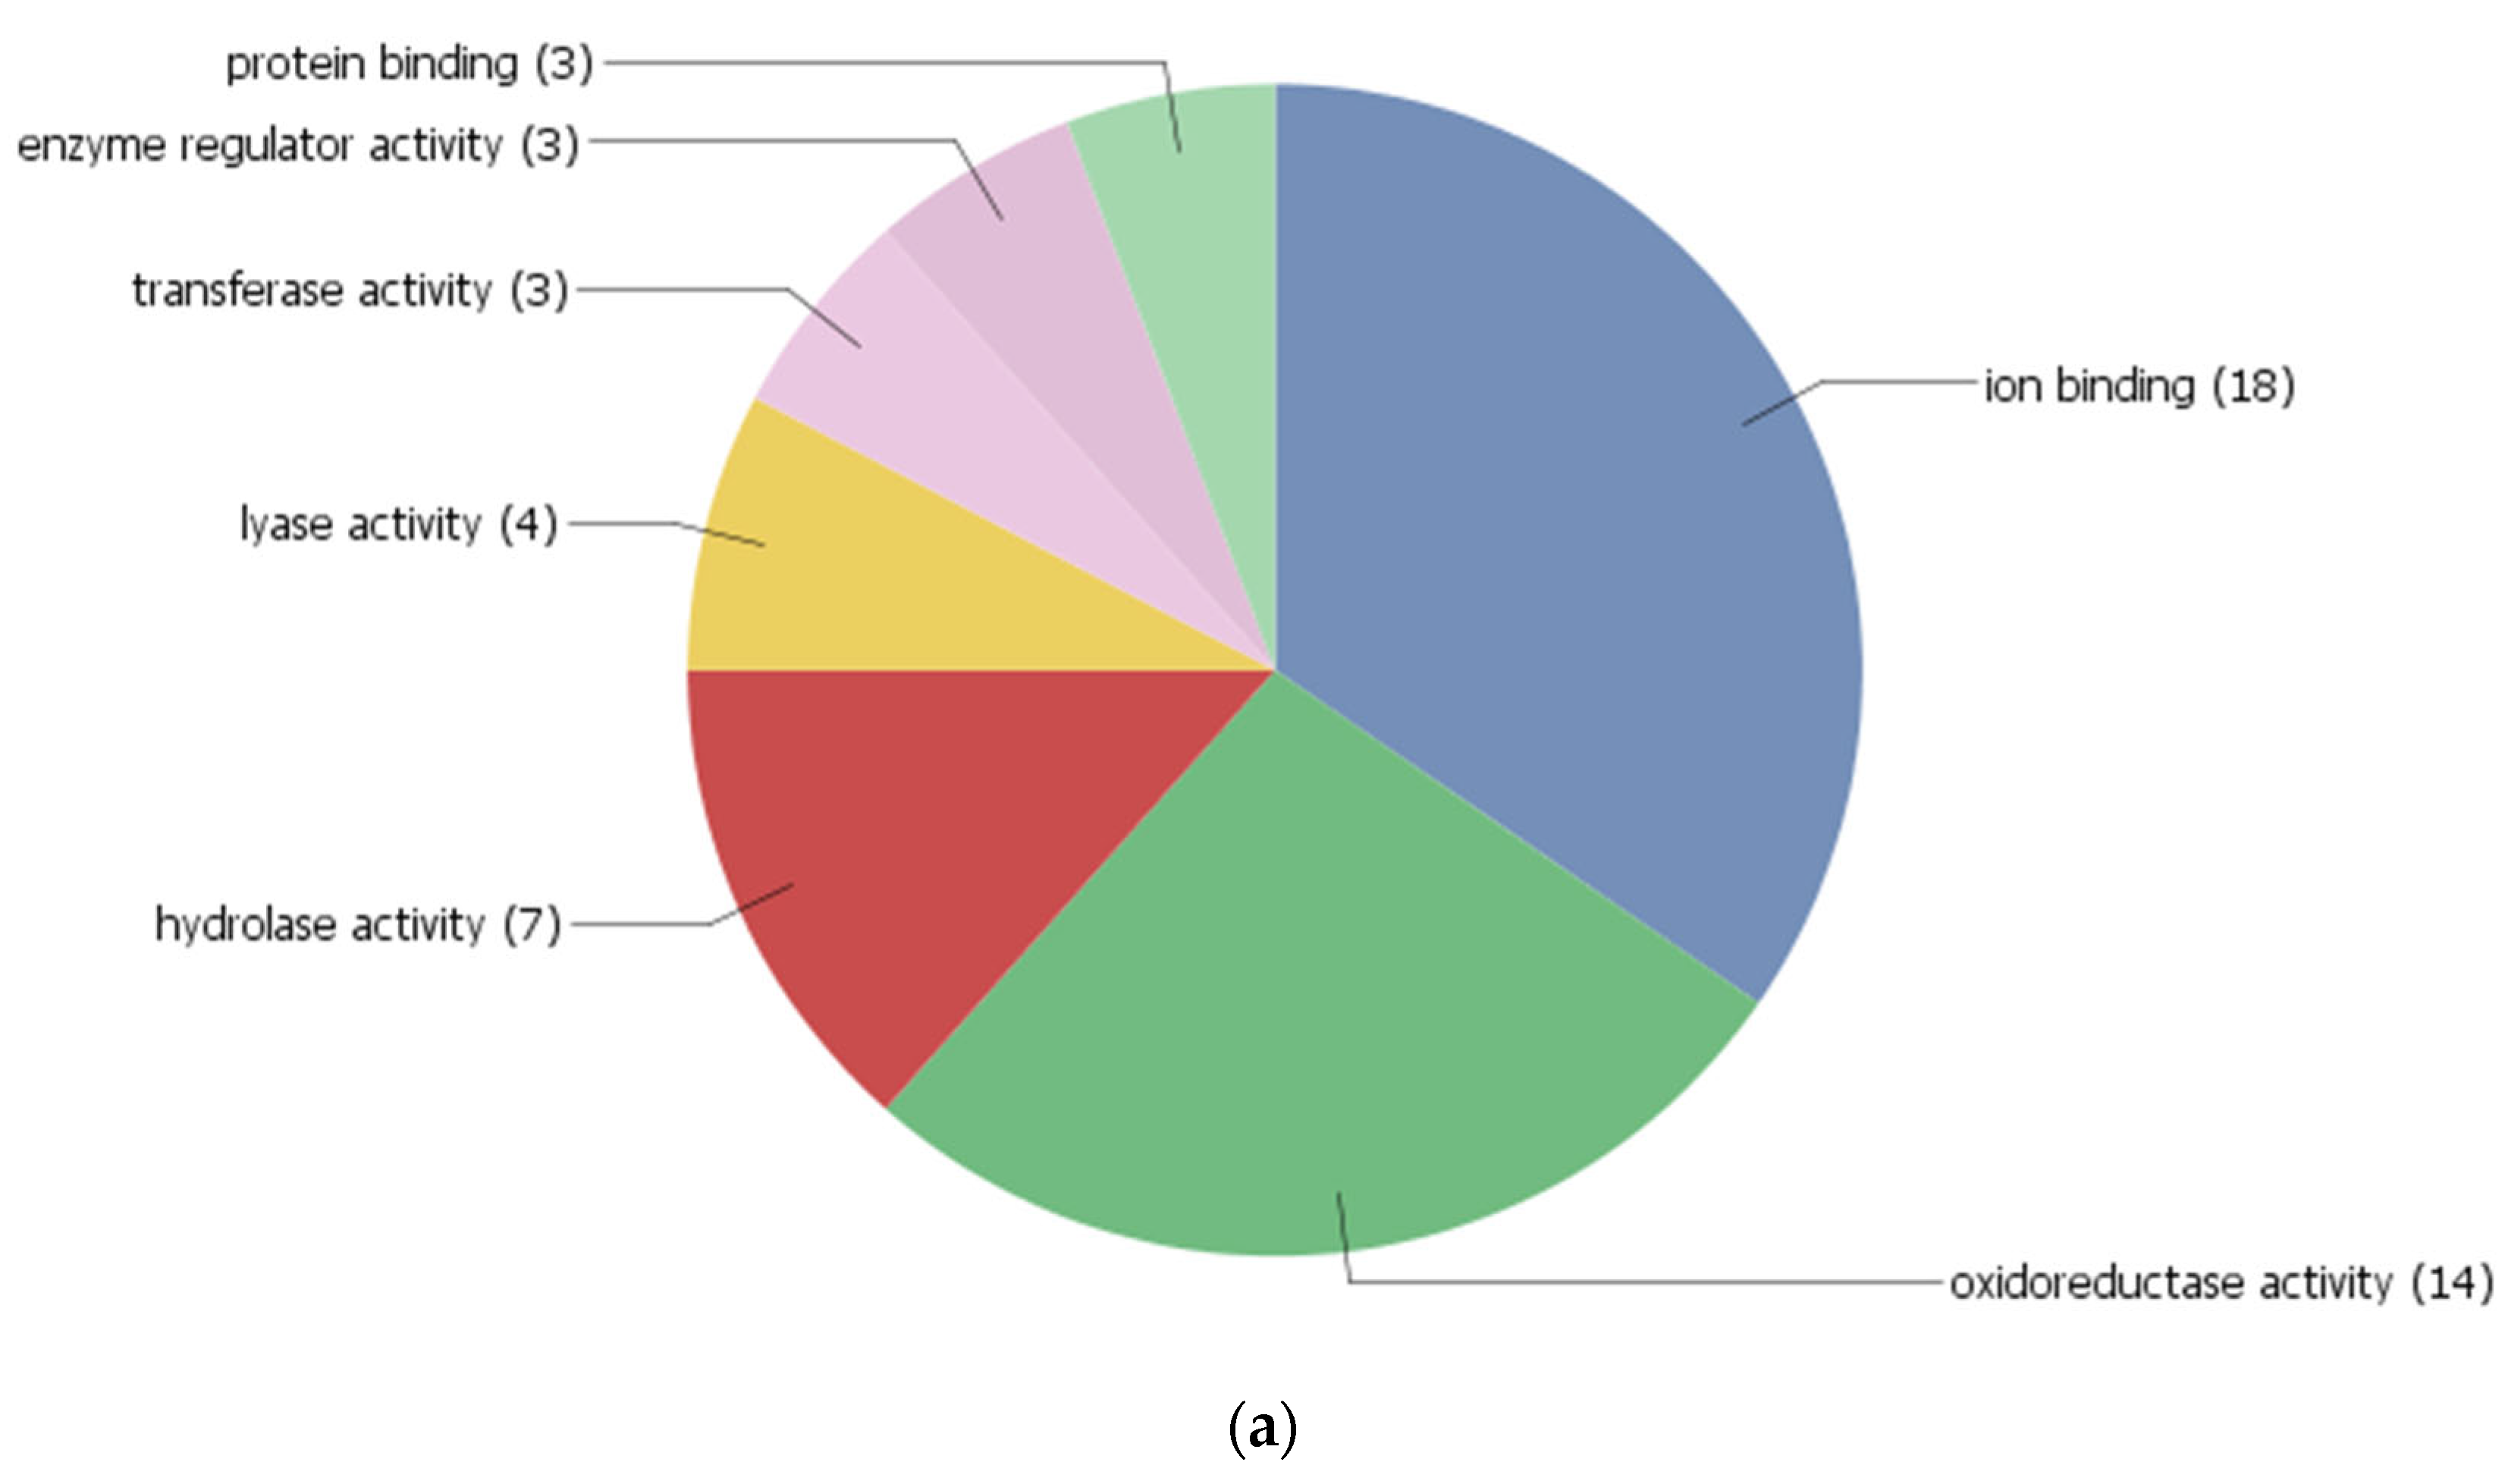
3.4. Co-Expression Networks and Gene Ontology
4. Discussion
5. Conclusions
Supplementary Materials
Author Contributions
Funding
Institutional Review Board Statement
Informed Consent Statement
Data Availability Statement
Acknowledgments
Conflicts of Interest
References
- Khoshkdaman, M.; Mousanejad, S.; Elahinia, S.A.; Ebadi, A.A.; Padasht-Dehkaei, F. Sheath blight development and yield loss on rice in different epidemiological conditions. J. Plant Pathol. 2021, 103, 87–96. [Google Scholar] [CrossRef]
- Hane, J.K.; Anderson, J.P.; Williams, A.H.; Sperschneider, J.; Singh, K.B. Genome sequencing and comparative genomics of the broad host-range pathogen Rhizoctonia solani AG8. PLoS Genet. 2014, 10, e1004281. [Google Scholar] [CrossRef] [PubMed] [Green Version]
- Kumar, B. Validation of integrated management modules against sheath blight disease of rice. Indian Phytopathol. 2021, 74, 235–239. [Google Scholar] [CrossRef]
- Sun, H.; Luo, F.; Zhang, X.; Zhou, L.; Lou, Z.; Chen, Z. Residue analysis and dietary exposure risk assessment of acibenzolar-S-methyl and its metabolite acibenzolar acid in potato, garlic, cabbage, grape and tomato. Ecotoxicol. Environ. Saf. 2021, 207, 111178. [Google Scholar] [CrossRef] [PubMed]
- Jaafar, A.K.M.; Paulitz, T.C.; Schroeder, K.L.; Thomashow, L.S.; Weller, D.M. Molecular characterization, morphological characteristics, virulence and geographic distribution of Rhizoctonia spp. In Washington state. Phytopathology 2016, 106, 459–473. [Google Scholar] [CrossRef] [Green Version]
- Wang, A.; Shu, X.; Jing, X.; Jiao, C.; Chen, L.; Zhang, J.; Ma, L.; Jiang, Y.; Yamamoto, N.; Li, S.; et al. Identification of rice (Oryza sativa L.) genes involved in sheath blight resistance via a genome-wide association study. Plant Biotechnol. J. 2021, 19, 1553–1566. [Google Scholar] [CrossRef]
- Li, W.; Chern, M.; Yin, J.; Wang, J.; Chen, X. Recent advances in broad-spectrum resistance to the rice blast disease. Curr. Opin. Plant Biol. 2019, 50, 114–120. [Google Scholar] [CrossRef]
- Molla, K.A.; Karmakar, S.; Molla, J.; Bajaj, P.; Varshney, R.K.; Datta, S.K.; Datta, K. Understanding sheath blight resistance in rice: The road behind and the road ahead. Plant Biotechnol. J. 2020, 18, 895–915. [Google Scholar] [CrossRef]
- Sun, C.Q.; Wang, X.K.; Li, Z.C.; Yoshimura, A.; Iwata, N. Comparison on the genetic diversity of common wild rice (Oryza rufipogon Griff) and cultivated rice (O. sativa L.) using RFLP markers. Theor. Appl. Genet. 2001, 102, 157–162. [Google Scholar] [CrossRef]
- Naveenkumar, R.; Singh, V.; Singh, P.K.; Anandan, A. Pattern of genetic variation in rice (Oryza sativa L.) population for sheath blight resistance over the seasons. Indian J. Genet. Plant Breed. 2021, 81, 132–134. [Google Scholar] [CrossRef]
- Prabhukarthikeyan, S.R.; Parameswaran, C.; Sawant, S.B.; Naveenkumar, R.; Mahanty, A.; Keerthana, U.; Yadav, M.K.; Anandan, A.; Panneerselvam, P.; Bag, M.K.; et al. Comparative proteomic analysis of Rhizoctonia solani isolates identifies the differentially expressed proteins with roles in virulence. J. Fungi 2022, 8, 370. [Google Scholar] [CrossRef] [PubMed]
- Foley, R.C.; Kidd, B.N.; Hane, J.K.; Anderson, J.P.; Singh, K.B. Reactive oxygen species play a role in the infection of the necrotrophic fungi, Rhizoctonia solani in wheat. PLoS ONE 2016, 11, e0152548. [Google Scholar] [CrossRef] [PubMed] [Green Version]
- Feng, Z.; Gao, P.; Zhao, J.; Wang, G.; Zhang, H.; Cao, W.; Xue, X.; Zhang, Y.; Ma, Y.; Hua, R.; et al. iTRAQ-based quantitative proteomics analysis of defense responses triggered by the pathogen Rhizoctonia solani infection in rice. J. Integr. Agric. 2022, 21, 139–152. [Google Scholar] [CrossRef]
- Kumar, I.; Nadarajah, K. A meta-analysis of quantitative trait loci associated with multiple disease Resistance in Rice (Oryza sativa L.). Plants 2020, 9, 1491. [Google Scholar] [CrossRef] [PubMed]
- Mustafa, G.; Komatsu, S. Plant proteomic research for improvement of food crops under stresses: A review. Mol. Omics 2021, 17, 860–880. [Google Scholar] [CrossRef]
- Lee, J.; Bricker, T.M.; Lefevre, M.; Pinson, S.R.M.; Oard, J.H. Proteomic and genetic approaches to identifying defence-related proteins in rice challenged with the fungal pathogen Rhizoctonia solani. Mol. Plant Pathol. 2006, 7, 405–416. [Google Scholar] [CrossRef]
- Karmakar, S.; Datta, K.; Molla, K.A.; Gayen, D.; Das, K.; Sarkar, S.N.; Datta, S.K. Proteo-metabolomic investigation of transgenic rice unravels metabolic alterations and accumulation of novel proteins potentially involved in defence against Rhizoctonia solani. Sci. Rep. 2019, 9, 10461. [Google Scholar] [CrossRef] [Green Version]
- Singh, A.; Rohilla, R.; Singh, U.S.; Savary, S.; Willocquet, L.; Duveiller, E. An improved inoculation technique for sheath blight of rice caused by Rhizoctonia solani. Can. J. Plant Pathol. 2002, 24, 65–68. [Google Scholar] [CrossRef]
- Singleton, V.L.; Rossi, J.A. Colorimetry of total phenolics with phosphomolybdic-phosphotungstic acid reagents. Am. J. Enol. Vitic. 1965, 16, 144–158. [Google Scholar]
- Srivastava, S.K. Peroxidase and poly-phenol oxidase in Brassica juncea plants infected with Macrophomina phaseolina (Tassai) Goid. and their implication in disease resistance. J. Phytopathol. 1987, 120, 249–254. [Google Scholar] [CrossRef]
- Pan, S.Q.; Ye, X.S.; Kuc, J. A technique for detection of chitinase, beta-1,3-glucanase, and protein-patterns after a single separation using polyacrylamide-gel electrophoresis or isoelectrofocusing. Phytopathology 1991, 81, 970–974. [Google Scholar] [CrossRef]
- Koller, A.; Washburn, M.P.; Lange, B.M.; Andon, N.L.; Deciu, C.; Haynes, P.A.; Hays, L.; Schieltz, D.; Ulaszek, R.; Wei, J.; et al. Proteomic survey of metabolic pathways in rice. Proc. Natl. Acad. Sci. USA 2002, 99, 11969–11974. [Google Scholar] [CrossRef] [Green Version]
- Bradford, M.M. A rapid and sensitive method for quantitation of microgram quantities of protein utilizing the principle of protein-dye-binding. Anal. Biochem. 1976, 72, 248–254. [Google Scholar] [CrossRef]
- Kumar, G.; Sharma, P.; Rathore, G.; Bisht, D.; Sengupta, U.; Kumar, G. Proteomic analysis of outer membrane proteins of Edwardsiella tarda. J. Appl. Microbiol. 2010, 108, 2214–2221. [Google Scholar] [CrossRef] [PubMed]
- Shevchenko, A.; Wilm, M.; Vorm, O.; Mann, M. Mass spectrometric sequencing of proteins from silver-stained polyacrylamide gels. Anal. Chem. 1996, 68, 850–858. [Google Scholar] [CrossRef] [PubMed]
- Szklarczyk, D.; Gable, A.L.; Lyon, D.; Junge, A.; Wyder, S.; Cepas, J.H.; Simonovic, M.; Doncheva, N.T.; Morris, J.H.; Bork, P.; et al. STRING v11: Protein–protein association networks with increased coverage, supporting functional discovery in genome-wide experimental datasets. Nucleic Acids Res. 2019, 47, D607–D613. [Google Scholar] [CrossRef] [Green Version]
- SAS Institute. The SAS System for Windows. Release 7.00; SAS Institute: Cary, NC, USA, 1998. [Google Scholar]
- Singh, P.; Mazumdar, P.; Harikrishna, J.A.; Babu, S. Sheath blight of rice: A review and identification of priorities for future research. Planta 2019, 250, 1387–1407. [Google Scholar] [CrossRef] [Green Version]
- Galam, D.; Sanabria, Y.; Groth, D.; Famoso, A.; Anjira, B.; Oard, J. Development and characterization of sheath blight resistant lines in rice. In Proceedings of the 38th Rice Technical Working Group Meeting, Orange Beach, AL, USA, 24–27 February 2020; p. 116. [Google Scholar]
- Rao, T.B.; Chopperla, R.; Methre, R.; Punniakotti, E.; Venkatesh, V.; Sailaja, B.; Reddy, M.R.; Yagander, A.; Laha, G.S.; Madhav, M.S.; et al. Pectin induced transcriptome of a Rhizoctonia solani strain causing sheath blight disease in rice reveals insights on key genes and RNAi machinery for development of pathogen derived resistance. Plant Mol. Biol. 2019, 100, 59–71. [Google Scholar] [CrossRef]
- Zuo, S.; Yin, Y.; Pan, C.; Chen, Z.; Zhang, Y.; Gu, S.; Zhu, L.; Pan, X. Fine mapping of qSB-11LE, the QTL that confers partial resistance to rice sheath blight. Theor. Appl. Genet. 2013, 126, 1257–1272. [Google Scholar] [CrossRef]
- Zhang, F.; Zeng, D.; Zhang, C.S.; Lu, J.L.; Chen, T.J.; Xie, J.P.; Zhou, Y.L. Genome-wide association analysis of the genetic basis for sheath blight resistance in rice. Rice 2019, 12, 93. [Google Scholar] [CrossRef] [Green Version]
- Shamim, M.; Husain, R.; Srivastava, D.; Kumar, D.; Khan, N.A.; Kumar, M.; Jha, V.B.; Kumar, V.; Ranjan, T.; Singh, K.N. Host defense responses of maize against Rhizoctonia solani by biochemical and comparative proteomic approaches. J. Biotechnol. Crop Sci. 2020, 9, 36–43. [Google Scholar]
- Kaur, S.; Samota, M.K.; Choudhary, M.; Choudhary, M.; Pandey, A.K.; Sharma, A.; Thakur, J. How do plants defend themselves against pathogens-biochemical mechanisms and genetic interventions. Physiol. Mol. Biol. Plants 2022, 28, 485–504. [Google Scholar] [CrossRef] [PubMed]
- Lehmann, S.; Serrano, M.; L’Haridon, F.; Tjamos, S.E.; Metraux, J.-P. Reactive oxygen species and plant resistance to fungal pathogens. Phytochemistry 2015, 112, 54–62. [Google Scholar] [CrossRef] [PubMed] [Green Version]
- Elsharkawy, M.M.; Sakran, R.M.; Ahmad, A.A.; Behiry, S.I.; Abdelkhalek, A.; Hassan, M.M.; Khedr, A.A. Induction of systemic resistance against sheath blight in rice by different Pseudomonas isolates. Life 2022, 12, 349. [Google Scholar] [CrossRef] [PubMed]
- Lavanya, S.N.; Niranjan-Raj, S.; Jadimurthy, R.; Sudarsan, S.; Srivastava, R.; Tarasatyavati, C.; Rajashekara, V.; Gupta, V.K.; Nayaka, S.C. Immunity elicitors for induced resistance against the downy mildew pathogen in pearl millet. Sci. Rep. 2022, 12, 4078. [Google Scholar] [CrossRef]
- Gupta, S.K.; Rai, A.K.; Kanwar, S.S.; Chand, D.; Singh, N.K.; Sharma, T.R. The single functional blast resistance gene Pi54 activates a complex defence mechanism in rice. J. Exp. Bot. 2012, 63, 757–772. [Google Scholar] [CrossRef] [PubMed] [Green Version]
- Vincent, D.; Rafiqi, M.; Job, D. The multiple facets of plant–fungal interactions revealed through plant and fungal secretomics. Front. Plant Sci. 2020, 10, 1626. [Google Scholar] [CrossRef]
- Wu, L.; Wang, S.; Chen, X.; Wang, X.; Wu, L.; Zu, X.; Chen, Y. Proteomic and phytohormone analysis of the response of maize (Zea mays L.) seedlings to sugarcane mosaic virus. PLoS ONE 2013, 8, e70295. [Google Scholar] [CrossRef] [Green Version]
- Meng, L.; Wong, J.H.; Feldman, L.J.; Lemaux, P.G.; Buchanan, B.B. A membrane-associated thioredoxin required for plant growth moves from cell to cell, suggestive of a role in intercellular communication. Proc. Natl. Acad. Sci. USA 2010, 107, 3900–3905. [Google Scholar] [CrossRef] [Green Version]
- Bui, L.T.; Novi, G.; Lombardi, L.; Iannuzzi, C.; Rossi, J.; Santaniello, A.; Mensuali, A.; Corbineau, F.; Giuntoli, B.; Perata, P.; et al. Conservation of ethanol fermentation and its regulation in land plants. J. Exp. Bot. 2019, 70, 1815–1827. [Google Scholar] [CrossRef] [Green Version]
- Fukao, T.; Bailey-Serres, J. Plant responses to hypoxia is survival a balancing act? Trends Plant Sci. 2004, 4, 449–456. [Google Scholar] [CrossRef] [PubMed]
- Lam, K.C.; Ibrahim, R.K.; Behdad, B.; Dayanandan, S. Structure, function, and evolution of plant O-methyltransferases. Genome 2007, 50, 1001–1013. [Google Scholar] [CrossRef] [PubMed]
- Gregersen, P.L.; Christensen, A.B.; Knudsen, J.S.; Collinge, D.B. A putative O-methyltransferase from barley is induced by fungal pathogens and UV light. Plant Mol. Biol. 1994, 26, 1797–1806. [Google Scholar] [CrossRef] [PubMed]
- Lu, Y.; Yao, J. Chloroplasts at the crossroad of Photosynthesis, pathogen infection and plant defense. Int. J. Mol. Sci. 2018, 19, 3900. [Google Scholar] [CrossRef] [PubMed] [Green Version]
- Balakireva, A.V.; Zamyatnin, A.A. Indispensable role of proteases in plant innate immunity. Int. J. Mol. Sci. 2018, 23, 629. [Google Scholar] [CrossRef] [Green Version]
- Laluk, K.; Mengiste, T. The Arabidopsis extracellular unusual serine protease inhibitor functions in resistance to necrotrophic fungi and insect herbivory. Plant J. 2011, 68, 480–494. [Google Scholar] [CrossRef]
- Zhang, C.; Fang, H.; Shi, X.; He, F.; Wang, R.; Fan, J.; Bai, P.; Wang, J.; Park, C.H.; Bellizzi, M.; et al. A fungal effector and a rice NLR protein have antagonistic effects on a Bowman-Birk trypsin inhibitor. Plant Biotechnol. J. 2020, 18, 2354–2363. [Google Scholar] [CrossRef]
- Hu, Y.; Zhong, S.; Zhang, M.; Liang, Y.; Gong, G.; Chang, X.; Tan, F.; Yang, H.; Qiu, X.; Luo, L.; et al. Potential role of photosynthesis in the regulation of reactive oxygen species and defence responses to Blumeria graminis f. sp. tritici in wheat. Int. J. Mol. Sci. 2020, 11, 5767. [Google Scholar] [CrossRef]
- Deng, H.; Liu, H.; Li, X.; Xiao, J.; Wang, S. A CCCH-Type zinc finger nucleic acid-binding protein quantitatively confers resistance against rice bacterial blight disease. Plant Physiol. 2012, 158, 876–889. [Google Scholar] [CrossRef] [Green Version]
- Kazaz, S.; Miray, R.; Baud, S. Acyl-Acyl carrier protein desaturases and plant biotic interactions. Cells 2021, 18, 674. [Google Scholar] [CrossRef]
- Jwa, N.S.; Agrawal, G.K.; Tamogami, S. Role of defense/stress-related marker genes, proteins and secondary metabolites in defining rice self-defense mechanisms. Plant Physiol. Biochem. 2006, 44, 261–273. [Google Scholar] [CrossRef] [PubMed]
- Bechtold, U.; Albihlal, W.S.; Lawson, T.; Fryer, M.J.; Sparrow, P.A.C.; Richard, F.; Persad, R.; Bowden, L.; Hickman, R.; Martin, C.; et al. Arabidopsis HEAT SHOCK TRANSCRIPTION FACTORA1b overexpression enhances water productivity, resistance to drought, and infection. J. Exp. Bot. 2013, 64, 3467–3481. [Google Scholar] [CrossRef]
- Krüger, J.; Thomas, C.M.; Golstein, C.; Dixon, M.S.; Smoker, M.; Tang, S.; Mulder, L.; Jones, J.D.G. A tomato cysteine protease required for Cf-2-dependent disease resistance and suppression of autonecrosis. Science 2002, 296, 744–747. [Google Scholar] [CrossRef] [PubMed] [Green Version]
- Seo, S.; Okamoto, M.; Iwai, T.; Iwano, M.; Fukui, K.; Isogai, A.; Nakajima, N.; Ohashi, Y. Reduced levels of chloroplast FtsH protein in tobacco mosaic virus-infected tobacco leaves accelerate the hypersensitive reaction. Plant Cell 2000, 12, 917–932. [Google Scholar] [PubMed] [Green Version]
- Wang, R.; Ning, Y.; Shi, X.; He, F.; Zhang, C.; Fan, J.; Jiang, N.; Zhang, Y.; Zhang, T.; Hu, Y.; et al. Immunity to rice blast disease by suppression of effector-triggered necrosis. Curr. Biol. 2016, 26, 2399–2411. [Google Scholar] [CrossRef] [PubMed] [Green Version]
- Yang, D.; Seaton, D.D.; Krahmer, J.; Halliday, K.J. Photoreceptor effects on plant biomass, resource allocation, and metabolic state. Proc. Natl. Acad. Sci. USA 2016, 113, 7667–7672. [Google Scholar] [CrossRef] [Green Version]
- Breia, R.; Conde, A.; Badim, H.; Fortes, A.M.; Gerós, H.; Granell, A. Plant SWEETs: From sugar transport to plant-pathogen interaction and more unexpected physiological roles. Plant Physiol. 2021, 186, 836–852. [Google Scholar] [CrossRef]


| Spot ID | Sequence ID | Gene Location | Protein Name | Theoretical M.Wt (KDa)/pI | SSR | Putative Molecular Function | Putative Biological Process | Predicted Sub Cellular Localization |
|---|---|---|---|---|---|---|---|---|
| URP1 | LOC_Os10g21268.1 | Chr10:10861158..10862712 | Ribulos bisphosphate carboxylase large chain precursor | 53.7/6.58 | RM25277 | Magnesium ion binding | Carbon fixation | Chloroplast |
| URP2 | LOC_Os07g44430.1 | Chr7:26548652..26549804 | Thiredoxin peroxidase | 24/5.97 | RM22046 | Peroxi redoxin activity | Oxidation–reduction process | Cytoplasm |
| URP3 | LOC_Os11g10480.1 | Chr11:5712641..5716288 | Alcohol dehydogenase | 40.98/6.20 | RM26250 | Zinc ion binding | Oxidation–reduction process | Cytoplasm |
| URP4 | LOC_Os03g16050.1 | Chr3:8841268..8843069 | Fructose-1,6-bisphosphatase | 43.6/5.0 | RM14709 | Phosphoric ester hydrolase activity | Carbohydrate metabolic process | Chloroplast |
| URP5 | LOC_Os02g06300 | Chr2:3143758..3152627 | Translation factor | 77.15/5.83 | RM12492 | GTPase activity | GTP binding | Chloroplast/Mitochondria |
| URP6 | LOC_Os08g35310.1 | Chr8:22277856..22279955 | O-methyltransferase | 38.46/5.64 | RM23235 | O-methyltransferase activity | Protein dimerization activity | Cytoplasm |
| URP7 | LOC_Os06g39712.1 | Chr6:23574363..23575246 | OsClp10-Putative Clp protease homologue | 24.74/4.64 | RM20351 | Serine-type endo peptidase activity | Proteolysis | Chloroplast |
| URP8 | LOC_Os12g19381 | Chr12:11262563..11278448 | Ribulose bisphosphate carboxylase small chain | 19.63/9.03 | RM27952 | Monooxygenase activity, copper ion binding | Photorespiration, photosynthesis | Chloroplast |
| URP9 | LOC_Os07g08840 | Chr7:4574245..4576234 | Thioredoxin | 13.15/5.17 | RM21102 | Protein disulfide oxido reductase activity | Cell redox homeostasis | Cytoplasm |
| URP10 | LOC_Os03g53740 | Chr3:30809029..30810138 | Protein not annotated (Hypothetical protein OSJNBa0069E14) | 18.551/5.0 | RM15932 | - | Systemic acquired resistance, salicylic acid mediated signaling pathway | Mitochondria |
| DRP1 | LOC_Os03g36540.1 | Chr3:20247674..20250146 | Magnesium-chelatase subunit chlI | 44.85/5.51 | RM15319 | Nucleoside-triphosphatase activity | Porphyrin-containing compound biosynthetic process | Chloroplast |
| DRP2 | LOC_Os11g10480.1 | Chr11:5712641..5716288 | Alcohol dehydrogenase | 40.984/6.20 | RM26250 | Zinc ion binding | Oxidation–reduction process | Cytoplasm |
| DRP3 | LOC_Os03g03910.1 | Chr3:1787648..1790957 | Catalase domain containing protein | 56.76/6.93 | RM14344 | Catalase activity, Heme binding | Oxidation–reduction process | Peroxisome |
| DRP4 | LOC_Os10g21268.1 | Chr10:10861158..10862712 | Ribulose bisphosphate carboxylase large chain precursor | 53.71/6.58 | RM25277 | Magnesium ion binding | Carbon fixation | Cytoplasm |
| Spot ID | Sequence ID | Gene Location | Protein Name | Theoretical M.Wt (KDa)/pI | SSR | Putative Molecular Function | Putative Biological Process | Predicted Sub Cellular Localization |
|---|---|---|---|---|---|---|---|---|
| URP1 | LOC_Os03g11160.1 | Chr3:5749954..5750298 | Protein not annotated | 12.39/5.04 | RM14568 | Cysteine-type endopeptidase inhibitor activity | defense response | Secreted |
| URP2 | LOC_Os09g17740.1 | Chr9:10845678..10847156 | Chlorophyll A-B binding protein | 28.01/5.14 | RM24092 | - | Photosynthesis | Chloroplast |
| URP3 | LOC_Os12g39980.1 | Chr12:24703185..24719302 | Kinesin motor domain containing protein | 316.6/5.0 | RM28598 | Microtubule motor activity | microtubule-based movement | Plasma Membrane |
| URP4 | LOC_Os05g51830.1 | Chr5:29753361..29756325 | ZOS5-12-C2H2 zinc finger protein | 32.54/4.53 | RM19225 | Metal ion binding | - | Nucleus |
| DRP1 | LOC_Os04g31070.1 | Chr4:18560177..18564417 | Acyl carrier protein desaturase | 43.34/6.53 | RM16817 | Acyl-[acyl-carrier-protein] desaturase activity | Oxidation–reduction process, Fatty acid metabolic process | Chloroplast |
| DRP2 | LOC_Os10g28840.1 | Chr10:15036094..15036951 | Speckle-type POZ protein | 30.60/5.57 | RM25449 | Protein binding | - | Chloroplast |
| Spot ID | Sequence ID | Gene Location | Theoretical M.Wt (KDa)/pI | Protein Name | Putative molecular function | Putative Biological Process | Predicted Sub Cellular Localization |
|---|---|---|---|---|---|---|---|
| URP1 | MLOC_75166.4 | 7:256555607-256557498 | 41.8/5.4 | Heat shock transcription factor | Sequence-specific DNA binding transcription factor activity | Responds to heat | Nucleus |
| URP2 | MLOC_81876.1.1 | 2:600305903-600309626 | 53.1/4.8 | Peptidase CIA, Pepain | Cysteine-type peptidase activity | Proteolysis | Vacuole |
| URP3 | MLOC_78630.1 | 2:510753217-510754262 | 34.4/5.5 | Photosystem II PsbO | Calcium ion binding | Photosynthesis | Chloroplast |
| URP4 | MLOC_52332.1 | 7:136313164-136314932 | 35.5/4.4 | Ribonucleotide reductase small subunit | Deoxy ribonucleoside diphosphate metabolic process | Oxidation–reduction process | Cytoplasm |
| DRP1 | MLOC_945.1 | 5:524670853-524671657 | 28.8/5.6 | Chlorophyll A-B binding protein | Chlorophyll binds, Metal ion binding | Photosynthesis, light harvesting | Chloroplast |
| DRP2 | MLOC_71259.1 | 7:500270477-500271934 | 49/5.7 | -- | Catalytic activity | -- | Cytoplasm |
Publisher’s Note: MDPI stays neutral with regard to jurisdictional claims in published maps and institutional affiliations. |
© 2022 by the authors. Licensee MDPI, Basel, Switzerland. This article is an open access article distributed under the terms and conditions of the Creative Commons Attribution (CC BY) license (https://creativecommons.org/licenses/by/4.0/).
Share and Cite
Shamim, M.; Sharma, D.; Bisht, D.; Maurya, R.; Kaashyap, M.; Srivastava, D.; Mishra, A.; Kumar, D.; Kumar, M.; Juturu, V.N.; et al. Proteo-Molecular Investigation of Cultivated Rice, Wild Rice, and Barley Provides Clues of Defense Responses against Rhizoctonia solani Infection. Bioengineering 2022, 9, 589. https://doi.org/10.3390/bioengineering9100589
Shamim M, Sharma D, Bisht D, Maurya R, Kaashyap M, Srivastava D, Mishra A, Kumar D, Kumar M, Juturu VN, et al. Proteo-Molecular Investigation of Cultivated Rice, Wild Rice, and Barley Provides Clues of Defense Responses against Rhizoctonia solani Infection. Bioengineering. 2022; 9(10):589. https://doi.org/10.3390/bioengineering9100589
Chicago/Turabian StyleShamim, Md., Divakar Sharma, Deepa Bisht, Rashmi Maurya, Mayank Kaashyap, Deepti Srivastava, Anurag Mishra, Deepak Kumar, Mahesh Kumar, Vijaya Naresh Juturu, and et al. 2022. "Proteo-Molecular Investigation of Cultivated Rice, Wild Rice, and Barley Provides Clues of Defense Responses against Rhizoctonia solani Infection" Bioengineering 9, no. 10: 589. https://doi.org/10.3390/bioengineering9100589