

Effectiveness of Remote PPG Construction Methods: A Preliminary Analysis


Abstract
:1. Introduction
2. Methodology
2.1. Dataset
- 1
- Resting. The participant is seated indoors with only minimal head movement.
- 2
- Gym. The participant is doing an indoor workout on a bicycle ergometer.
- 3
- Talk. The participant engaged in a conversation in an urban scenario with natural light.
- 4
- Rotation. The participant made arbitrary head movements while indoors.
2.2. Evaluation Metric
2.2.1. DTW Distance
2.2.2. Beats-per-Minute Difference ()
2.2.3. Correlation (r)
2.2.4. Overall Evaluation Score
3. Results
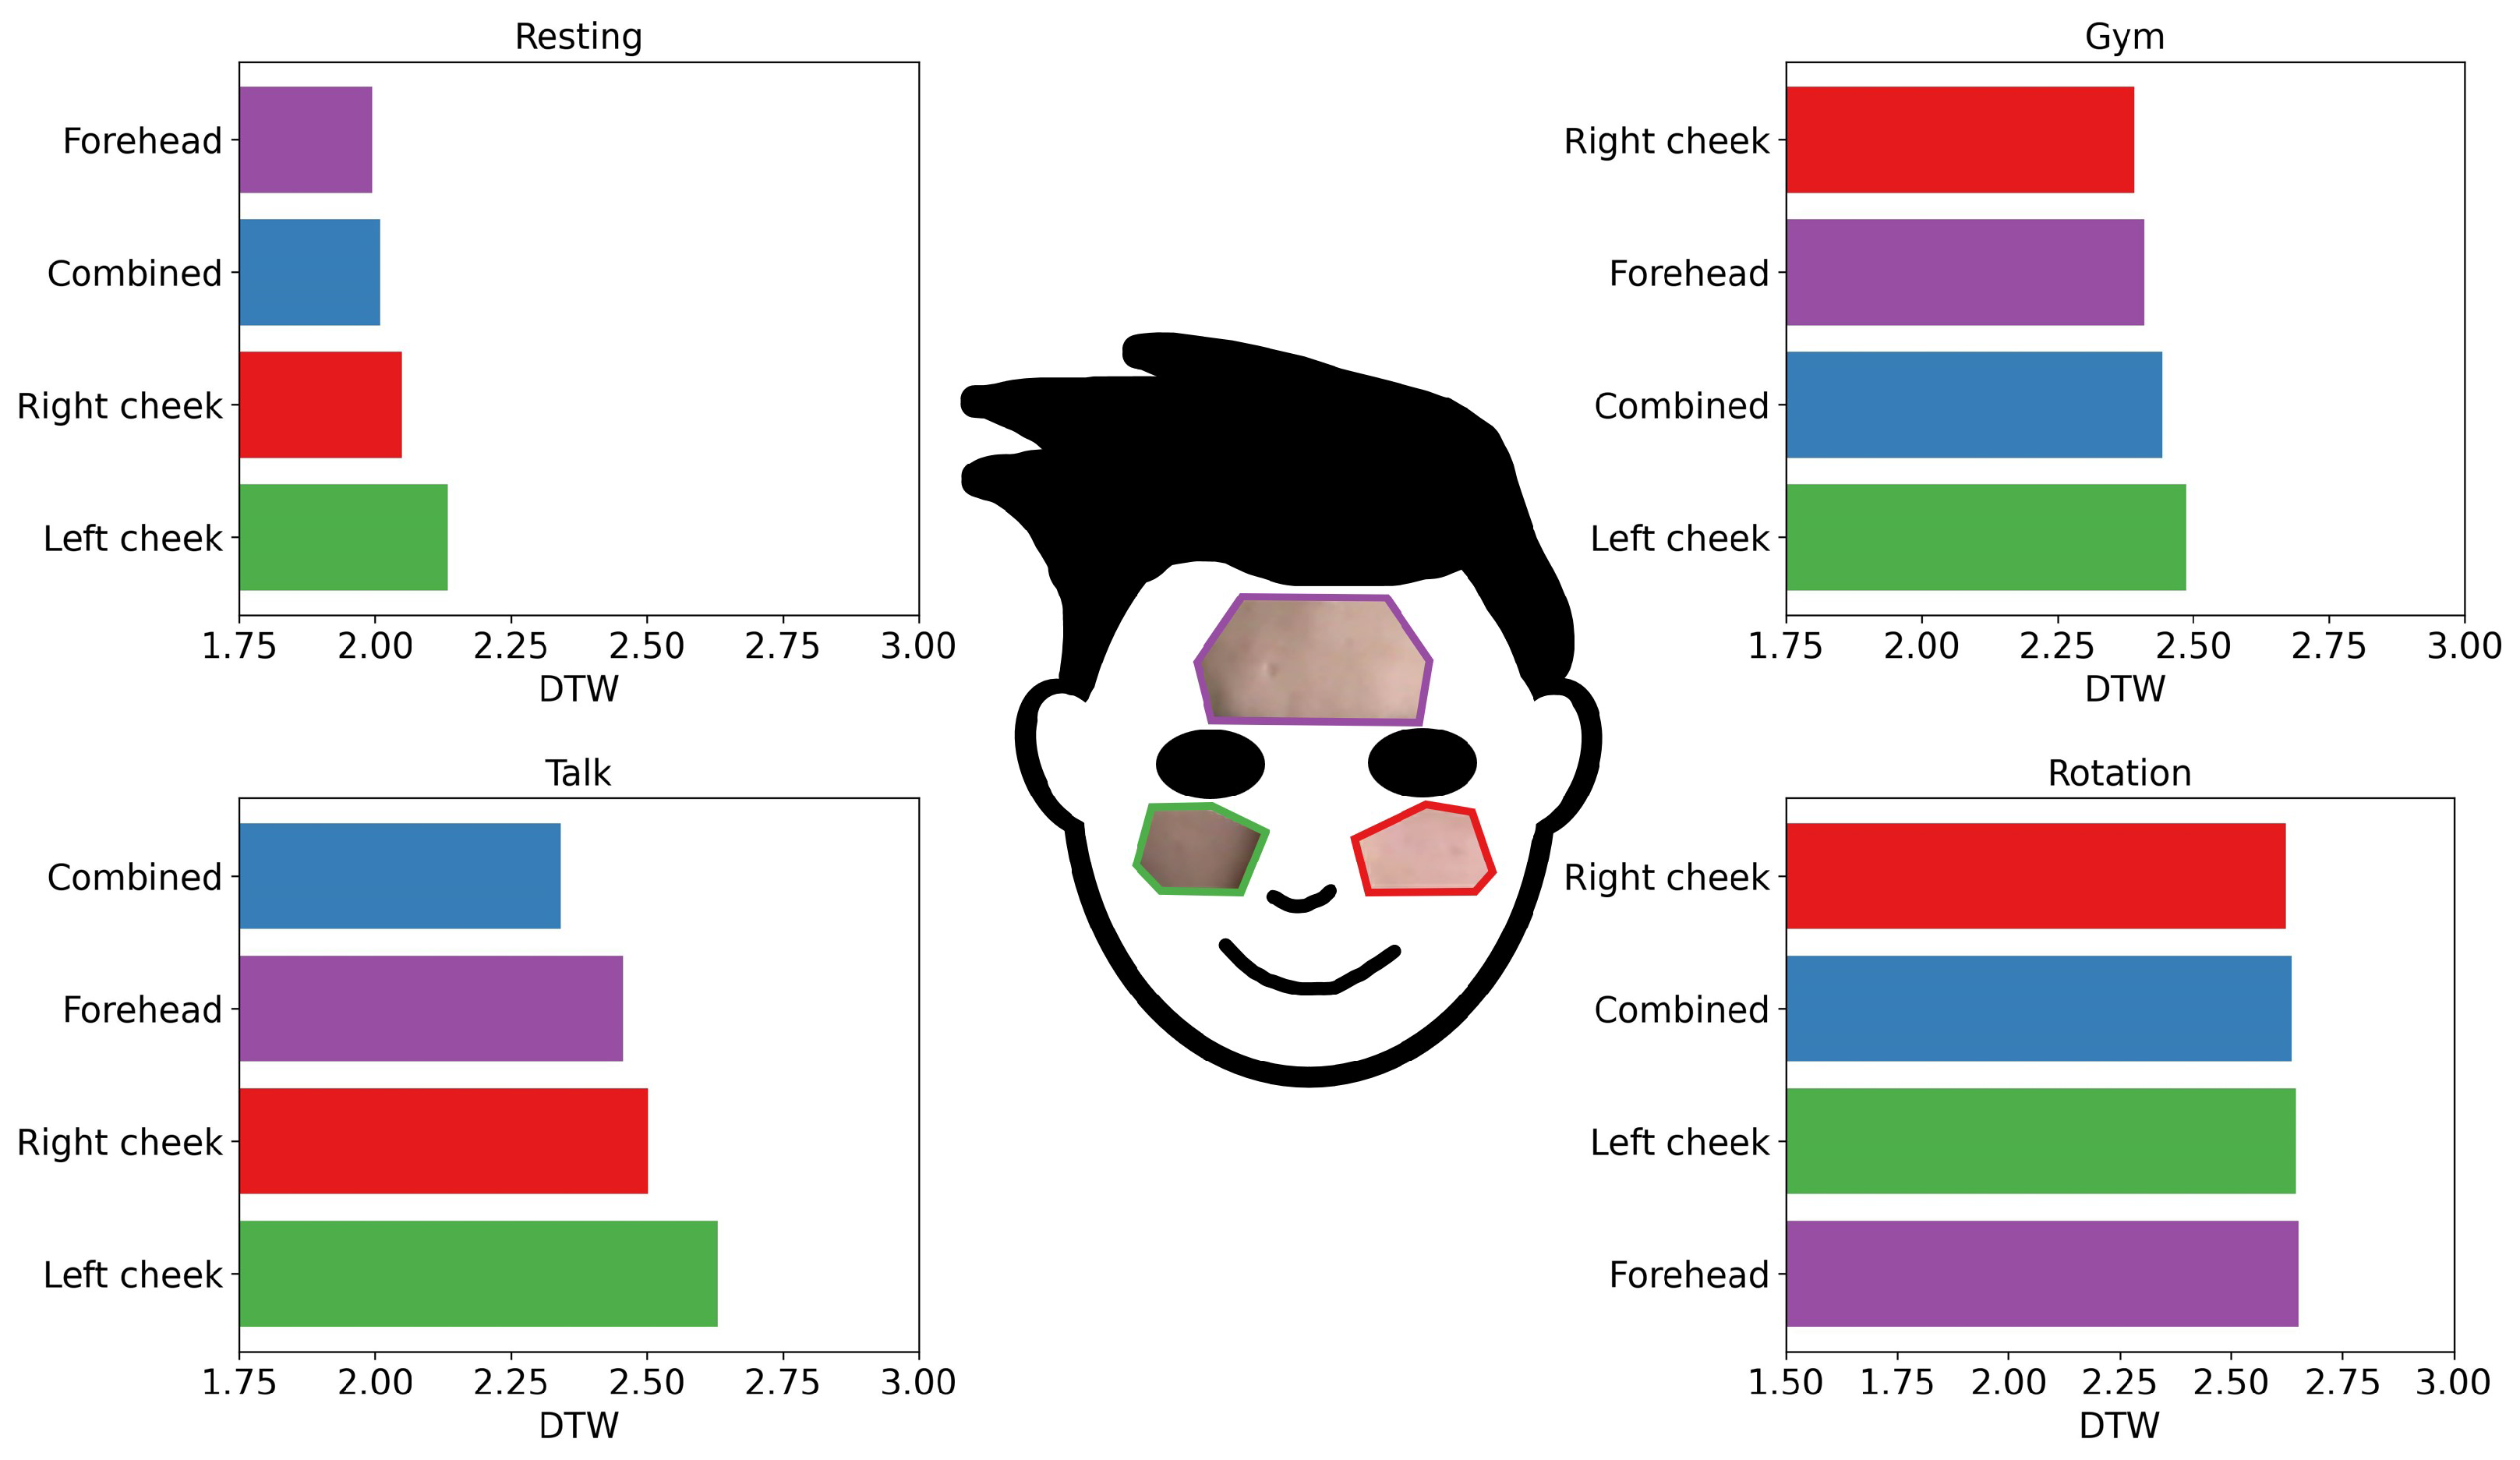
3.1. DTW Evaluation
3.1.1. Different ROIs
3.1.2. Different Video Activities
3.1.3. Beats-per-Minute Difference ()
3.1.4. Correlation (r)

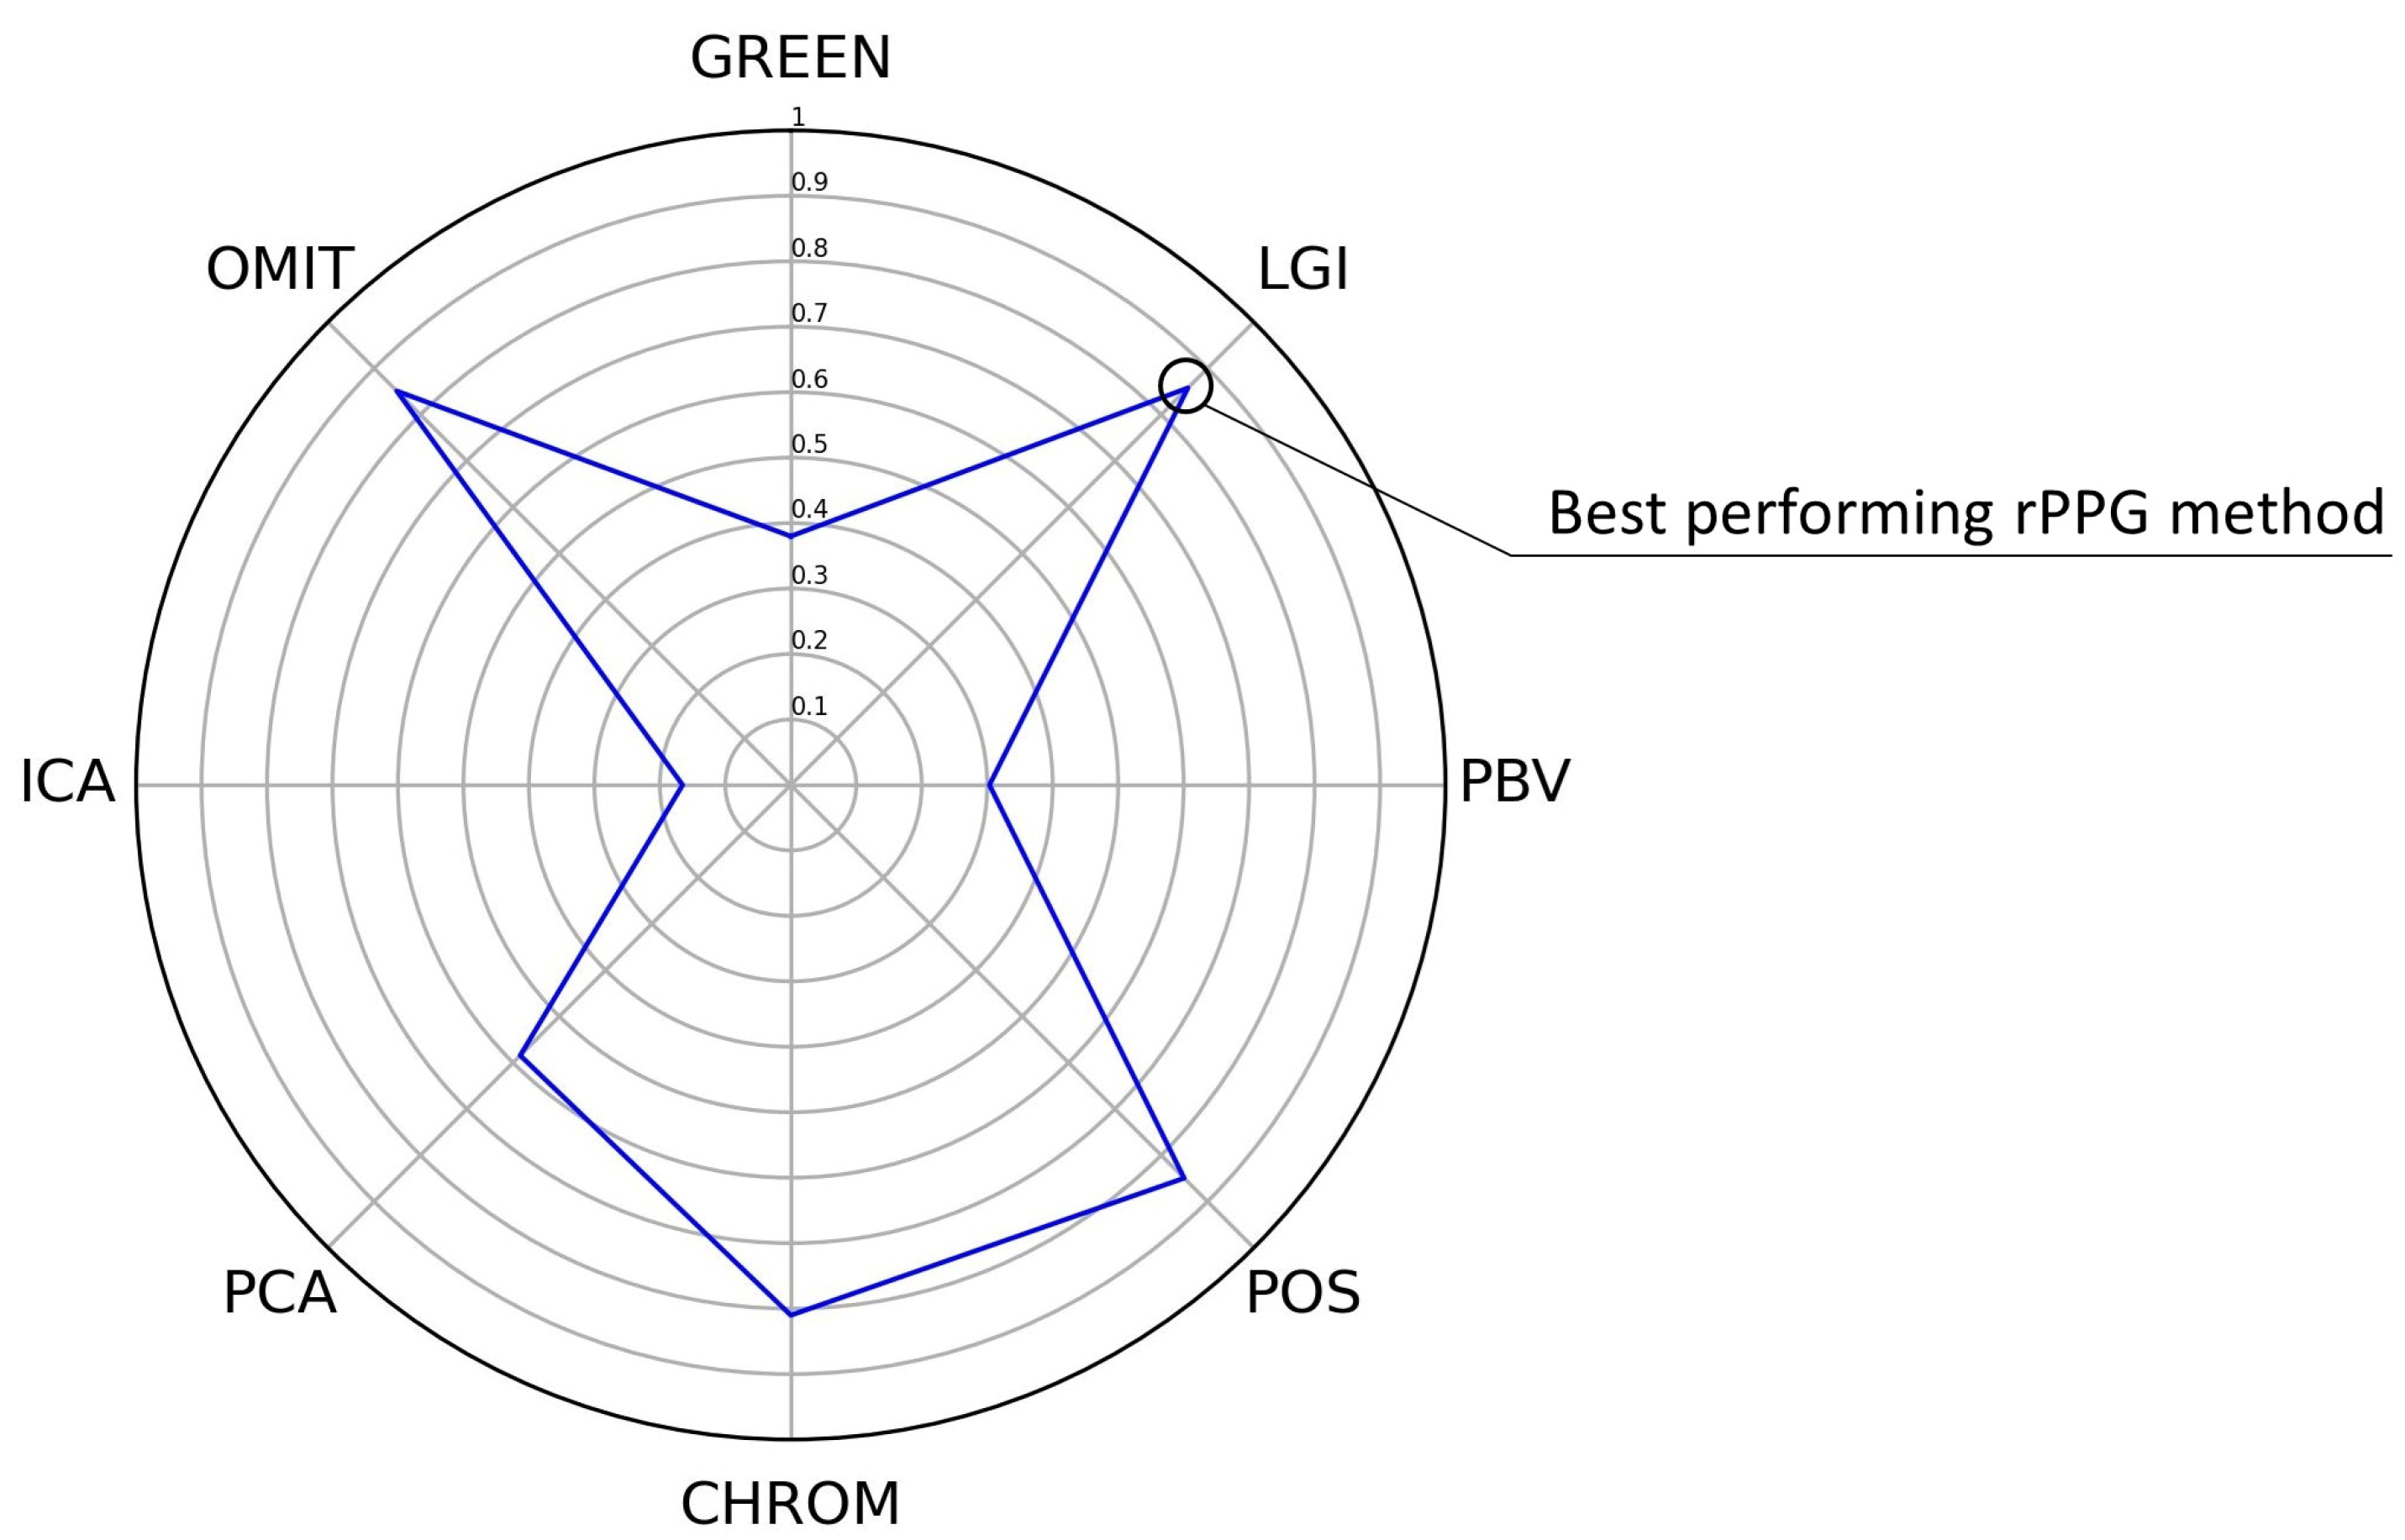
3.2. Best rPPG Method Overall
4. Discussion
- 1
- We advise focusing research on optimal environmental conditions (minimal movement, constant light in front of the participant), as no high quality rPPG signal could be achieved with a good over a longer time widow (>1 min).
- 2
- We recommend using larger ROIs (such as forehead and cheeks) for challenging video activities (such as shifting background lights) and smaller ROIs (such as only a forehead) for easier activities.
- 3
- We suggest using DTW as an error metric for comparing different ROIs, rPPG methods, and filters, because it handles time offsets very well, and it is very suitable for comparing signals from the different methods.
- 4
- We advise using LGI, OMIT, or POS to obtain a high quality rPPG signal.
5. Conclusions
Author Contributions
Funding
Institutional Review Board Statement
Informed Consent Statement
Data Availability Statement
Conflicts of Interest
References
- Elgendi, M. PPG Signal Analysis: An Introduction Using MATLAB®; CRC Press: Boca Raton, FL, USA, 2020. [Google Scholar]
- Elgendi, M.; Fletcher, R.; Liang, Y.; Howard, N.; Lovell, N.H.; Abbott, D.; Lim, K.; Ward, R. The use of photoplethysmography for assessing hypertension. NPJ Digit. Med. 2019, 2, 60. [Google Scholar] [CrossRef] [PubMed]
- Bayoumy, K.; Gaber, M.; Elshafeey, A.; Mhaimeed, O.; Dineen, E.H.; Marvel, F.A.; Martin, S.S.; Muse, E.D.; Turakhia, M.P.; Tarakji, K.G.; et al. Smart wearable devices in cardiovascular care: Where we are and how to move forward. Nat. Rev. Cardiol. 2021, 18, 581–599. [Google Scholar] [CrossRef] [PubMed]
- Frey, L.; Menon, C.; Elgendi, M. Blood pressure measurement using only a smartphone. NPJ Digit. Med. 2022, 5, 86. [Google Scholar] [CrossRef] [PubMed]
- Steinman, J.; Barszczyk, A.; Sun, H.S.; Lee, K.; Feng, Z.P. Smartphones and Video Cameras: Future Methods for Blood Pressure Measurement. Front. Digit. Health 2021, 3, 770096. [Google Scholar] [CrossRef] [PubMed]
- Haugg, F.; Elgendi, M.; Menon, C. Assessment of Blood Pressure Using Only a Smartphone and Machine Learning Techniques: A Systematic Review. Front. Cardiovasc. Med. 2022, 9, 894224. [Google Scholar] [CrossRef]
- Kim, D.Y.; Lee, K.; Sohn, C.B. Assessment of ROI Selection for Facial Video-Based rPPG. Sensors 2021, 21, 7923. [Google Scholar] [CrossRef] [PubMed]
- Wang, W.; den Brinker, A.C.; Stuijk, S.; de Haan, G. Algorithmic Principles of Remote PPG. IEEE Trans. Biomed. Eng. 2016, 64, 1479–1491. [Google Scholar] [CrossRef]
- Müller, M. Dynamic time warping. In Information Retrieval for Music and Motion; Springer: Berlin/Heidelberg, Germany, 2007; pp. 69–84. [Google Scholar]
- Senin, P. Dynamic Time Warping Algorithm Review; Information and Computer Science Department, University of Hawaii: Honolulu, HI, USA, 2008; Volume 855, p. 40. [Google Scholar]
- Boccignone, G.; Conte, D.; Cuculo, V.; D’Amelio, A.; Grossi, G.; Lanzarotti, R. An Open Framework for Remote-PPG Methods and Their Assessment. IEEE Access 2020, 8, 216083–216103. [Google Scholar] [CrossRef]
- Luo, H.; Yang, D.; Barszczyk, A.; Vempala, N.; Wei, J.; Wu, S.J.; Zheng, P.P.; Fu, G.; Lee, K.; Feng, Z.P. Smartphone-Based Blood Pressure Measurement Using Transdermal Optical Imaging Technology. Circ. Cardiovasc. Imaging 2019, 12, e008857. [Google Scholar] [CrossRef]
- Rong, M.; Li, K. A Blood Pressure Prediction Method Based on Imaging Photoplethysmography in combination with Machine Learning. Biomed. Signal Process. Control 2021, 64, 102328. [Google Scholar] [CrossRef]
- Kwon, S.; Kim, J.; Lee, D.; Park, K. ROI analysis for remote photoplethysmography on facial video. In Proceedings of the 2015 37th Annual International Conference of the IEEE Engineering in Medicine and Biology Society (EMBC), Milan, Italy, 25–29 August 2015; pp. 4938–4941. [Google Scholar] [CrossRef]
- Kartynnik, Y.; Ablavatski, A.; Grishchenko, I.; Grundmann, M. Real-time Facial Surface Geometry from Monocular Video on Mobile GPUs. In Proceedings of the CVPR Workshop on Computer Vision for Augmented and Virtual Reality, Long Beach, CA, USA, 16–20 June 2019. [Google Scholar]
- Boccignone, G.; Conte, D.; Cuculo, V.; D’Amelio, A.; Grossi, G.; Lanzarotti, R.; Mortara, E. pyVHR: A Python framework for remote photoplethysmography. PeerJ Comput. Sci. 2022, 8, e929. [Google Scholar] [CrossRef] [PubMed]
- Verkruysse, W.; Svaasand, L.O.; Nelson, J.S. Remote plethysmographic imaging using ambient light. Opt. Express 2008, 16, 21434–21445. [Google Scholar] [CrossRef] [PubMed]
- Poh, M.Z.; McDuff, D.J.; Picard, R.W. Non-contact, automated cardiac pulse measurements using video imaging and blind source separation. Opt. Express 2010, 18, 10762–10774. [Google Scholar] [CrossRef] [PubMed]
- Lewandowska, M.; Rumiński, J.; Kocejko, T.; Nowak, J. Measuring pulse rate with a webcam—A non-contact method for evaluating cardiac activity. In Proceedings of the 2011 Federated Conference on Computer Science and Information Systems (FedCSIS), Szczecin, Poland, 18–21 September 2011; pp. 405–410. [Google Scholar]
- de Haan, G.; Jeanne, V. Robust Pulse Rate From Chrominance-Based rPPG. IEEE Trans. Biomed. Eng. 2013, 60, 2878–2886. [Google Scholar] [CrossRef]
- de Haan, G.; van Leest, A. Improved motion robustness of remote-PPG by using the blood volume pulse signature. Physiol. Meas. 2014, 35, 1913–1926. [Google Scholar] [CrossRef]
- Pilz, C.S.; Zaunseder, S.; Krajewski, J.; Blazek, V. Local Group Invariance for Heart Rate Estimation from Face Videos in the Wild. In Proceedings of the 2018 IEEE/CVF Conference on Computer Vision and Pattern Recognition Workshops (CVPRW), Salt Lake City, UT, USA, 18–22 June 2018; pp. 1335–13358. [Google Scholar] [CrossRef]
- Casado, C.; López, M. Face2PPG: An unsupervised pipeline for blood volume pulse extraction from faces. arXiv 2022, arXiv:2202.04101. [Google Scholar]
- Béres, S.; Hejjel, L. The minimal sampling frequency of the photoplethysmogram for accurate pulse rate variability parameters in healthy volunteers. Biomed. Signal Process. Control 2021, 68, 102589. [Google Scholar] [CrossRef]
- Meert, W.; Hendrickx, K.; Van Craenendonck, T.; Robberechts, P. DTAIDistance. 2020. Available online: https://zenodo.org/record/3981067#.YywkCUxByUl (accessed on 15 August 2022).
- Dasari, A.; Prakash, S.K.A.; Jeni, L.A.; Tucker, C.S. Evaluation of biases in remote photoplethysmography methods. NPJ Digit. Med. 2021, 4, 91. [Google Scholar] [CrossRef]
- Sinaki, F.Y.; Ward, R.; Abbott, D.; Allen, J.; Fletcher, R.R.; Menon, C.; Elgendi, M. Ethnic disparities in publicly-available pulse oximetry databases. Commun. Med. 2022, 2, 59. [Google Scholar] [CrossRef]
- Elgendi, M.; Fletcher, R.; Tomar, H.; Allen, J.; Ward, R.; Menon, C. The Striking Need for Age Diverse Pulse Oximeter Databases. Front. Med. 2021, 8, 782422. [Google Scholar] [CrossRef]


| rPPG Method | Summary |
|---|---|
| GREEN [17] | Of the three channels, the green channel is most like the PPG signal and can be used as its estimate. |
| ICA [18] | To recover three separate source signals, independent component analysis (ICA) is applied to the RGB signal. A significant rPPG signal was usually found in the second component. |
| PCA [19] | Principal component analysis (PCA) is applied to distinguish the rPPG signal from the RGB signal. |
| CHROM [20] | The chrominance (CHROM)-based method generates an rPPG signal by removing the noise caused by the light reflection using a ratio of the normalized color channels. |
| PBV [21] | PBV calculates the rPPG signal with blood volume pulse fluctuations in the RGB signal to identify the pulse-induced color changes from motion. |
| POS [8] | The plane-orthogonal-to-skin (POS) method uses the plane orthogonal to the skin tone in the RGB signal to extract the rPPG signal. |
| LGI [22] | The local group invariance (LGI) calculates an rPPG signal with a robust algorithm as a result of local transformations. |
| OMIT [23] | Orthogonal matrix image transformation (OMIT) recovers the rPPG signal by generating an orthogonal matrix with linearly uncorrelated components representing the orthonormal components in the RGB signal, relying on matrix decomposition. |
| ROI | Metric | Video Activity | CHROM | LGI | POS | PBV | PCA | GREEN | OMIT | ICA |
|---|---|---|---|---|---|---|---|---|---|---|
| Forehead | DTW | Resting | 1.85 | 1.91 | 2.07 | 2.11 | 1.98 | 1.92 | 1.91 | 2.20 |
| Gym | 2.33 | 2.27 | 2.27 | 2.44 | 2.51 | 2.66 | 2.27 | 2.52 | ||
| Talk | 2.11 | 2.27 | 2.40 | 2.59 | 2.45 | 2.79 | 2.27 | 2.78 | ||
| Rotation | 2.44 | 2.56 | 2.59 | 2.84 | 2.63 | 2.96 | 2.51 | 2.68 | ||
| Resting | 0.40 | 0.39 | 0.37 | 0.33 | 0.39 | 0.38 | 0.39 | 0.32 | ||
| Gym | 0.21 | 0.24 | 0.29 | 0.21 | 0.16 | 0.19 | 0.24 | 0.16 | ||
| Talk | 0.27 | 0.26 | 0.28 | 0.22 | 0.22 | 0.24 | 0.26 | 0.20 | ||
| Rotation | 0.18 | 0.19 | 0.17 | 0.13 | 0.18 | 0.11 | 0.19 | 0.13 | ||
| Resting | 2.01 | 2.01 | 2.10 | 2.46 | 2.03 | 2.24 | 2.01 | 8.20 | ||
| Gym | 16.38 | 11.03 | 7.57 | 23.38 | 29.01 | 25.55 | 11.01 | 29.01 | ||
| Talk | 4.62 | 8.52 | 9.20 | 13.49 | 8.32 | 9.34 | 7.85 | 21.34 | ||
| Rotation | 15.10 | 15.50 | 12.90 | 23.25 | 16.11 | 27.06 | 15.38 | 19.73 | ||
| Left cheek | DTW | Resting | 2.14 | 2.05 | 2.18 | 2.29 | 2.12 | 2.00 | 2.05 | 2.24 |
| Gym | 2.51 | 2.36 | 2.42 | 2.36 | 2.56 | 2.69 | 2.37 | 2.62 | ||
| Talk | 2.46 | 2.52 | 2.58 | 2.86 | 2.51 | 2.93 | 2.53 | 2.65 | ||
| Rotation | 2.31 | 2.70 | 2.59 | 2.72 | 2.63 | 2.90 | 2.73 | 2.59 | ||
| Resting | 0.35 | 0.37 | 0.36 | 0.24 | 0.35 | 0.34 | 0.37 | 0.25 | ||
| Gym | 0.18 | 0.20 | 0.23 | 0.20 | 0.14 | 0.19 | 0.20 | 0.17 | ||
| Talk | 0.21 | 0.21 | 0.24 | 0.18 | 0.20 | 0.21 | 0.21 | 0.17 | ||
| Rotation | 0.15 | 0.17 | 0.15 | 0.15 | 0.17 | 0.13 | 0.17 | 0.14 | ||
| Resting | 2.22 | 2.22 | 2.18 | 13.39 | 2.28 | 2.99 | 2.22 | 11.70 | ||
| Gym | 30.68 | 26.10 | 20.04 | 23.62 | 32.43 | 24.31 | 26.12 | 23.70 | ||
| Talk | 12.57 | 7.71 | 6.10 | 16.28 | 8.44 | 11.41 | 7.67 | 16.01 | ||
| Rotation | 21.97 | 18.66 | 14.91 | 23.80 | 19.31 | 23.15 | 19.25 | 26.61 | ||
| Right cheek | DTW | Resting | 1.96 | 1.95 | 2.14 | 2.12 | 2.06 | 1.93 | 1.95 | 2.28 |
| Gym | 2.28 | 2.28 | 2.35 | 2.33 | 2.47 | 2.67 | 2.27 | 2.47 | ||
| Talk | 2.36 | 2.36 | 2.41 | 2.54 | 2.44 | 2.86 | 2.36 | 2.68 | ||
| Rotation | 2.46 | 2.60 | 2.49 | 2.79 | 2.45 | 2.94 | 2.62 | 2.62 | ||
| Resting | 0.36 | 0.37 | 0.36 | 0.31 | 0.32 | 0.36 | 0.38 | 0.26 | ||
| Gym | 0.17 | 0.21 | 0.26 | 0.17 | 0.15 | 0.19 | 0.21 | 0.16 | ||
| Talk | 0.26 | 0.26 | 0.28 | 0.23 | 0.23 | 0.24 | 0.26 | 0.22 | ||
| Rotation | 0.13 | 0.15 | 0.14 | 0.12 | 0.14 | 0.13 | 0.15 | 0.12 | ||
| Resting | 2.85 | 2.87 | 2.60 | 4.01 | 2.85 | 2.34 | 2.85 | 23.25 | ||
| Gym | 18.01 | 19.29 | 15.46 | 23.44 | 35.87 | 31.51 | 19.31 | 28.65 | ||
| Talk | 4.68 | 7.34 | 8.77 | 11.25 | 7.08 | 10.68 | 7.36 | 8.79 | ||
| Rotation | 19.21 | 17.84 | 15.30 | 21.06 | 20.41 | 22.32 | 18.09 | 23.76 | ||
| Combined | DTW | Resting | 1.88 | 1.87 | 2.08 | 2.25 | 1.97 | 1.94 | 1.87 | 2.21 |
| Gym | 2.38 | 2.30 | 2.32 | 2.47 | 2.53 | 2.67 | 2.30 | 2.57 | ||
| Talk | 2.07 | 2.13 | 2.25 | 2.52 | 2.33 | 2.74 | 2.12 | 2.57 | ||
| Rotation | 2.41 | 2.57 | 2.54 | 2.91 | 2.58 | 3.02 | 2.57 | 2.48 | ||
| Resting | 0.41 | 0.39 | 0.36 | 0.32 | 0.40 | 0.41 | 0.39 | 0.34 | ||
| Gym | 0.21 | 0.25 | 0.30 | 0.21 | 0.16 | 0.20 | 0.25 | 0.18 | ||
| Talk | 0.27 | 0.27 | 0.27 | 0.19 | 0.23 | 0.25 | 0.27 | 0.20 | ||
| Rotation | 0.18 | 0.19 | 0.19 | 0.14 | 0.19 | 0.13 | 0.19 | 0.14 | ||
| Resting | 1.91 | 1.91 | 1.99 | 2.95 | 1.93 | 2.03 | 1.87 | 8.10 | ||
| Gym | 14.81 | 12.39 | 7.06 | 22.73 | 28.42 | 27.22 | 11.23 | 26.00 | ||
| Talk | 3.68 | 4.52 | 6.37 | 13.08 | 7.91 | 9.09 | 6.39 | 14.16 | ||
| Rotation | 18.84 | 15.12 | 14.44 | 26.16 | 15.60 | 28.06 | 16.72 | 22.38 |
| Video Activity | CHROM | LGI | POS | PBV | PCA | GREEN | OMIT | ICA |
|---|---|---|---|---|---|---|---|---|
| Resting | 0.98 | 1.00 | 0.74 | 0.30 | 0.84 | 0.96 | 1.00 | 0.00 |
| Gym | 0.58 | 0.78 | 0.96 | 0.51 | 0.14 | 0.19 | 0.78 | 0.23 |
| Talk | 0.91 | 0.85 | 0.86 | 0.21 | 0.60 | 0.38 | 0.84 | 0.09 |
| Rotation | 0.78 | 0.80 | 0.83 | 0.20 | 0.76 | 0.00 | 0.78 | 0.34 |
| Average | 0.81 | 0.86 | 0.85 | 0.30 | 0.58 | 0.38 | 0.85 | 0.17 |
Publisher’s Note: MDPI stays neutral with regard to jurisdictional claims in published maps and institutional affiliations. |
© 2022 by the authors. Licensee MDPI, Basel, Switzerland. This article is an open access article distributed under the terms and conditions of the Creative Commons Attribution (CC BY) license (https://creativecommons.org/licenses/by/4.0/).
Share and Cite
Haugg, F.; Elgendi, M.; Menon, C. Effectiveness of Remote PPG Construction Methods: A Preliminary Analysis. Bioengineering 2022, 9, 485. https://doi.org/10.3390/bioengineering9100485
Haugg F, Elgendi M, Menon C. Effectiveness of Remote PPG Construction Methods: A Preliminary Analysis. Bioengineering. 2022; 9(10):485. https://doi.org/10.3390/bioengineering9100485
Chicago/Turabian StyleHaugg, Fridolin, Mohamed Elgendi, and Carlo Menon. 2022. "Effectiveness of Remote PPG Construction Methods: A Preliminary Analysis" Bioengineering 9, no. 10: 485. https://doi.org/10.3390/bioengineering9100485