3D Printing of Gelled and Cross-Linked Cellulose Solutions; an Exploration of Printing Parameters and Gel Behaviour


Abstract
:1. Introduction
2. Materials and Methods
2.1. Chemicals
2.2. Preparation of Cellulose Formulation
2.3. Rheometry
2.4. Oscillatory Measurements
2.5. Rotational Measurements
2.6. Printing Parameters
3. Results
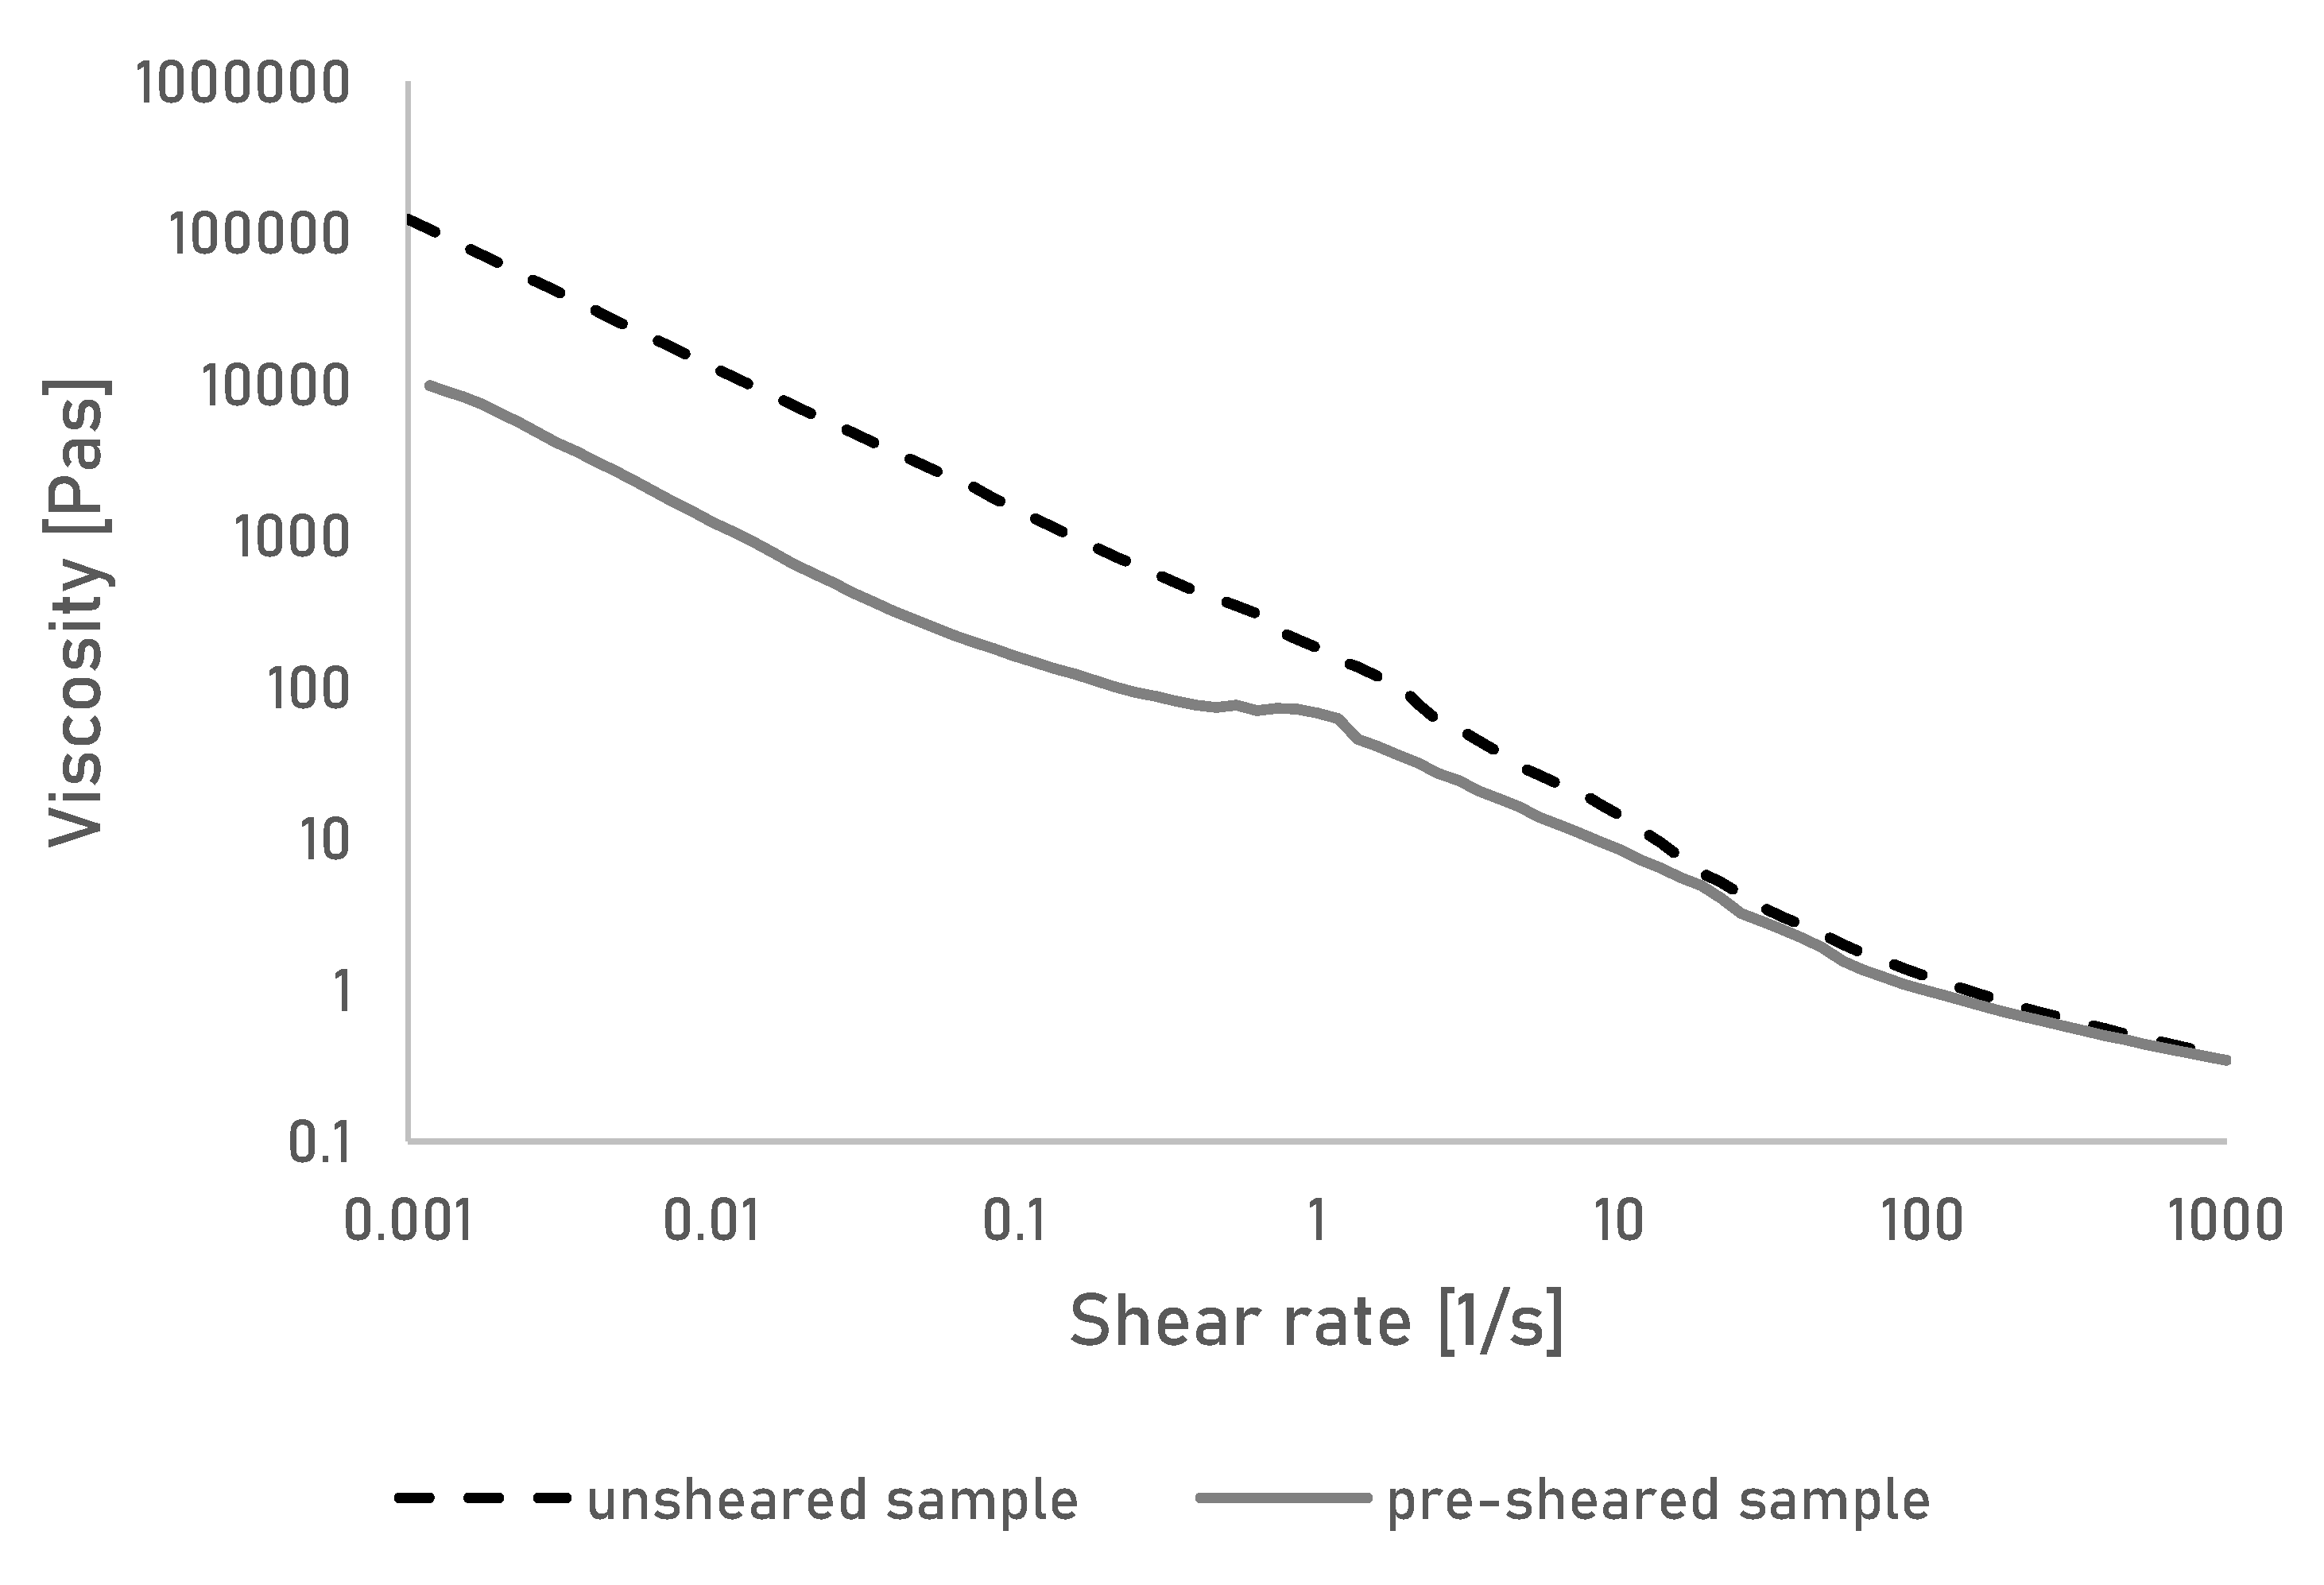
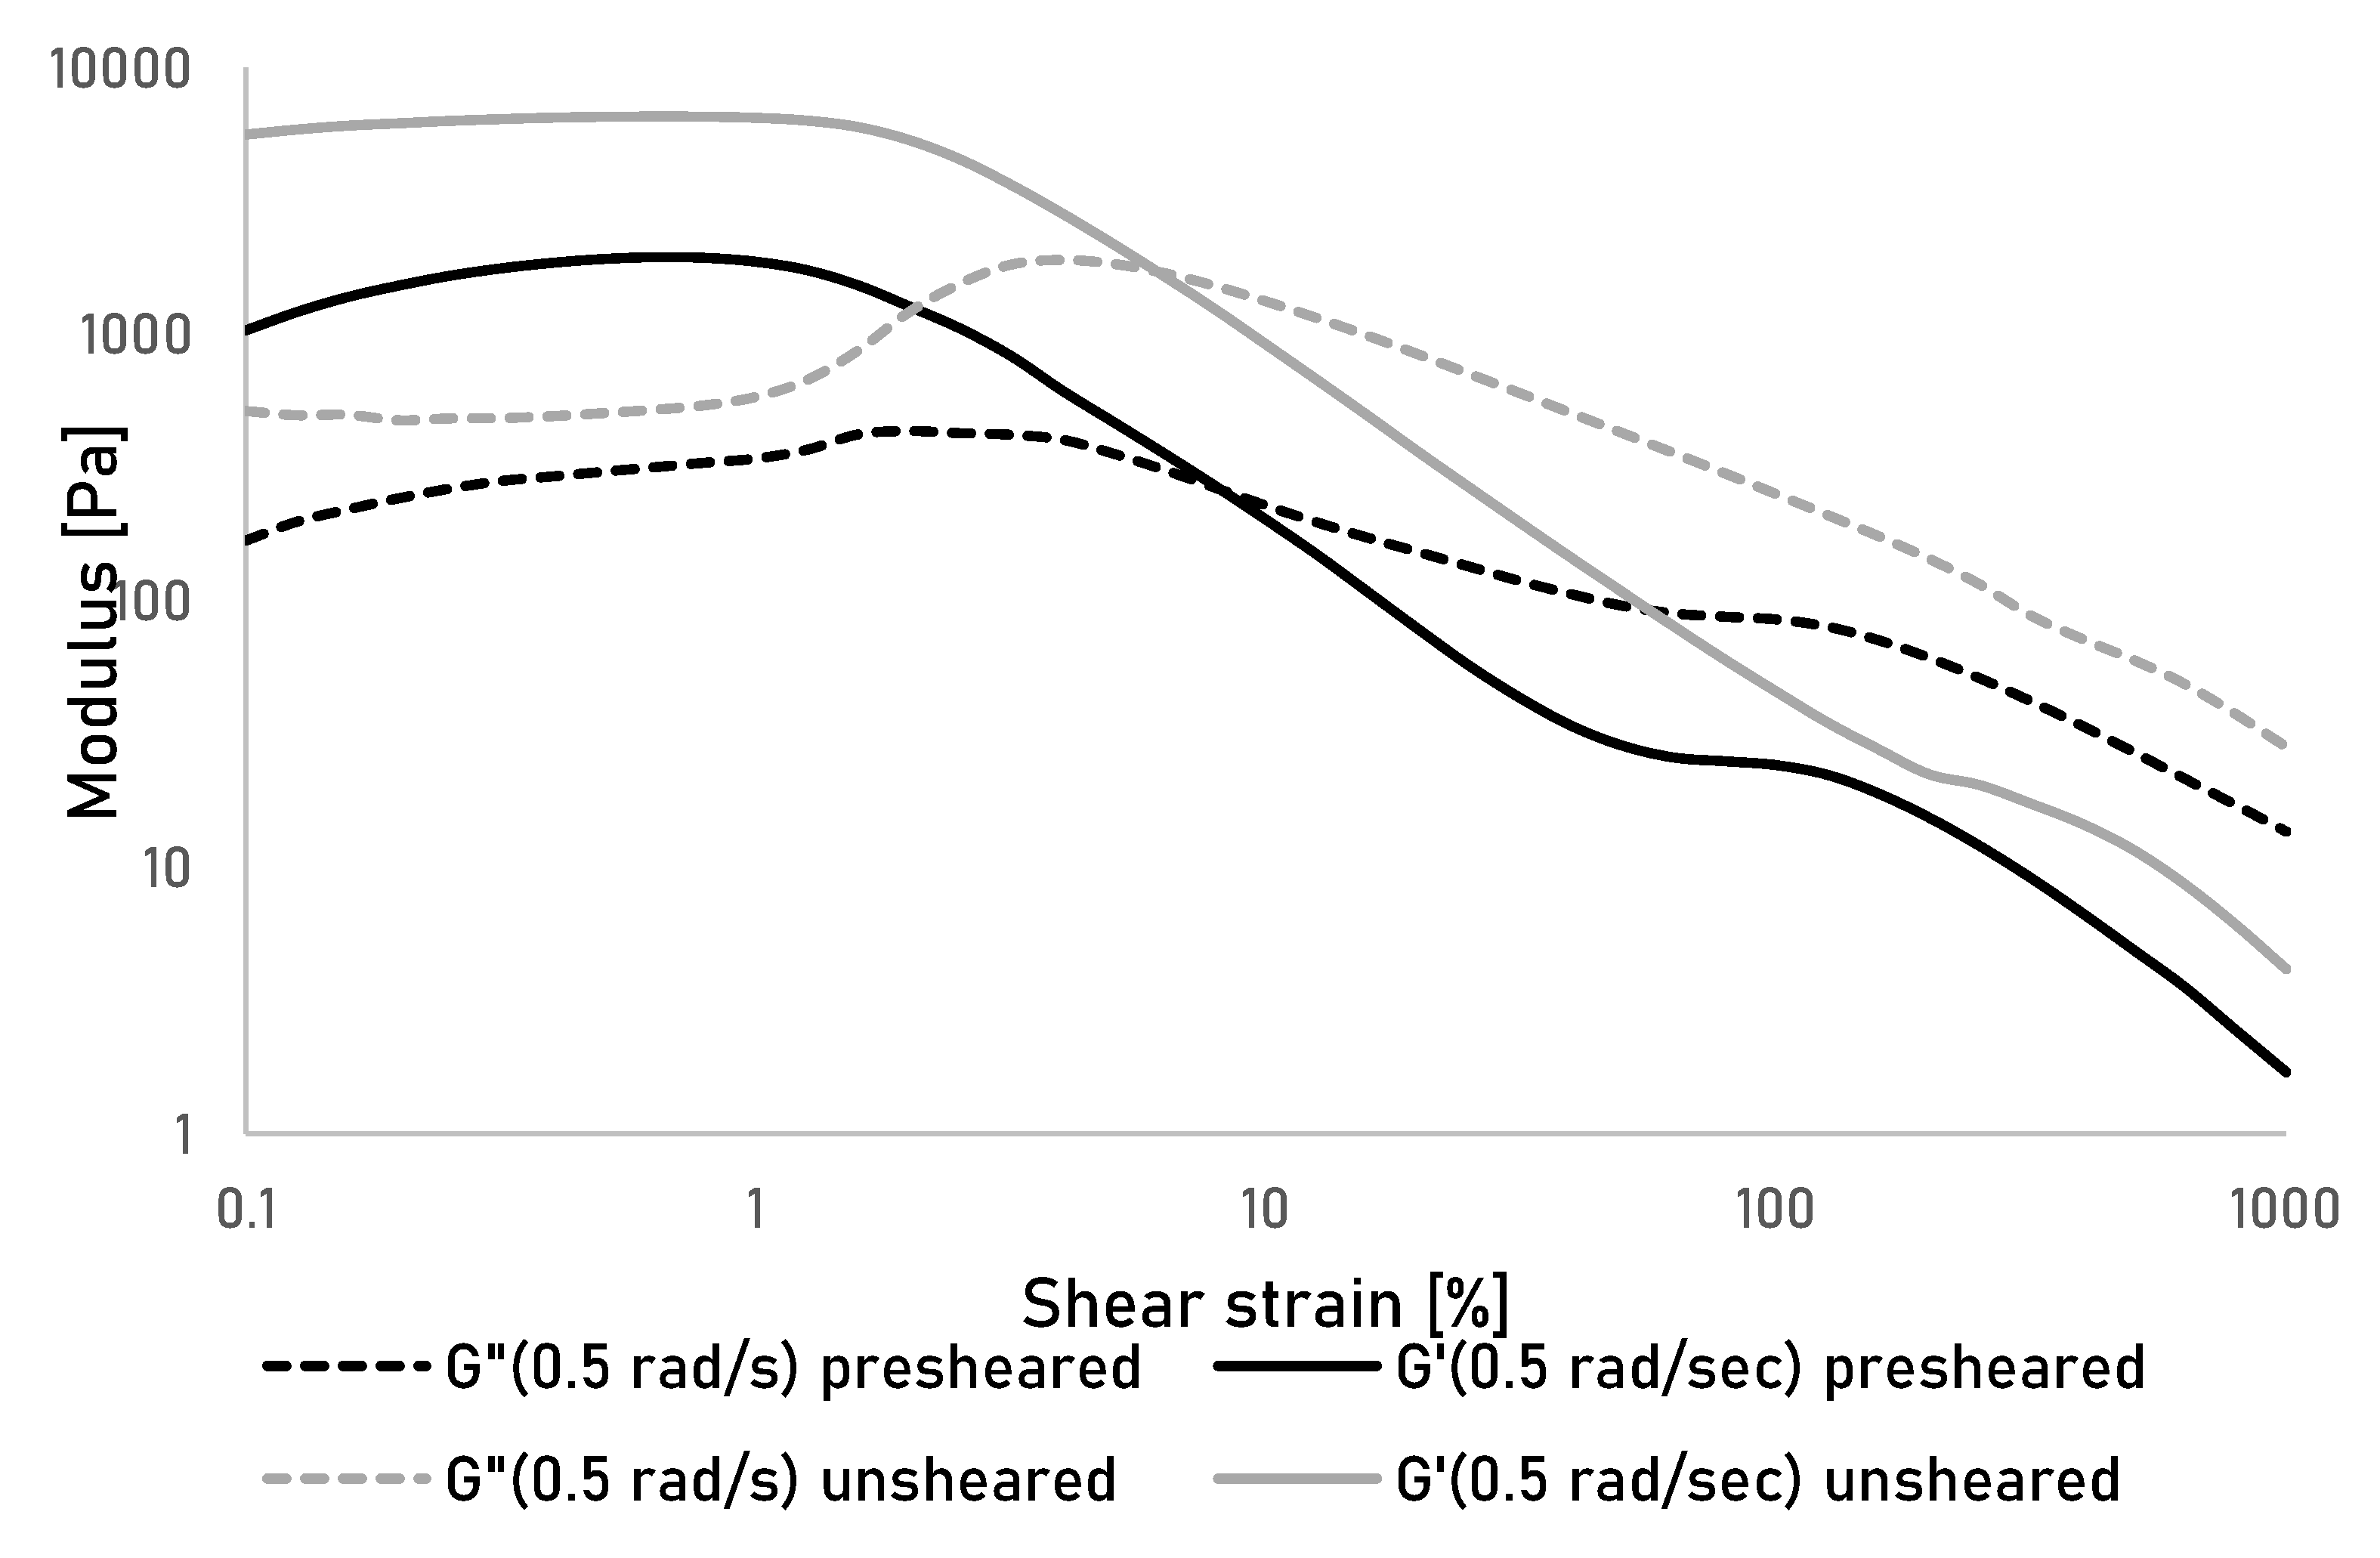
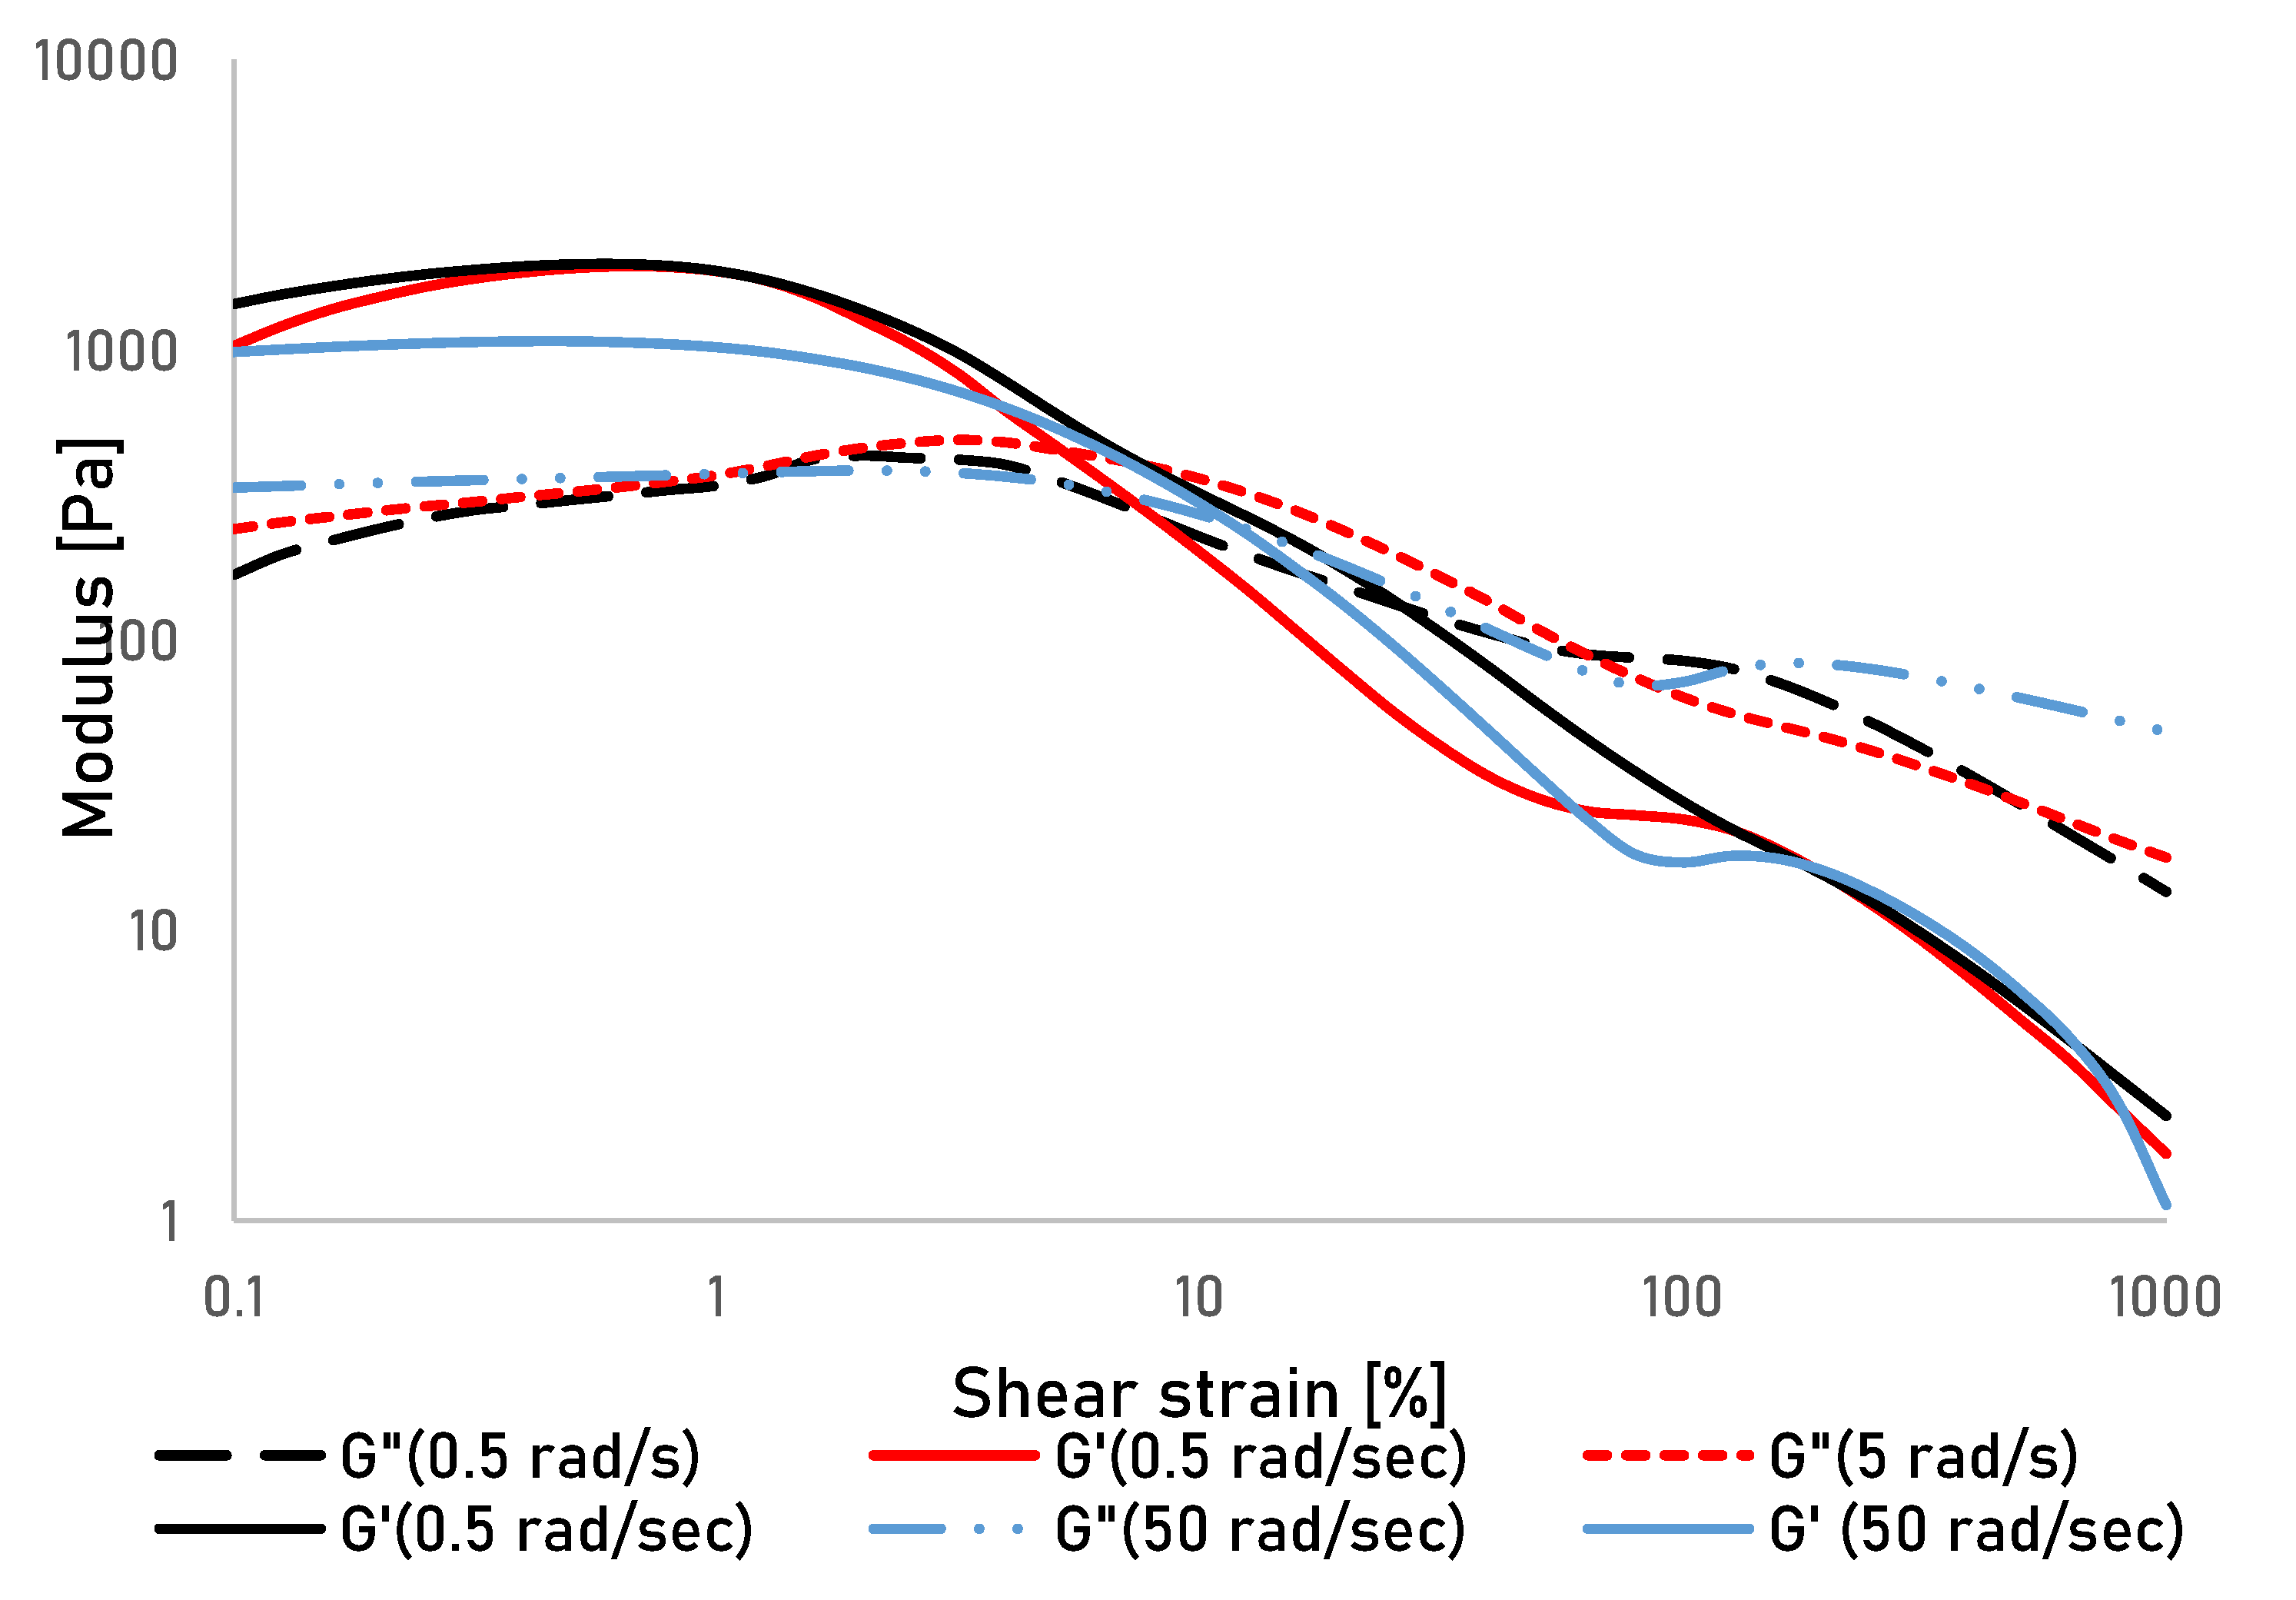
3.1. Rheometry
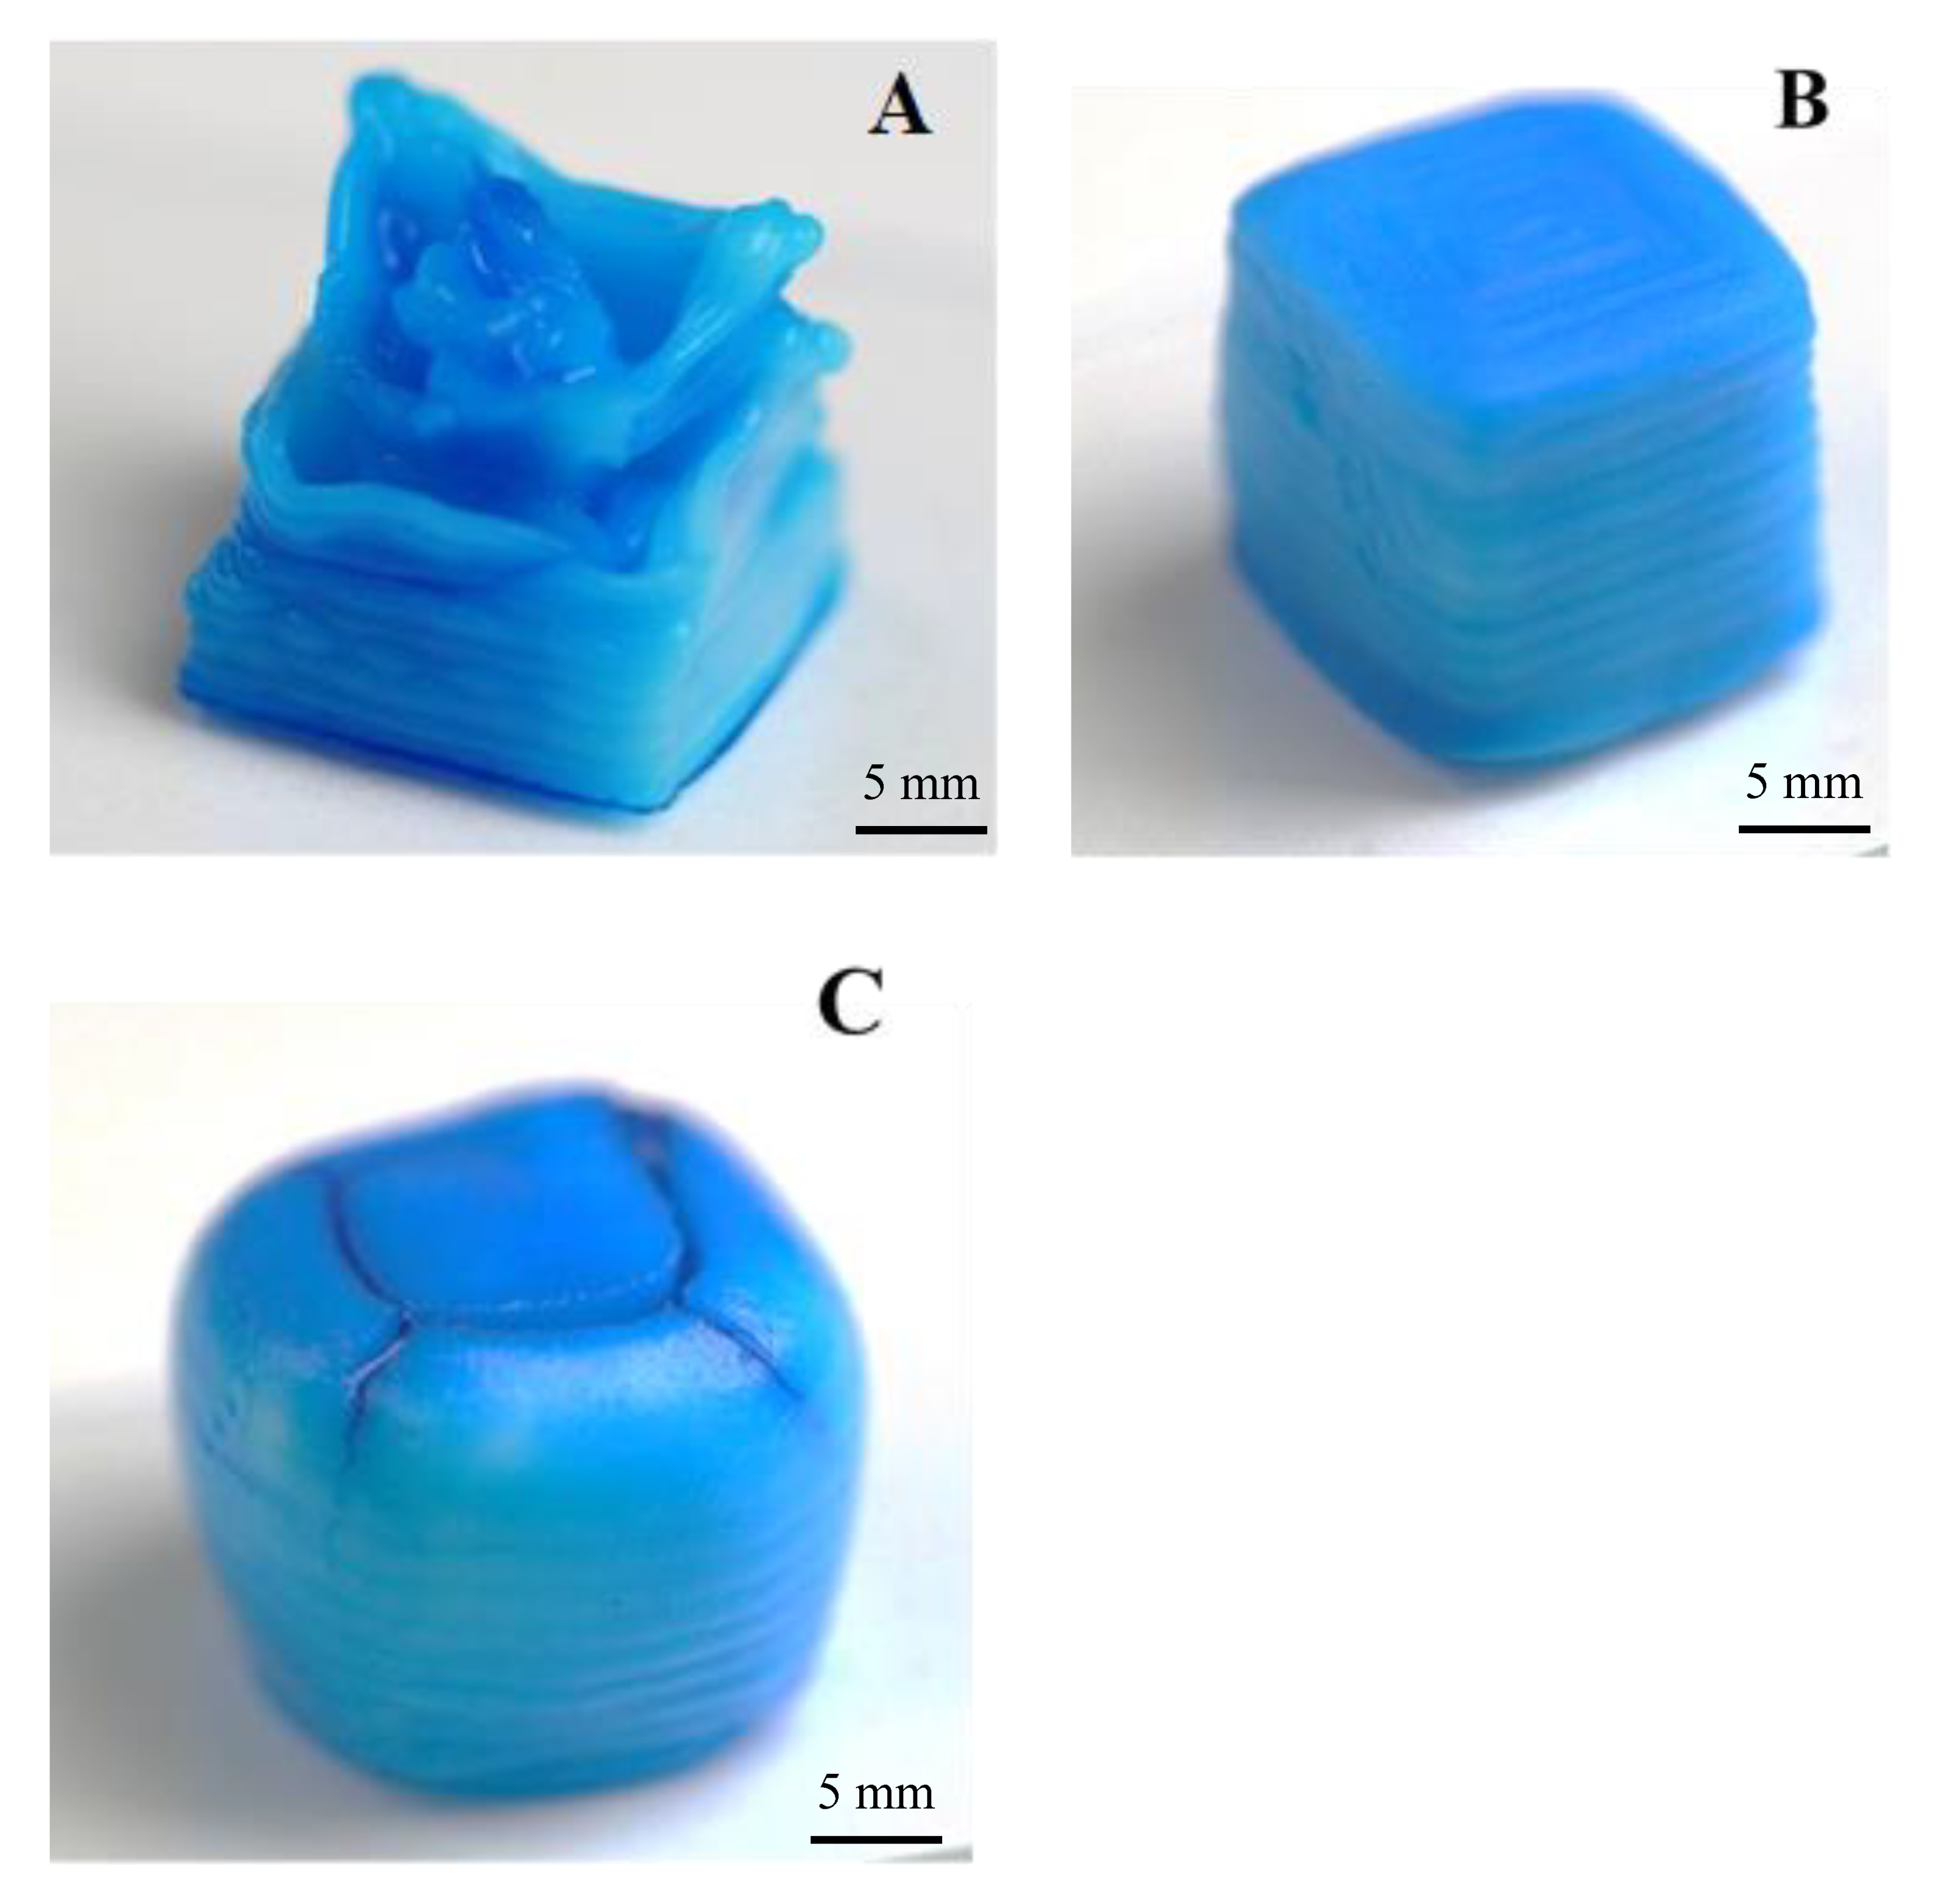
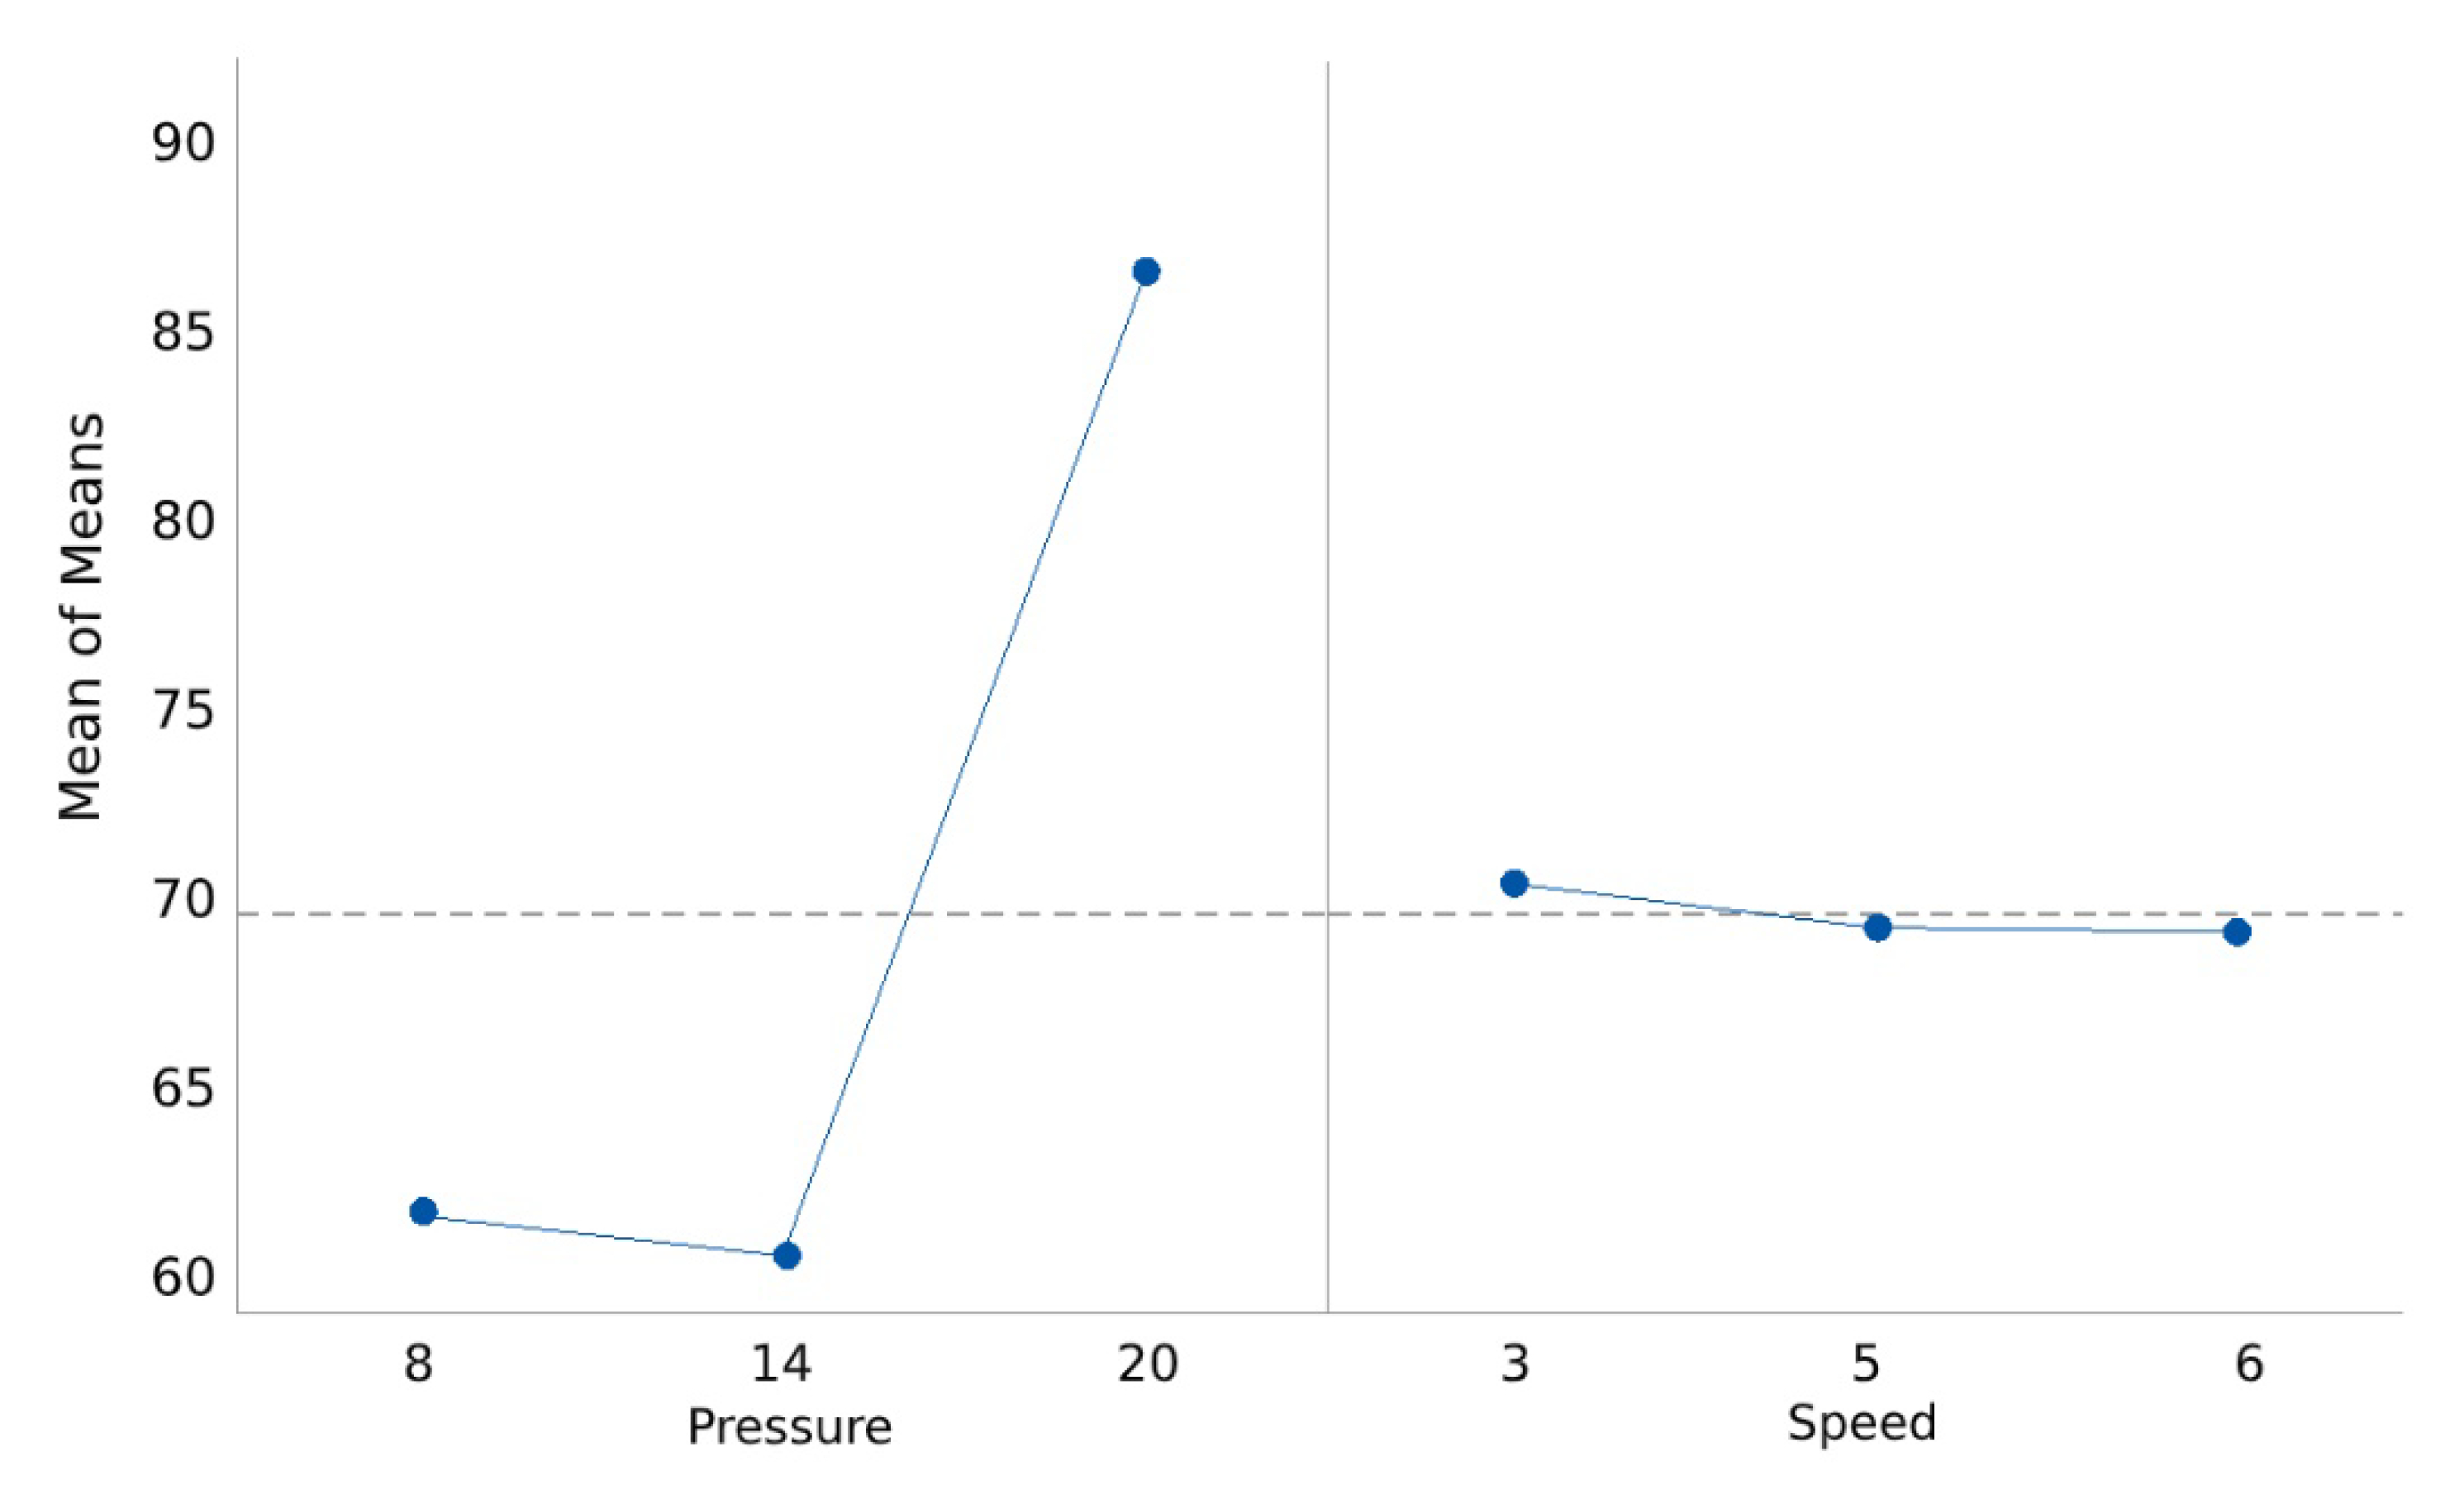
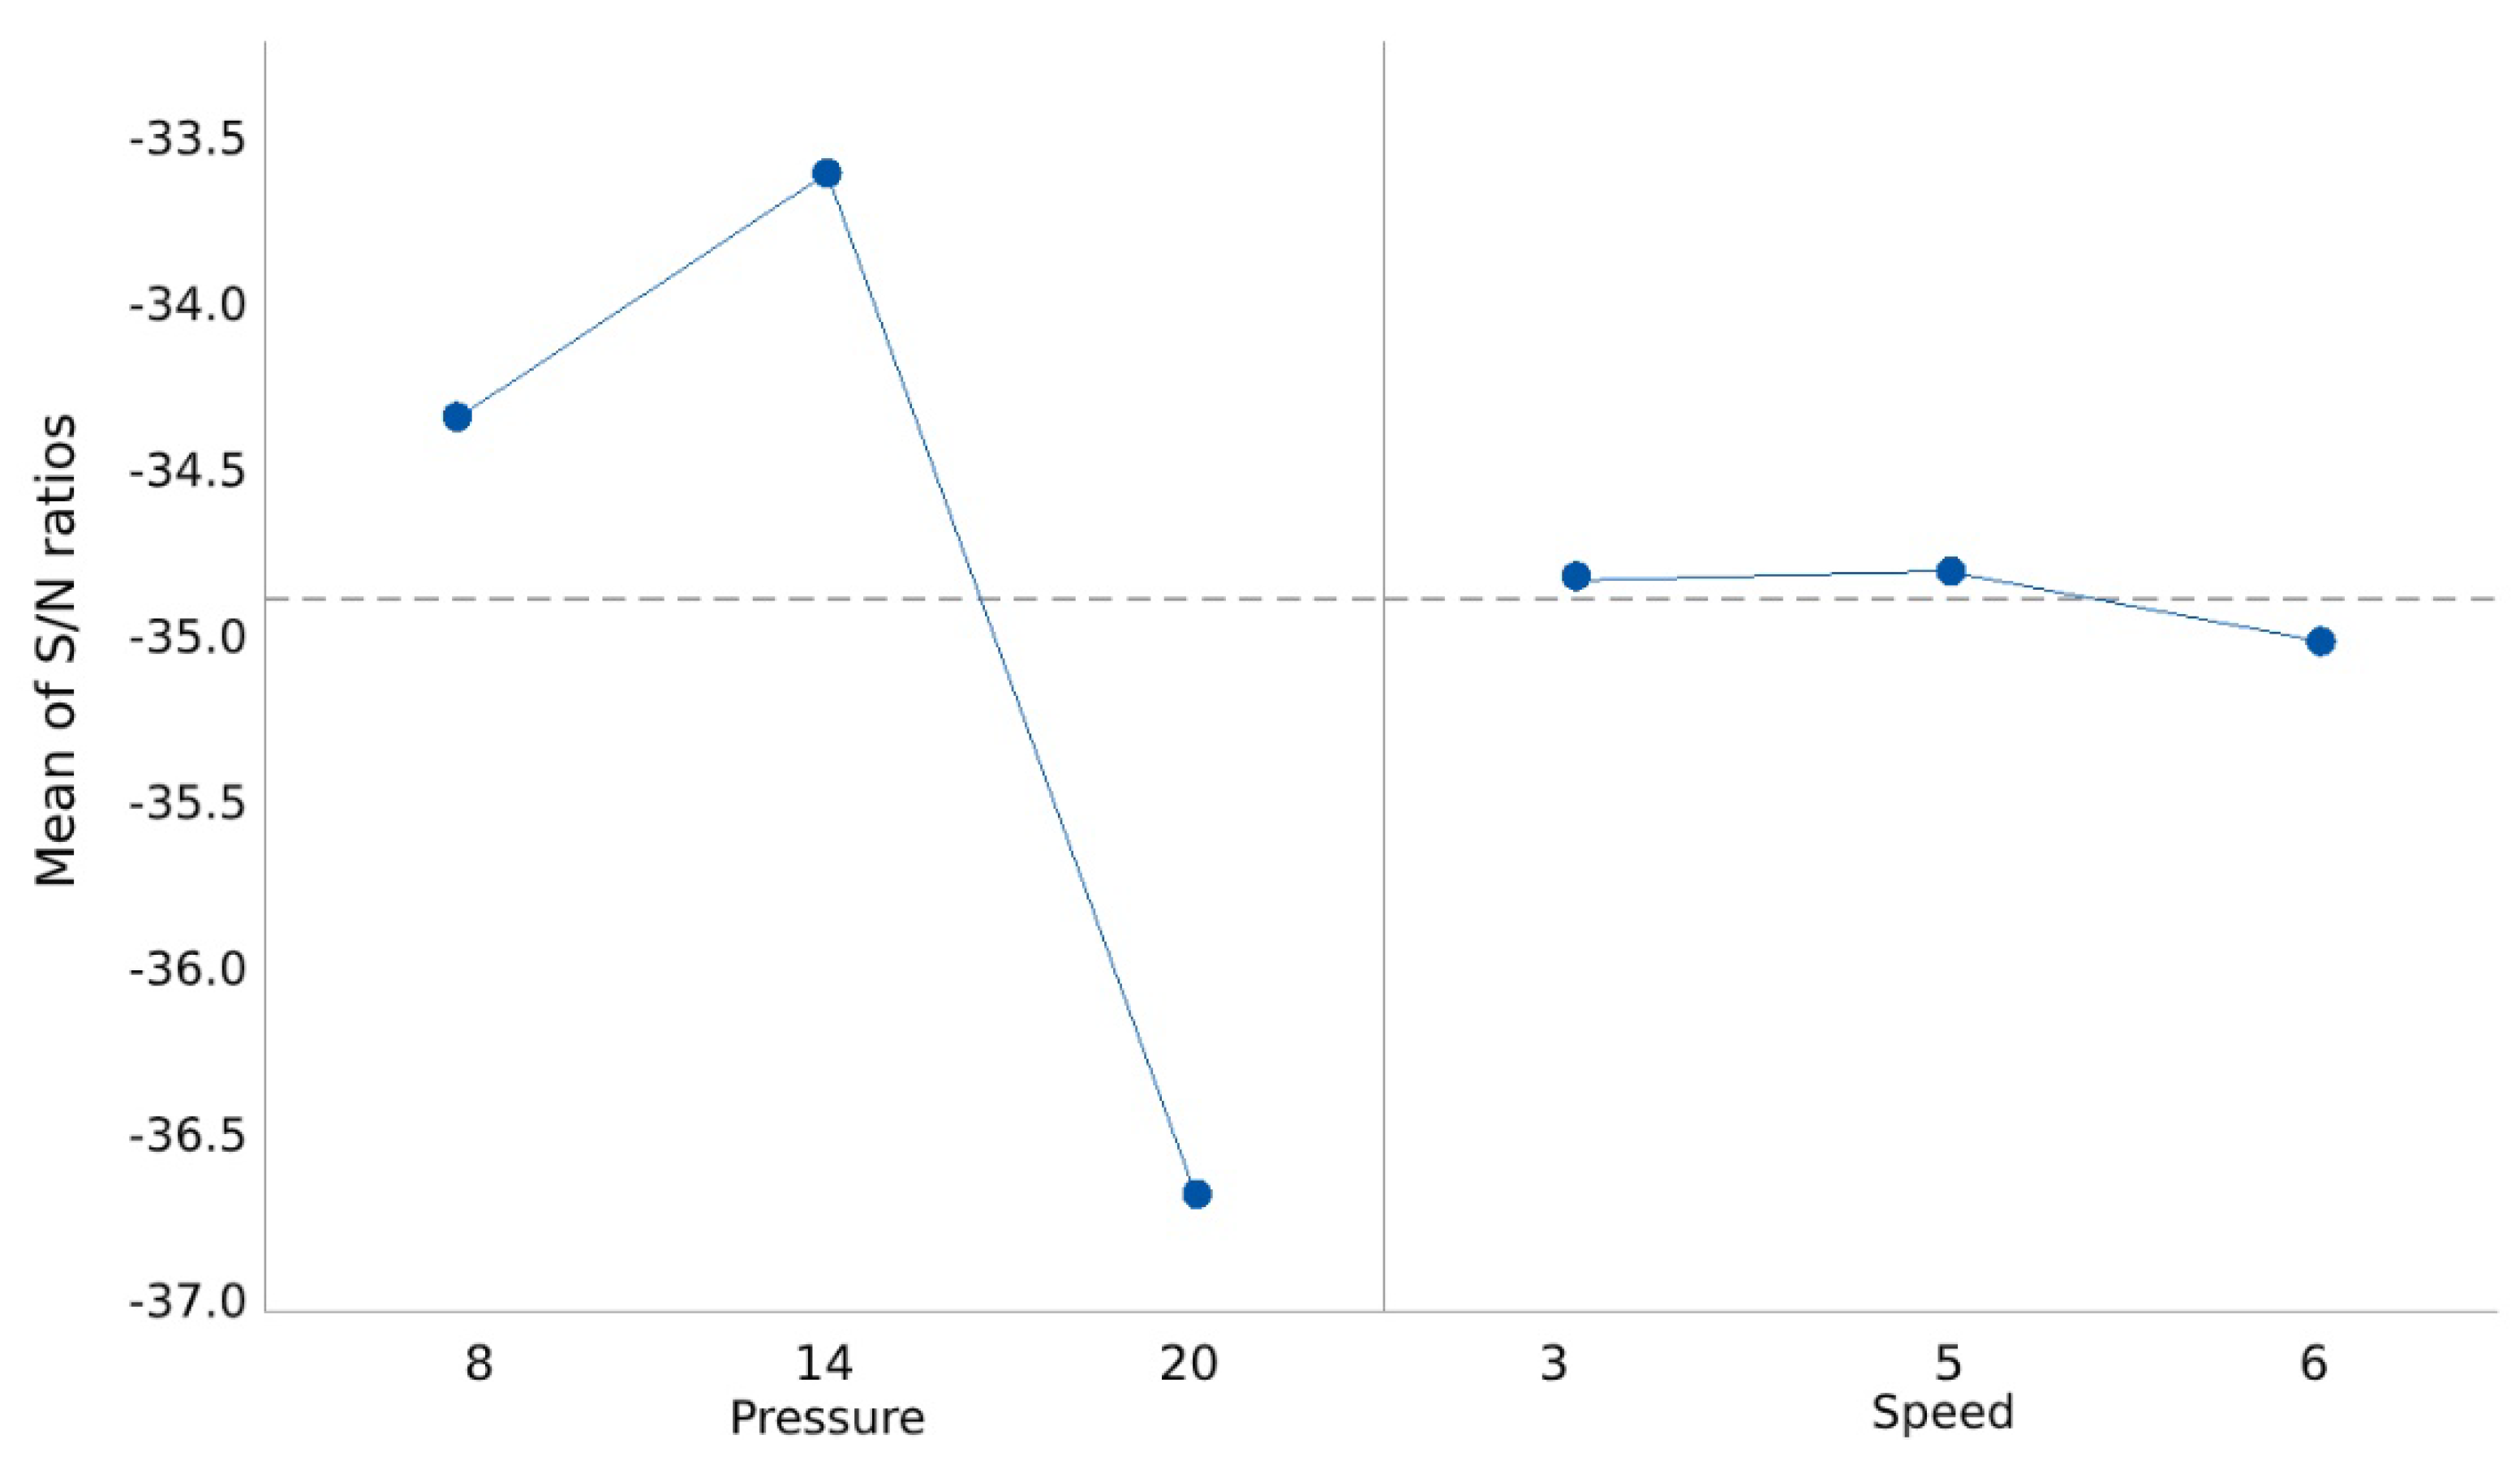
3.2. Taguchi Analysis of Printing Parameters
4. Conclusions
Author Contributions
Funding
Acknowledgments
Conflicts of Interest
References
- Bikas, H.; Stavropoulos, P.; Chryssolouris, G. Additive manufacturing methods and modelling approaches: A critical review. Int. J. Adv. Manuf. Technol. 2016, 83, 389–405. [Google Scholar] [CrossRef] [Green Version]
- Bhushan, B.; Caspers, M. An overview of additive manufacturing (3D printing) for microfabrication. Microsyst. Technol. 2017, 23, 1117–1124. [Google Scholar] [CrossRef]
- Ngo, T.D.; Kashani, A.; Imbalzano, G.; Nguyen, K.T.; Hui, D. Additive manufacturing (3D printing): A review of materials, methods, applications and challenges. Compos. Part B Eng. 2018, 143, 172–196. [Google Scholar] [CrossRef]
- Ozbolat, I.; Gudapati, H. A review on design for bioprinting. Bioprinting 2016, 3, 1–14. [Google Scholar] [CrossRef]
- Gudupati, H.; Dey, M.; Ozbolat, I. A Comprehensive Review on Droplet-based Bioprinting: Past, Present and Future. Biomaterials 2016, 102, 20–42. [Google Scholar] [CrossRef] [PubMed] [Green Version]
- Jian, H.; Wang, M.; Wang, S.; Wang, A.; Bai, S. 3D bioprinting for cell culture and tissue fabrication. Bio-Des. Manuf. 2018, 1, 45–61. [Google Scholar] [CrossRef]
- Richards, D.; Jia, J.; Yost, M.; Markwald, R.; Mei, Y. 3D bioprinting for vascularized tissue fabrication. Ann. Biomed. Eng. 2017, 45, 132–147. [Google Scholar] [CrossRef]
- Yin, J.; Zhao, D.; Liu, J. Trends on physical understanding of bioink printability. Bio-Des. Manuf. 2019, 2, 50–54. [Google Scholar] [CrossRef]
- Gillispie, G.; Prim, P.; Copus, J.; Fisher, J.; Mikos, A.G.; Yoo, J.J.; Atala, A.; Lee, S.J. Assessment methodologies for extrusion-based bioink printability. Biofabrication 2020, 12, 022003. [Google Scholar] [CrossRef]
- Chimene, D.; Lennox, K.K.; Kaunas, R.R.; Gaharwar, A.K. Advanced bioinks for 3D printing: A materials science perspective. Ann. Biomed. Eng. 2016, 44, 2090–2102. [Google Scholar] [CrossRef]
- Gungor-Ozkerim, P.S.; Inci, I.; Zhang, Y.S.; Khademhosseini, A.; Dokmeci, M.R. Bioinks for 3D bioprinting: An overview. Biomater. Sci. 2018, 6, 915–946. [Google Scholar] [CrossRef] [Green Version]
- Arslan-Yildiz, A.; El Assal, R.; Chen, P.; Guven, S.; Inci, F.; Demirci, U. Towards artificial tissue models: Past, present, and future of 3D bioprinting. Biofabrication 2016, 8, 014103. [Google Scholar] [CrossRef] [PubMed]
- Zhang, B.; Luo, Y.; Ma, L.; Gao, L.; Li, Y.; Xue, Q.; Yang, H.; Cui, Z. 3D bioprinting: An emerging technology full of opportunities and challenges. Bio-Des. Manuf. 2018, 1, 2–13. [Google Scholar] [CrossRef]
- Kang, H.; Liu, R.; Huang, Y. Cellulose-Based Gels. Macromol. Chem. Phys. 2016, 217, 1322–1334. [Google Scholar] [CrossRef]
- Wang, Q.; Sun, J.; Yao, Q.; Ji, C.; Liu, J.; Zhu, Q. 3D printing with cellulose materials. Cellulose 2018, 25, 4275–4301. [Google Scholar]
- Li, L.; Zhu, Y.; Yang, J. 3D Bioprinting of Cellulose with Controlled Porous Structures from NMMO. Mater. Lett. 2018, 210, 136–138. [Google Scholar] [CrossRef]
- Budtova, T.; Navard, P. Cellulose in NaOH-water based solvents: A review. Cellulose 2016, 23, 5–55. [Google Scholar]
- Huber, T.; Feast, S.; Dimartino, S.; Cen, W.; Fee, C. Analysis of the Effect of Processing Conditions on Physical Properties of Thermally Set Cellulose Hydrogels. Materials 2019, 12, 1066. [Google Scholar] [CrossRef] [Green Version]
- Qin, X.; Lu, A.; Zhang, L. Gelation behavior of cellulose in NaOH/urea aqueous system via cross-linking. Cellulose 2013, 20, 1669–1677. [Google Scholar] [CrossRef]
- Cai, J.; Zhang, L. Unique gelation behavior of cellulose in NaOH/urea aqueous solution. Biomacromolecules 2006, 7, 183–189. [Google Scholar] [CrossRef]
- Huber, T.; Clucas, D.; Vilmay, M.; Pupkes, B.; Stuart, J.; Dimartino, S.; Fee, C. 3D Printing Cellulose Hydrogels Using LASER Induced Thermal Gelation. J. Manuf. Mater. Process. 2018, 2, 42. [Google Scholar] [CrossRef] [Green Version]
- Cai, J.; Zhang, L. Rapid dissolution of cellulose in LiOH/urea and NaOH/urea aqueous solutions. Macromol. Biosci. 2005, 5, 539–548. [Google Scholar] [CrossRef]
- Montgomery, D.C. Design and Analysis of Experiments; Wiley: Hoboken, NJ, USA, 1984. [Google Scholar]
- Huber, T.; Starling, K.; Cen, W.S.; Fee, C.; Dimartino, S. Effect of Urea Concentration on the Viscosity and Thermal Stability of Aqueous NaOH/Urea Cellulose Solutions. J. Polym. 2016, 2016, 1–9. [Google Scholar] [CrossRef] [Green Version]
- Qin, X.; Lu, A.; Cai, J.; Zhang, L. Stability of inclusion complex formed by cellulose in NaOH/urea aqueous solution at low temperature. Carbohydr. Polym. 2013, 92, 1315–1320. [Google Scholar] [CrossRef] [PubMed]
- Cai, J.; Zhang, L.; Liu, S.; Liu, Y.; Xu, X.; Chen, X.; Chu, B.; Guo, X.; Xu, J.; Cheng, H.; et al. Dynamic self-assembly induced rapid dissolution of cellulose at low temperatures. Macromolecules 2008, 41, 9345–9351. [Google Scholar] [CrossRef]
- Wilson, S.A.; Cross, L.M.; Peak, C.W.; Gaharwar, A.K. Shear-thinning and thermo-reversible nanoengineered inks for 3D bioprinting. ACS Appl. Mater. Interfaces 2017, 9, 43449–43458. [Google Scholar] [CrossRef]
- Shao, Z.; Negi, A.S.; Osuji, C.O. Role of interparticle attraction in the yielding response of microgel suspensions. Soft Matter 2013, 9, 5492–5500. [Google Scholar] [CrossRef]
- Wyss, H.M.; Deliormanli, A.M.; Tervoort, E.; Gauckler, L.J. Influence of microstructure on the rheological behavior of dense particle gels. AIChE J. 2005, 51, 134–141. [Google Scholar] [CrossRef] [Green Version]
- Dai, L.; Cheng, T.; Duan, C.; Zhao, W.; Zhang, W.; Zou, X.; Aspler, J.; Ni, Y. 3D printing using plant-derived cellulose and its derivatives: A review. Carbohydr. Polym. 2019, 203, 71–86. [Google Scholar] [CrossRef]


| Trial | Pressure [psi] | Speed [mm/s] | Trial | Pressure [psi] | Speed [mm/s] |
|---|---|---|---|---|---|
| 1 | 8 | 3 | 10 | 14 | 3 |
| 2 | 8 | 3 | 11 | 14 | 3 |
| 3 | 8 | 3 | 12 | 14 | 3 |
| 4 | 8 | 5 | 13 | 14 | 5 |
| 5 | 8 | 5 | 14 | 14 | 5 |
| 6 | 8 | 5 | 15 | 14 | 5 |
| 7 | 8 | 6 | 16 | 14 | 6 |
| 8 | 8 | 6 | 17 | 14 | 6 |
| 9 | 8 | 6 | 18 | 14 | 6 |
| 19 | 20 | 3 | 23 | 20 | 5 |
| 20 | 20 | 3 | 24 | 20 | 5 |
| 21 | 20 | 3 | 25 | 20 | 6 |
| 22 | 20 | 5 | 26 | 20 | 6 |
| 27 | 20 | 6 |
| Pressure [psi] | Speed [mm/s] | Top Area [mm2] | Side Height [mm] | Side Width [mm] | Angle 1 [°] | Angle 2 [°] |
|---|---|---|---|---|---|---|
| 8 | 3 | 80.75 | 8.63 | 9.38 | 121.75 | 96.34 |
| 8 | 5 | 72.65 | 7.26 | 7.86 | 113.58 | 107.66 |
| 8 | 6 | 60.12 | 6.89 | 7.34 | 110.01 | 114.15 |
| 14 | 3 | 86.24 | 8.92 | 9.44 | 92.12 | 95.79 |
| 14 | 5 | 87.69 | 9.63 | 9.34 | 101.60 | 102.16 |
| 14 | 6 | 74.45 | 8.39 | 9.86 | 116.77 | 95.59 |
| 20 | 3 | 156.09 | 11.40 | 11.97 | 135.07 | 131.64 |
| 20 | 5 | 143.216 | 11.362 | 12.384 | 127.77 | 123.962 |
| 20 | 6 | 141.6 | 11.005 | 12.496 | 130.728 | 137.068 |
| Max | 156.09 | 11.4 | 12.49 | 135.07 | 137.06 | |
| Min | 60.12 | 6.89 | 7.34 | 92.12 | 95.59 |
| Source | DOF | Sum of Square | Variance | F-ratio | P |
|---|---|---|---|---|---|
| Pressure | 2 | 16.2566 | 16.2566 | 61.89 | 0.001 |
| Speed | 2 | 0.0839 | 0.0839 | 0.32 | 0.743 |
| Residual Error | 4 | 0.5253 | 0.5253 | ||
| Total | 8 | 16.8659 |
| Source | DOF | Sum of Square | Variance | F-ratio | P |
|---|---|---|---|---|---|
| Pressure | 2 | 1295.73 | 1295.73 | 100.88 | 0.000 |
| Speed | 2 | 2.98 | 2.98 | 0.23 | 0.803 |
| Residual Error | 4 | 25.69 | 25.69 | ||
| Total | 8 | 1324.39 |
| Level | Pressure | Speed |
|---|---|---|
| 1 | −34.33 | −34.82 |
| 2 | −33.57 | −34.80 |
| 3 | −36.72 | −35.01 |
| Delta | 3.15 | 0.21 |
| Rank | 1 | 2 |
© 2020 by the authors. Licensee MDPI, Basel, Switzerland. This article is an open access article distributed under the terms and conditions of the Creative Commons Attribution (CC BY) license (http://creativecommons.org/licenses/by/4.0/).
Share and Cite
Huber, T.; Najaf Zadeh, H.; Feast, S.; Roughan, T.; Fee, C. 3D Printing of Gelled and Cross-Linked Cellulose Solutions; an Exploration of Printing Parameters and Gel Behaviour. Bioengineering 2020, 7, 30. https://doi.org/10.3390/bioengineering7020030
Huber T, Najaf Zadeh H, Feast S, Roughan T, Fee C. 3D Printing of Gelled and Cross-Linked Cellulose Solutions; an Exploration of Printing Parameters and Gel Behaviour. Bioengineering. 2020; 7(2):30. https://doi.org/10.3390/bioengineering7020030
Chicago/Turabian StyleHuber, Tim, Hossein Najaf Zadeh, Sean Feast, Thea Roughan, and Conan Fee. 2020. "3D Printing of Gelled and Cross-Linked Cellulose Solutions; an Exploration of Printing Parameters and Gel Behaviour" Bioengineering 7, no. 2: 30. https://doi.org/10.3390/bioengineering7020030