Polyhydroxybutyrate Production from Natural Gas in A Bubble Column Bioreactor: Simulation Using COMSOL

 ,
,  , and
, and
Abstract
:
1. Introduction
2. Materials and Methods
- The temperature of the system is always constant at 32 °C.
- The physical properties of the solute with time are discarded.
- The velocity of all compounds in the same phase is equal.
- The culture medium and the microorganism mixture are considered as a single phase.
2.1. Reaction Kinetics
2.2. The Equation of the Governing Model
2.3. Simulation Operations
2.4. Resolution Independence Analysis of Numerical Grid
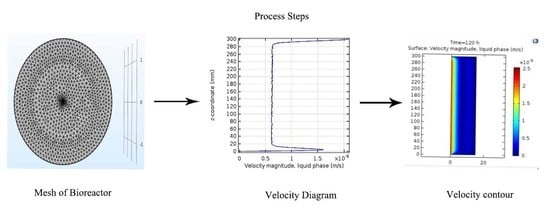
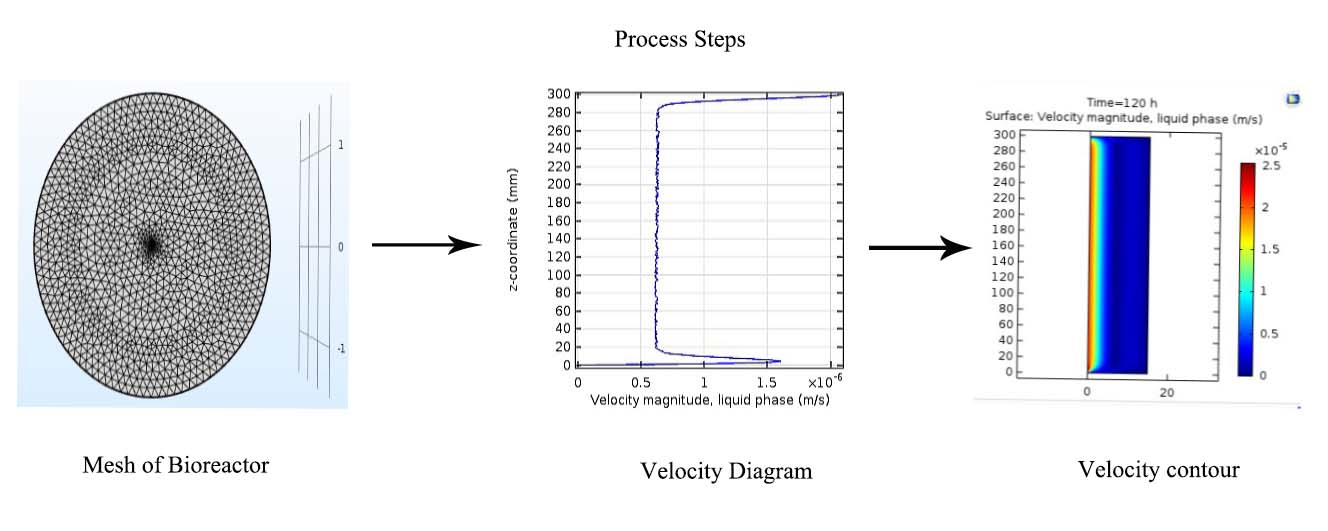
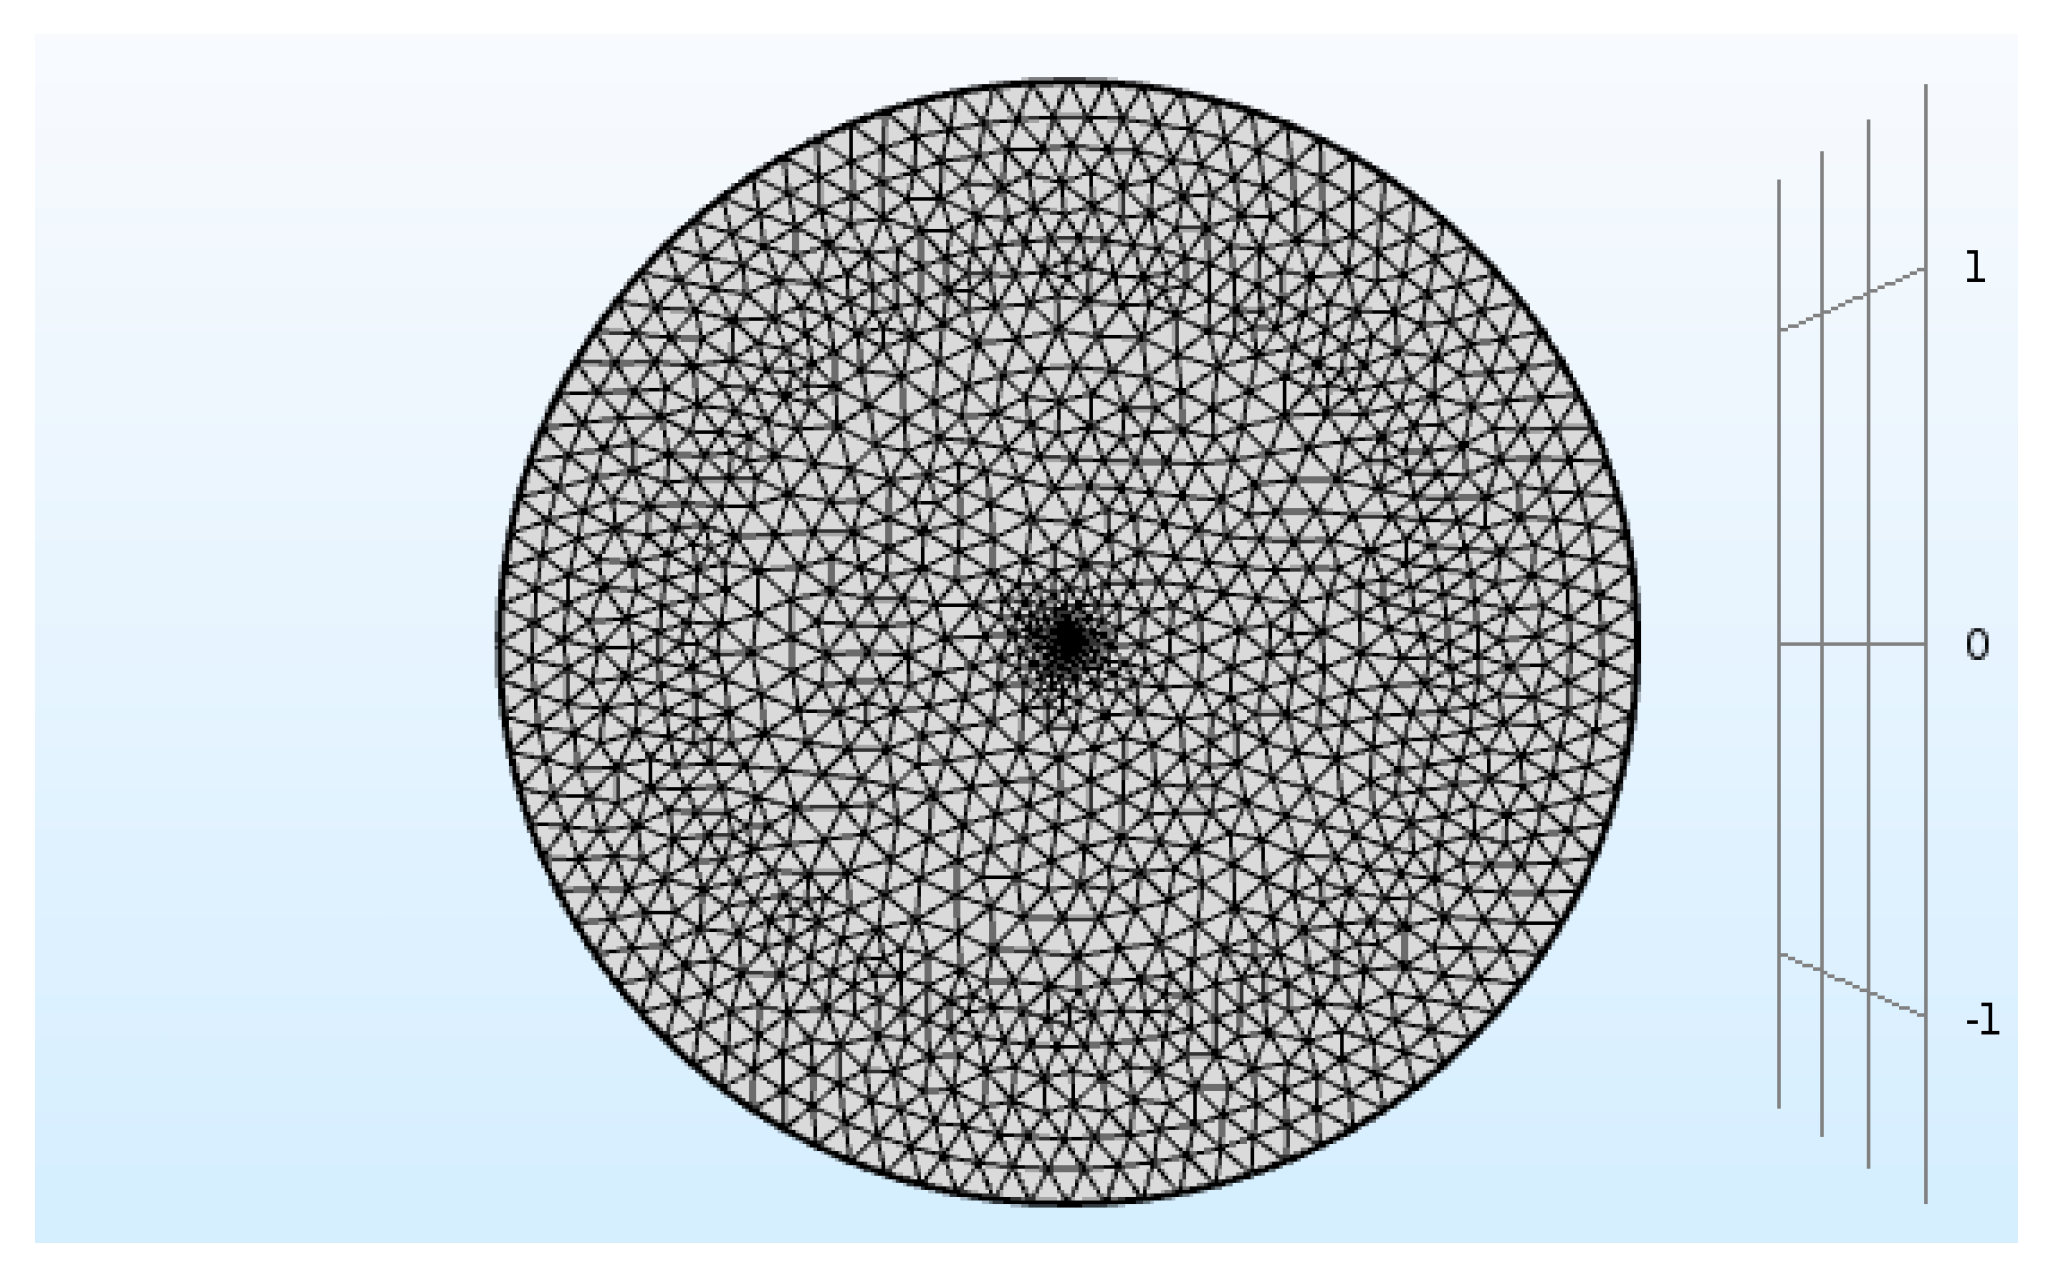
2.5. Meshing
3. Results
3.1. The Results of Resolution Independence Analysis of Numerical Grid
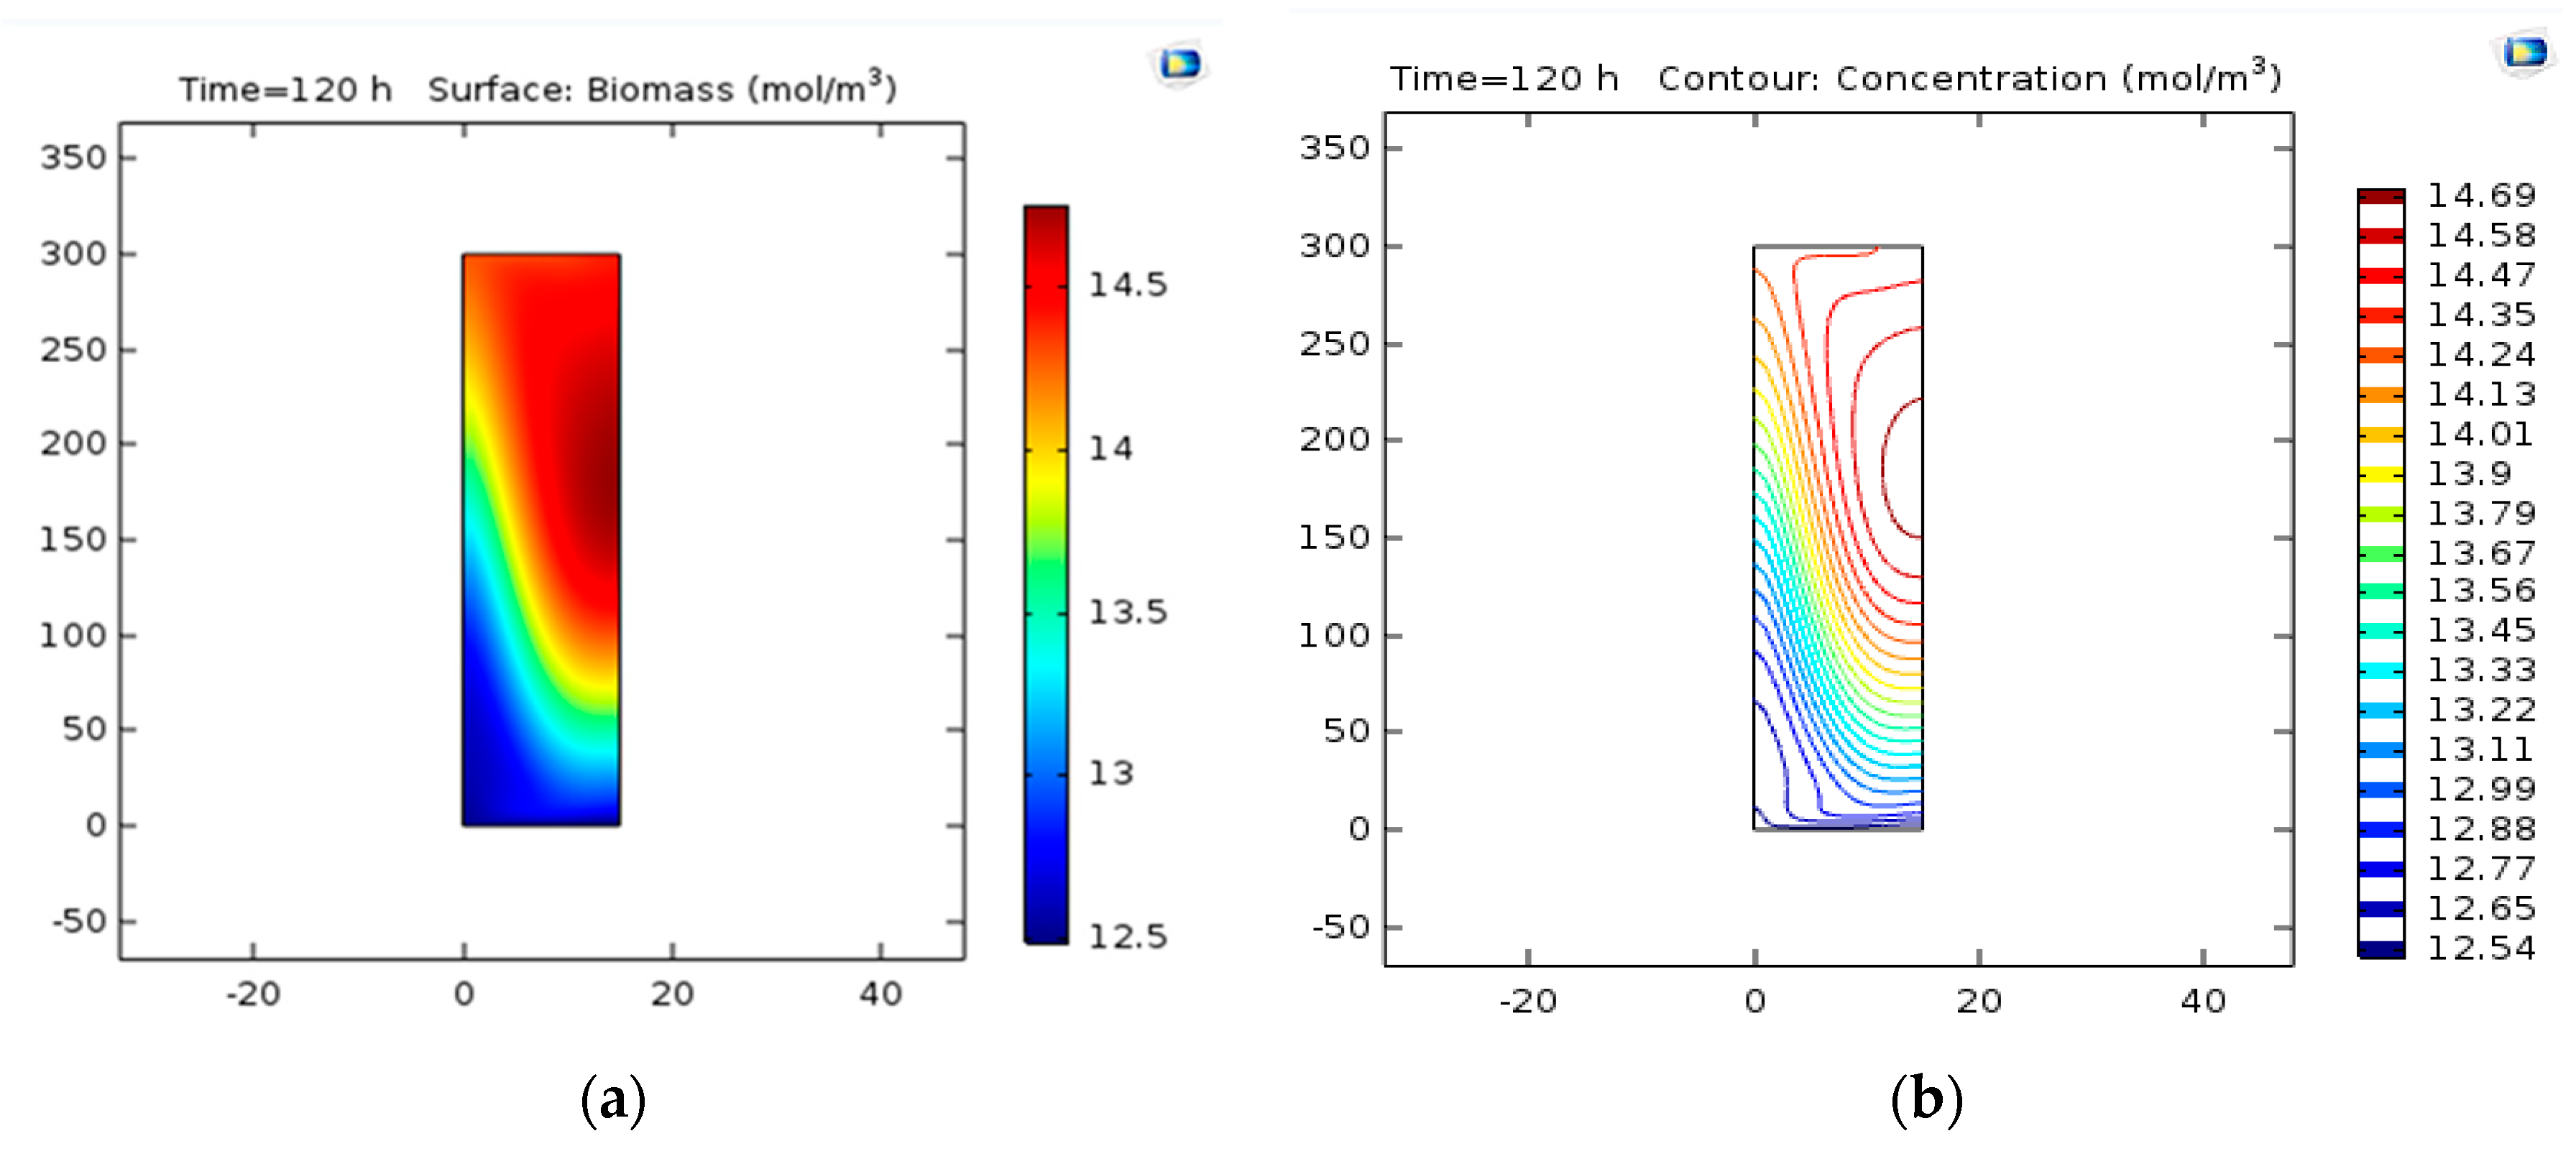
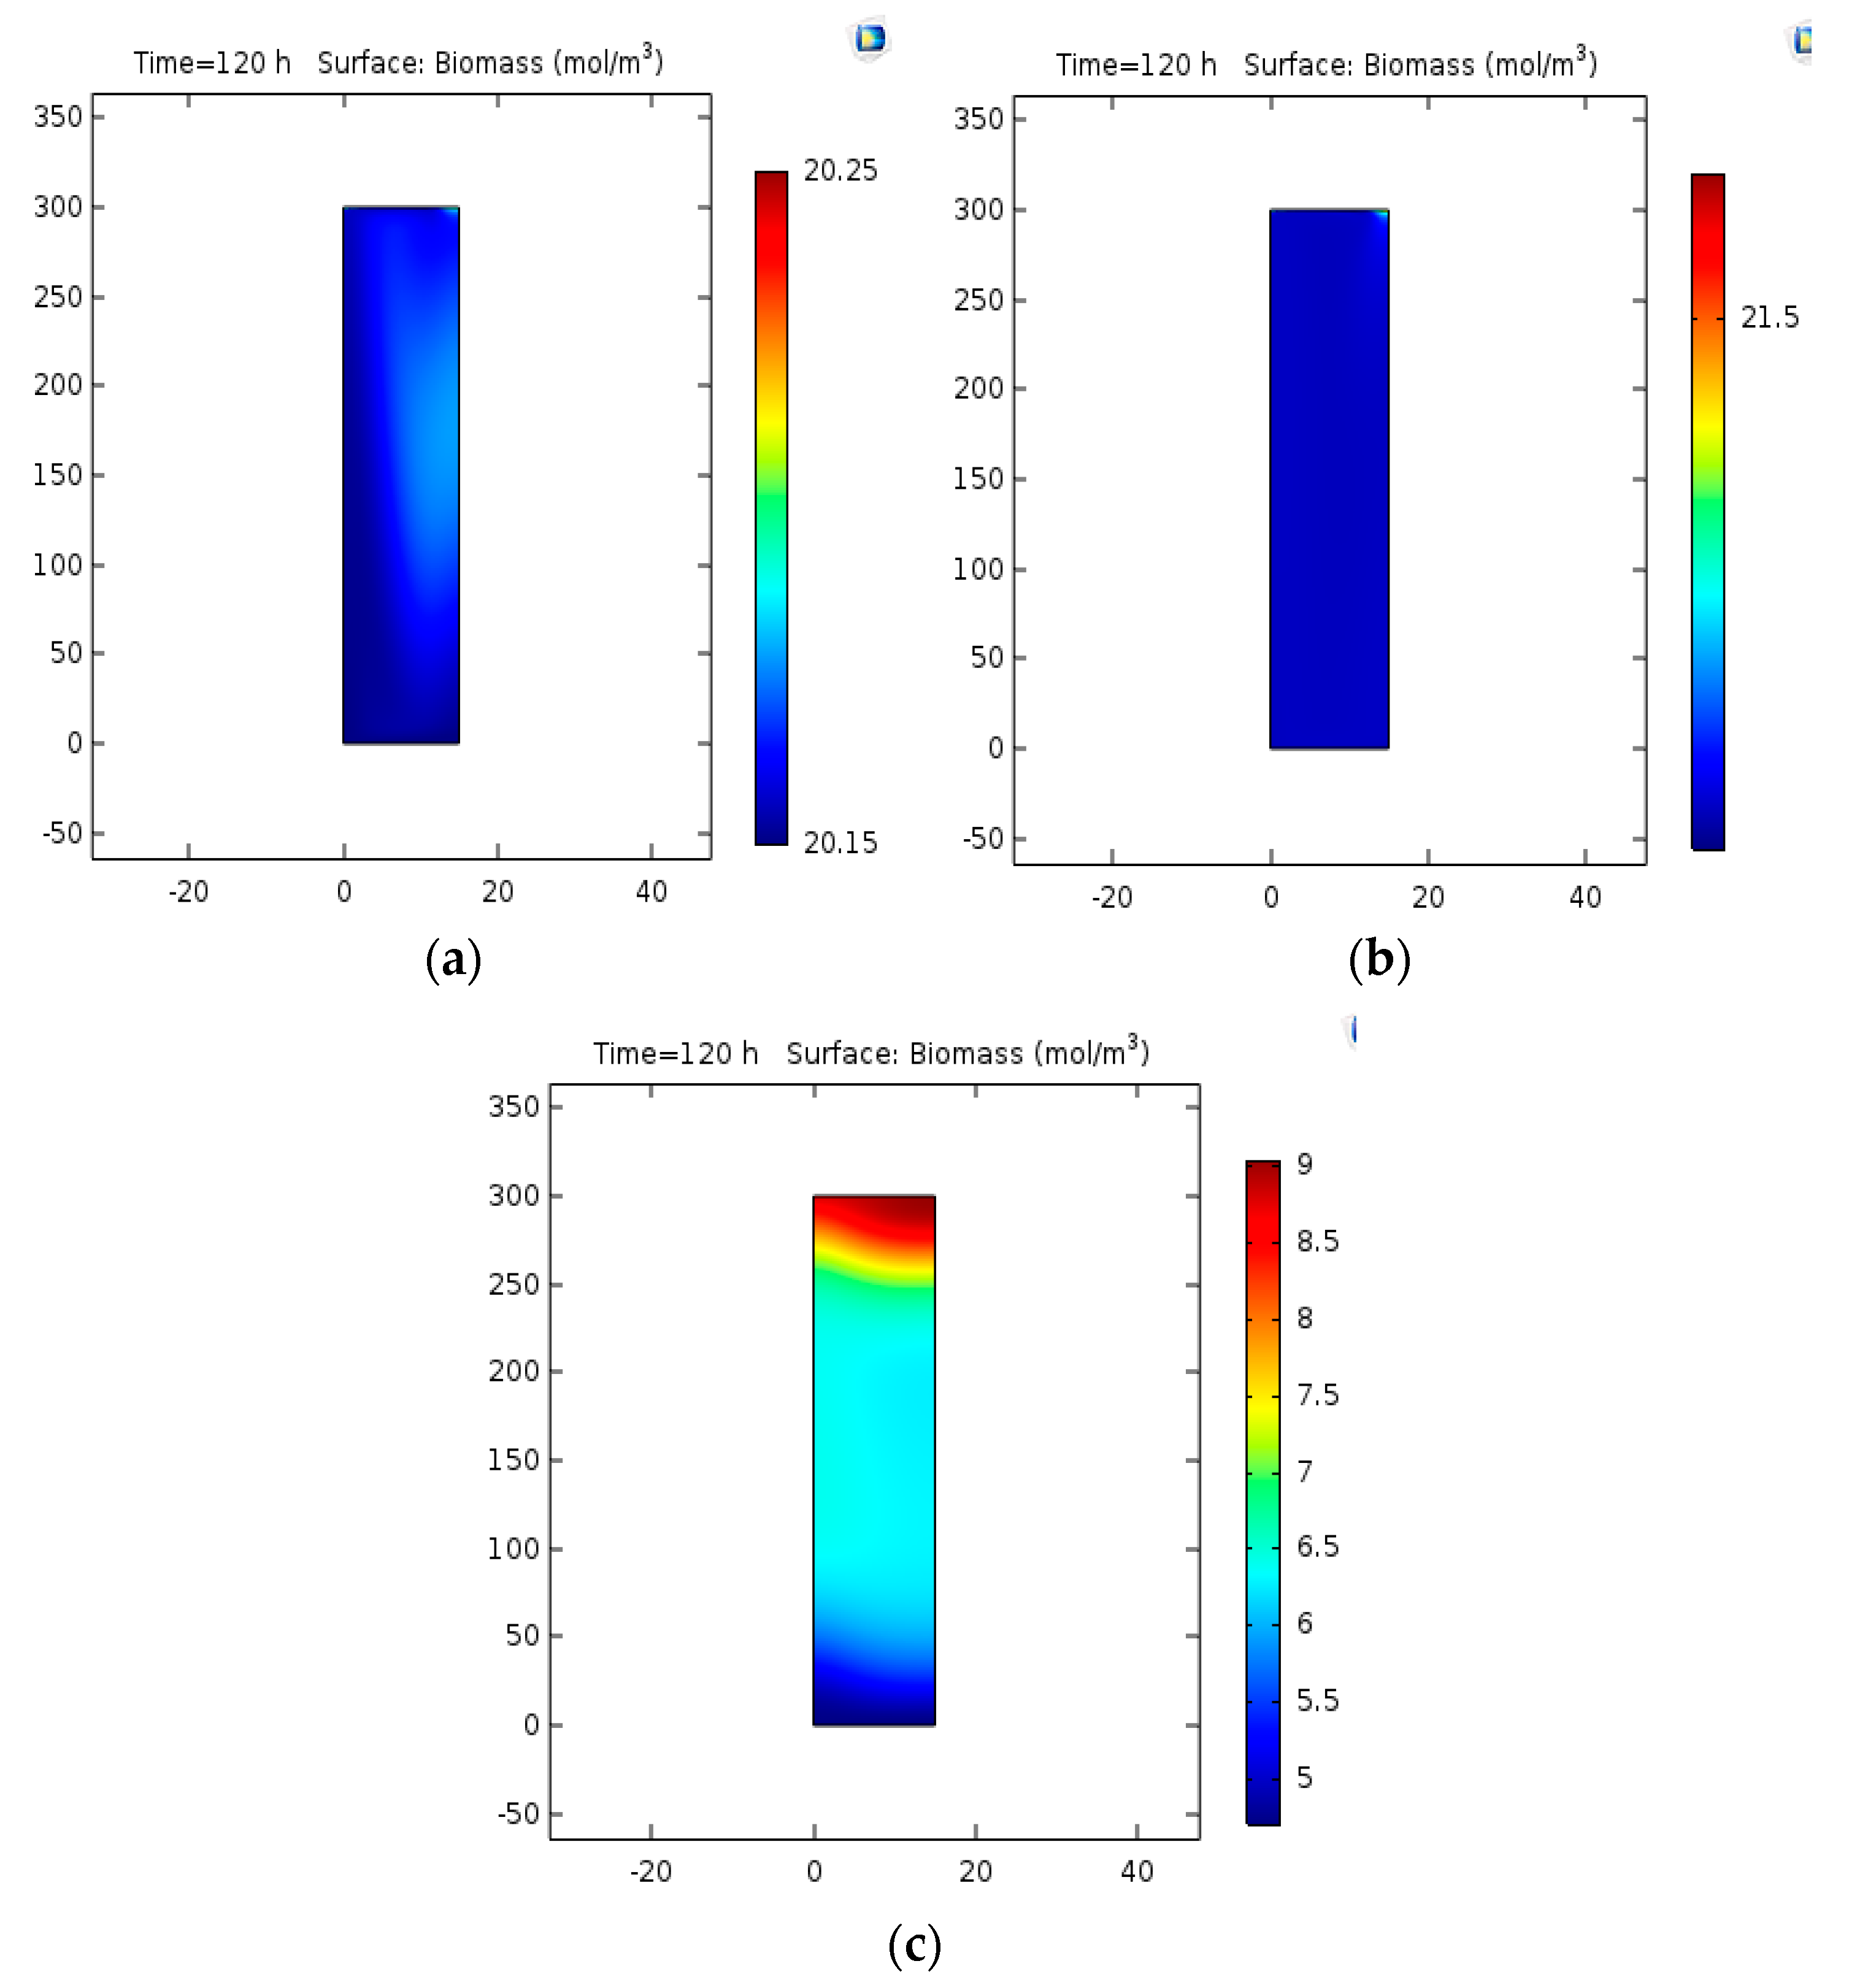
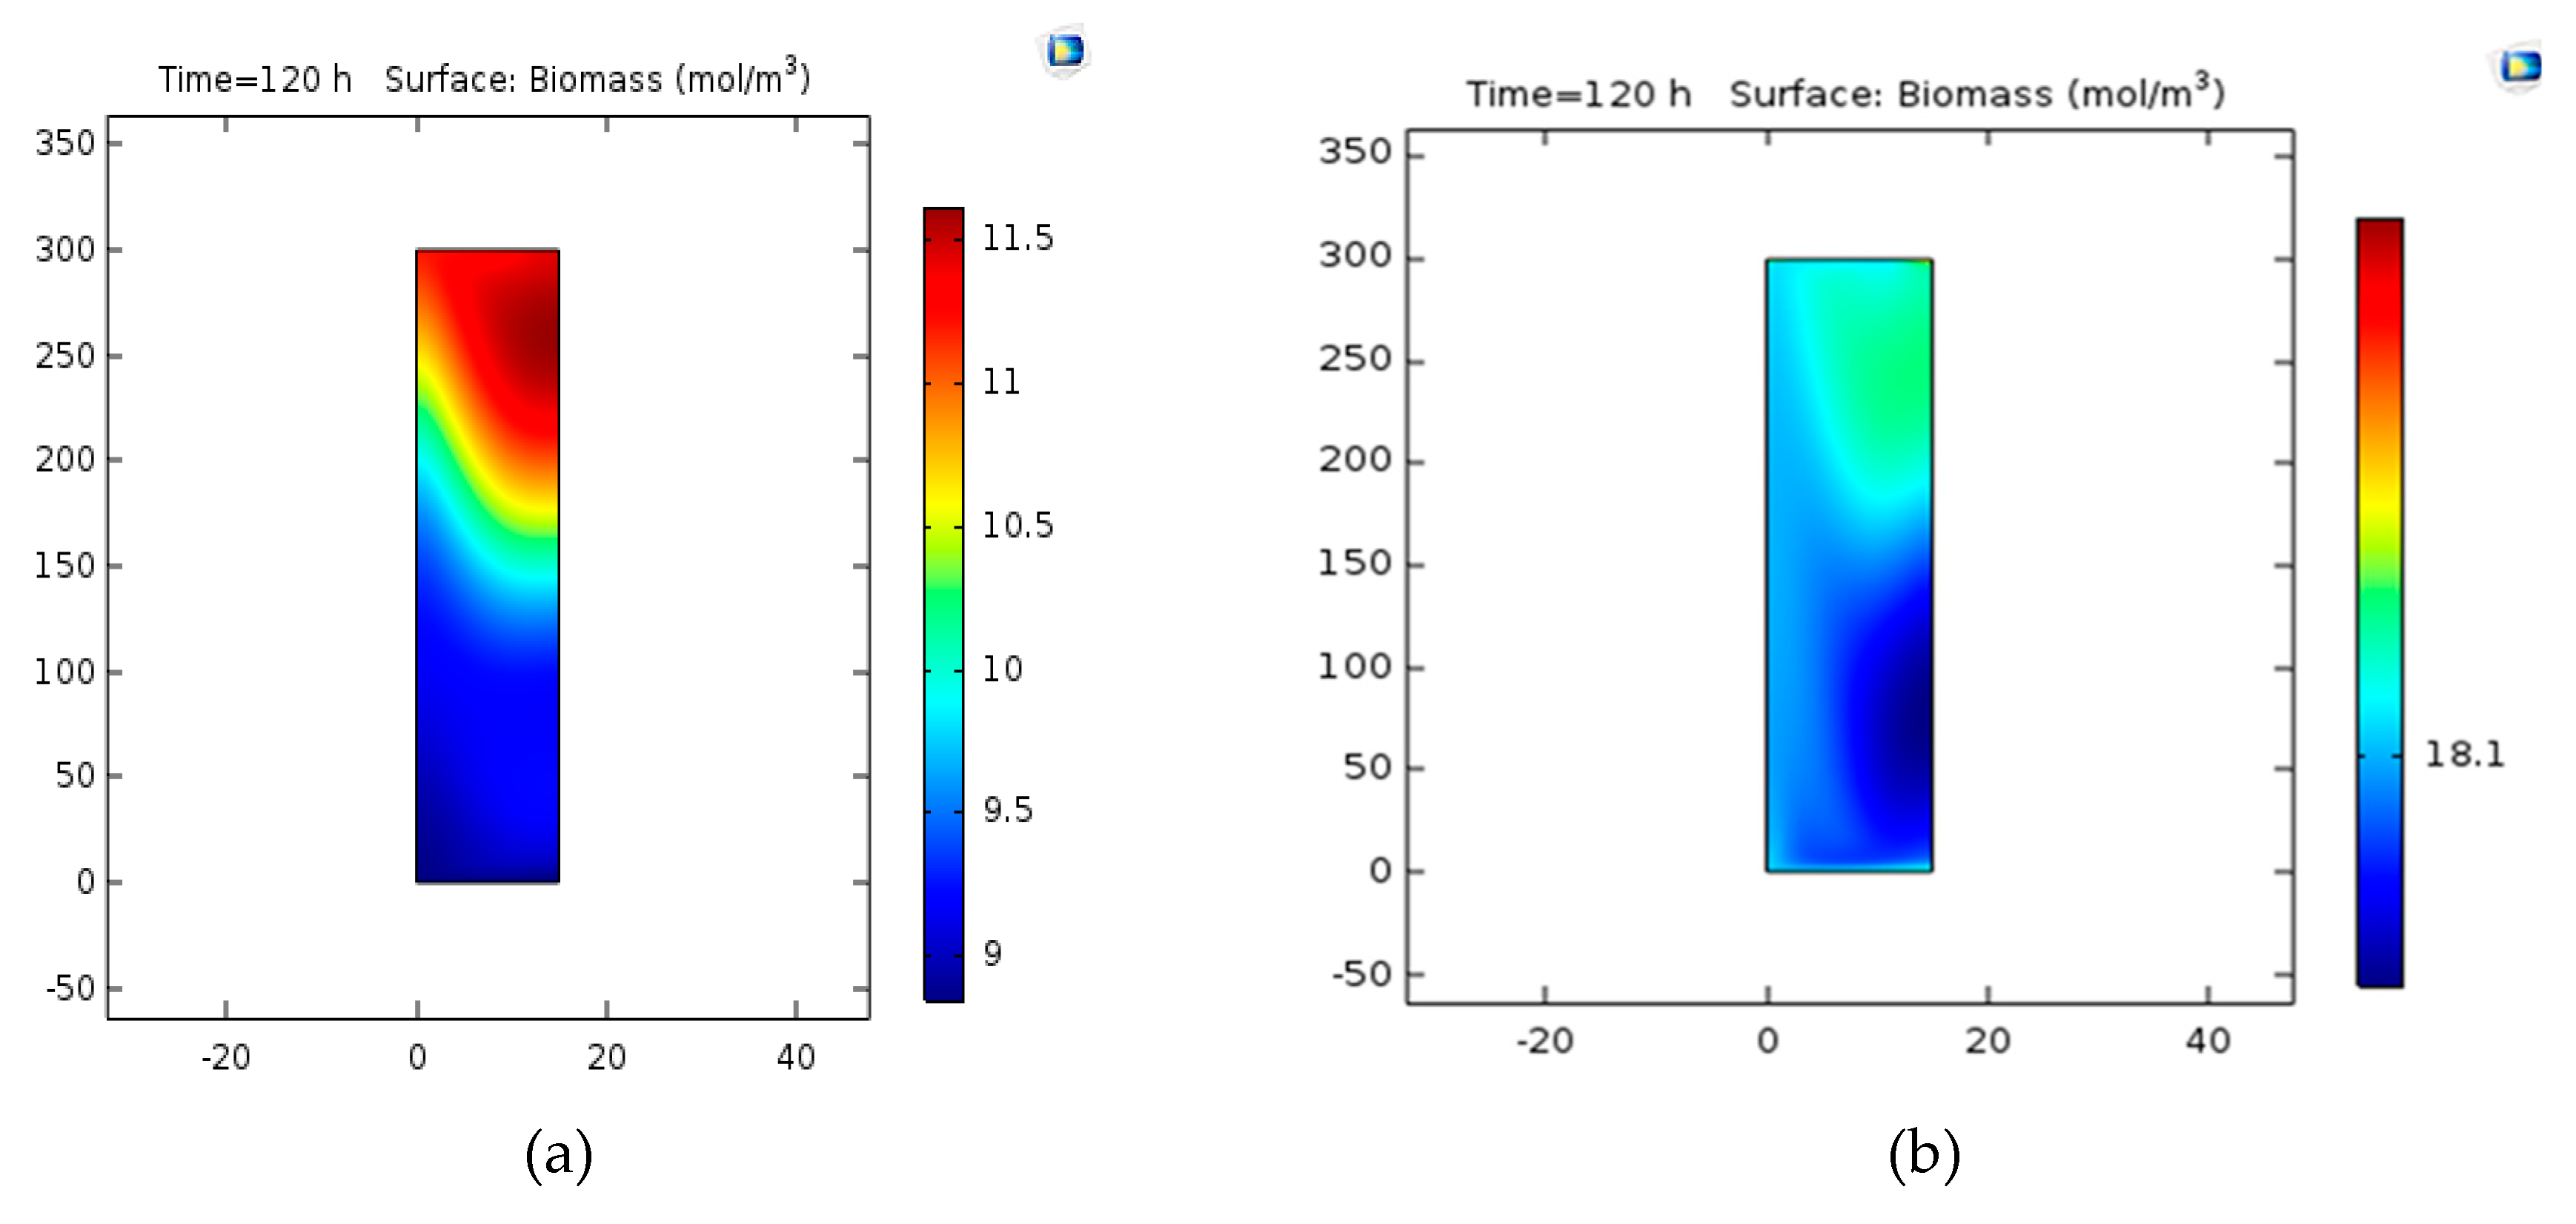
3.2. Concentration of Biomass
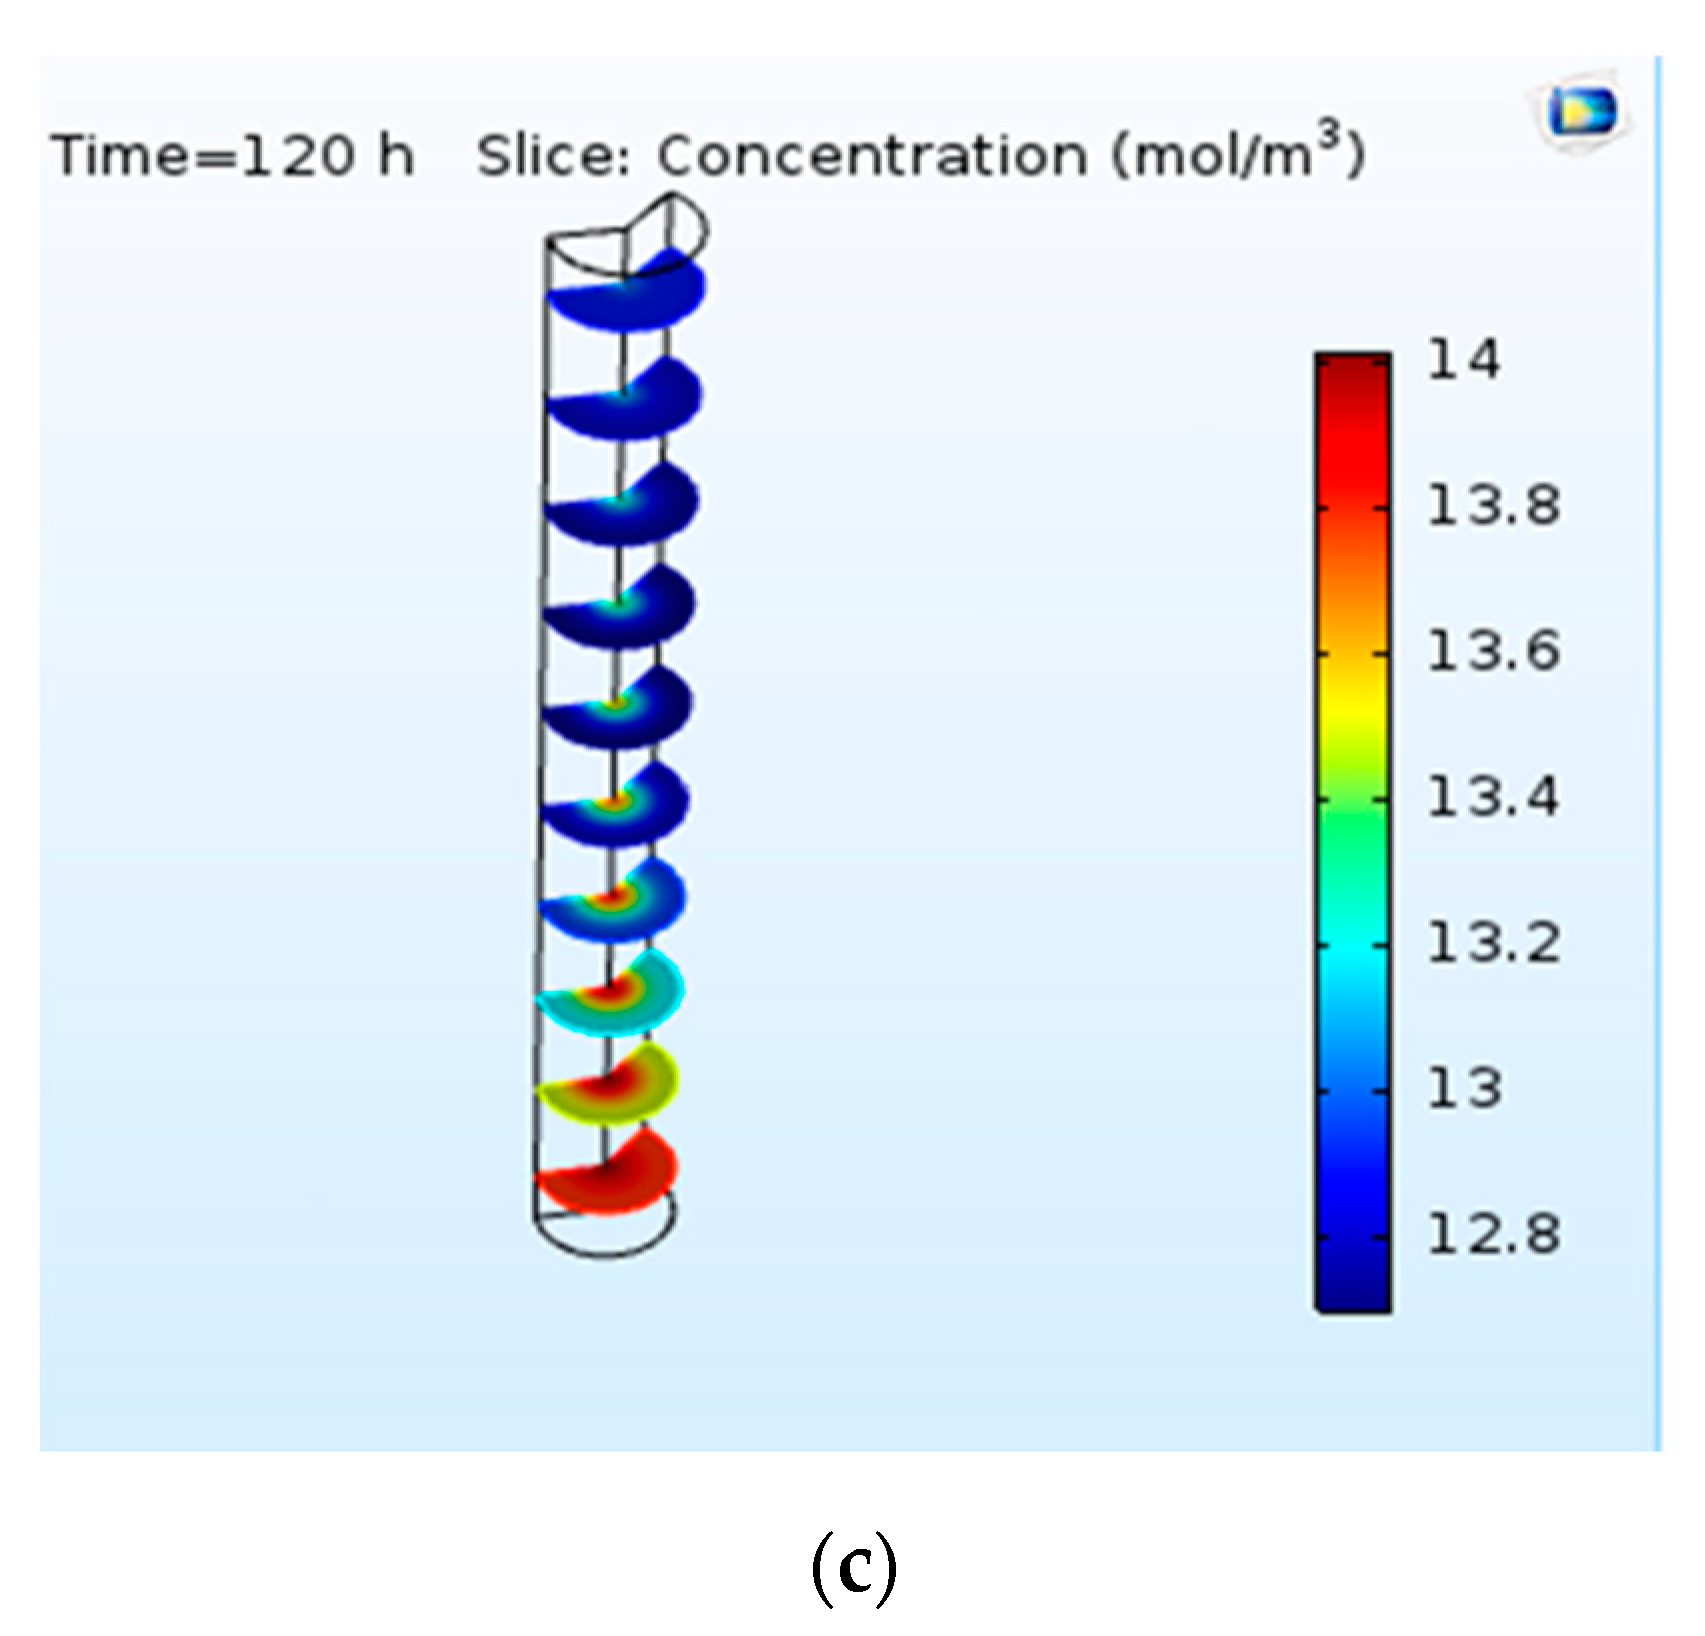
3.2.1. Concentration Contour
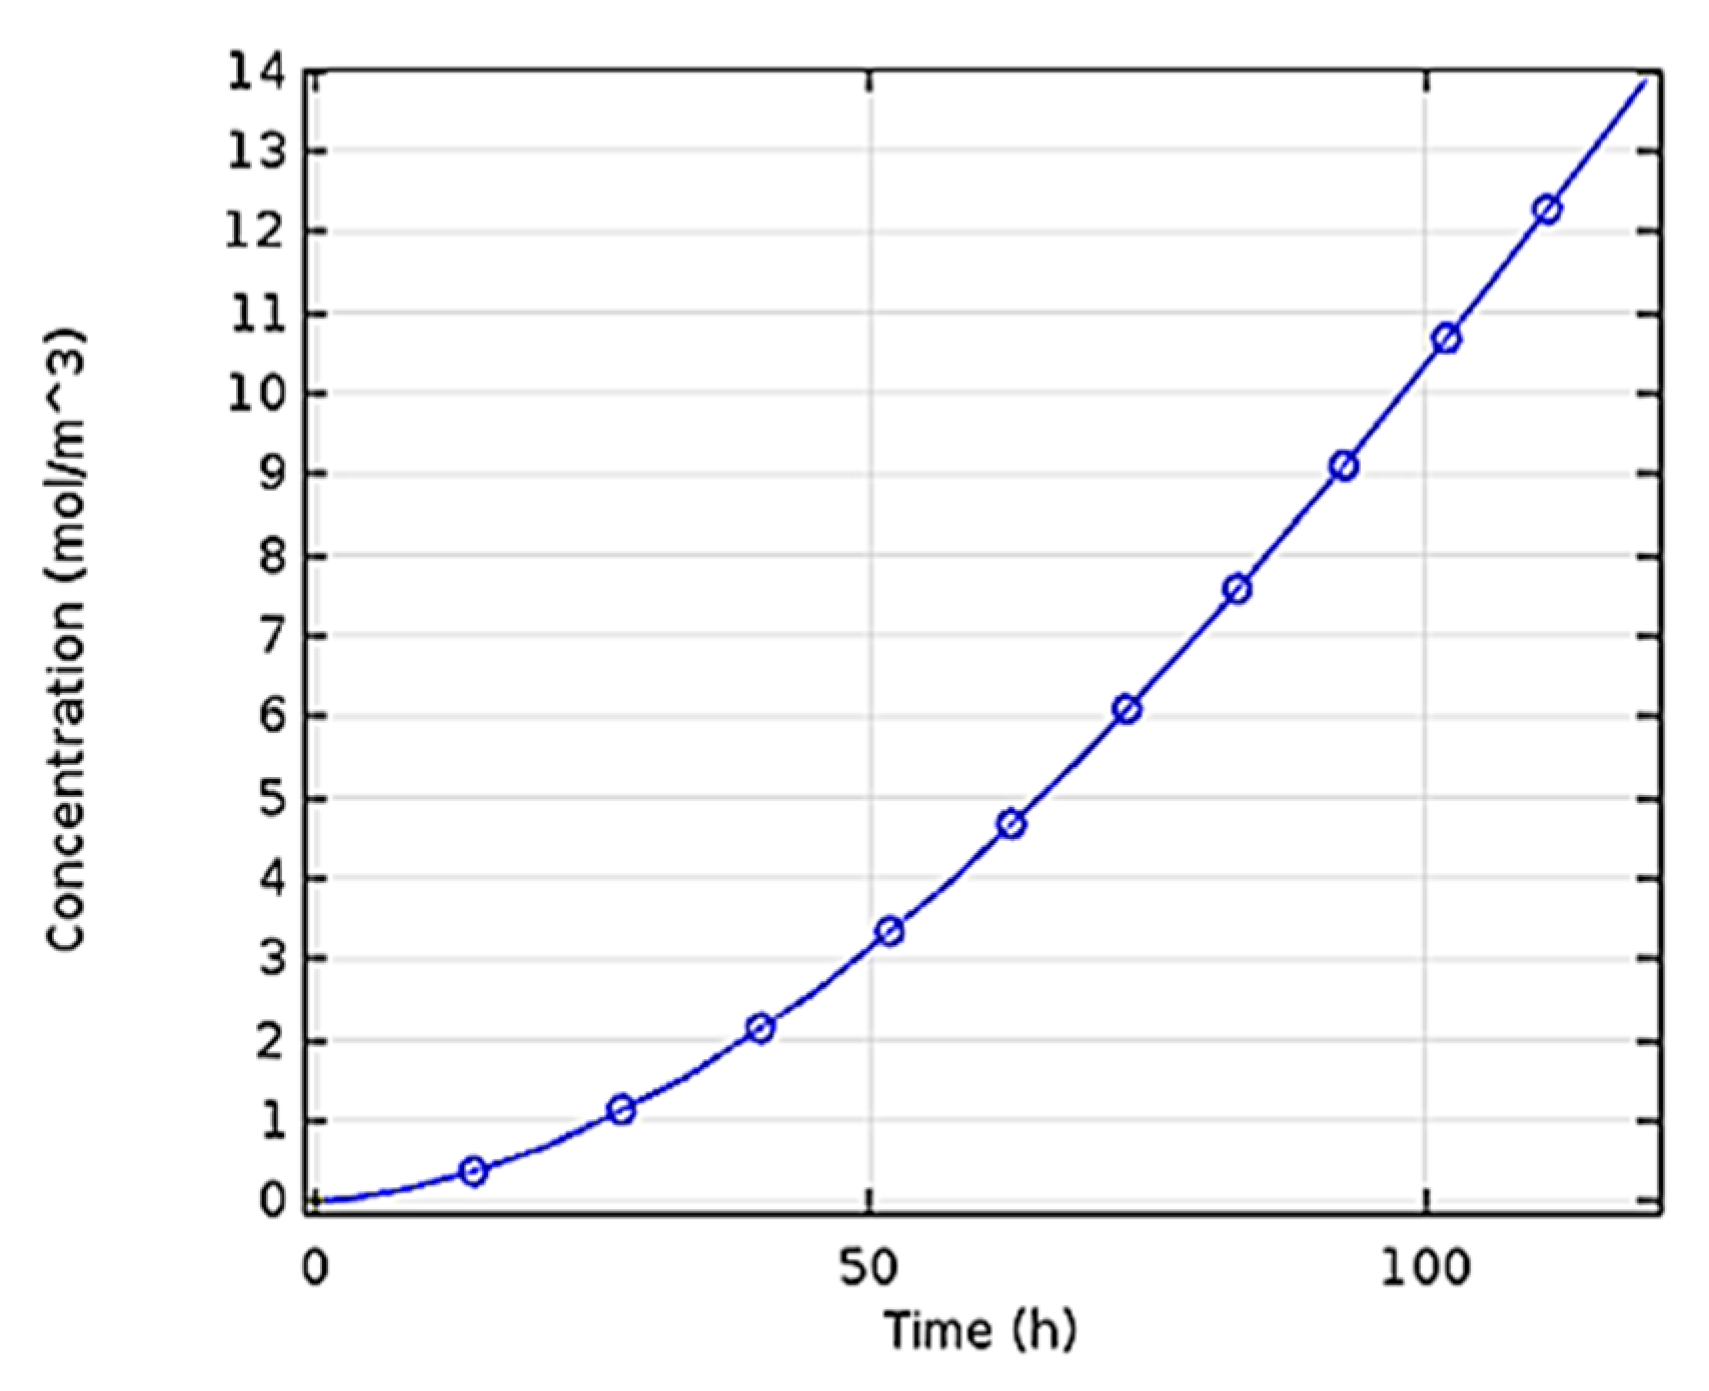
3.2.2. Concentration Variations versus Time
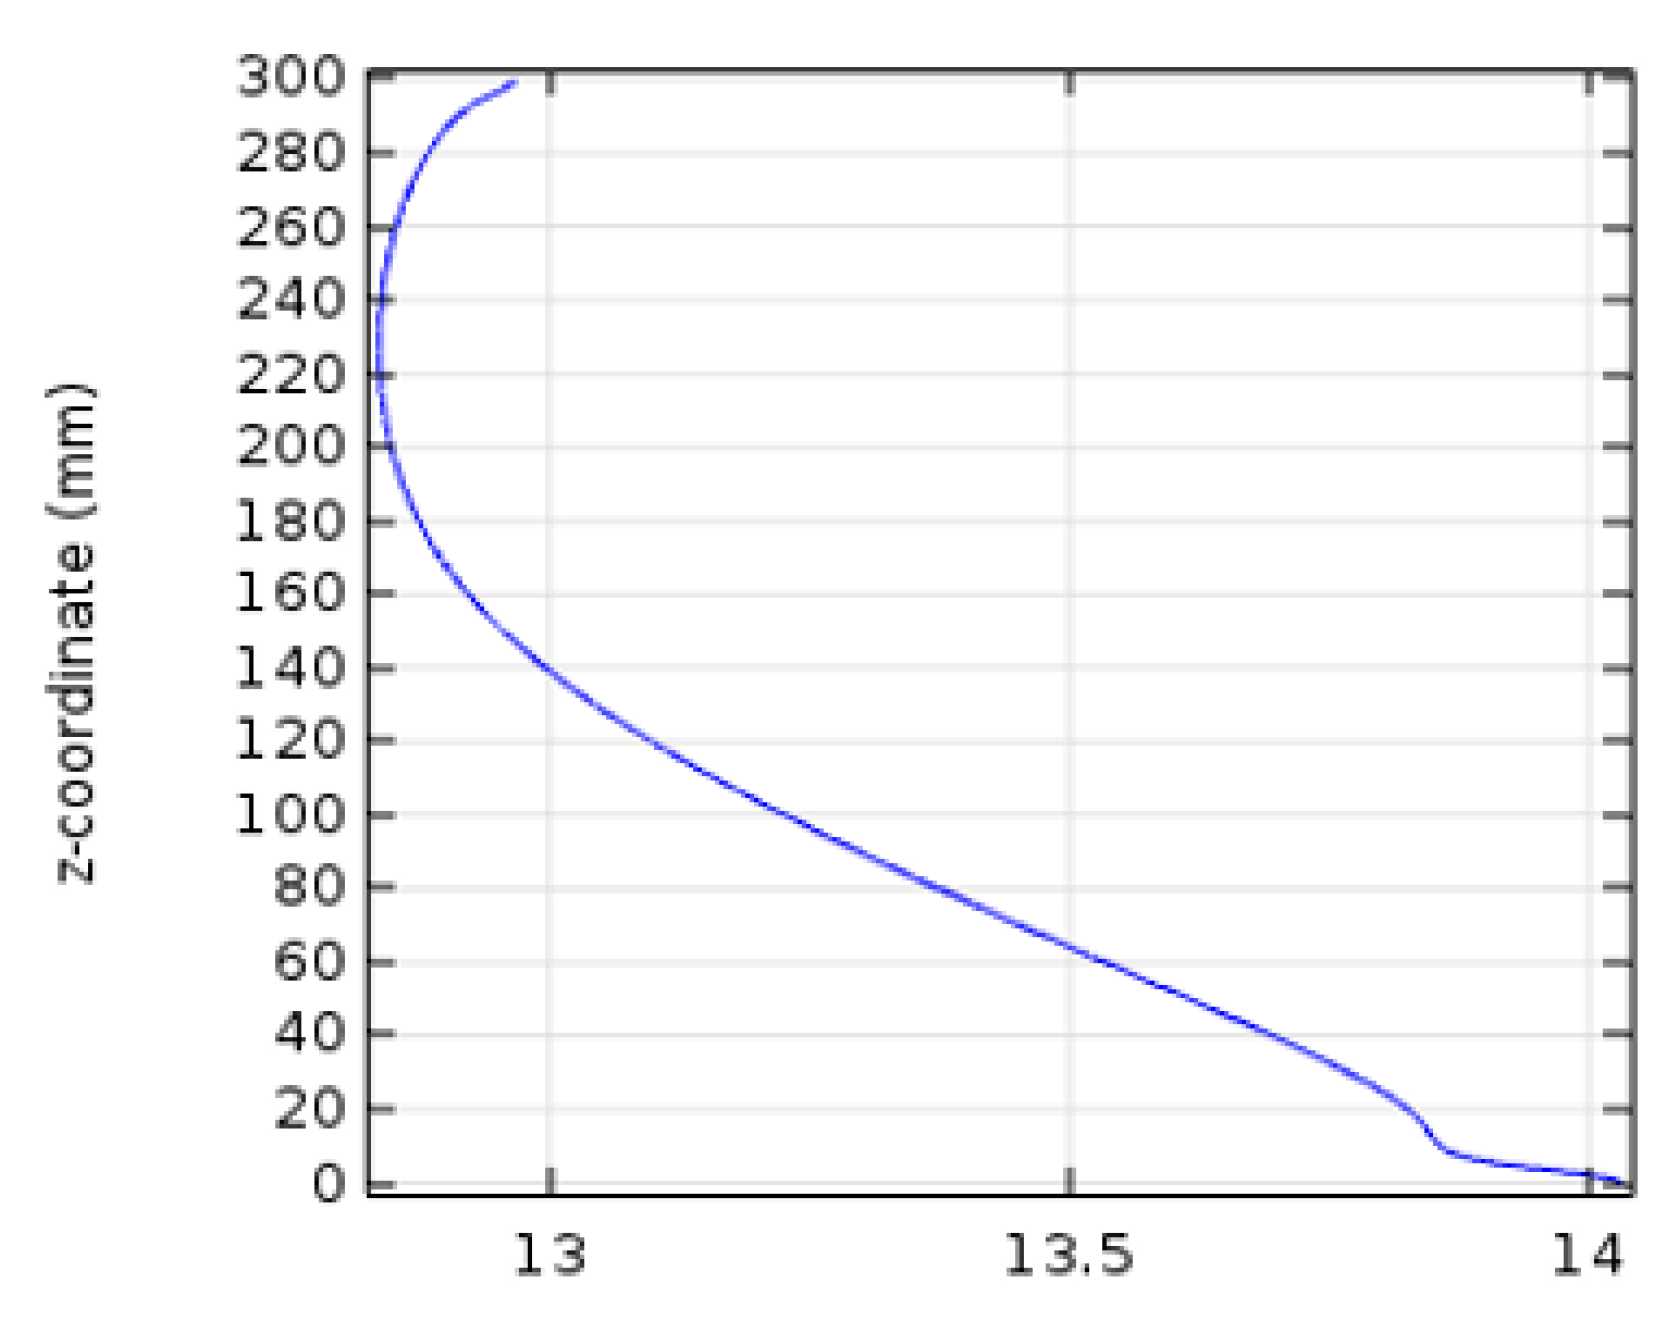
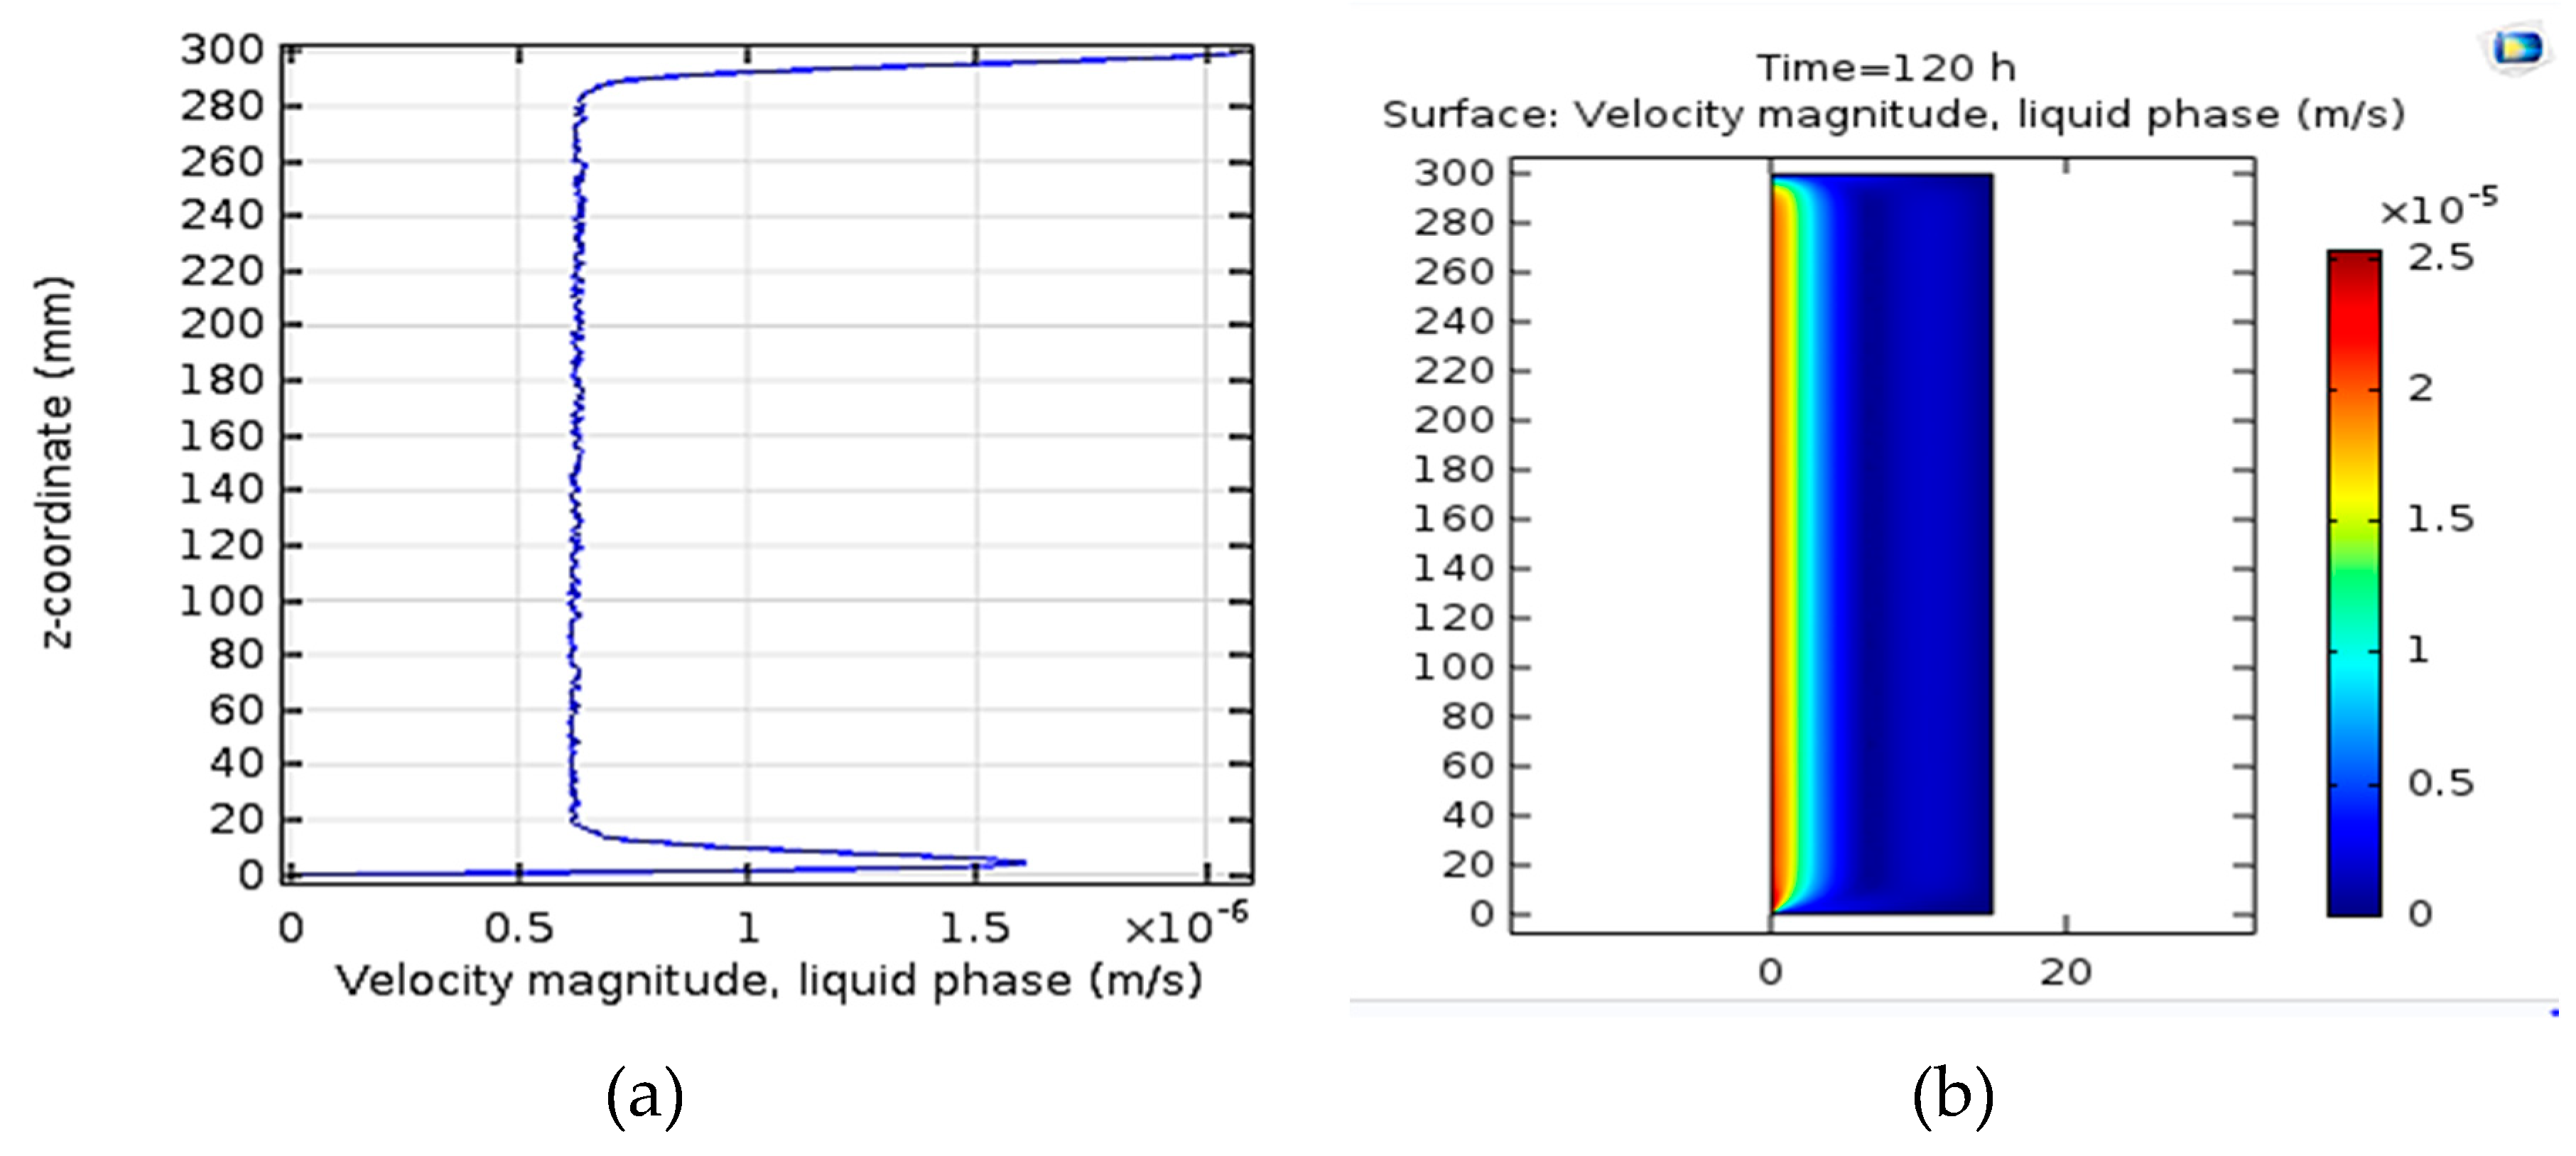
3.3. Velocity Contour
3.4. Analysis of Variations in the Input Gas Velocity
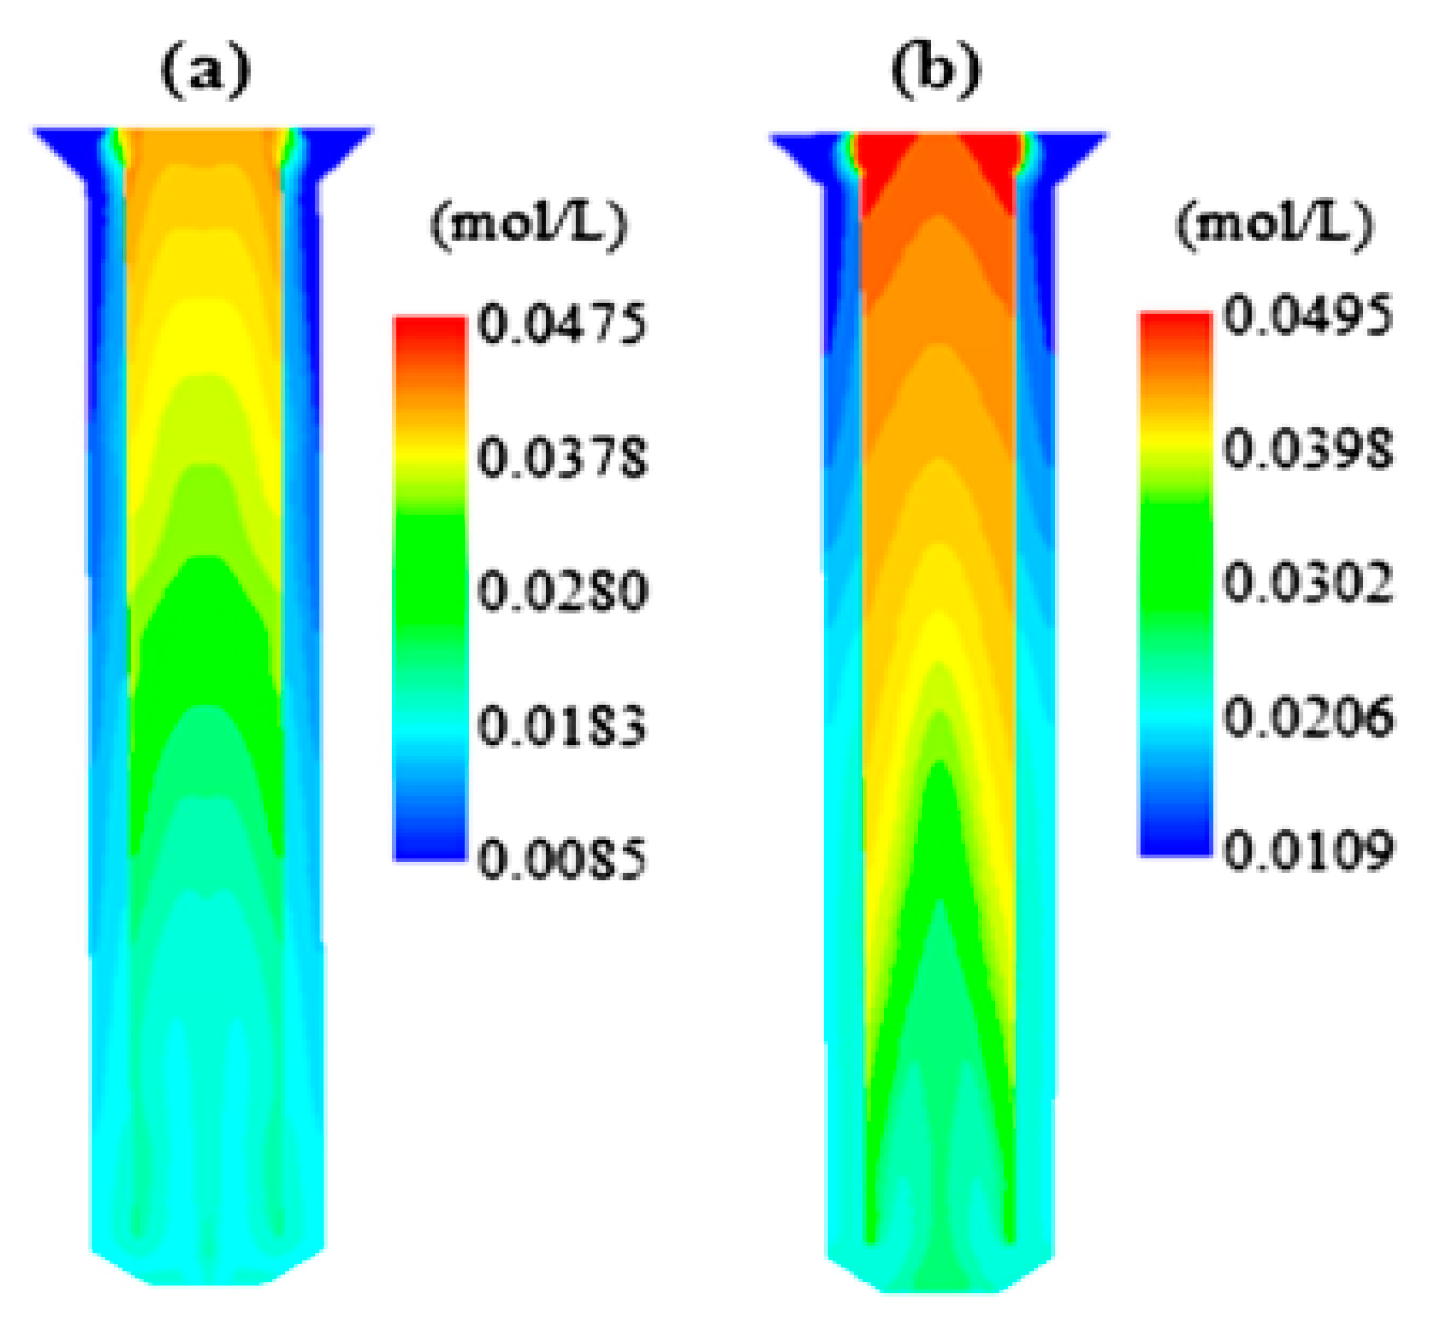
3.5. Effect of Changing the Bubble Diameter on the Concentration
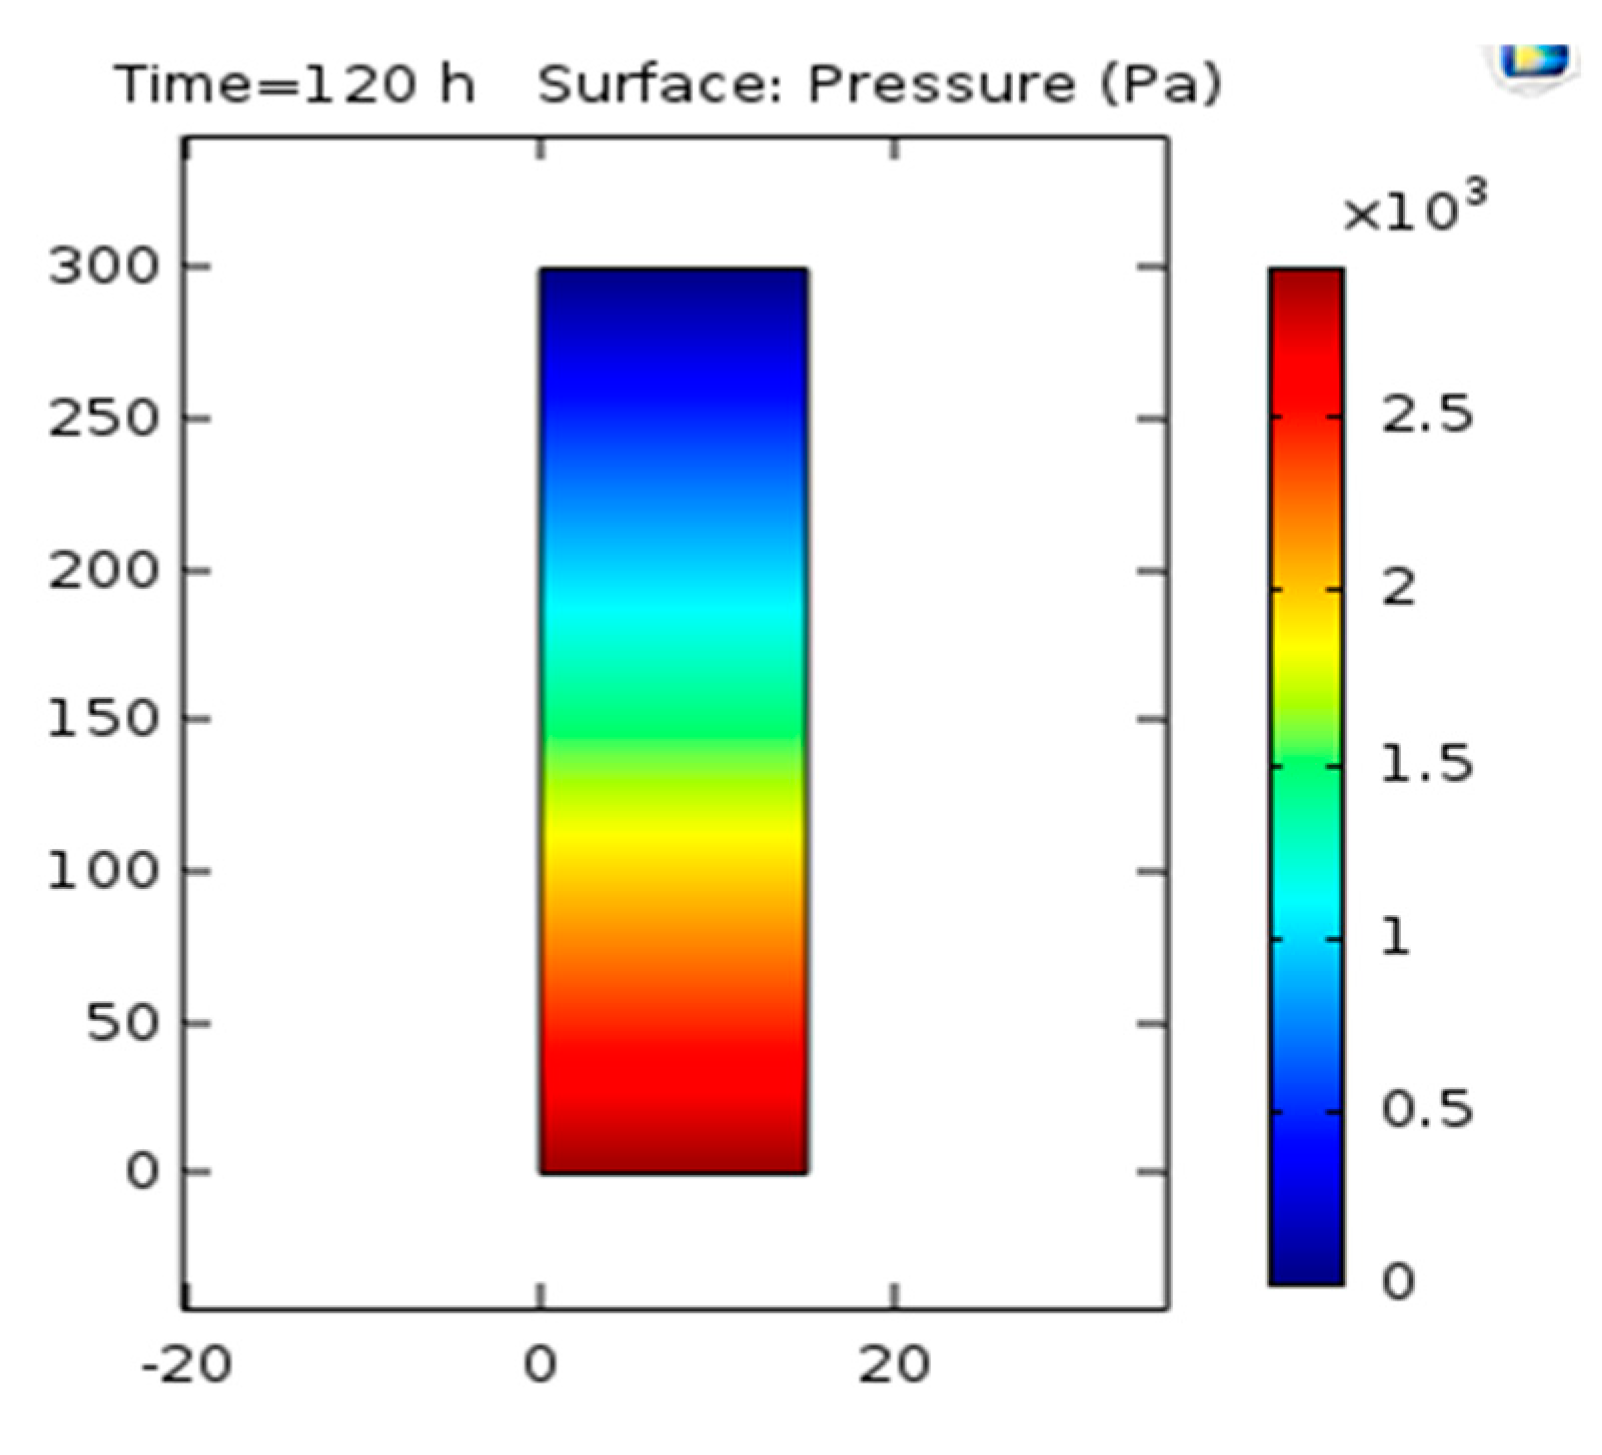
3.6. Pressure Analysis
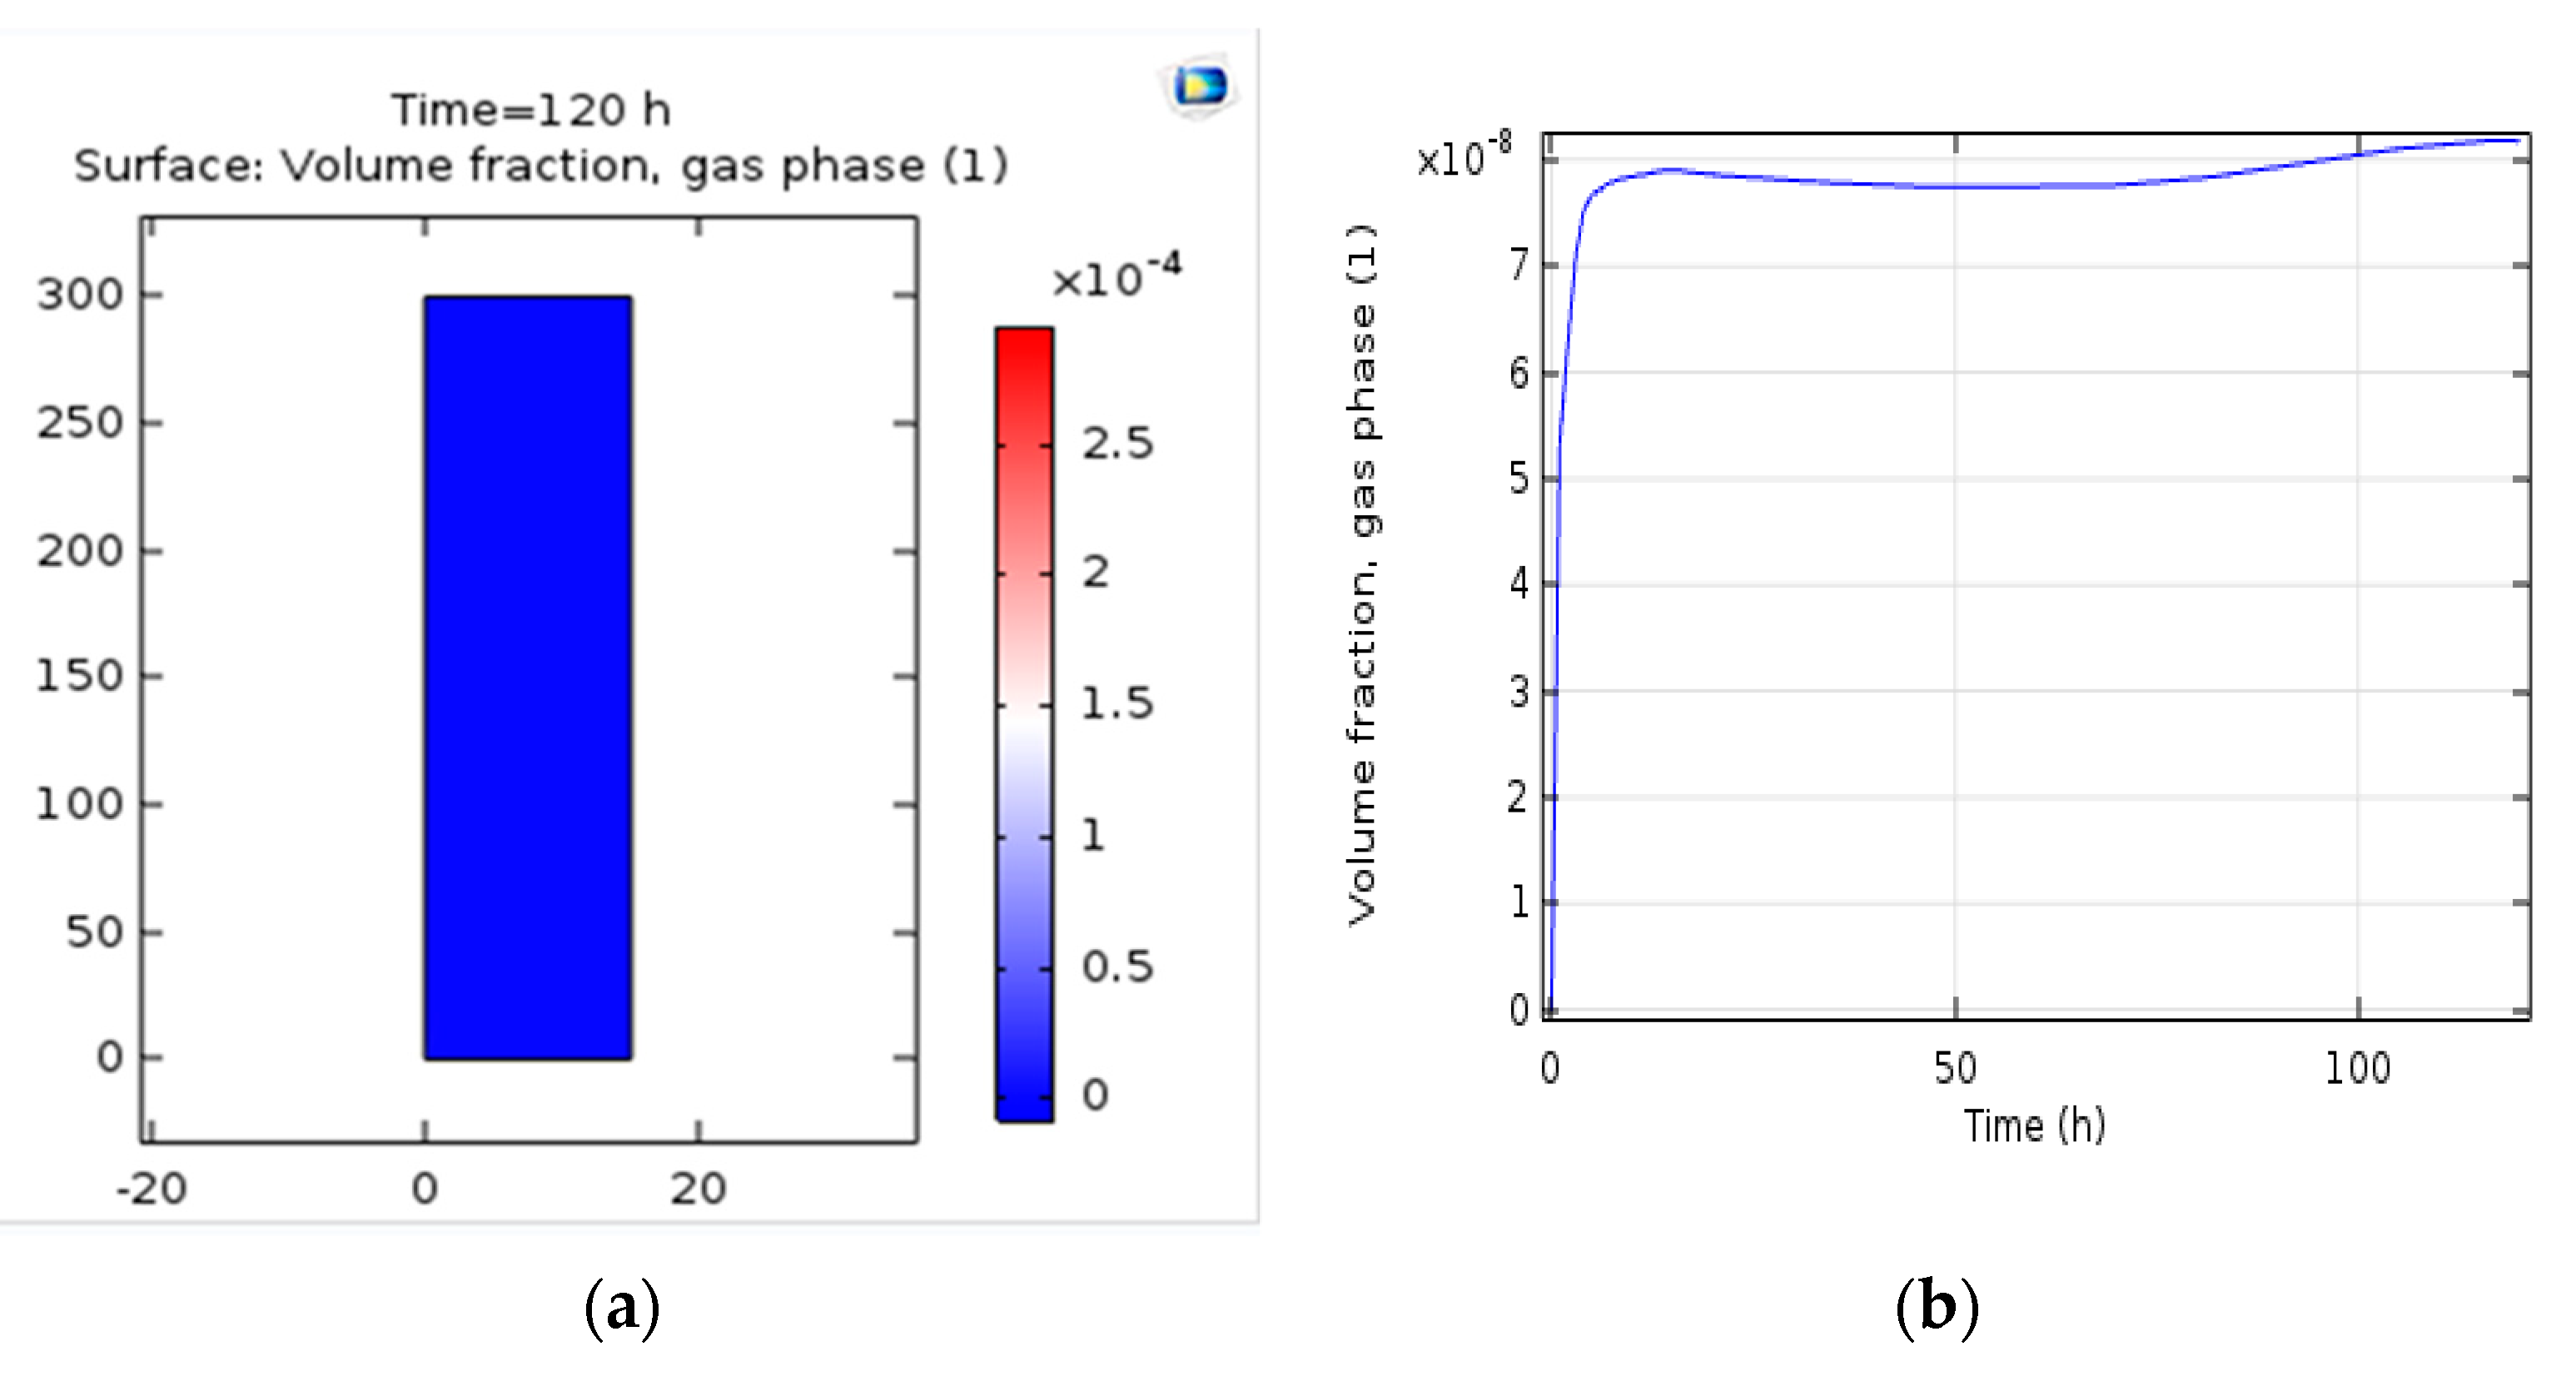
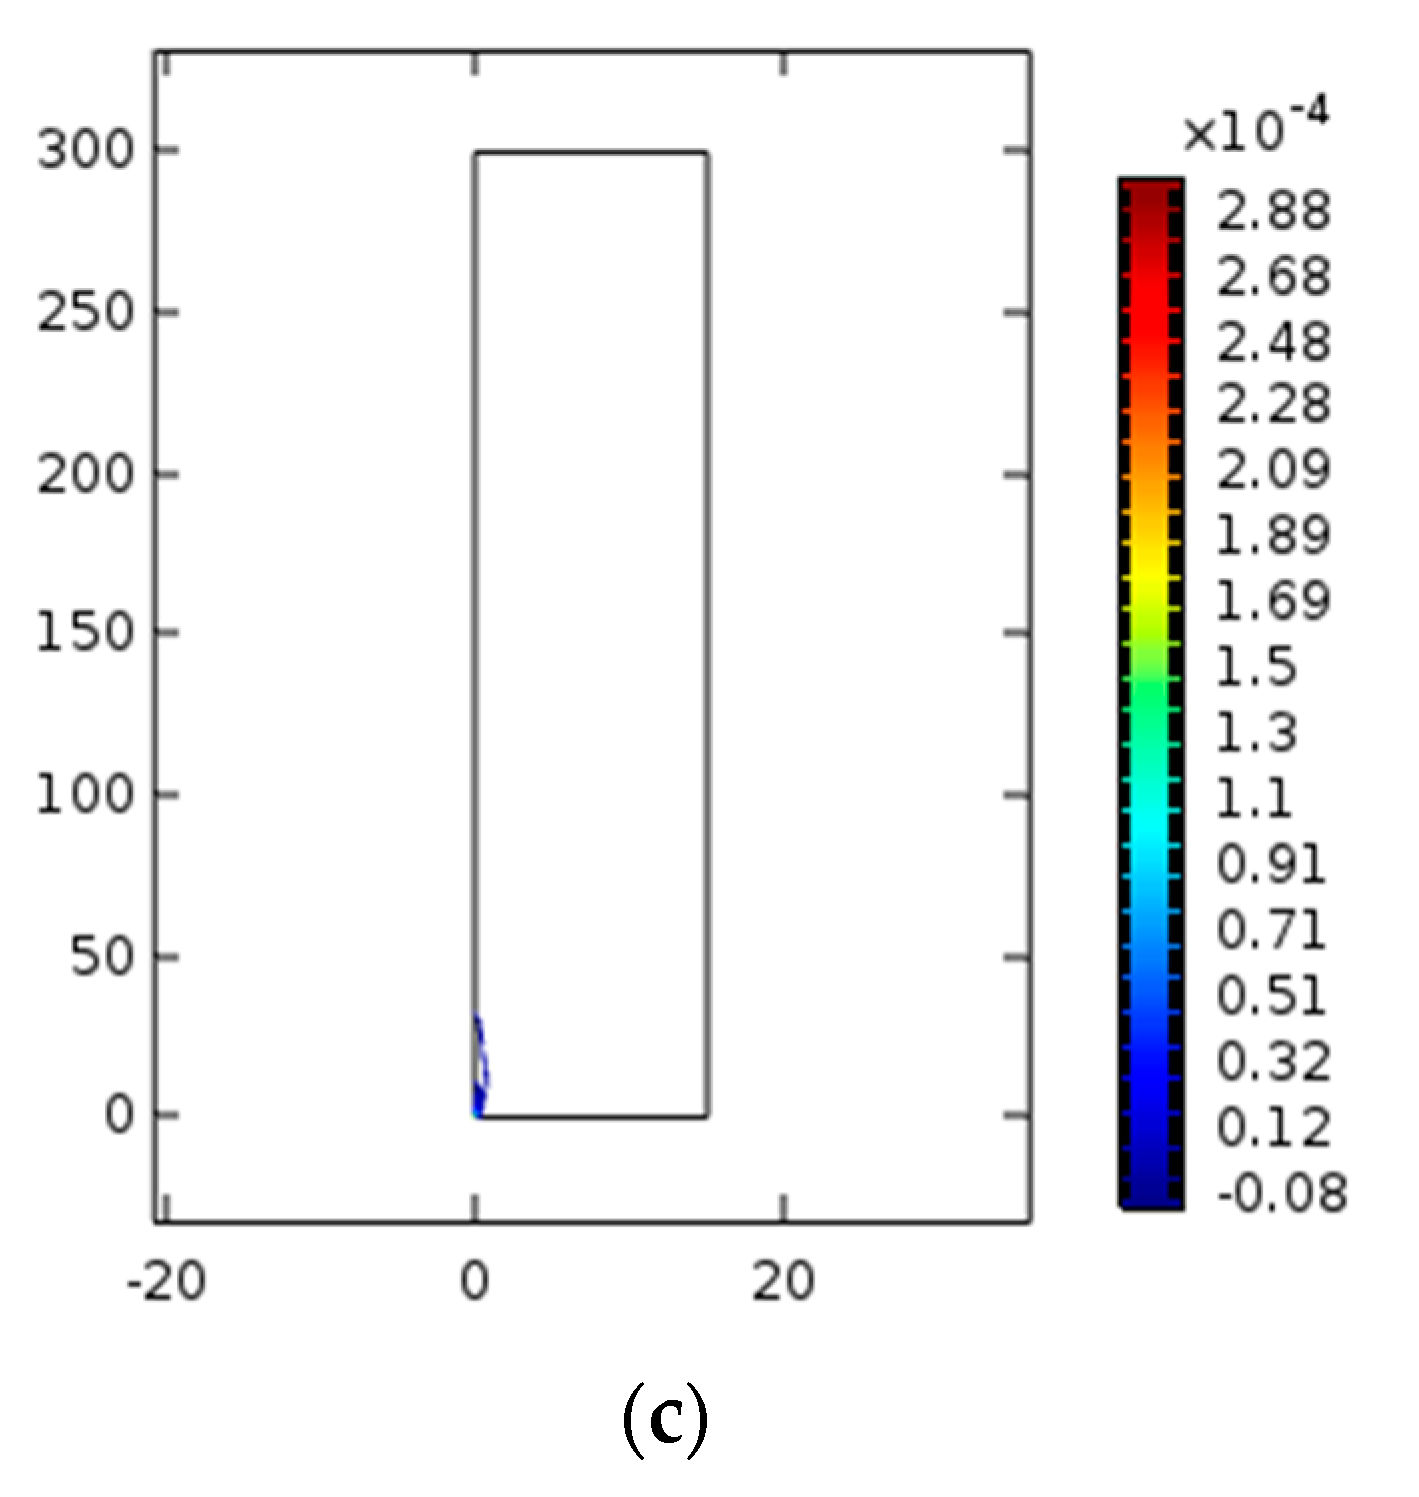
3.7. Gas Accumulation
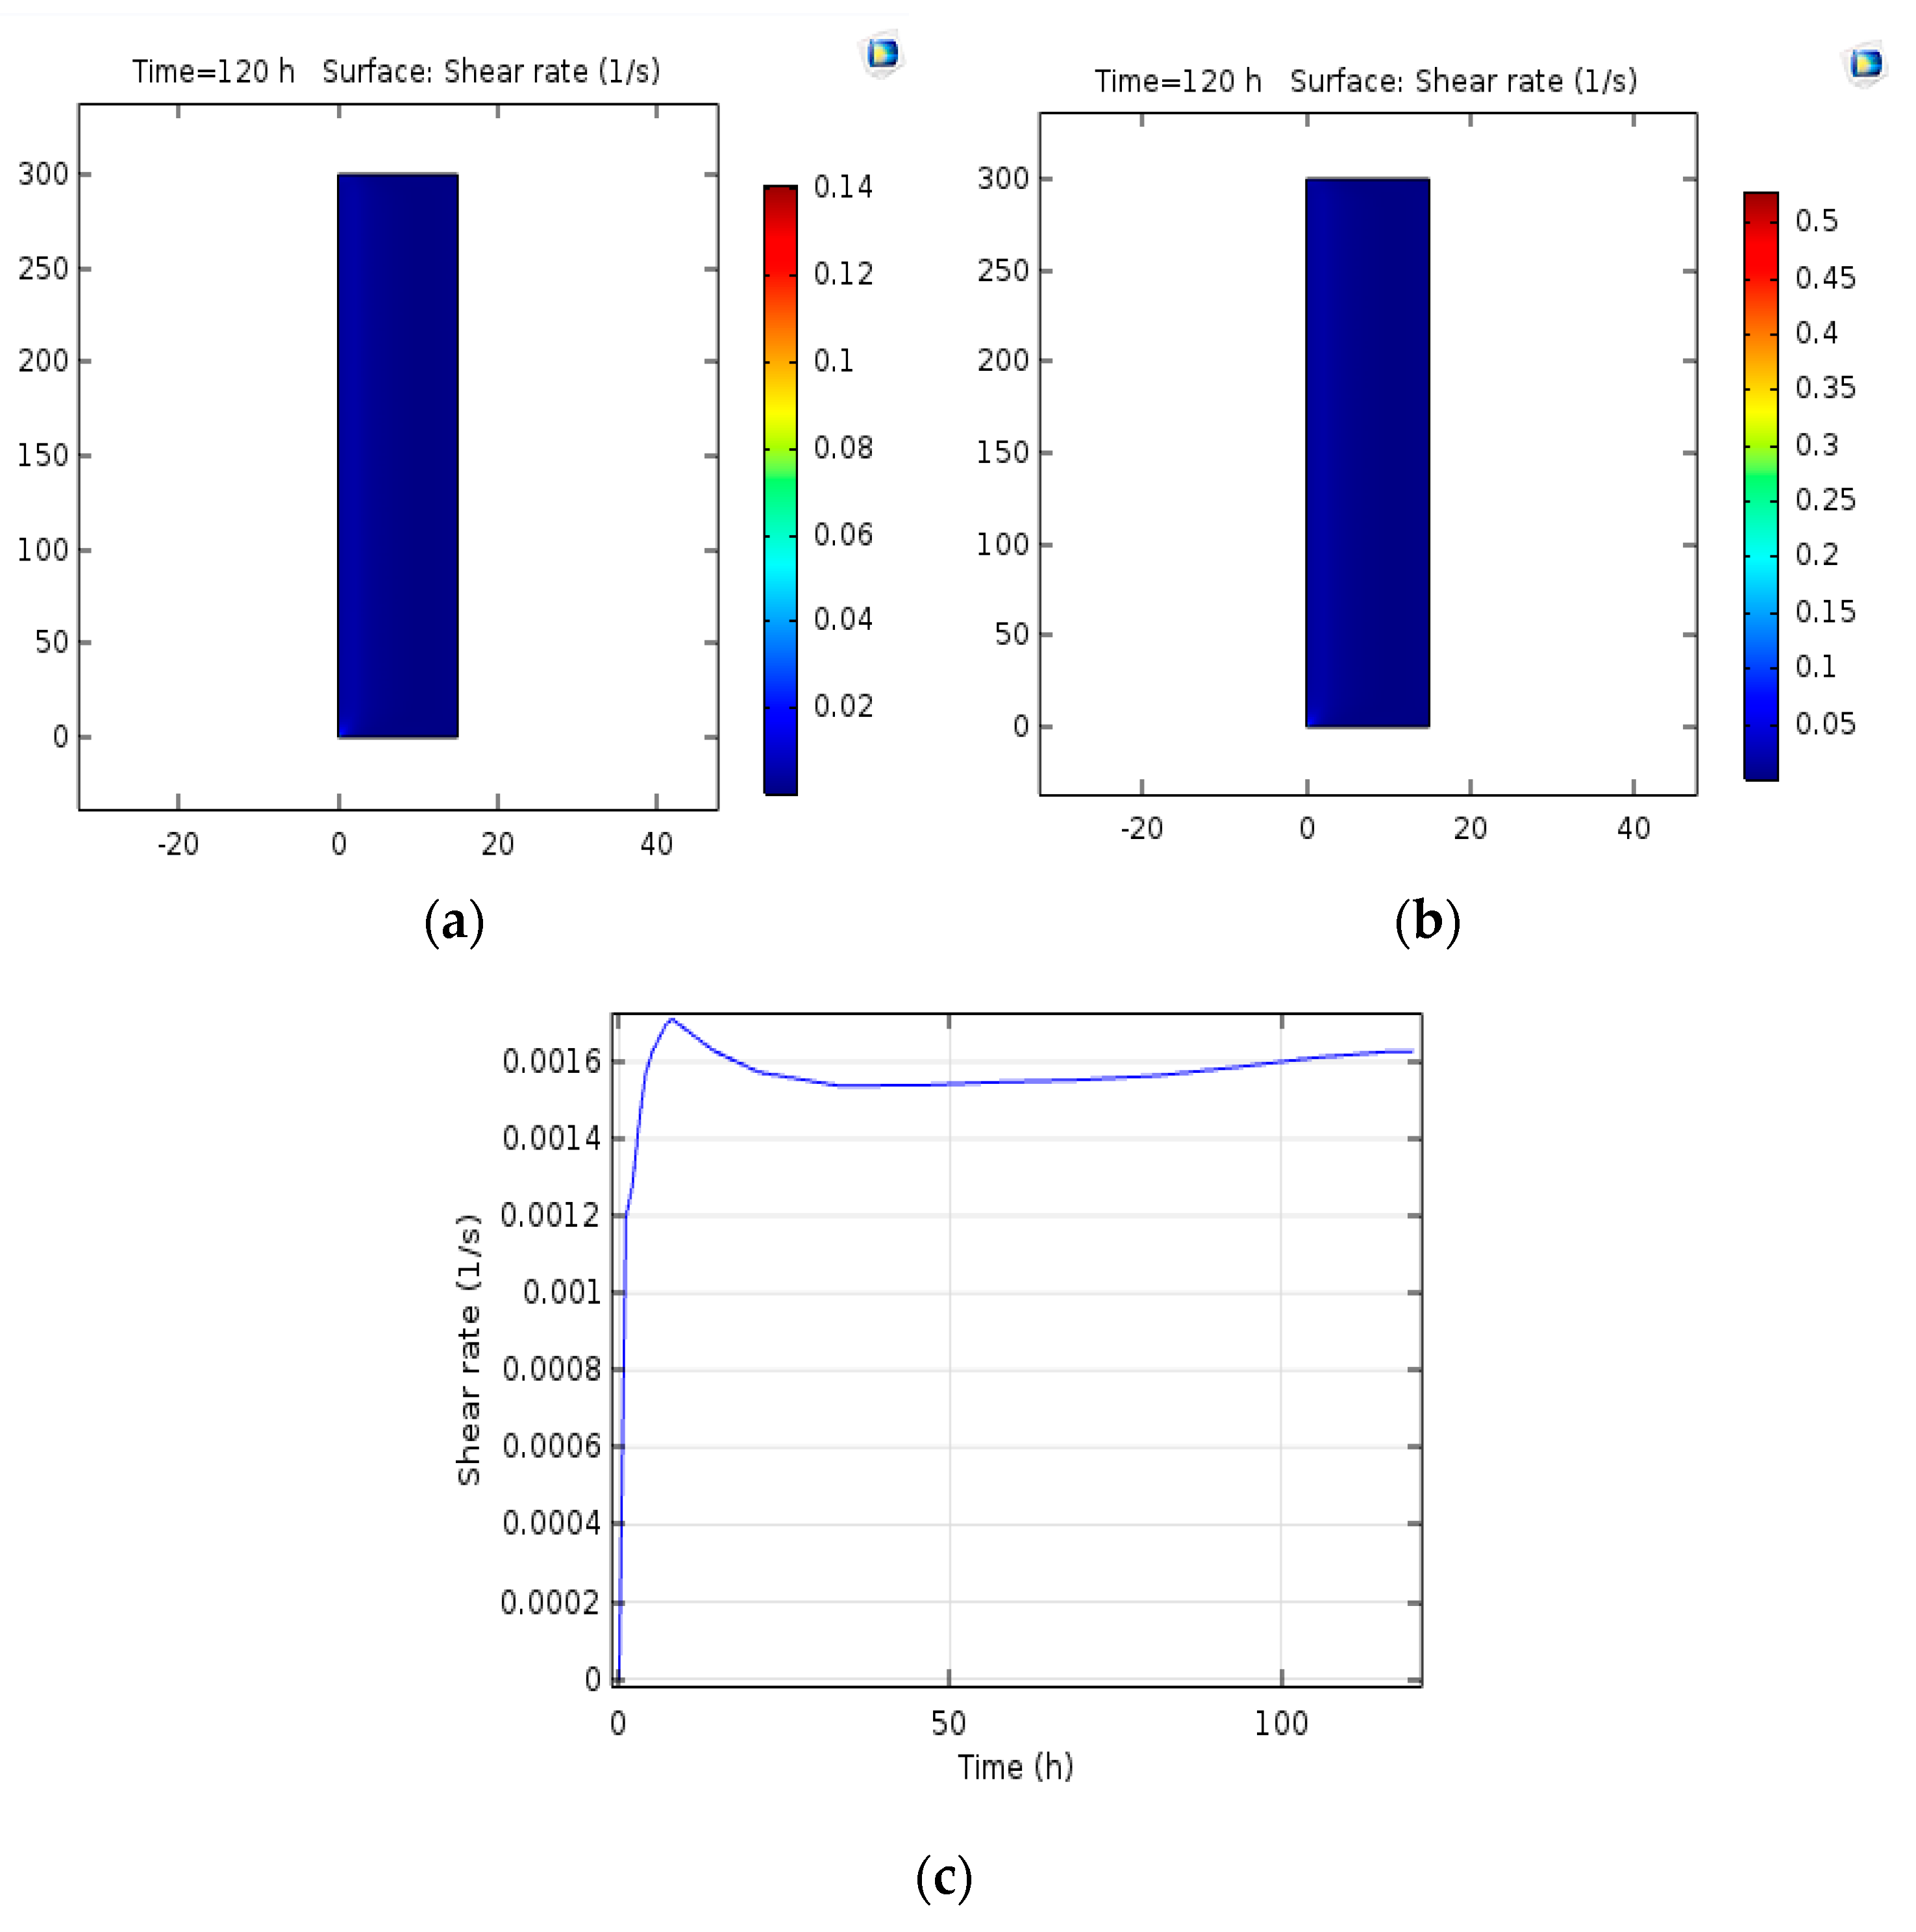
3.8. Shear Stress
4. Discussion
4.1. The Results of Resolution Independence Analysis of Numerical Grid
4.2. Concentration of Biomass
4.2.1. Concentration Contour
4.2.2. Concentration Variations versus Time
4.3. Velocity Contour
4.4. Analysis of Variations in the Input Gas Velocity
4.5. Effect of Changing the Bubble Diameter on the Concentration
4.6. Pressure Analysis
4.7. Gas Accumulation
4.8. Shear Stress
5. Conclusions
Author Contributions
Funding
Acknowledgments
Conflicts of Interest
Appendix A
| Parameters | Description |
| Dry weight of cell (g/L) | |
| Kd | Cell death rate (s/1) |
| μ | Growth rates for cell mass (1/s) |
| μmax | The maximum specific growth rate of microorganisms (1/s) |
| S | The concentration of limited substrate for growth (g/L) |
| Ks | Monod constant (g/L) |
| α | Fixed cell death time (s−1) |
| Kd (∞) | Infinite cell death rate (s−1) |
| Velocity value in (m/s) | |
| p | Pressure in (Pa) |
| ϕ | Volume fraction indicated with m3/m3 |
| Density value with kg/m3 | |
| g | Gravity unit with m/s2 |
| F | N/m3 |
| μL | Dynamic velocity Pa.s |
| mgl | The mass transfer rate from gas to liquid (kg/m3) |
| Uslip | Relative velocity |
| Udrift | Drift velocity |
| M | The molecular weight of the gas (kg/mol) |
| R | Ideal gas constant (J/(mol·K) 3/3141472) |
| T | Temperature (K) |
| Pref | Scalar variable at (1 at or 101.325 Pa) |
| μ | Effective viscosity |
References
- Brandl, H.; Gross, R.A.; Lenz, R.W.; Fuller, R.C. Plastics from bacteria and for bacteria: Poly (β-hydroxyalkanoates) as natural, biocompatible, and biodegradable polyesters. In Microbial Bioproducts; Springer: Berlin, Germany, 1990; pp. 77–93. [Google Scholar]
- Reddy, C.S.K.; Ghai, R.; Kalia, V. Polyhydroxyalkanoates: An overview. Bioresour. Technol. 2003, 87, 137–146. [Google Scholar] [CrossRef]
- Shimao, M. Biodegradation of plastics. Curr. Opin. Biotechnol. 2001, 12, 242–247. [Google Scholar] [CrossRef]
- Chen, C.S.; Liu, T.G.; Lin, L.W.; Xie, X.D.; Chen, X.H.; Liu, Q.C.; Liang, B.; Yu, W.W.; Qiu, C.Y. Multi-walled carbon nanotube-supported metal-doped ZnO nanoparticles and their photocatalytic property. J. Nanopart. Res. 2013, 15, 1295. [Google Scholar] [CrossRef] [PubMed]
- Braunegg, G.; Lefebvre, G.; Genser, K.F. Polyhydroxyalkanoates, biopolyesters from renewable resources: Physiological and engineering aspects. J. Biotechnol. 1998, 65, 127–161. [Google Scholar] [CrossRef]
- Mofradnia, S.R.; Tavakoli, Z.; Yazdian, F.; Rashedi, H.; Rasekh, B. Fe/starch nanoparticle-Pseudomonas aeruginosa: Bio-physiochemical and MD studies. Int. J. Biol. Macromol. 2018, 117, 51–61. [Google Scholar] [CrossRef] [PubMed]
- Mofradnia, S.R.; Ashouri, R.; Tavakoli, Z.; Shahmoradi, F.; Rashedi, H.; Yazdian, F. Effect of zero-valent iron/starch nanoparticle on nitrate removal using MD simulation. Int. J. Biol. Macromol. 2018, 121, 727–733. [Google Scholar] [CrossRef] [PubMed]
- Ashouri, R.; Ghasemipoor, P.; Rasekh, B.; Yazdian, F.; Mofradnia, S.R.M.; Ghasemipoor, R.A.P.; Yazdian, B.R.F.; Mofradnia, S.R.M. The effect of ZnO-based carbonaceous materials for degradation of benzoic pollutants: A review. Int. J. Environ. Sci. Technol. 2018, 16, 1–12. [Google Scholar] [CrossRef]
- Khanna, S.; Srivastava, A.K. Statistical media optimization studies for growth and PHB production by Ralstonia eutropha. Process Biochem. 2005, 40, 2173–2182. [Google Scholar] [CrossRef]
- Young, F.K.; Kastner, J.R.; May, S.W. Microbial production of poly-β-hydroxybutyric acid from D-xylose and lactose by Pseudomonas cepacia. Appl. Environ. Microbiol. 1994, 60, 4195–4198. [Google Scholar] [PubMed]
- Lee, S.Y. Bacterial polyhydroxyalkanoates. Biotechnol. Bioeng. 1996, 49, 1–14. [Google Scholar] [CrossRef]
- Yamane, T. Yield of poly-D (−)-3-hydroxybutyrate from various carbon sources: A theoretical study. Biotechnol. Bioeng. 1993, 41, 165–170. [Google Scholar] [CrossRef] [PubMed]
- Saratale, R.G.; Saratale, G.D.; Cho, S.K.; Kim, D.S.; Ghodake, G.S.; Kadam, A.; Kumar, G.; Bharagava, R.N.; Banu, R.; Shin, H.S. Pretreatment of kenaf (Hibiscus cannabinus L.) biomass feedstock for polyhydroxybutyrate (PHB) production and characterization. Bioresour. Technol. 2019, 282, 75–80. [Google Scholar] [CrossRef] [PubMed]
- Khosravi-Darani, K.; Bucci, D.Z. Application of poly (hydroxyalkanoate) in food packaging: Improvements by nanotechnology. Chem. Biochem. Eng. Q. 2015, 29, 275–285. [Google Scholar] [CrossRef]
- Darani, K.K.; Vasheghani-Farahani, E.; Tanaka, K. Hydrogen oxidizing bacteria as poly (hydroxybutyrate) producers. Iran. J. Biotechnol. 2006, 4, 193–196. [Google Scholar]
- Khosravi-Darani, K.; Yazdian, F.; Babapour, F.; Amirsadeghi, A.R. Poly (3-hydroxybutyrate) Production from Natural Gas by a Methanotroph Native Bacterium in a Bubble Column Bioreactor. Chem. Biochem. Eng. Q. 2019, 33, 69–77. [Google Scholar] [CrossRef]
- Ghoddosi, F.; Golzar, H.; Yazdian, F.; Khosravi-Darani, K.; Vasheghani-Farahani, E. Effect of carbon sources for PHB production in bubble column bioreactor: Emphasis on improvement of methane uptake. J. Environ. Chem. Eng. 2019, 7, 102978. [Google Scholar] [CrossRef]
- Mokhtari-Hosseini, Z.B.; Vasheghani-Farahani, E.; Heidarzadeh-Vazifekhoran, A.; Shojaosadati, S.A.; Karimzadeh, R.; Darani, K.K. Statistical media optimization for growth and PHB production from methanol by a methylotrophic bacterium. Bioresour. Technol. 2009, 100, 2436–2443. [Google Scholar] [CrossRef] [PubMed]
- Mokhtari-Hosseini, Z.B.; Vasheghani-Farahani, E.; Shojaosadati, S.A.; Karimzadeh, R.; Heidarzadeh-Vazifekhoran, A. Effect of feed composition on PHB production from methanol by HCDC of Methylobacterium extorquens (DSMZ 1340). J. Chem. Technol. Biotechnol. Int. Res. Process. Environ. Clean Technol. 2009, 84, 1136–1139. [Google Scholar]
- Bozorg, A.; Vossoughi, M.; Kazemi, A.; Alemzadeh, I. Optimal medium composition to enhance poly-β-hydroxybutyrate production by Ralstonia eutropha using cane molasses as sole carbon source. Appl. Food Biotechnol. 2015, 2, 39–47. [Google Scholar]
- Koller, M.; Hesse, P.; Fasl, H.; Stelzer, F.; Braunegg, G. Study on the Effect of Levulinic Acid on Whey-Based Biosynthesis of Poly (3-hydroxybutyrate-co-3-hydroxyvalerate) by Hydrogenophaga pseudoflava. Appl. Food Biotechnol. 2017, 4, 65–78. [Google Scholar]
- Khosravi-Darani, K.; Mokhtari, Z.B.; Amai, T.; Tanaka, K. Microbial production of poly (hydroxybutyrate) from C 1 carbon sources. Appl. Microbiol. Biotechnol. 2013, 97, 1407–1424. [Google Scholar] [CrossRef] [PubMed]
- Shahhosseini, S.; Sadeghi, M.T.; Khosravi Darani, K. Simulation and Model Validation of Batch PHB production process using Ralstonia eutropha. Iran. J. Chem. Chem. Eng. 2003, 22, 35–42. [Google Scholar]
- Khosravi Darani, K.; Vasheghani Farahani, E.; Shojaosadati, S.A. Application of the Plackett-Burman Statistical Design to Optimize Poly (Î2-hydroxybutyrate) Production by Ralstonia eutropha in Batch Culture. Iran. J. Biotechnol. 2003, 1, 155–161. [Google Scholar]
- Vasheghani Farahani, E.; Khosravi Darani, K.; Shojaosadati, S.A. Application of the Taguchi Design for Production of Poly (β-hydroxybutyrate) by Ralstonia eutropha. Iran. J. Chem. Chem. Eng. 2004, 23, 131–136. [Google Scholar]
- Khosravi-Darani, K.; Vasheghani-Farahani, E. Application of supercritical fluid extraction in biotechnology. Crit. Rev. Biotechnol. 2005, 25, 231–242. [Google Scholar] [CrossRef] [PubMed]
- Asenjo, J.A.; Suk, J.S. Microbial conversion of methane into poly-β-hydroxybutyrate (PHB): Growth and intracellular product accumulation in a type II methanotroph. J. Ferment. Technol. 1986, 64, 271–278. [Google Scholar] [CrossRef]
- Yazdian, F.; Shojaosadati, S.A.; Nosrati, M.; Pesaran Hajiabbas, M.; Vasheghani-Farahani, E. Investigation of gas properties, design, and operational parameters on hydrodynamic characteristics, mass transfer, and biomass production from natural gas in an external airlift loop bioreactor. Chem. Eng. Sci. 2009, 64, 2455–2465. [Google Scholar] [CrossRef]
- Bozorg, M.; Mofradnia, R. Simulation of Bioreactors for Poly (3-hydroxybutyrate) Production from Natural Gas. IJCCE 2018. (In press) [Google Scholar]
- Pérez, R.; Casal, J.; Muñoz, R.; Lebrero, R. Polyhydroxyalkanoates production from methane emissions in Sphagnum mosses: Assessing the effect of temperature and phosphorus limitation. Sci. Total Environ. 2019, 688, 684–690. [Google Scholar] [CrossRef] [Green Version]
- Zinn, M.; Witholt, B.; Egli, T. Occurrence, synthesis and medical application of bacterial polyhydroxyalkanoate. Adv. Drug Deliv. Rev. 2001, 53, 5–21. [Google Scholar] [CrossRef]
- Rezapour, N.; Rasekh, B.; Mofradnia, S.R.; Yazdian, F.; Rashedi, H.; Tavakoli, Z. Molecular dynamics studies of polysaccharide carrier based on starch in dental cavities. Int. J. Biol. Macromol. 2018, 121, 616–624. [Google Scholar] [CrossRef] [PubMed]
- Bordel, S.; Rodríguez, E.; Muñoz, R. Genome sequence of Methylocystis hirsuta CSC1, a polyhydroxyalkanoate producing methanotroph. Microbiologyopen 2019, 8, e00771. [Google Scholar] [CrossRef] [PubMed]
- Rahnama, F.; Vasheghani-Farahani, E.; Yazdian, F.; Shojaosadati, S.A. PHB production by Methylocystis hirsuta from natural gas in a bubble column and a vertical loop bioreactor. Biochem. Eng. J. 2012, 65, 51–56. [Google Scholar] [CrossRef]
- Yang, H.; Ye, H.; Zhai, S.; Wang, G.; Mavaddat, P.; Mousavi, S.M.; Amini, E.; Azargoshasb, H.; Shojaosadati, S.A. Modeling and CFD-PBE simulation of an airlift bioreactor for PHB production. Asia Pac. J. Chem. Eng. 2014, 9, 562–573. [Google Scholar]
- Mousavi, S.M.; Shojaosadati, S.A.; Golestani, J.; Yazdian, F. CFD simulation and optimization of effective parameters for biomass production in a horizontal tubular loop bioreactor. Chem. Eng. Process. Process Intensif. 2010, 49, 1249–1258. [Google Scholar] [CrossRef]
- Shah, A.A.; Hasan, F.; Hameed, A.; Ahmed, S. Biological degradation of plastics: A comprehensive review. Biotechnol. Adv. 2008, 26, 246–265. [Google Scholar] [CrossRef]
- Lau, Y.M.; Deen, N.G.; Kuipers, J.A.M. Development of an image measurement technique for size distribution in dense bubbly flows. Chem. Eng. Sci. 2013, 94, 20–29. [Google Scholar] [CrossRef]
- Yazdian, F.; Shojaosadati, S.A.; Nosrati, M.; Pesaran Hajiabbas, M.; Malek Khosravi, K. On-Line Measurement of Dissolved Methane Concentration During Methane Fermentation in a Loop Bioreactor. Iran. J. Chem. Chem. Eng. 2009, 28, 85–93. [Google Scholar]
- Yazdian, F.; Shojaosadati, S.A.; Fatemi, S. Study of Growth Kinetic Models of a Methanotroph Bacterium Growing on Natural Gas. J. Chem. Pet. Eng. 2009, 43. [Google Scholar] [CrossRef]
- Šimčík, M.; Mota, A.; Ruzicka, M.C.; Vicente, A.; Teixeira, J. CFD simulation and experimental measurement of gas holdup and liquid interstitial velocity in internal loop airlift reactor. Chem. Eng. Sci. 2011, 66, 3268–3279. [Google Scholar] [CrossRef] [Green Version]
- Wallen, L.L.; Rohwedder, W.K. Poly-beta-hydroxyalkanoate from activated sludge. Environ. Sci. Technol. 1974, 8, 576–579. [Google Scholar] [CrossRef]
- Koller, M. Switching from petro-plastics to microbial polyhydroxyalkanoates (PHA): The biotechnological escape route of choice out of the plastic predicament? EuroBiotech J. 2019, 3, 32–44. [Google Scholar] [CrossRef]


| Constants | Value |
|---|---|
| Temperature | 32 °C |
| Physical properties of the solute | discard |
| Velocity | Equal in all part |
| Situation of flow | Single-phase |
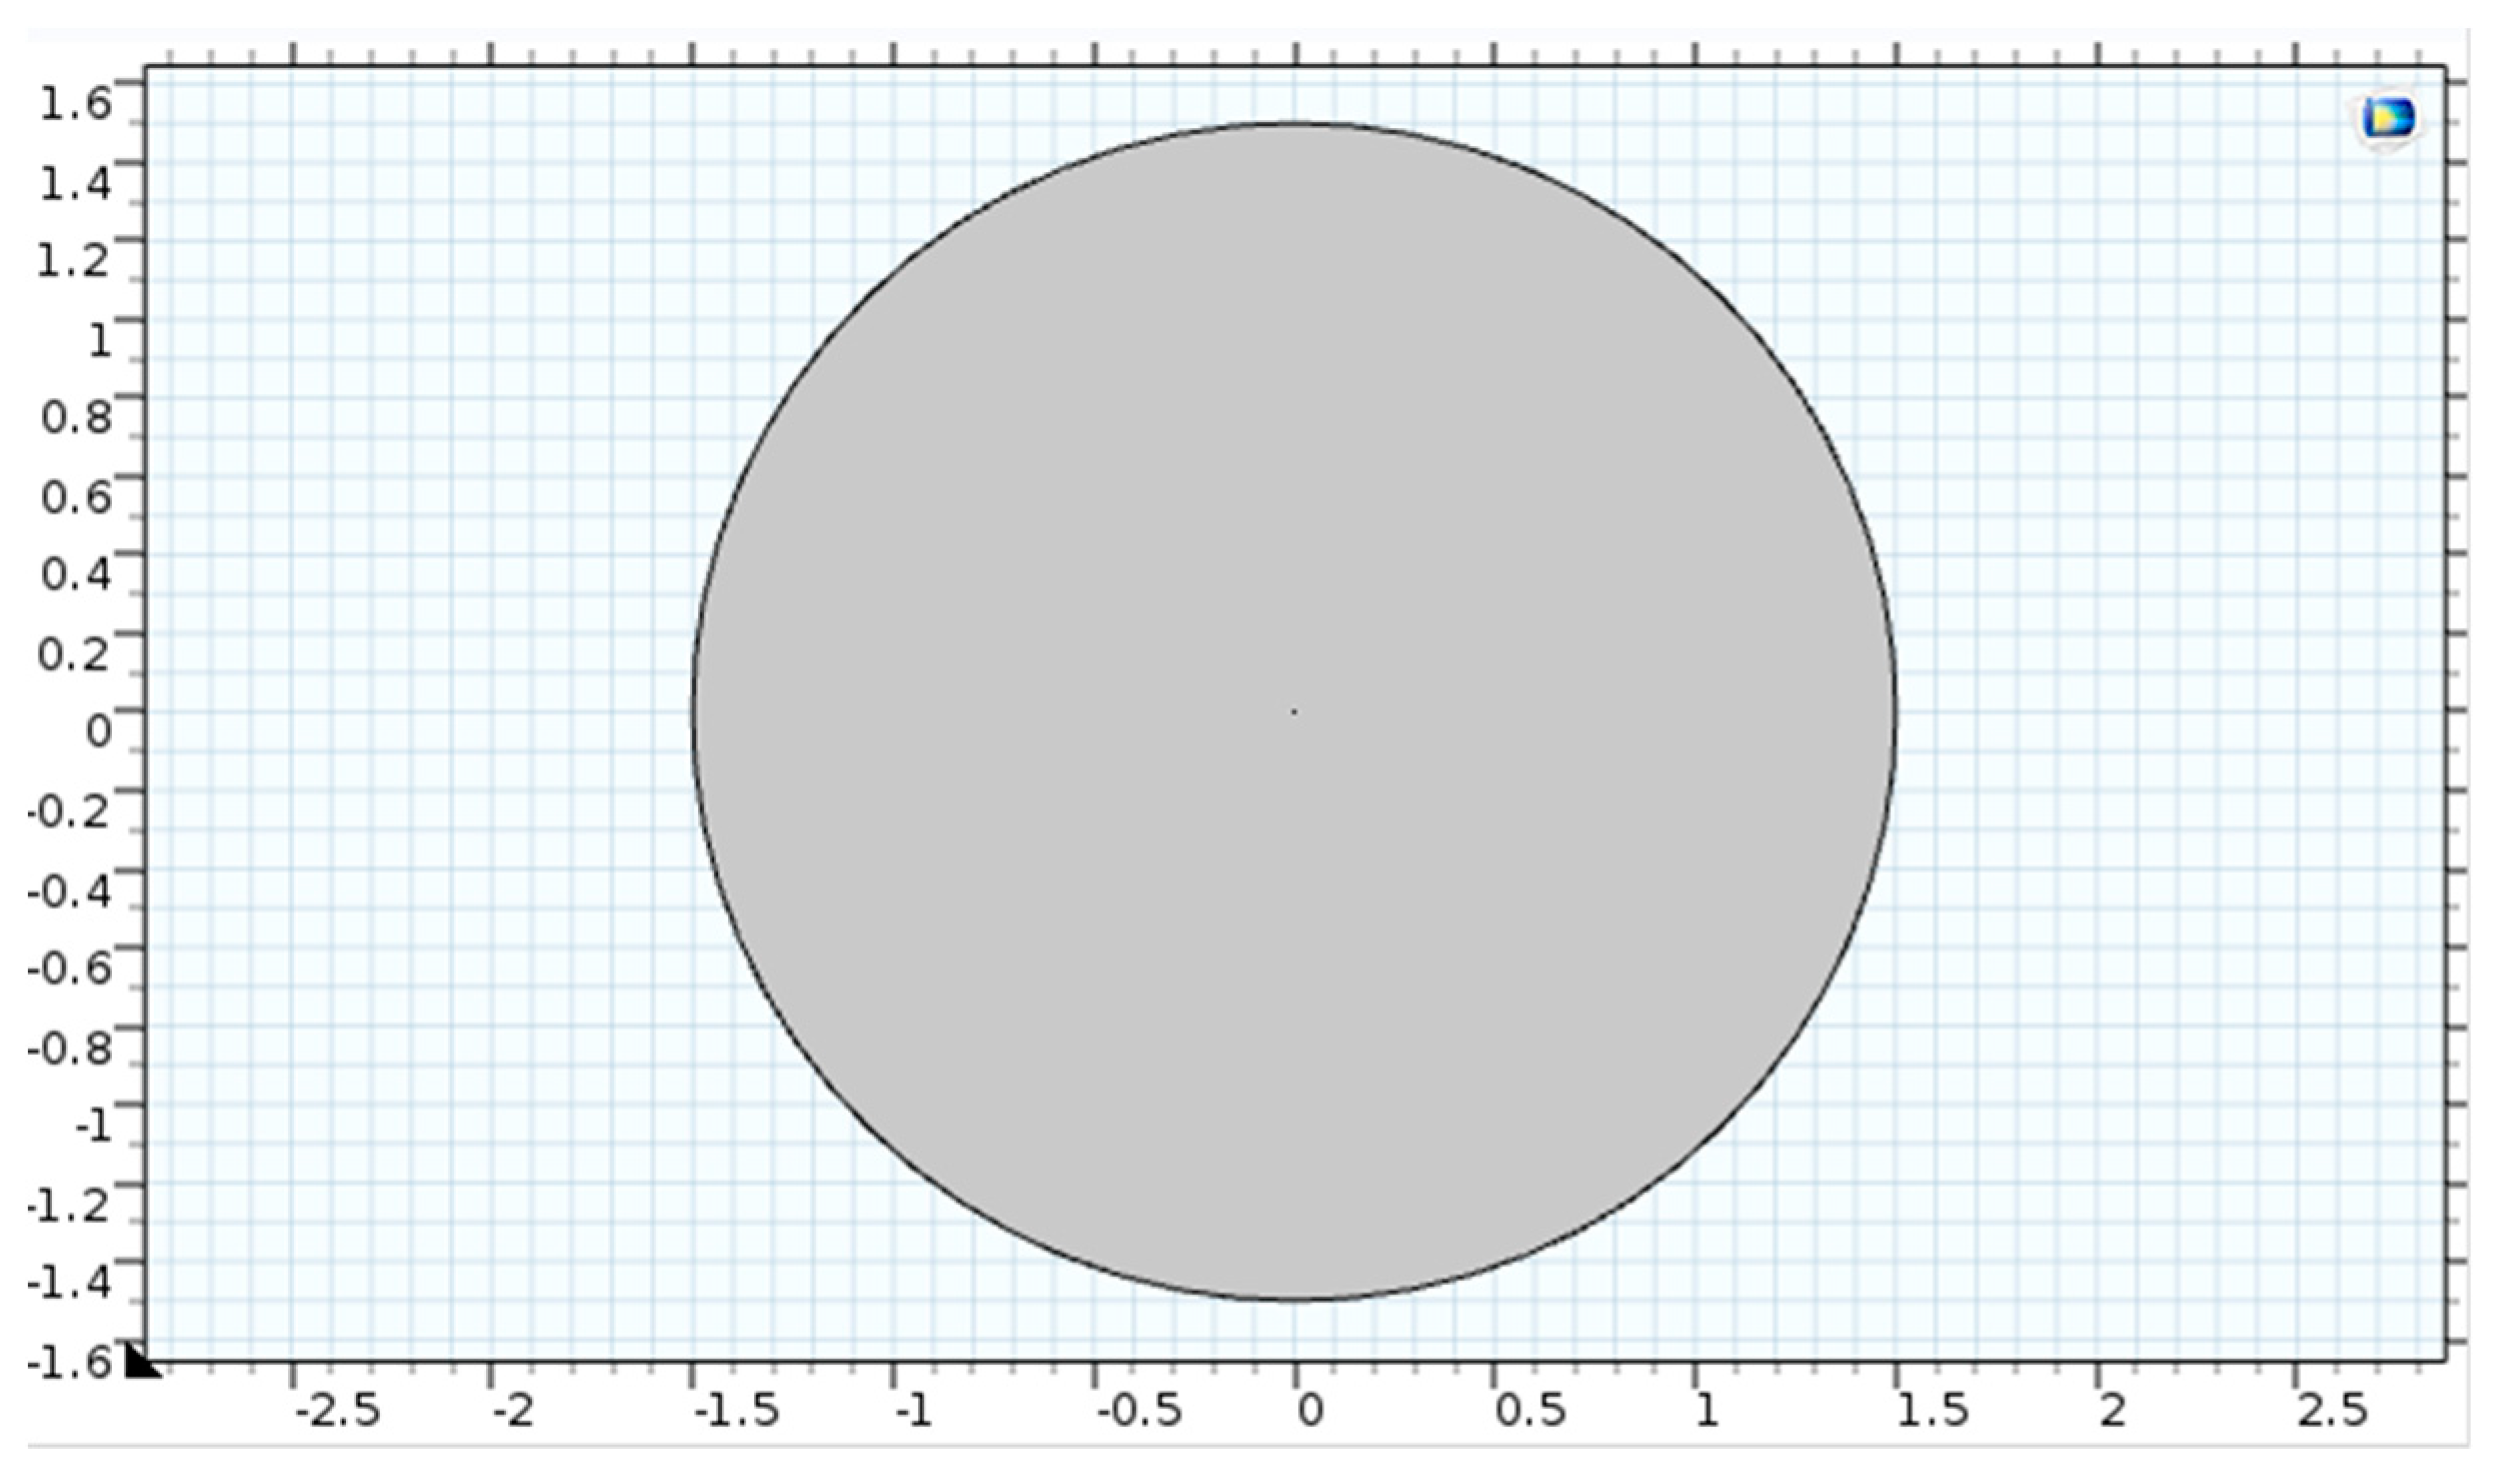
| Columnar bubble reactor | 30 cm and 1.5 cm |
| Mesh Size | Fine | Medium | Coarse |
|---|---|---|---|
| Number of elements | 70,563 | 34,269 | 16,396 |
| Mesh Size | Fine | Medium | Coarse |
|---|---|---|---|
| Concentration (g/L) | 1.63474 | 1.63338 | 1.63233 |
© 2019 by the authors. Licensee MDPI, Basel, Switzerland. This article is an open access article distributed under the terms and conditions of the Creative Commons Attribution (CC BY) license (http://creativecommons.org/licenses/by/4.0/).
Share and Cite
Moradi, M.; Rashedi, H.; Mofradnia, S.R.; Khosravi-Darani, K.; Ashouri, R.; Yazdian, F. Polyhydroxybutyrate Production from Natural Gas in A Bubble Column Bioreactor: Simulation Using COMSOL. Bioengineering 2019, 6, 84. https://doi.org/10.3390/bioengineering6030084
Moradi M, Rashedi H, Mofradnia SR, Khosravi-Darani K, Ashouri R, Yazdian F. Polyhydroxybutyrate Production from Natural Gas in A Bubble Column Bioreactor: Simulation Using COMSOL. Bioengineering. 2019; 6(3):84. https://doi.org/10.3390/bioengineering6030084
Chicago/Turabian StyleMoradi, Mohsen, Hamid Rashedi, Soheil Rezazadeh Mofradnia, Kianoush Khosravi-Darani, Reihaneh Ashouri, and Fatemeh Yazdian. 2019. "Polyhydroxybutyrate Production from Natural Gas in A Bubble Column Bioreactor: Simulation Using COMSOL" Bioengineering 6, no. 3: 84. https://doi.org/10.3390/bioengineering6030084