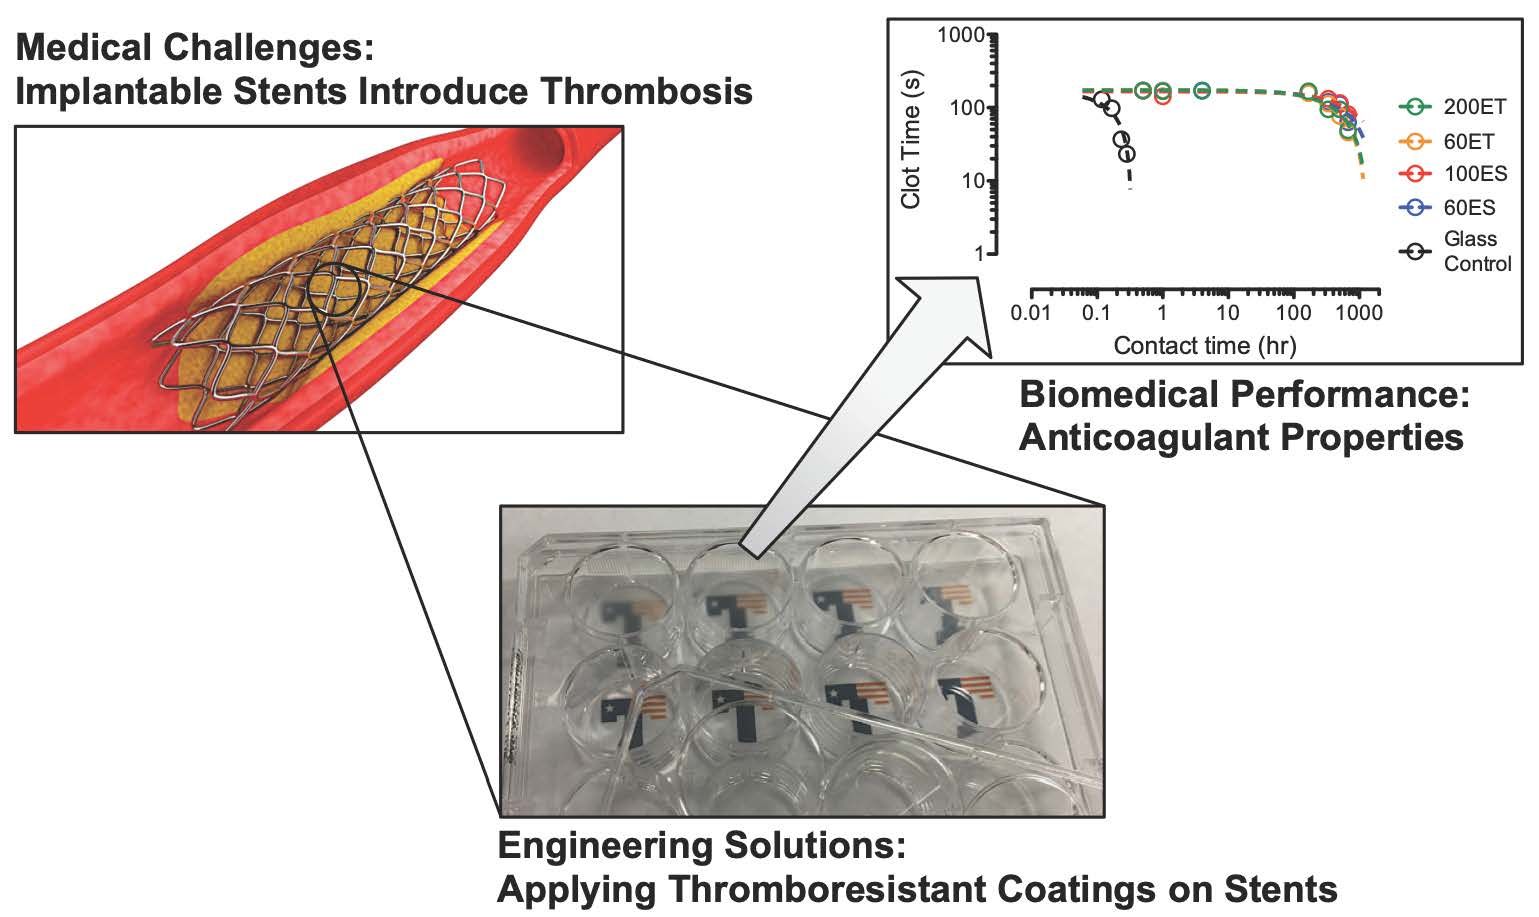
Thermal and Physico-Mechanical Characterizations of Thromboresistant Polyurethane Films

 and
and
Abstract
:
1. Introduction
2. Materials and Methods
2.1. Materials
2.2. Fourier-Transform Infrared (FTIR) and Nuclear Magnetic Resonance (NMR) Spectroscopy
2.3. Differential Scanning Calorimetry
2.4. Thermal Gravimetric Analysis
2.5. X-ray Diffraction
2.6. Water Contact Angle and Water Absorption
2.7. Mechanical Testing
2.8. Clotting Assays
3. Results and Discussion
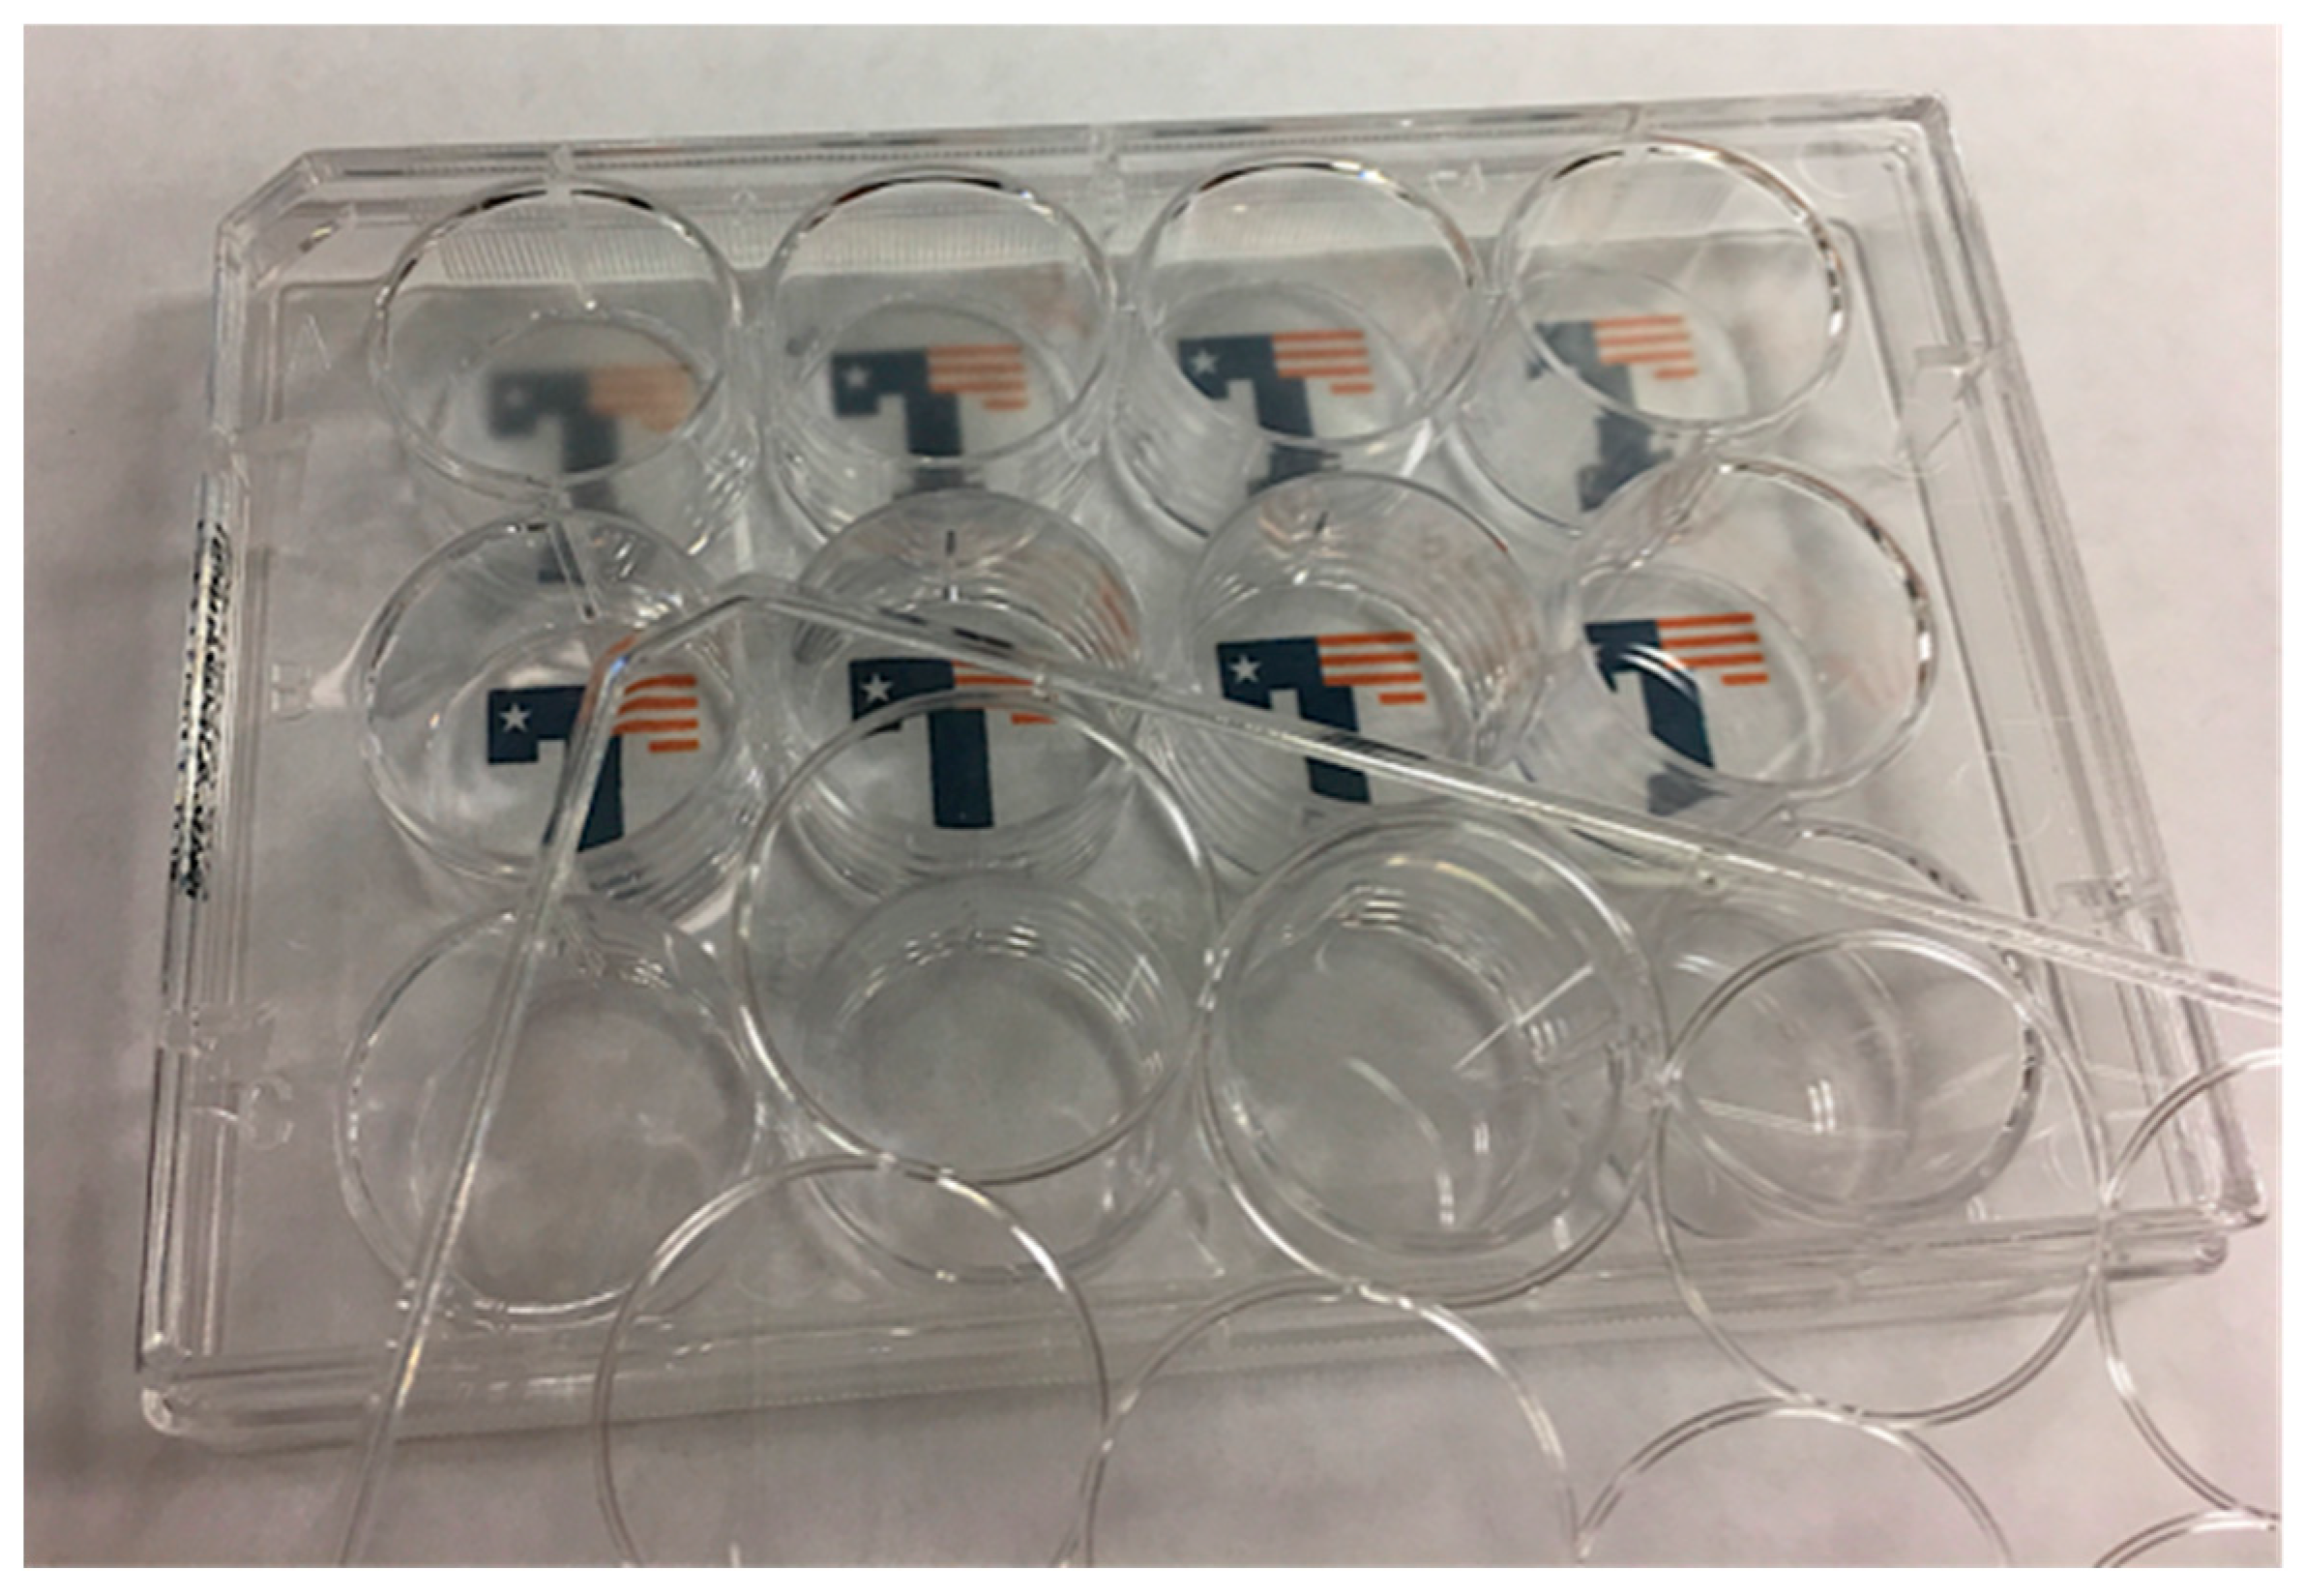
3.1. Appearance of the PU Films
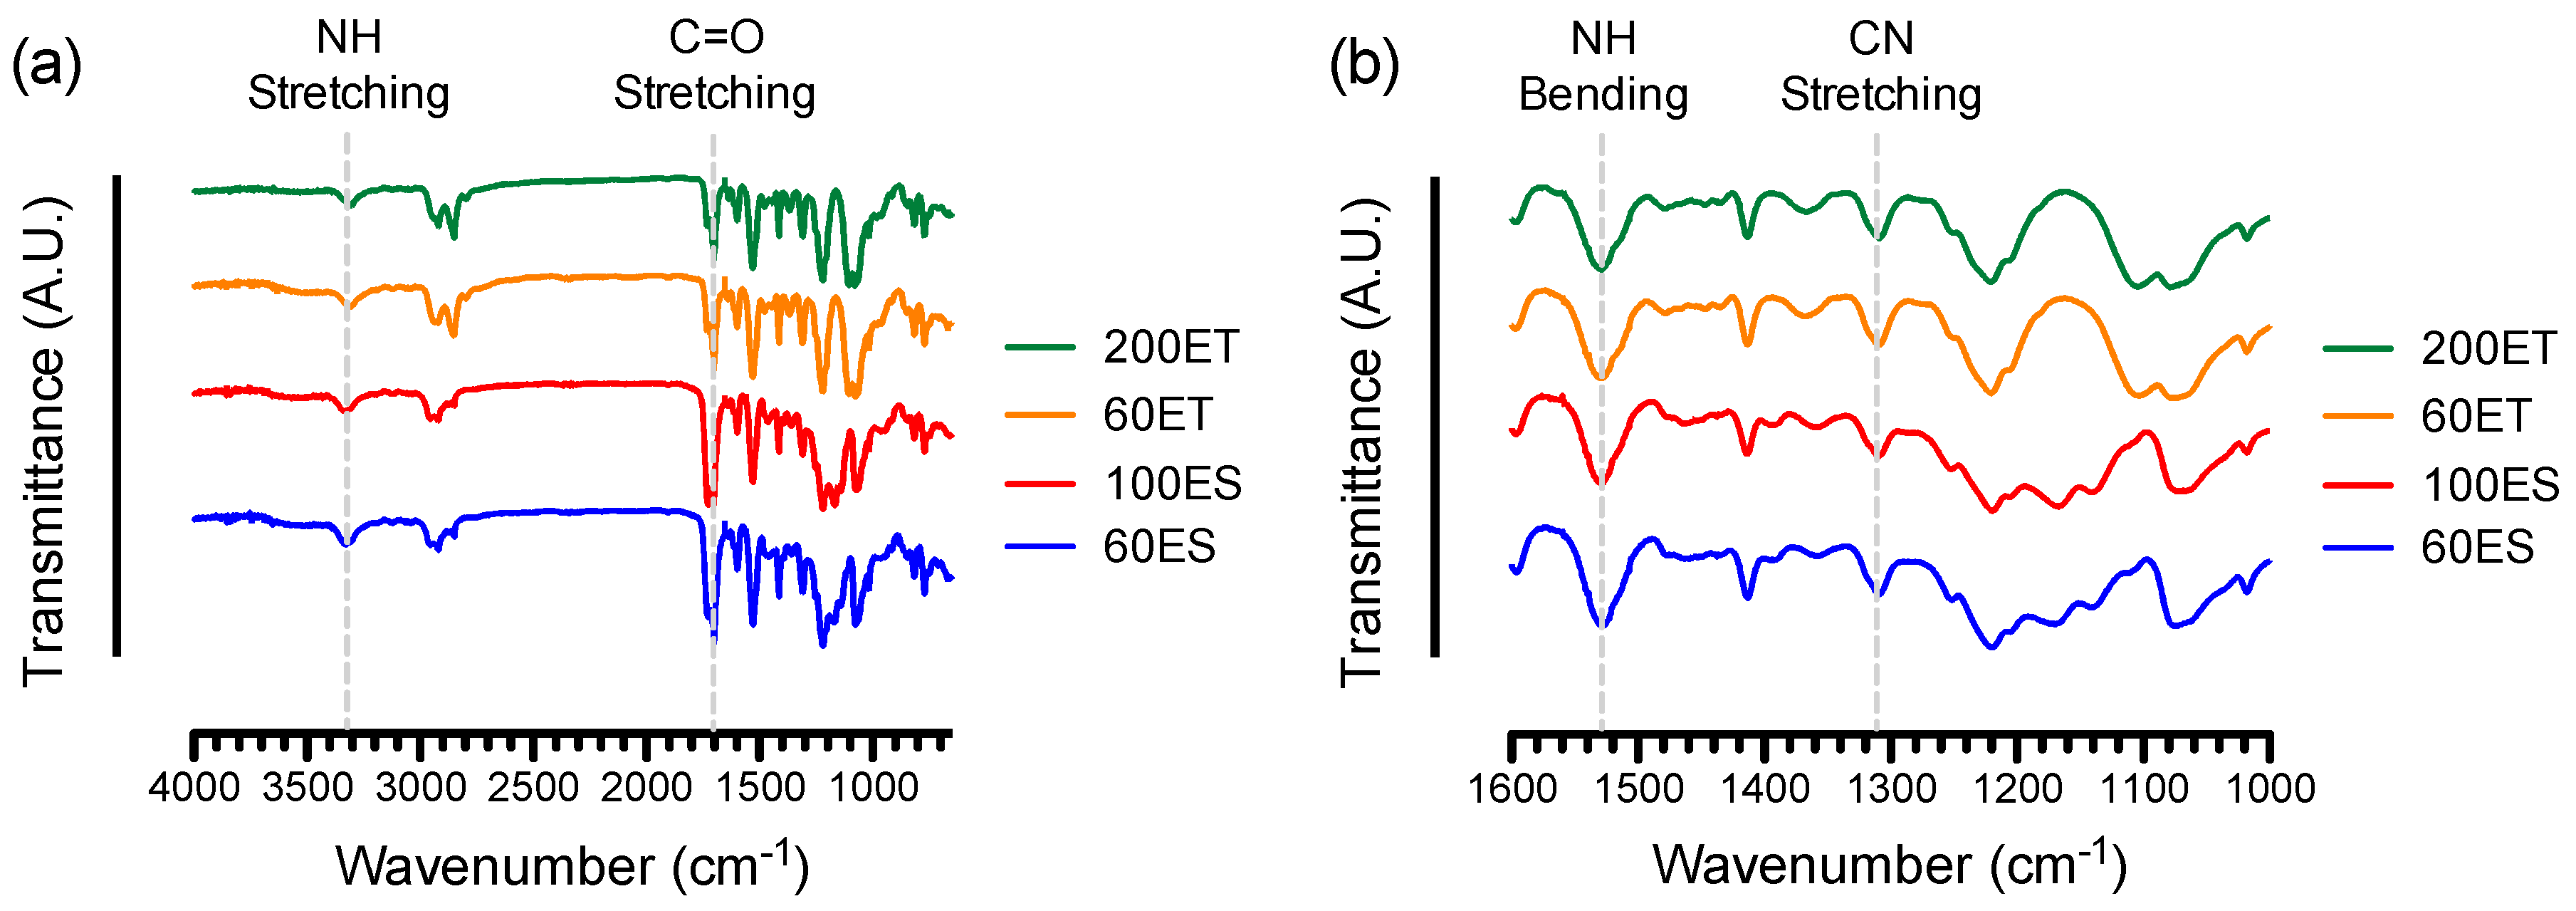
3.2. FTIR and NMR Spectroscopy
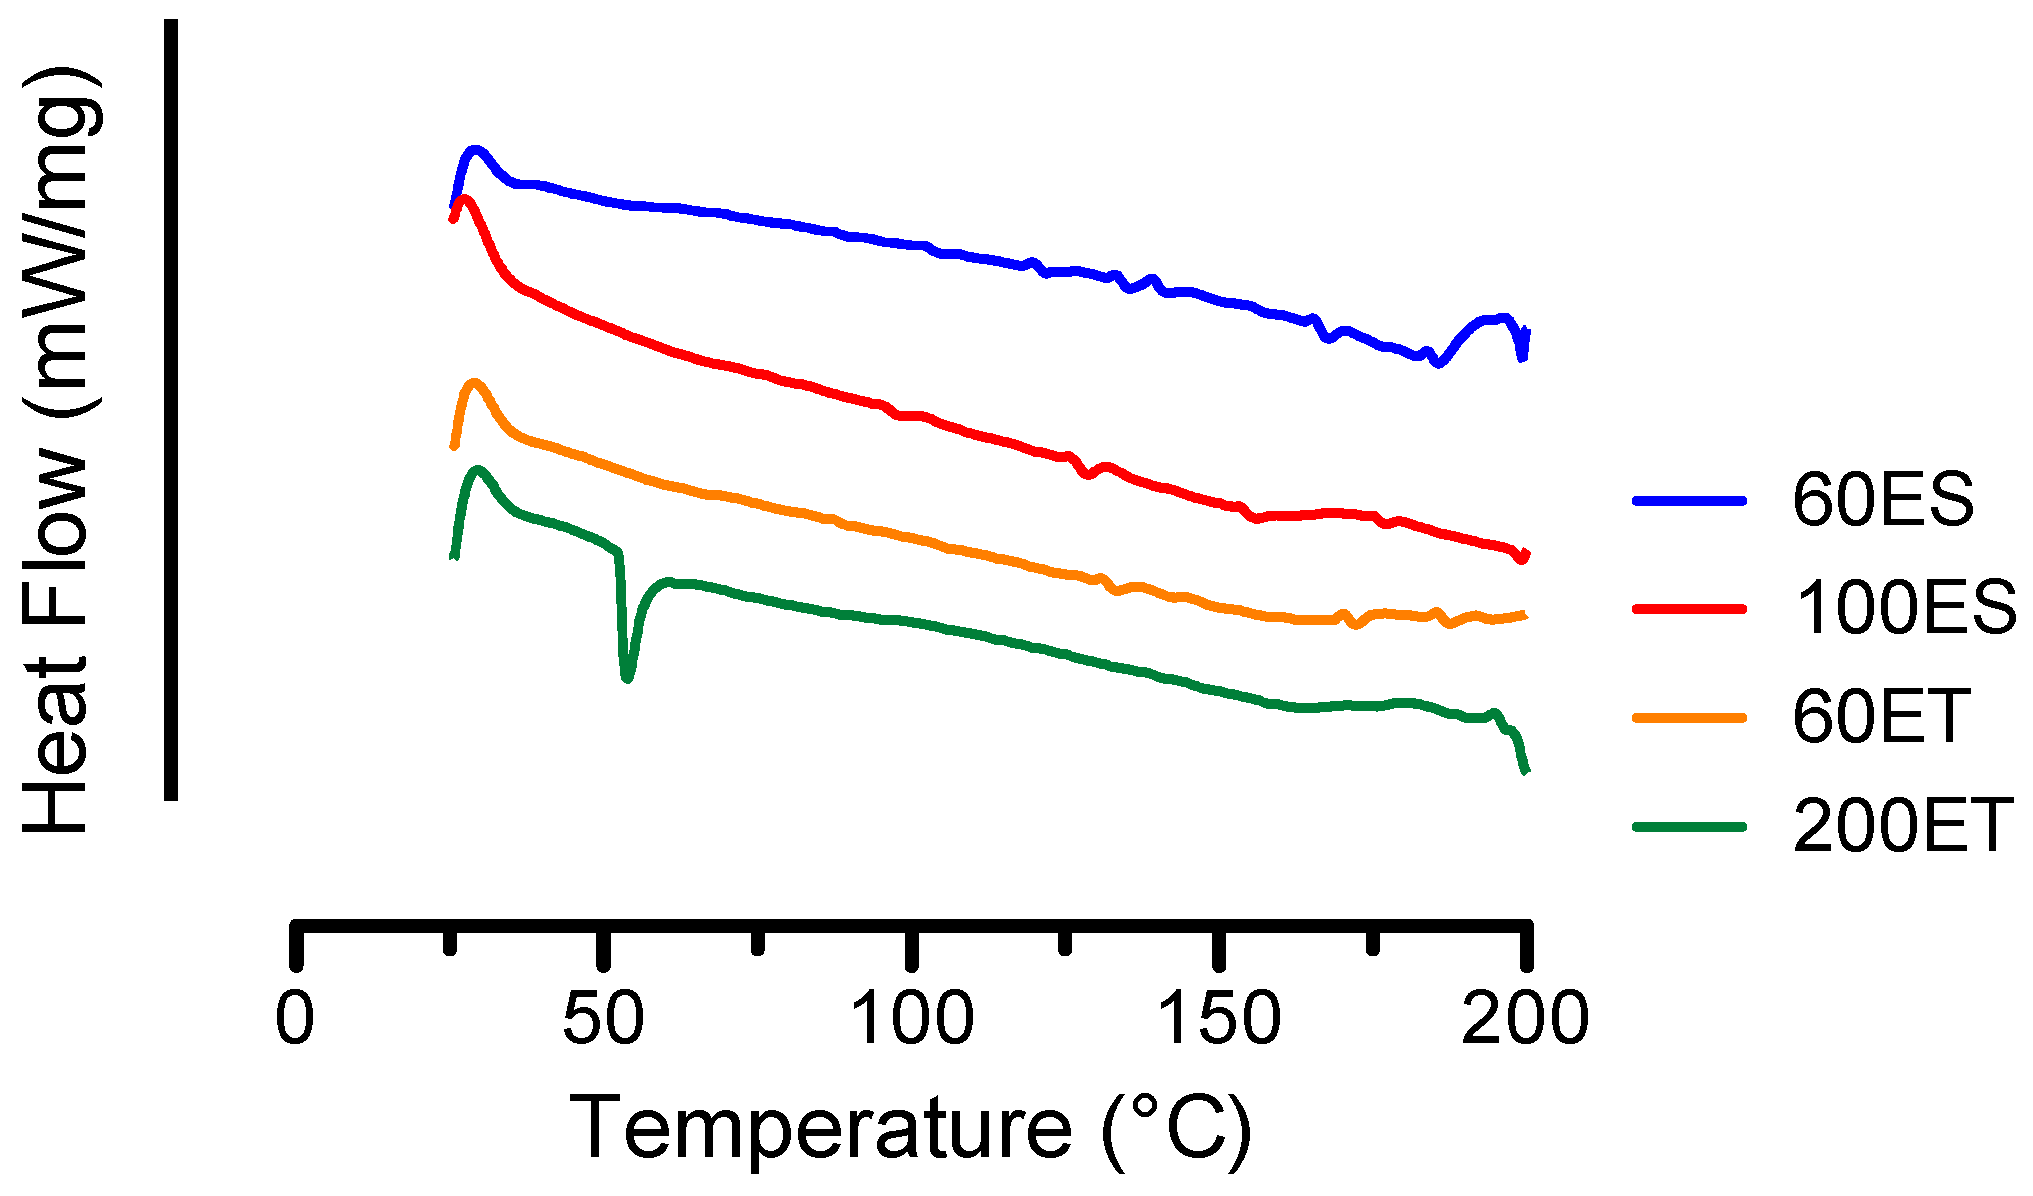
3.3. DSC
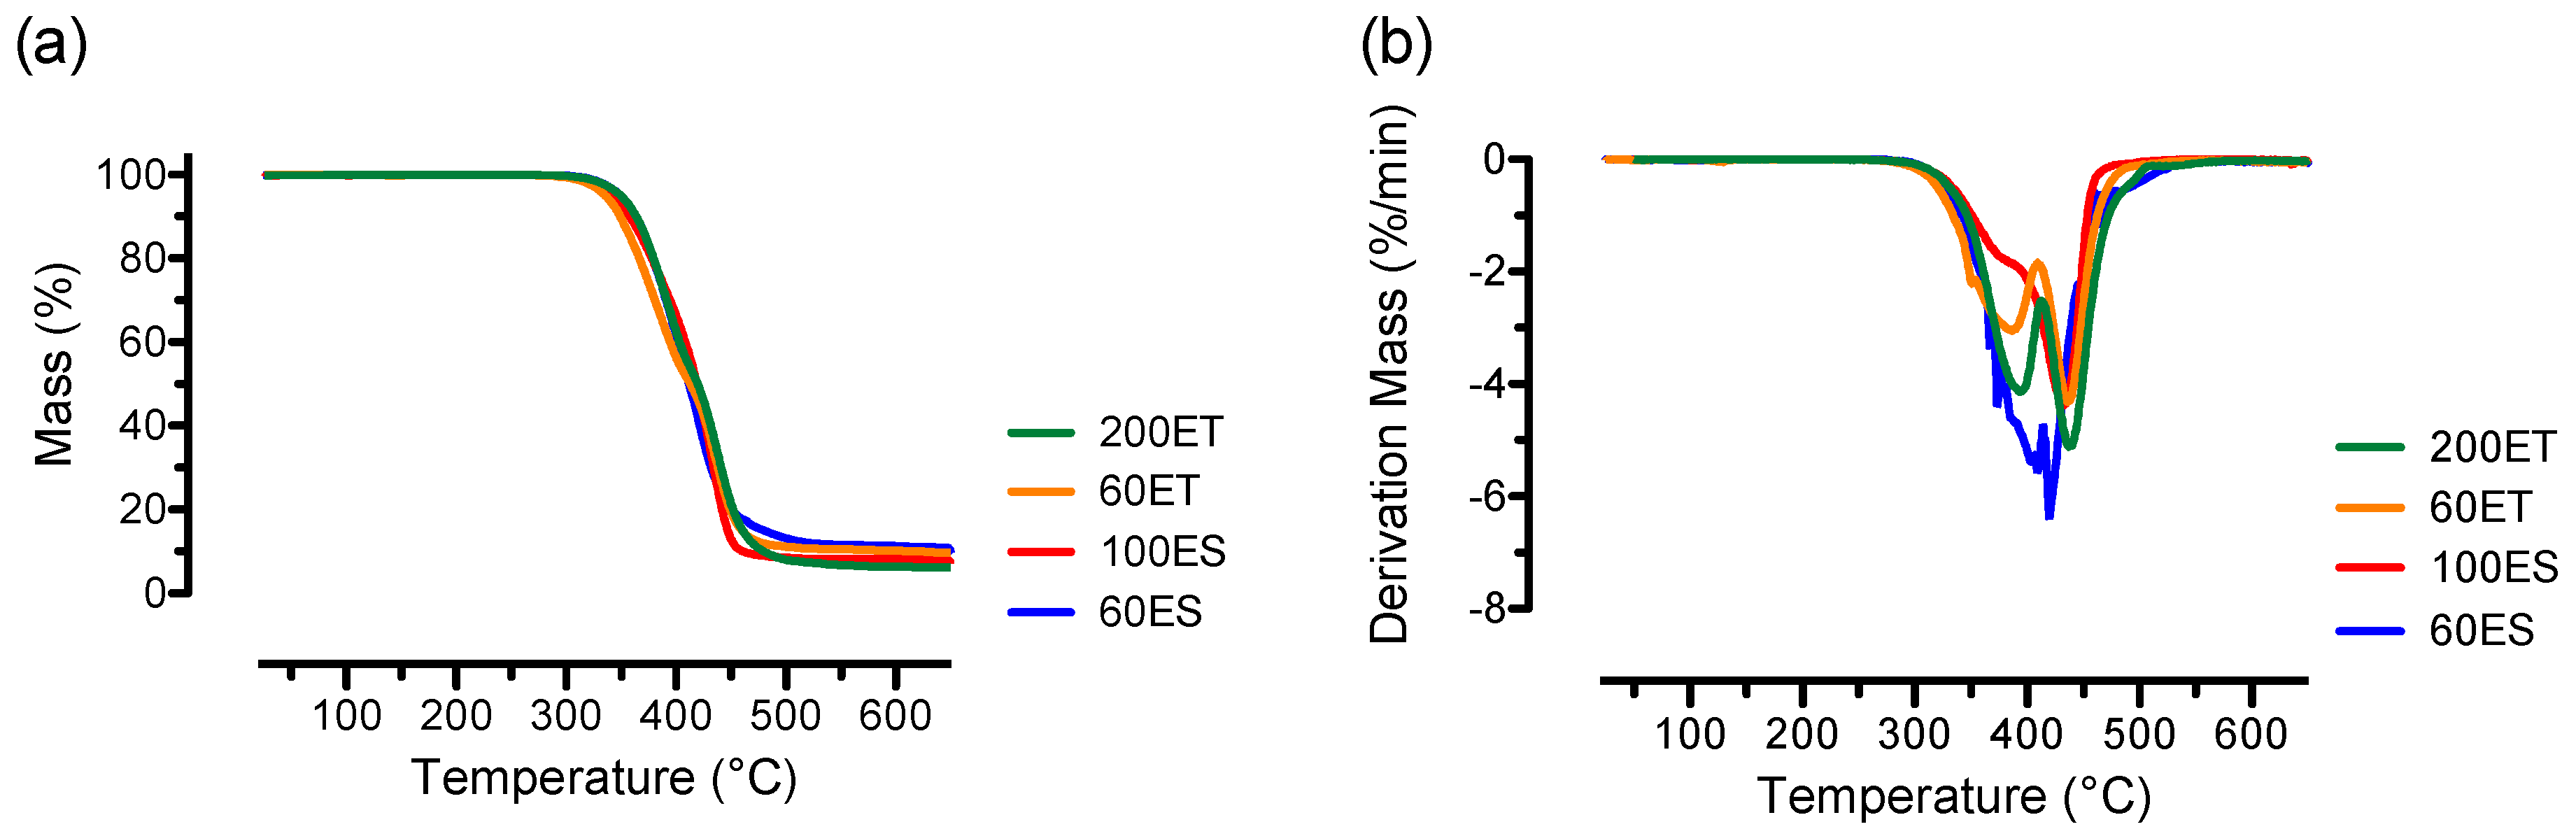
3.4. TGA
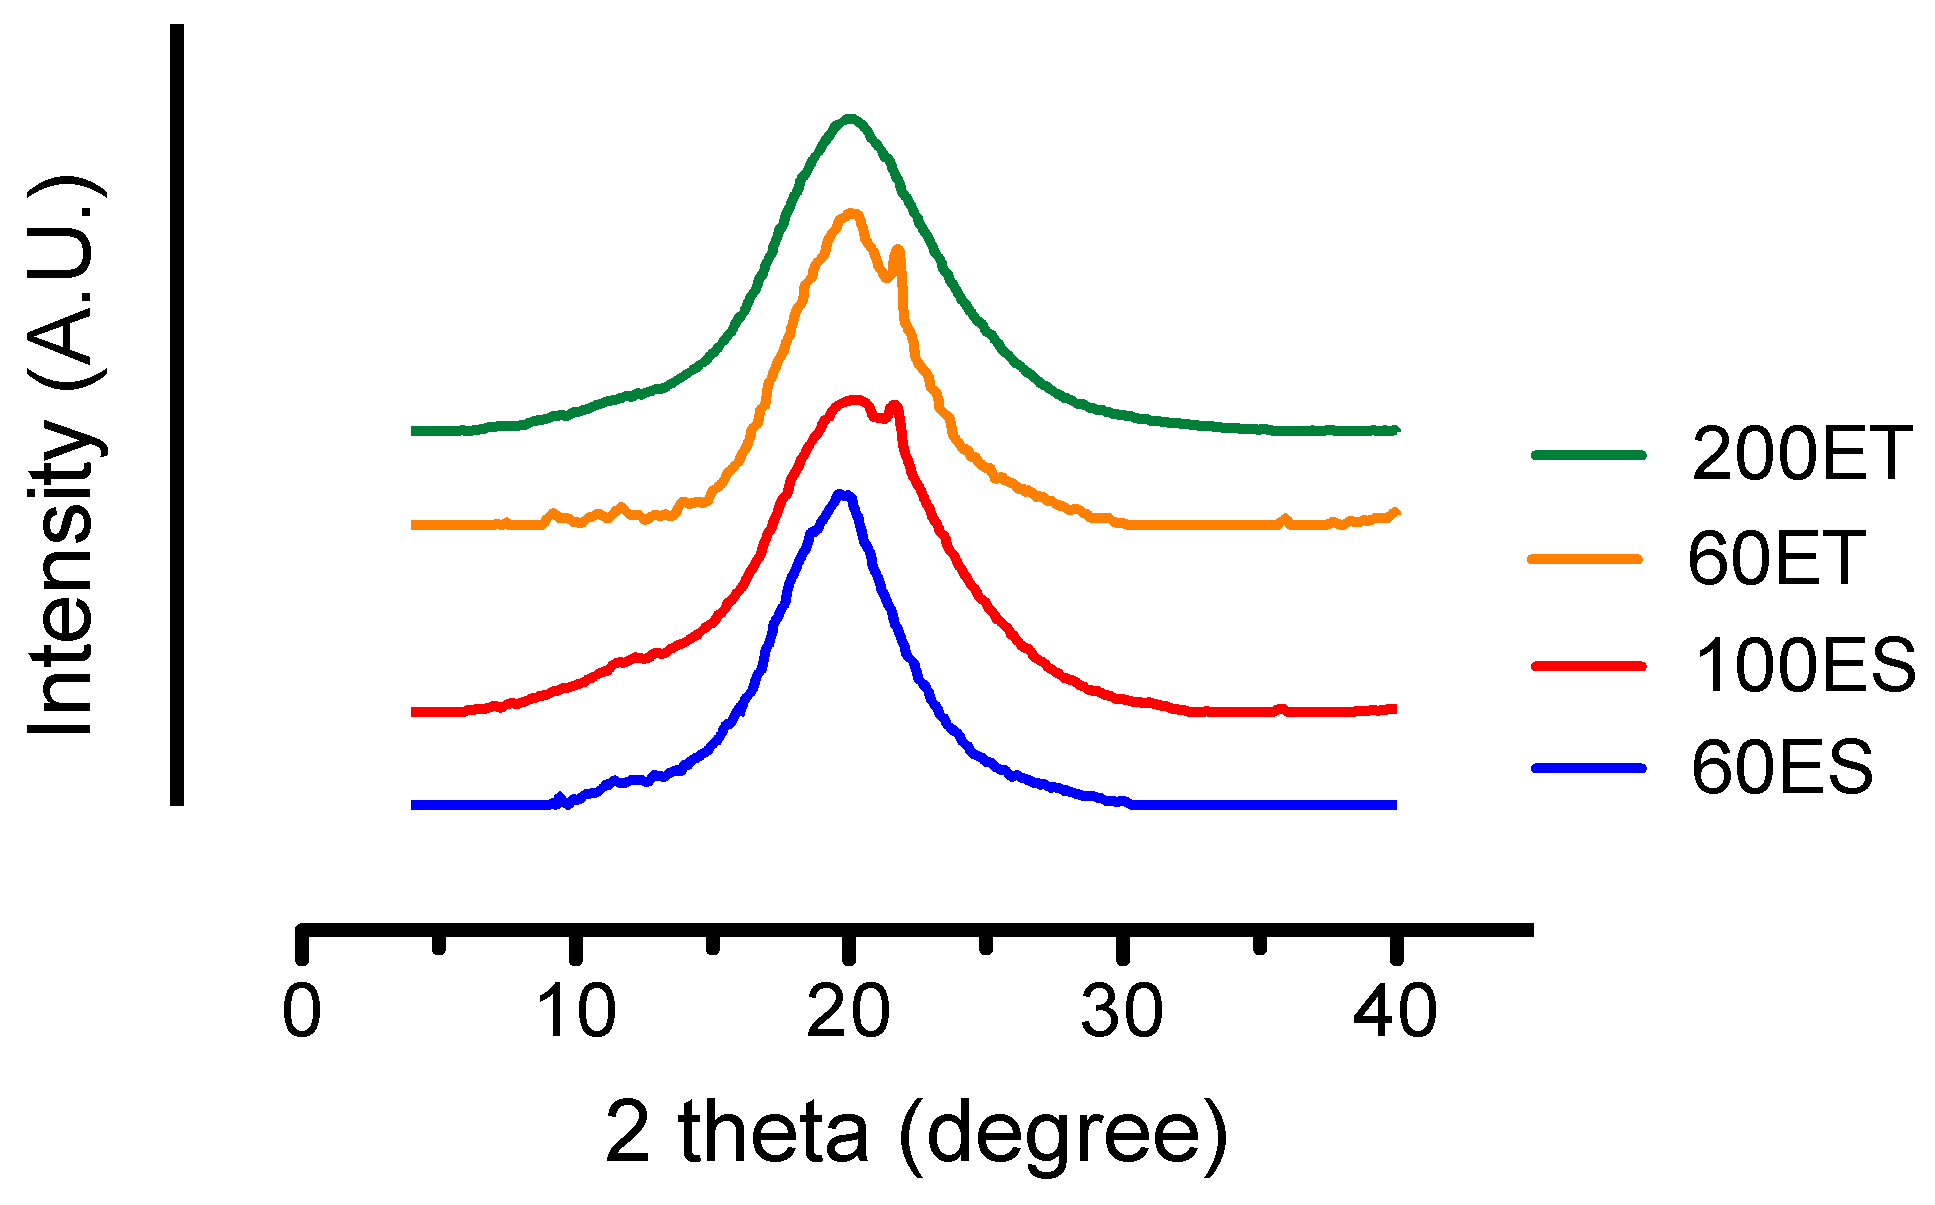
3.5. XRD
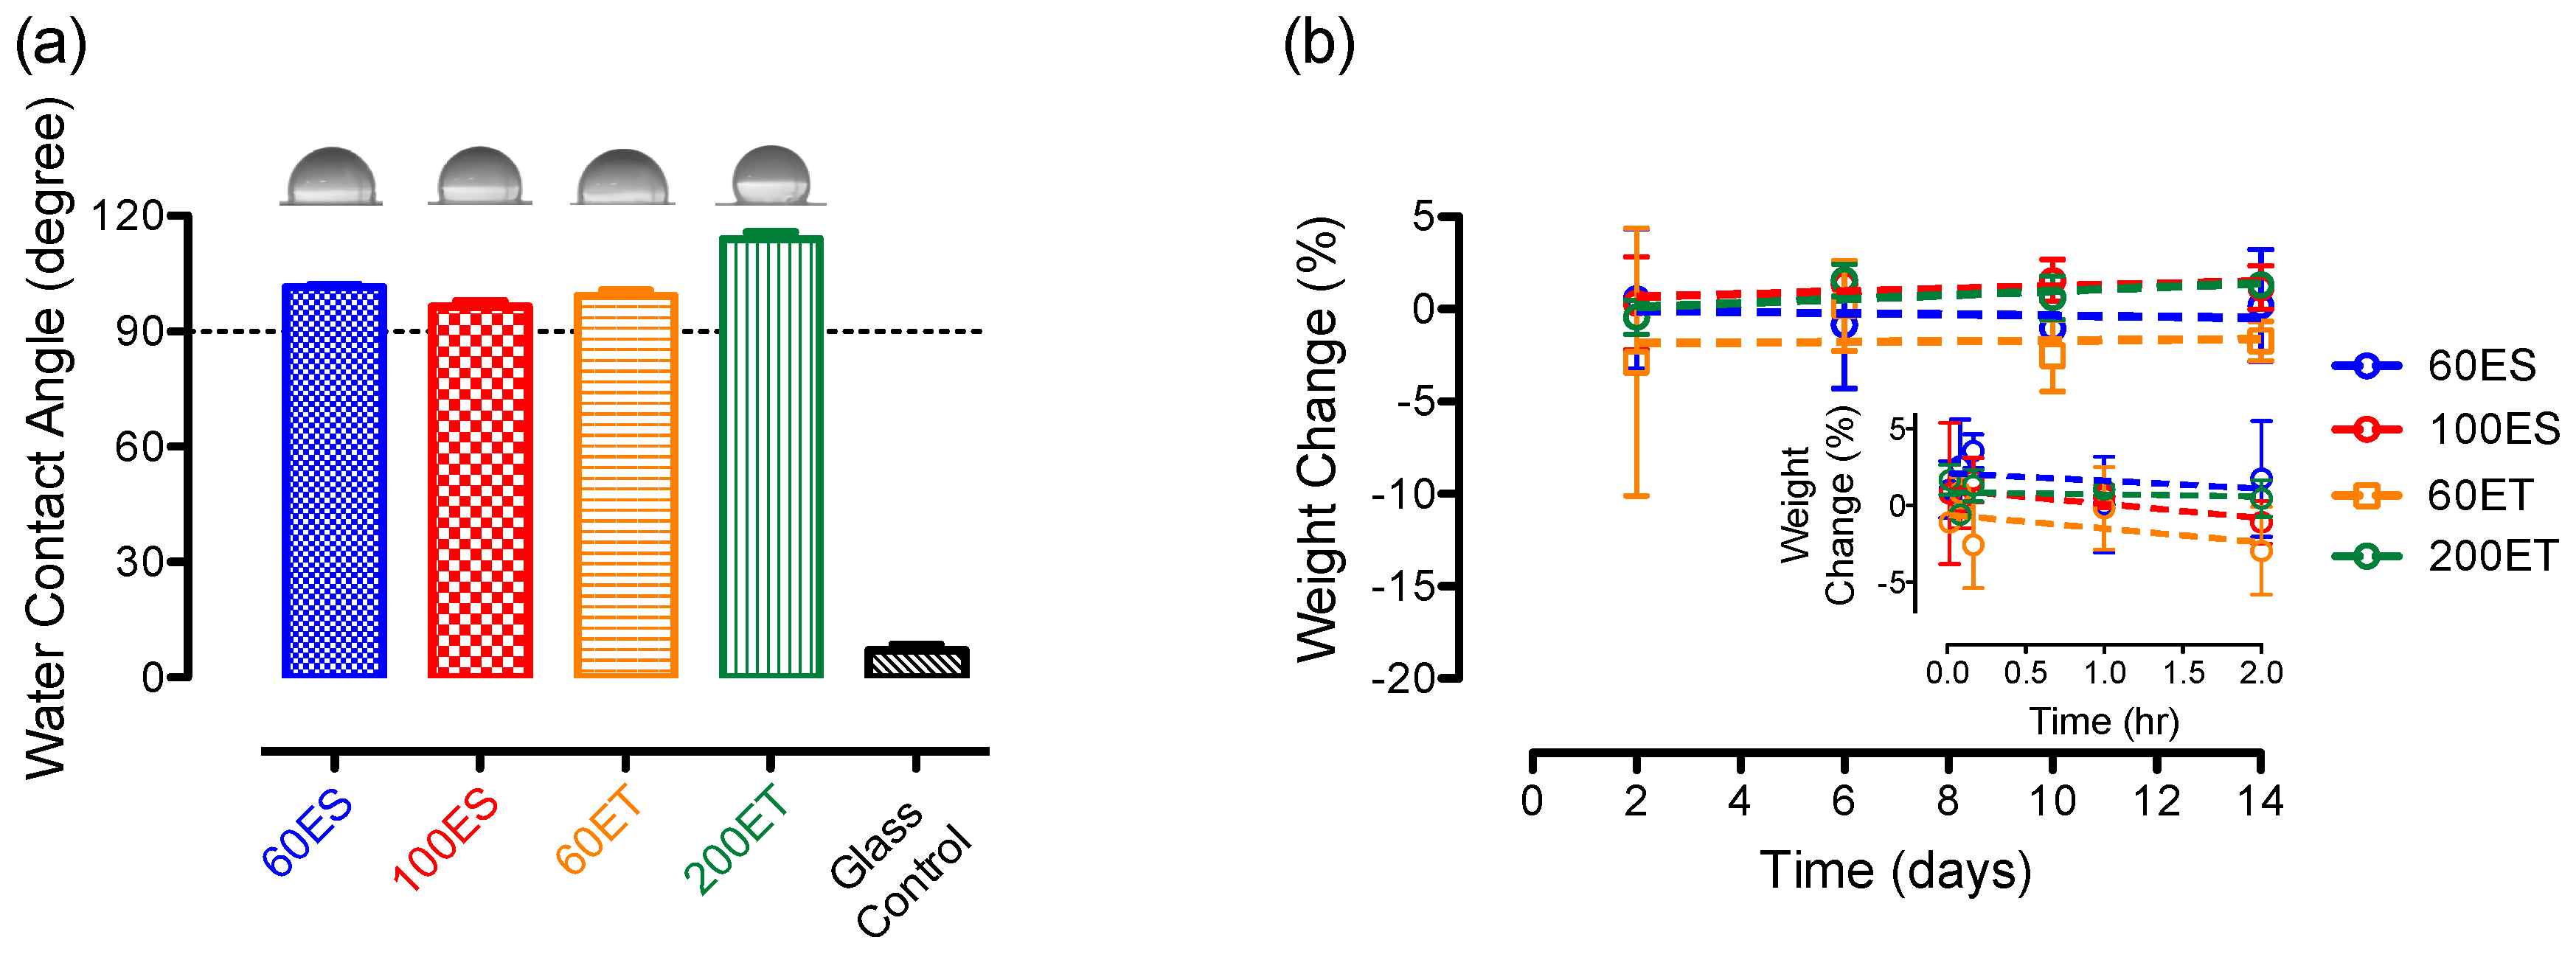
3.6. Water Content and Water Absorption
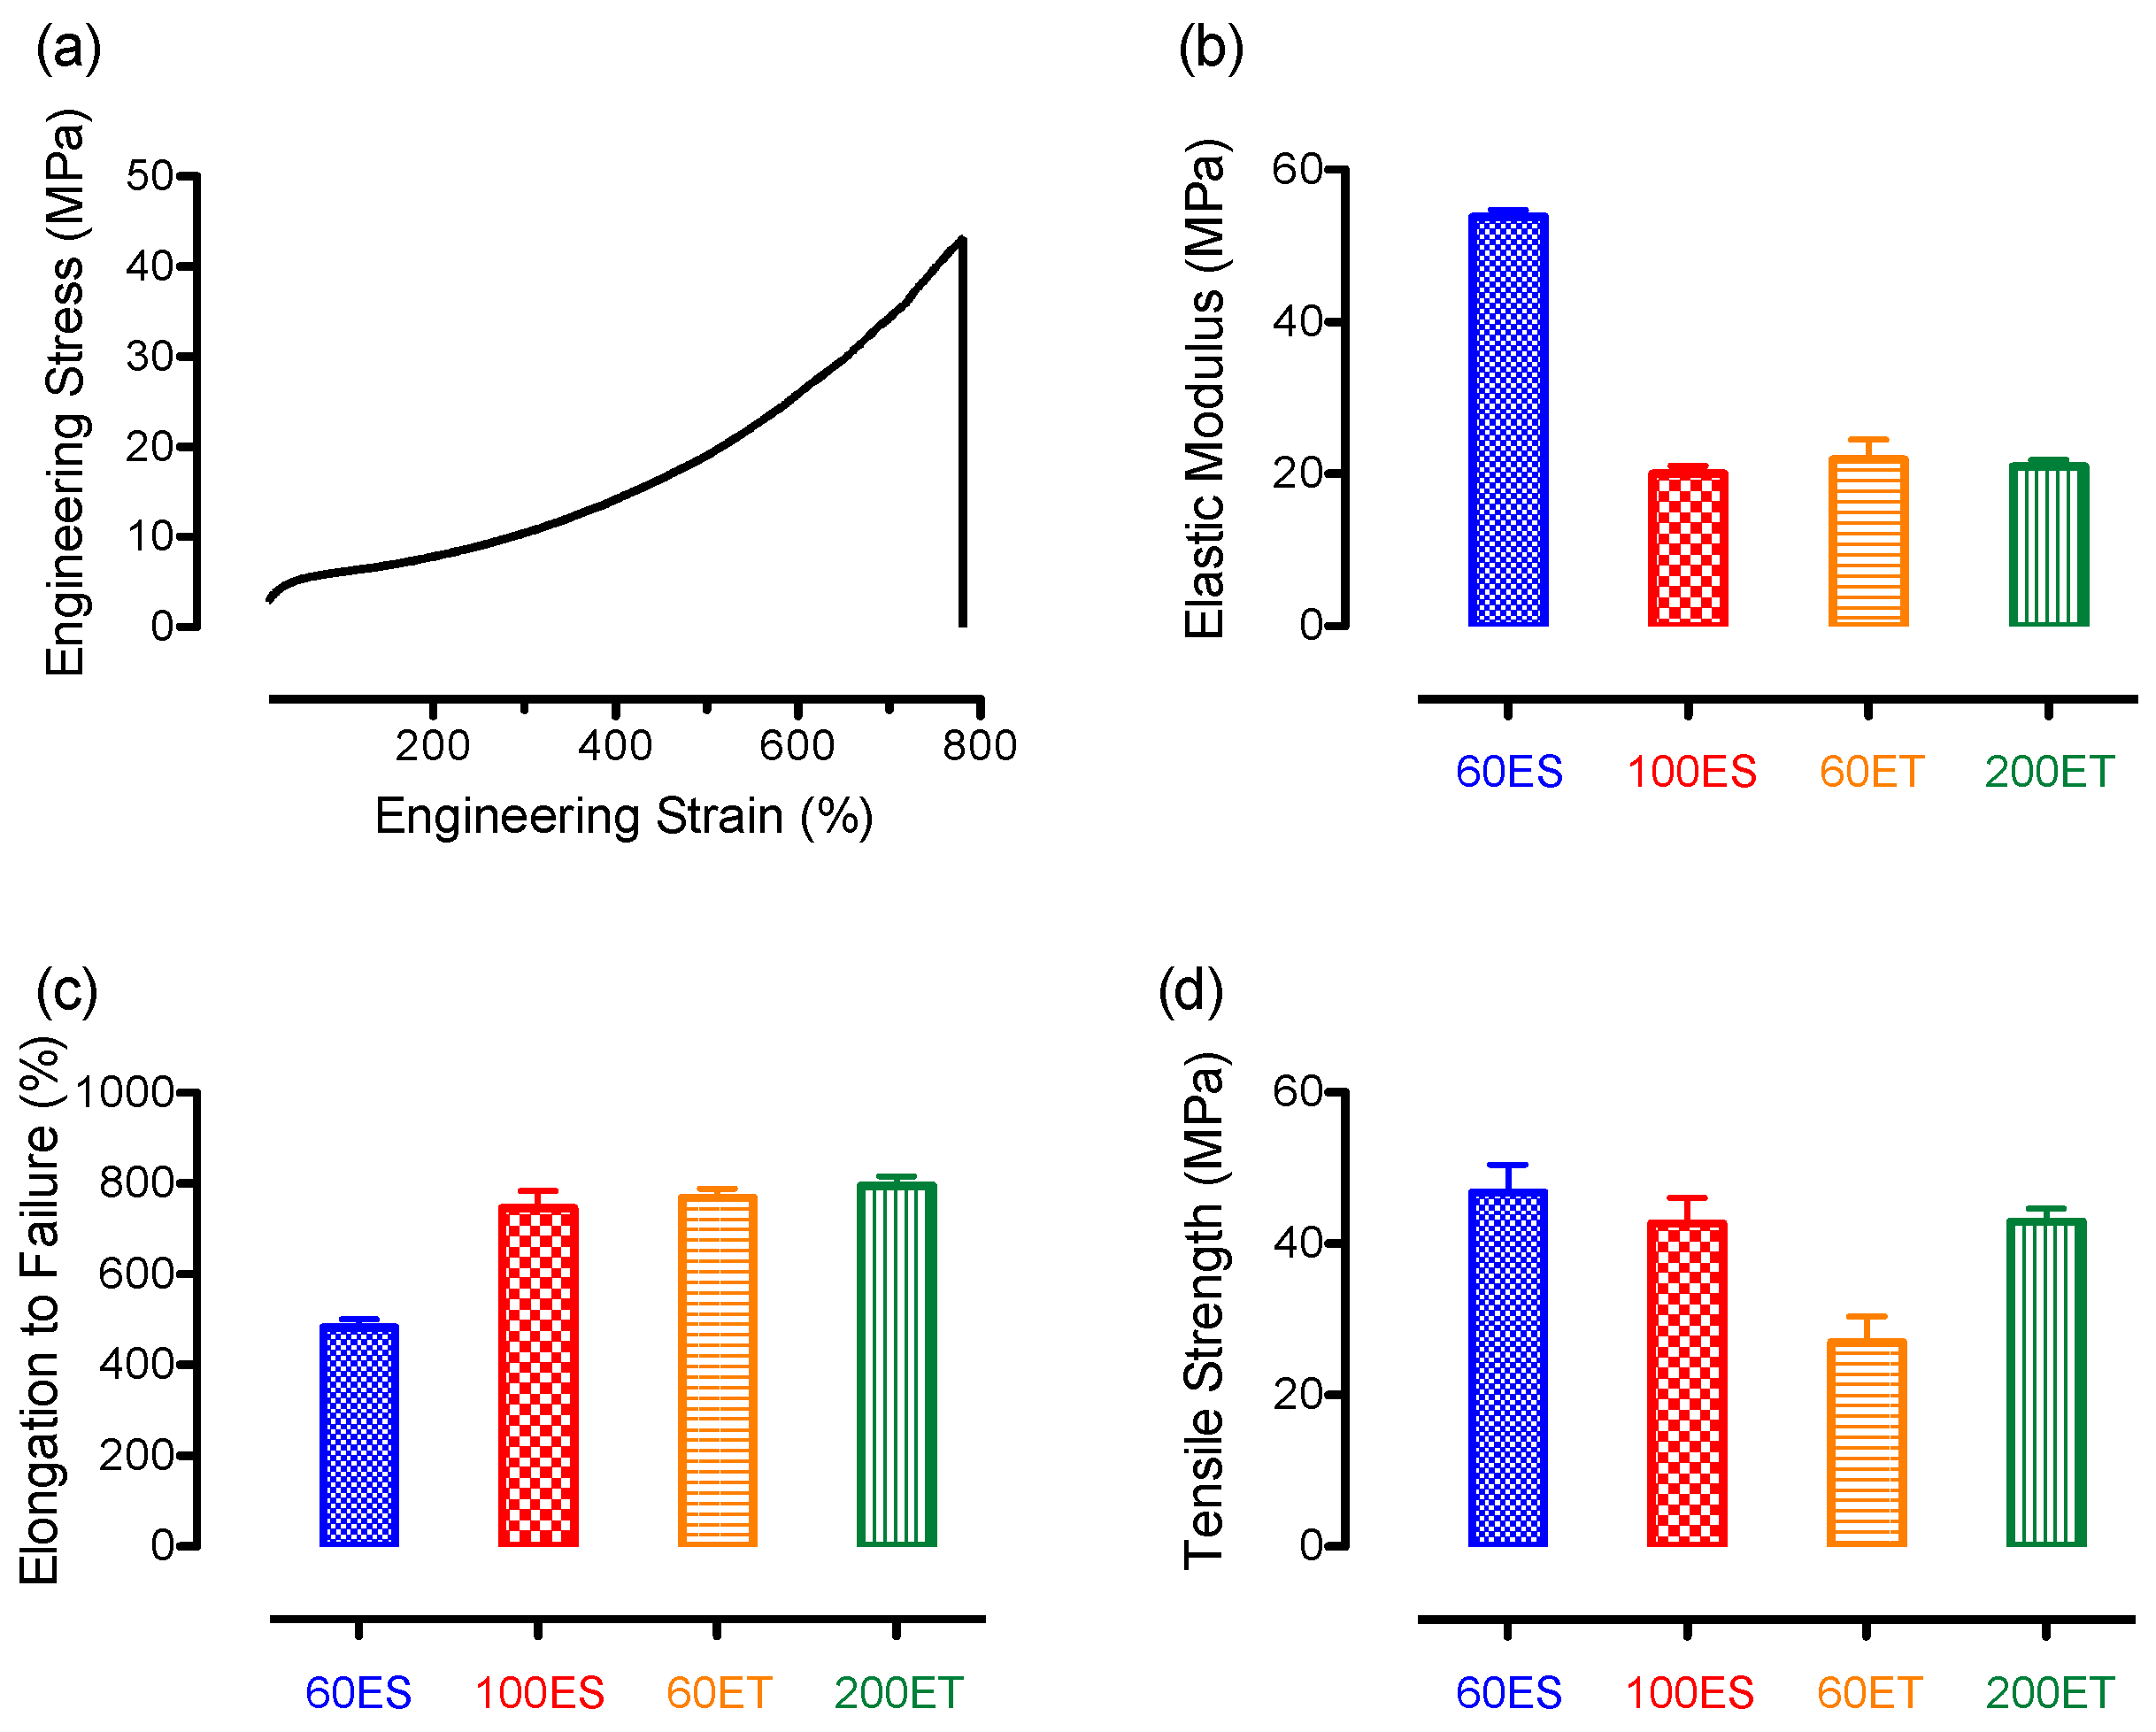
3.7. Mechanical Properties
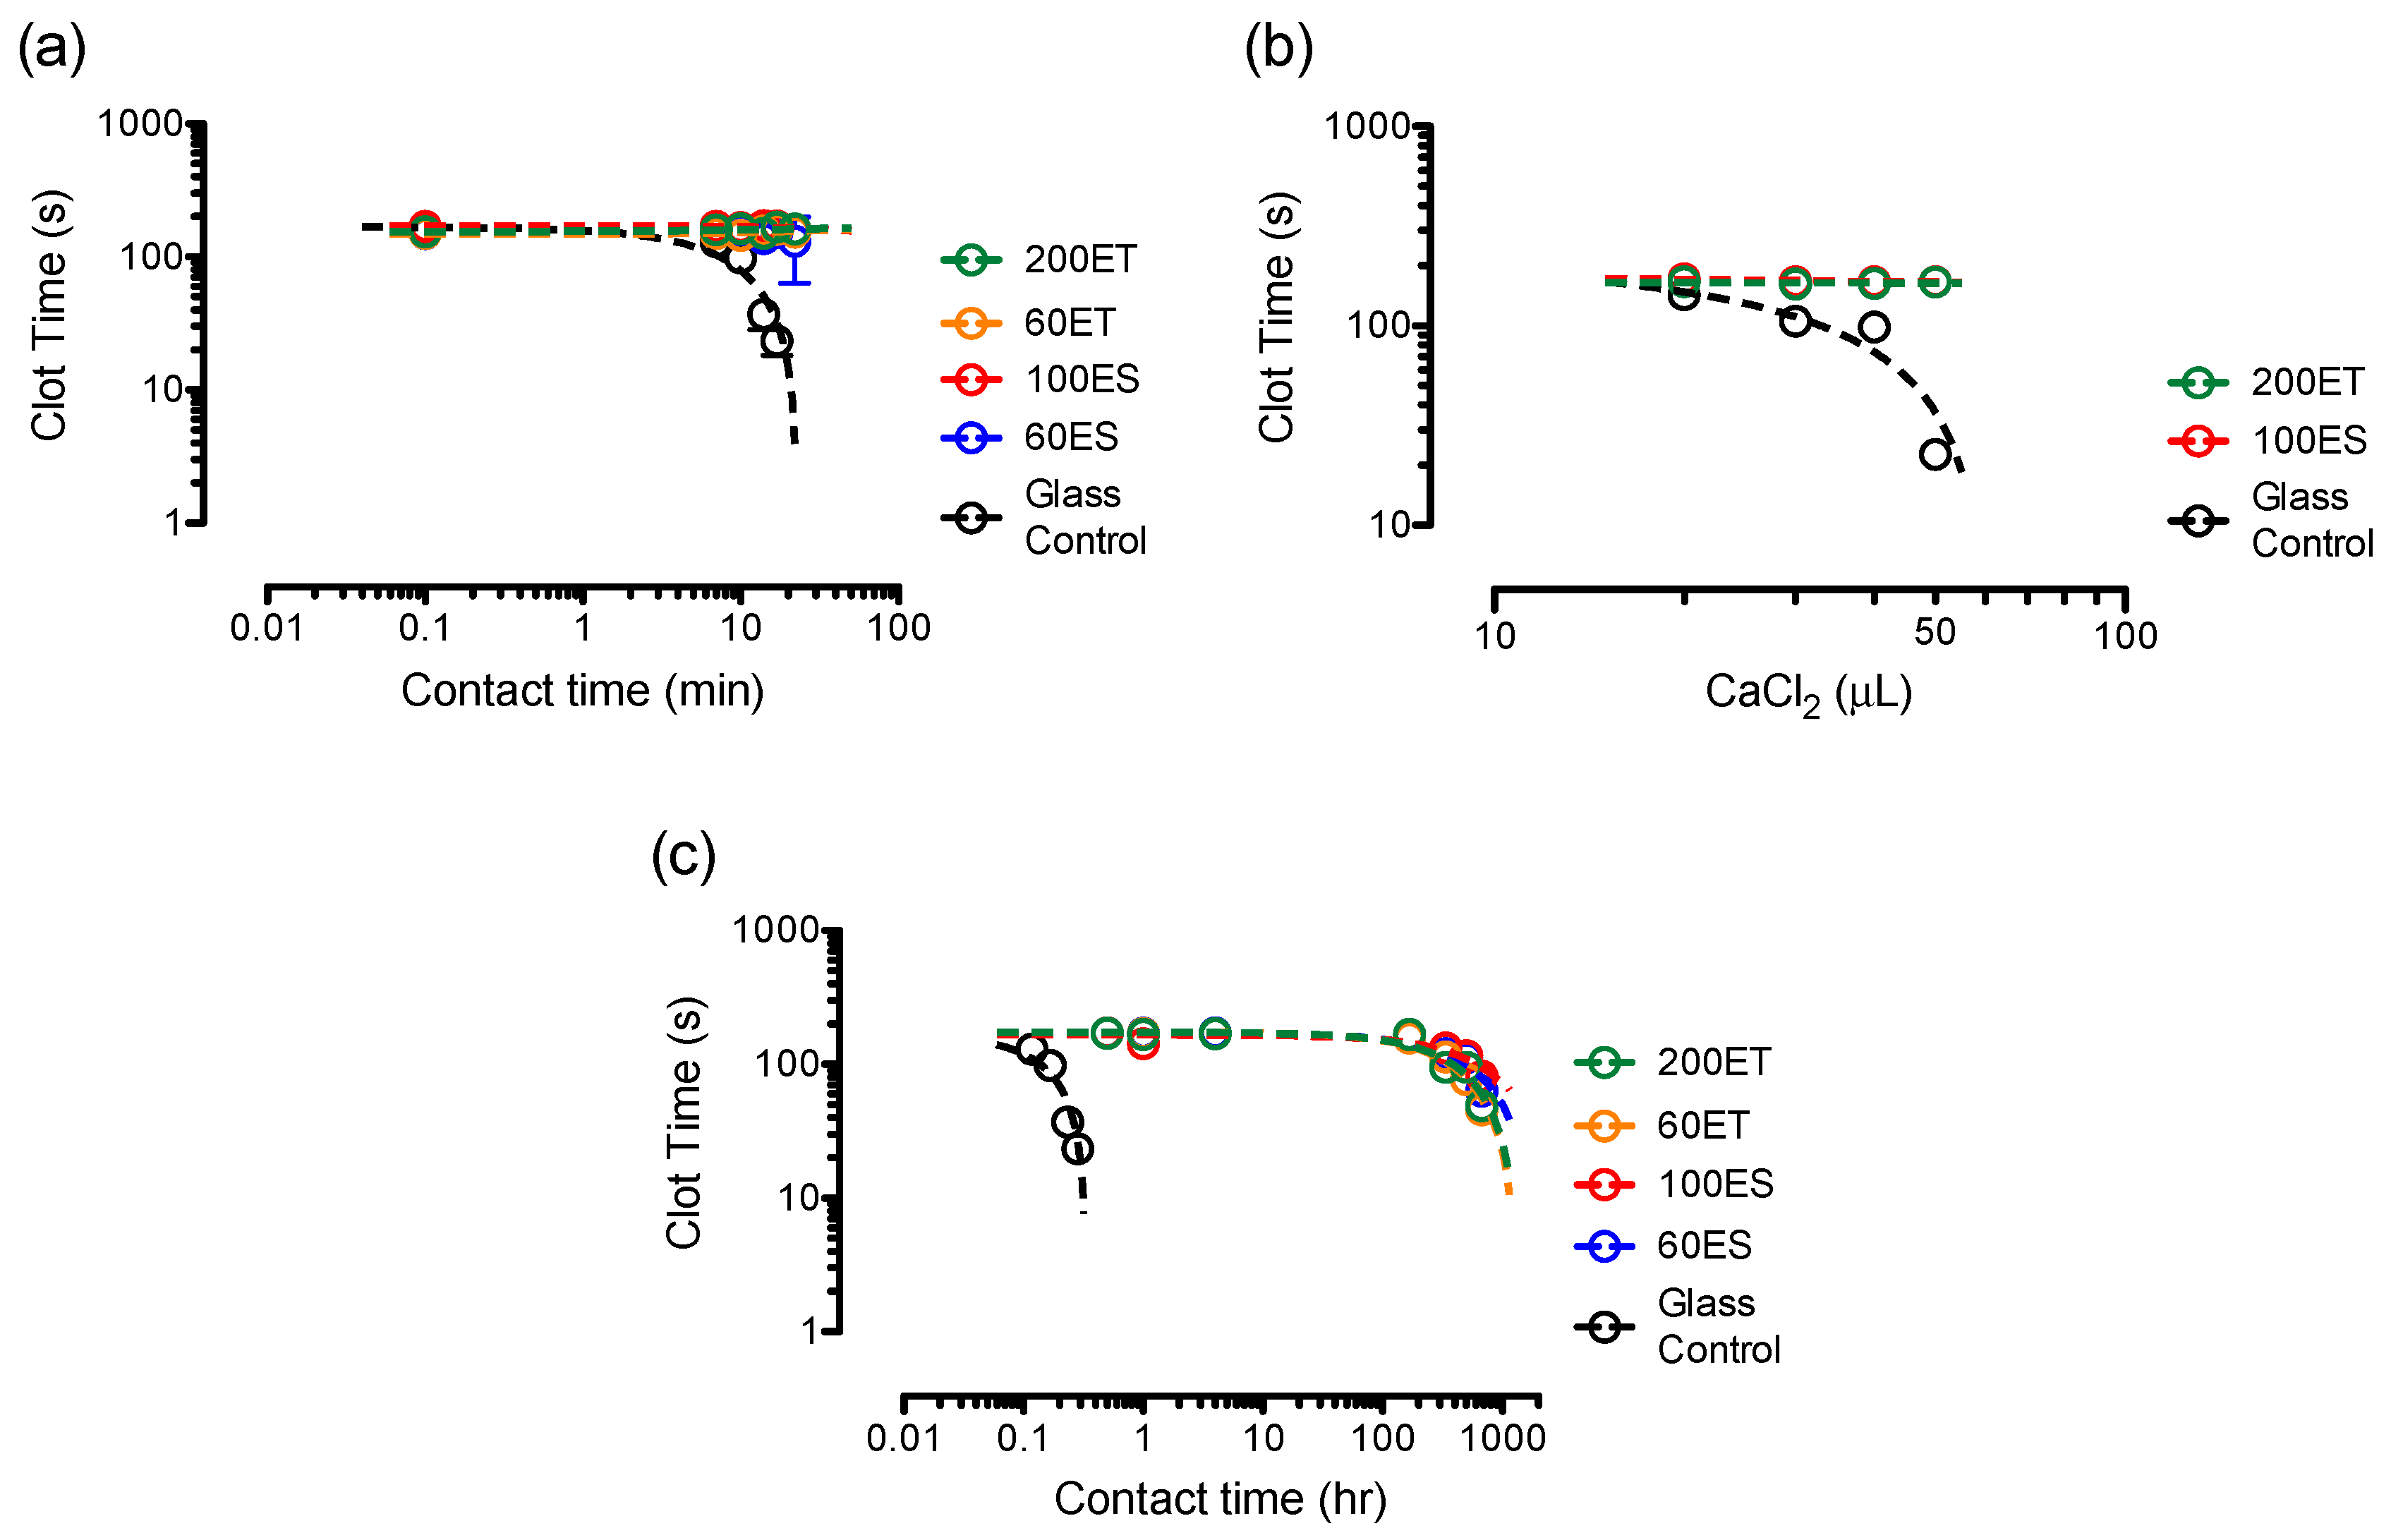
3.8. Clotting Assays
4. Conclusions
Supplementary Materials
Author Contributions
Funding
Acknowledgments
Conflicts of Interest
References
- Chou, S.-F.; Gunaseelan, S.; Kiellani, M.H.H.; Thottempudi, V.V.K.; Neuenschwander, P.; Nie, H. A review of injectable and implantable biomaterials for treatment and repair of soft tissues in wound healing. J. Nanotechnol. 2017, 2017, 1–15. [Google Scholar] [CrossRef]
- Small, M.; Faglie, A.; Craig, A.; Pieper, M.; Fernand Narcisse, V.; Neuenschwander, P.; Chou, S.-F. Nanostructure-enabled and macromolecule-grafted surfaces for biomedical applications. Micromachines 2018, 9, 243. [Google Scholar] [CrossRef] [PubMed]
- Neuenschwander, P.F.; Jesty, J. Blood Coagulation. In Encyclopedia of Life Sciences; John Wiley & Sons, Ltd.: Chichester, UK, 2011. [Google Scholar]
- Gbyli, R.; Mercaldi, A.; Sundaram, H.; Amoako, K.A. Achieving totally local anticoagulation on blood contacting devices. Adv. Mater. Interfaces 2018, 5, 1700954. [Google Scholar] [CrossRef]
- Neuenschwander, P.F.; Williamson, S.R.; Nalian, A.; Baker-Deadmond, K.J. Heparin modulates the 99-loop of factor IXa: Effects on reactivity with isolated Kunitz-type inhibitor domains. J. Biol. Chem. 2006, 281, 23066–23074. [Google Scholar] [CrossRef] [PubMed]
- Smith, S.A.; Travers, R.J.; Morrissey, J.H. How it all starts: Initiation of the clotting cascade. Crit. Rev. Biochem. Mol. Biol. 2015, 50, 326–336. [Google Scholar] [CrossRef] [PubMed] [Green Version]
- Hsu, S.; Kao, Y.-C. Biocompatibility of poly(carbonate urethane)s with various degrees of nanophase separation. Macromol. Biosci. 2005, 5, 246–253. [Google Scholar] [CrossRef] [PubMed]
- Miao, S.; Sun, L.; Wang, P.; Liu, R.; Su, Z.; Zhang, S. Soybean oil-based polyurethane networks as candidate biomaterials: Synthesis and biocompatibility. Eur. J. Lipid Sci. Technol. 2012, 114, 1165–1174. [Google Scholar] [CrossRef]
- Mathur, A.B.; Collier, T.O.; Kao, W.J.; Wiggins, M.; Schubert, M.A.; Hiltner, A.; Anderson, J.M. In vivo biocompatibility and biostability of modified polyurethanes. J. Biomed. Mater. Res. 1997, 36, 246–257. [Google Scholar] [CrossRef]
- Barrioni, B.R.; de Carvalho, S.M.; Oréfice, R.L.; de Oliveira, A.A.R.; de Magalhães Pereira, M. Synthesis and characterization of biodegradable polyurethane films based on HDI with hydrolyzable crosslinked bonds and a homogeneous structure for biomedical applications. Mater. Sci. Eng. C 2015, 52, 22–30. [Google Scholar] [CrossRef]
- Oprea, S. Dependence of fungal biodegradation of PEG/castor oil-based polyurethane elastomers on the hard-segment structure. Polym. Degrad. Stab. 2010, 95, 2396–2404. [Google Scholar] [CrossRef]
- Sarkar, D.; Yang, J.-C.; Lopina, S.T. Structure-property relationship of l-tyrosine-based polyurethanes for biomaterial applications. J. Appl. Polym. Sci. 2008, 108, 2345–2355. [Google Scholar] [CrossRef]
- Marzec, M.; Kucińska-Lipka, J.; Kalaszczyńska, I.; Janik, H. Development of polyurethanes for bone repair. Mater. Sci. Eng. C 2017, 80, 736–747. [Google Scholar] [CrossRef] [PubMed]
- Landel, R.F. Mechanical properties of a polyurethane elastomer in the rubber-to-glass transition zone. J. Colloid Sci. 1957, 12, 308–320. [Google Scholar] [CrossRef]
- Chung, J.H.Y.; Knetsch, M.L.W.; Koole, L.H.; Simmons, A.; Poole-Warren, L.A. Polyurethane organosilicate nanocomposites as blood compatible coatings. Coatings 2012, 2, 45–63. [Google Scholar] [CrossRef]
- Iskakov, R.; Batyrbekov, E.O.; Leonova, M.B.; Zhubanov, B.A. Preparation and release profiles of cyclophosphamide from segmented polyurethanes. J. Appl. Polym. Sci. 2000, 75, 35–43. [Google Scholar] [CrossRef]
- Chi, C.; Sun, B.; Zhou, N.; Zhang, M.; Chu, X.; Yuan, P.; shen, J. Anticoagulant polyurethane substrates modified with poly(2-methacryloyloxyethyl phosphorylcholine) via SI-RATRP. Colloids Surf. B Biointerfaces 2018, 163, 301–308. [Google Scholar] [CrossRef] [PubMed]
- Janik, H.; Marzec, M. A review: Fabrication of porous polyurethane scaffolds. Mater. Sci. Eng. C 2015, 48, 586–591. [Google Scholar] [CrossRef]
- Sun, C.-C.; Chou, S.-F.; Lai, J.-Y.; Cho, C.-H.; Lee, C.-H. Dependence of corneal keratocyte adhesion, spreading, and integrin β1 expression on deacetylated chitosan coating. Mater. Sci. Eng. C 2016, 63, 222–230. [Google Scholar] [CrossRef]
- ASTM Standard D882-18, Test Method for Tensile Properties of Thin Plastic Sheeting; ASTM International: West Conshohocken, PA, USA, 2018.
- ASTM Standard D1708-96, Test Method for Tensile Properties of Plastics by Use of Microtensile Specimens; ASTM International: West Conshohocken, PA, USA, 2002.
- Shah, B.; Kakumanu, V.K.; Bansal, A.K. Analytical techniques for quantification of amorphous/crystalline phases in pharmaceutical solids. J. Pharm. Sci. 2006, 95, 1641–1665. [Google Scholar] [CrossRef]
- Wilhelm, C.; Gardette, J.-L. Infrared analysis of the photochemical behaviour of segmented polyurethanes: Aliphatic poly(ether-urethane)s. Polymer 1998, 39, 5973–5980. [Google Scholar] [CrossRef]
- Wilhelm, C.; Gardette, J.-L. Infrared analysis of the photochemical behaviour of segmented polyurethanes: 1. Aliphatic poly(ester-urethane). Polymer 1997, 38, 4019–4031. [Google Scholar] [CrossRef]
- Tang, Q.; Gao, K. Structure analysis of polyether-based thermoplastic polyurethane elastomers by FTIR, 1H NMR and 13C NMR. Int. J. Polym. Anal. Charact. 2017, 22, 569–574. [Google Scholar] [CrossRef]
- Srivastava, A.; Arya, P.; Goel, S.; Kundu, B.; Mishra, P.; Fnu, A. Gelsolin amyloidogenesis is effectively modulated by curcumin and emetine conjugated PLGA nanoparticles. PLoS ONE 2015, 10, e0127011. [Google Scholar] [CrossRef]
- Trifan, D.S.; Terenzi, J.F. Extents of hydrogen bonding in polyamides and polyurethanes. J. Polym. Sci. 1958, 28, 443–445. [Google Scholar] [CrossRef]
- Knutson, K.; Lyman, D.J. The effect of polyether segment molecular weight on the bulk and surface morphologies of copolyether-urethane-ureas. In Biomaterials: Interfacial Phenomena and Applications; Cooper, S.L., Peppas, N.A., Hoffman, A.S., Ratner, B.D., Eds.; American Chemical Society: Washington, DC, USA, 1982; Volume 199, pp. 109–132. [Google Scholar]
- Rehman, I.; Barnardo, C.; Smith, R. Fourier transform infrared analysis of poly(ester-urethanes) at low temperature in-situ by using a newly constructed liquid nitrogen cooled sample stage. J. Mater. Sci. 1997, 32, 2617–2621. [Google Scholar] [CrossRef]
- Król, P.; Król, B. Surface free energy of polyurethane coatings with improved hydrophobicity. Colloid Polym. Sci. 2012, 290, 879–893. [Google Scholar] [CrossRef] [Green Version]
- Coates, J. Interpretation of infrared spectra, a practical approach. In Encyclopedia of Analytical Chemistry; Meyers, R.A., Ed.; John Wiley & Sons, Ltd.: Chichester, UK, 2006. [Google Scholar]
- Rosu, D.; Rosu, L.; Cascaval, C.N. IR-change and yellowing of polyurethane as a result of UV irradiation. Polym. Degrad. Stab. 2009, 94, 591–596. [Google Scholar] [CrossRef]
- Mishra, A.; Maiti, P. Aromatic polyurethanes: The effect of hard segment and chain structure on their properties. J. Polym. Eng. 2011, 31, 253–259. [Google Scholar] [CrossRef]
- Martin, D.J.; Meijs, G.F.; Renwick, G.M.; McCarthy, S.J.; Gunatillake, P.A. The effect of average soft segment length on morphology and properties of a series of polyurethane elastomers. I. Characterization of the series. J. Appl. Polym. Sci. 1996, 62, 1377–1386. [Google Scholar] [CrossRef]
- Chen, K.-S.; Leon Yu, T.; Chen, Y.-S.; Lin, T.-L.; Liu, W.-J. Soft- and hard-segment phase segregation of polyester-based polyurethane. J. Polym. Res. 2001, 8, 99–109. [Google Scholar] [CrossRef]
- Hesketh, T.R.; Van Bogart, J.W.C.; Cooper, S.L. Differential scanning calorimetry analysis of morphological changes in segmented elastomers. Polym. Eng. Sci. 1980, 20, 190–197. [Google Scholar] [CrossRef]
- Koberstein, J.T.; Russell, T.P. Simultaneous SAXS-DSC study of multiple endothermic behavior in polyether-based polyurethane block copolymers. Macromolecules 1986, 19, 714–720. [Google Scholar] [CrossRef]
- Lapprand, A.; Méchin, F.; Pascault, J.-P. Synthesis and properties of self-crosslinkable thermoplastic polyurethanes. J. Appl. Polym. Sci. 2007, 105, 99–113. [Google Scholar] [CrossRef]
- Petrović, Z.S.; Yang, L.; Zlatanić, A.; Zhang, W.; Javni, I. Network structure and properties of polyurethanes from soybean oil. J. Appl. Polym. Sci. 2007, 105, 2717–2727. [Google Scholar] [CrossRef]
- Fu, H.; Wang, Y.; Li, X.; Chen, W. Synthesis of vegetable oil-based waterborne polyurethane/silver-halloysite antibacterial nanocomposites. Compos. Sci. Technol. 2016, 126, 86–93. [Google Scholar] [CrossRef]
- Clayden, N.J.; Nijs, C.; Eeckhaut, G. Study of the polymer morphology in urethane elastomers by solid state 2H NMR and small angle X-ray scattering. Macromolecules 1998, 31, 7820–7828. [Google Scholar] [CrossRef]
- Androsch, R.; Blackwell, J.; Chvalun, S.N.; Festel, G.; Eisenbach, C.D. X-ray investigation of the structure of polyurethane elastomers based on 1,5-naphthalene diisocyanate. Acta Polym. 1997, 48, 363–368. [Google Scholar] [CrossRef]
- Zia, K.M.; Bhatti, I.A.; Barikani, M.; Zuber, M.; Sheikh, M.A. XRD studies of chitin-based polyurethane elastomers. Int. J. Biol. Macromol. 2008, 43, 136–141. [Google Scholar] [CrossRef]
- Chang, V.S.C.; Kennedy, J.P. Gas permeability, water absorption, hydrolytic stability and air-oven aging of polyisobutylene-based polyurethane networks. Polym. Bull. 1982, 8, 69–74. [Google Scholar] [CrossRef]
- Zia, K.M.; Barikani, M.; Zuber, M.; Bhatti, I.A.; Bhatti, H.N. Morphological studies of polyurethane elastomers extended with α, ω alkane diols. Iran. Polym. J. 2008, 17, 61–72. [Google Scholar]
- Gultekin, G.; Atalay-Oral, C.; Erkal, S.; Sahin, F.; Karastova, D.; Tantekin-Ersolmaz, S.B.; Guner, F.S. Fatty acid-based polyurethane films for wound dressing applications. J. Mater. Sci. Mater. Med. 2009, 20, 421–431. [Google Scholar] [CrossRef]
- Boubakri, A.; Elleuch, K.; Guermazi, N.; Ayedi, H.F. Investigations on hygrothermal aging of thermoplastic polyurethane material. Mater. Des. 2009, 30, 3958–3965. [Google Scholar] [CrossRef]
- Chen, Z.; Peng, I.-C.; Cui, X.; Li, Y.-S.; Chien, S.; Shyy, J.Y.-J. Shear stress, SIRT1, and vascular homeostasis. Proc. Natl. Acad. Sci. USA 2010, 107, 10268–10273. [Google Scholar] [CrossRef] [Green Version]
- Guo, D.; Chien, S.; Shyy, J.Y.-J. Regulation of endothelial cell cycle by laminar versus oscillatory flow: Distinct modes of interactions of AMP-activated protein kinase and Akt pathways. Circ. Res. 2007, 100, 564–571. [Google Scholar] [CrossRef]
- Davies, P.F. How do vascular endothelial cells respond to flow? Physiology 1989, 4, 22–25. [Google Scholar] [CrossRef]
- Qi, H.J.; Boyce, M.C. Stress–strain behavior of thermoplastic polyurethanes. Mech. Mater. 2005, 37, 817–839. [Google Scholar] [CrossRef]
- Chou, S.F.; Overfelt, R.A. Tensile deformation and failure of North American porcupine quills. Mater. Sci. Eng. C 2011, 31, 1729–1736. [Google Scholar] [CrossRef]
- Jutrzenka Trzebiatowska, P.; Santamaria Echart, A.; Calvo Correas, T.; Eceiza, A.; Datta, J. The changes of crosslink density of polyurethanes synthesised with using recycled component. Chemical structure and mechanical properties investigations. Prog. Org. Coat. 2018, 115, 41–48. [Google Scholar] [CrossRef]
- Yanagihara, Y.; Osaka, N.; Iimori, S.; Murayama, S.; Saito, H. Relationship between modulus and structure of annealed thermoplastic polyurethane. Mater. Today Commun. 2015, 2, e9–e15. [Google Scholar]
- Stribeck, A.; Pöselt, E.; Eling, B.; Jokari-Sheshdeh, F.; Hoell, A. Thermoplastic polyurethanes with varying hard-segment components. Mechanical performance and a filler-crosslink conversion of hard domains as monitored by SAXS. Eur. Polym. J. 2017, 94, 340–353. [Google Scholar] [CrossRef]
- Kojio, K.; Furukawa, M.; Nonaka, Y.; Nakamura, S. Control of mechanical properties of thermoplastic polyurethane elastomers by restriction of crystallization of soft segment. Materials 2010, 3, 5097–5110. [Google Scholar] [CrossRef]
- Park, H.D.; Bae, J.W.; Park, K.D.; Ooya, T.; Yui, N.; Jang, J.-H.; Han, D.K.; Shin, J.-W. Surface modification of polyurethane using sulfonated PEG crafted polyrotaxane for improved biocompatibility. Macromol. Res. 2006, 14, 73–80. [Google Scholar] [CrossRef]
- Luo, Y.; Zhang, C.; Xu, F.; Chen, Y.; Fan, L.; Wei, Q. Synthesis and characterization of novel THTPBA/PEG-derived polyurethane scaffolds for tissue engineering. J. Mater. Sci. 2010, 45, 1866–1877. [Google Scholar] [CrossRef]
- Li, L.; Cheng, C.; Xiang, T.; Tang, M.; Zhao, W.; Sun, S.; Zhao, C. Modification of polyethersulfone hemodialysis membrane by blending citric acid grafted polyurethane and its anticoagulant activity. J. Membr. Sci. 2012, 405–406, 261–274. [Google Scholar] [CrossRef]
- Palta, S.; Saroa, R.; Palta, A. Overview of the coagulation system. Indian J. Anaesth. 2014, 58, 515–523. [Google Scholar] [CrossRef]
- Lin, W.-C.; Yu, D.-G.; Yang, M.-C. Blood compatibility of thermoplastic polyurethane membrane immobilized with water-soluble chitosan/dextran sulfate. Colloids Surf. B Biointerfaces 2005, 44, 82–92. [Google Scholar] [CrossRef]
- Lv, Q.; Cao, C.; Zhu, H. A novel solvent system for blending of polyurethane and heparin. Biomaterials 2003, 24, 3915–3919. [Google Scholar] [CrossRef]
- Feng, Y.; Zhao, H.; Behl, M.; Lendlein, A.; Guo, J.; Yang, D. Grafting of poly(ethylene glycol) monoacrylates on polycarbonateurethane by UV initiated polymerization for improving hemocompatibility. J. Mater. Sci. Mater. Med. 2013, 24, 61–70. [Google Scholar] [CrossRef]


| Sample Abbreviation | Soft-Segment | Shore Hardness A | Thickness (μm) |
|---|---|---|---|
| 60ES | Ester-based | 92 | 60 |
| 100ES | Ester-based | 85 | 100 |
| 60ET | Ether-based | 92 | 60 |
| 200ET | Ether-based | 85 | 200 |
| First Step | Second Step | |||
|---|---|---|---|---|
| Temperature (°C) | Mass (%) | Temperature (°C) | Mass (%) | |
| 60ES | 406.1 ± 13.9 | 52.2 ± 4.5 | - | - |
| 100ES | 433.3 ± 2.7 | 33.2 ± 1.6 | - | - |
| 60ET | 385.6 ± 5.0 | 68.1 ± 1.4 | 437.8 ± 1.6 | 32.2 ± 1.6 |
| 200ET | 394.1 ± 1.1 | 69.0 ± 1.5 | 439.6 ± 1.7 | 34.3 ± 0.5 |
© 2019 by the authors. Licensee MDPI, Basel, Switzerland. This article is an open access article distributed under the terms and conditions of the Creative Commons Attribution (CC BY) license (http://creativecommons.org/licenses/by/4.0/).
Share and Cite
Wilson, A.C.; Chou, S.-F.; Lozano, R.; Chen, J.Y.; Neuenschwander, P.F. Thermal and Physico-Mechanical Characterizations of Thromboresistant Polyurethane Films. Bioengineering 2019, 6, 69. https://doi.org/10.3390/bioengineering6030069
Wilson AC, Chou S-F, Lozano R, Chen JY, Neuenschwander PF. Thermal and Physico-Mechanical Characterizations of Thromboresistant Polyurethane Films. Bioengineering. 2019; 6(3):69. https://doi.org/10.3390/bioengineering6030069
Chicago/Turabian StyleWilson, Aaron C., Shih-Feng Chou, Roberto Lozano, Jonathan Y. Chen, and Pierre F. Neuenschwander. 2019. "Thermal and Physico-Mechanical Characterizations of Thromboresistant Polyurethane Films" Bioengineering 6, no. 3: 69. https://doi.org/10.3390/bioengineering6030069