The Effect of Carbon Monoxide on the Exergy Behavior of the Lungs


Abstract
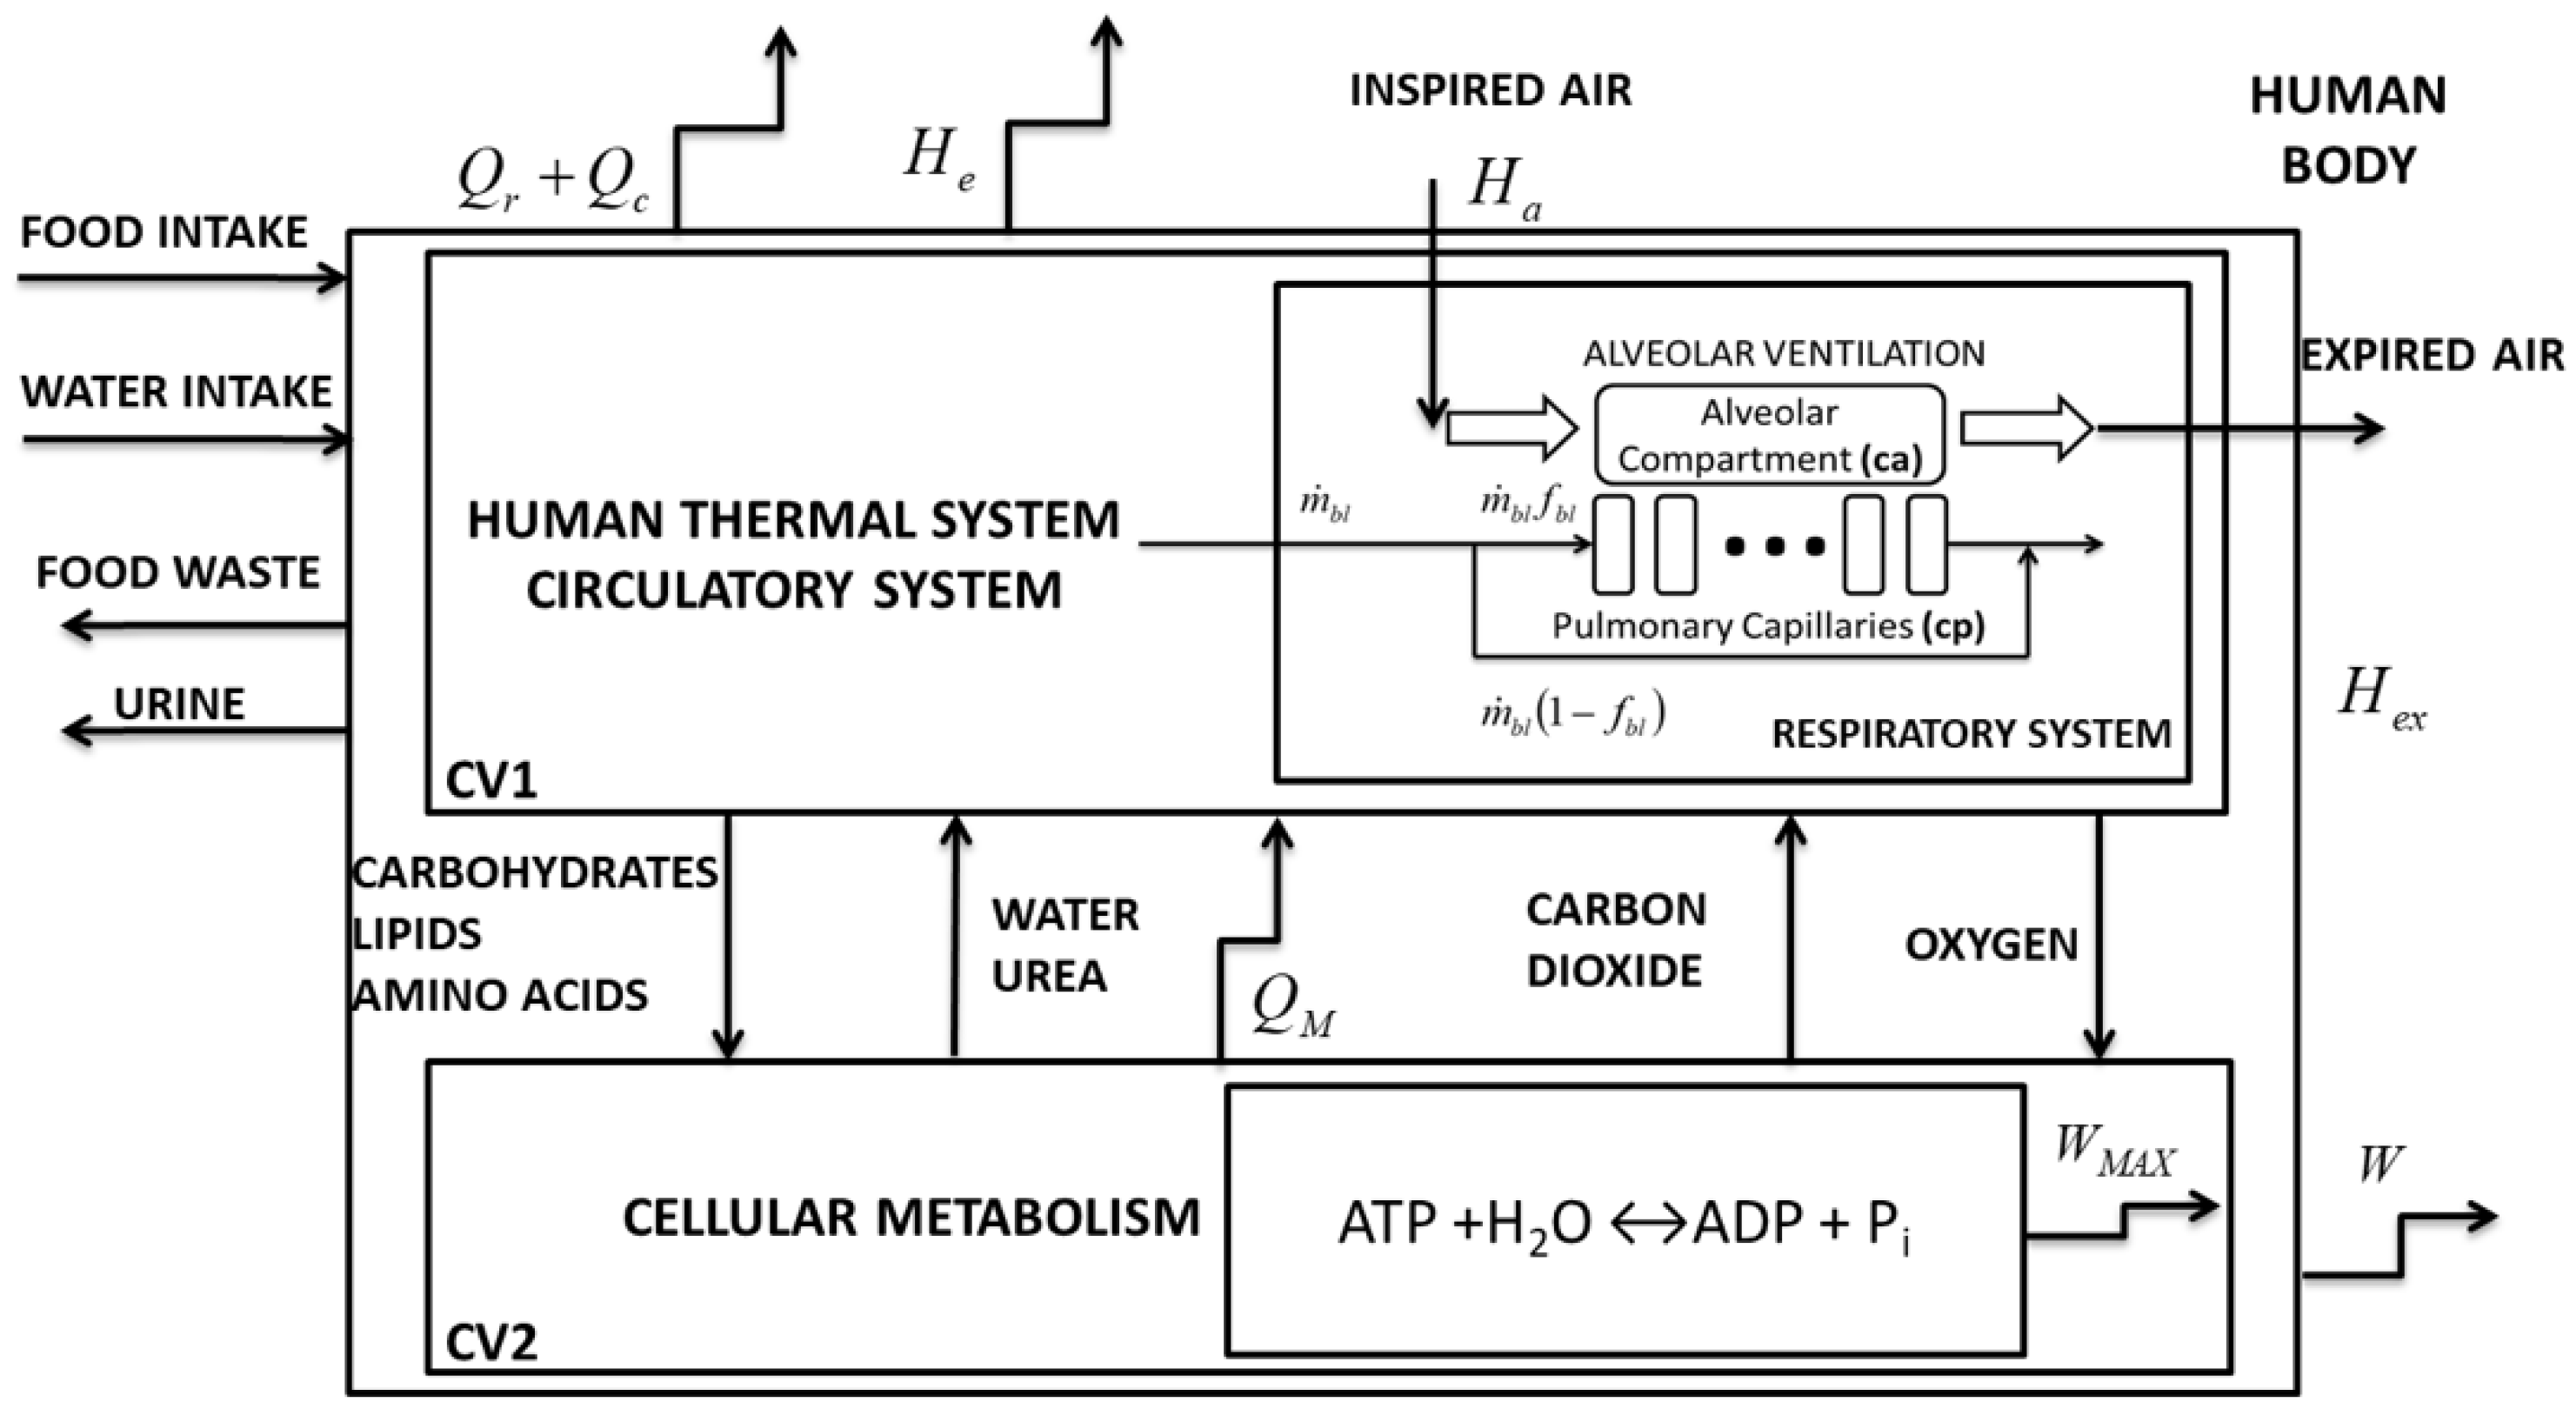
:1. Introduction
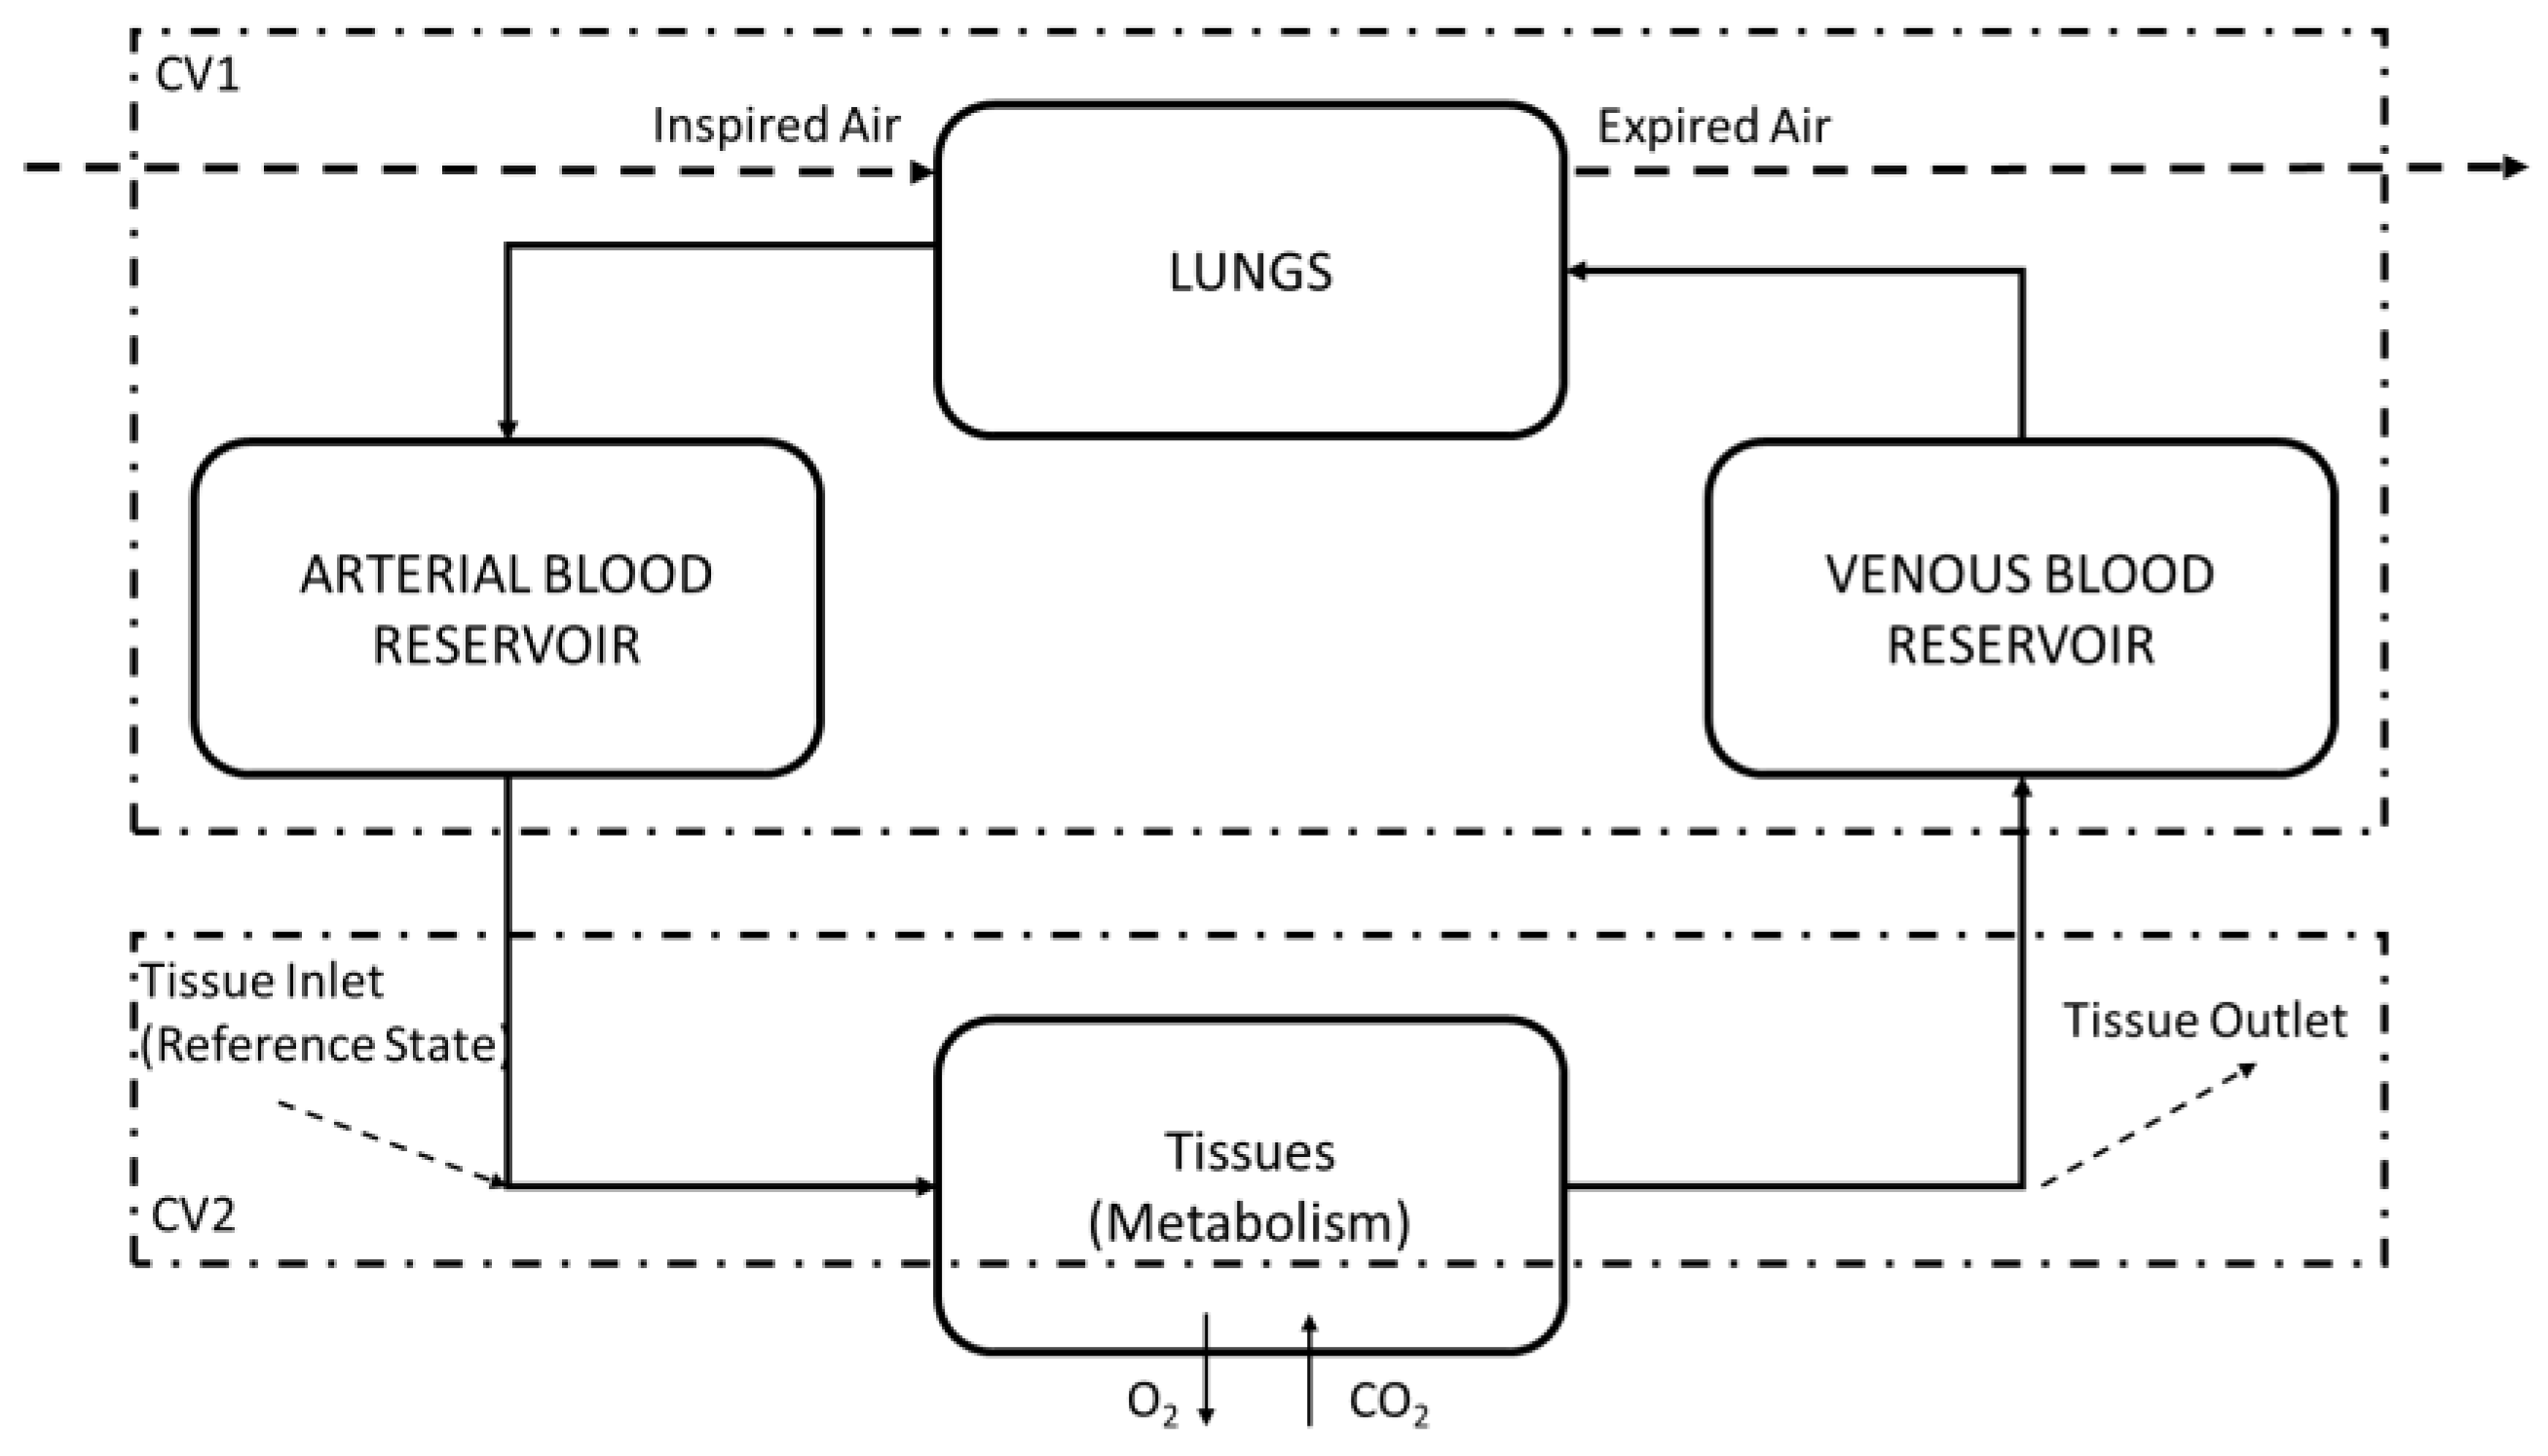
2. Materials and Methods
2.1. Methods to Apply the Exergy Analysis to Blood
2.1.1. Exergy of the Mixture of Blood and Ideal Gases
2.1.2. Exergy of the Mixture of Blood, Ideal Gases, and Reactions with Hemoglobin
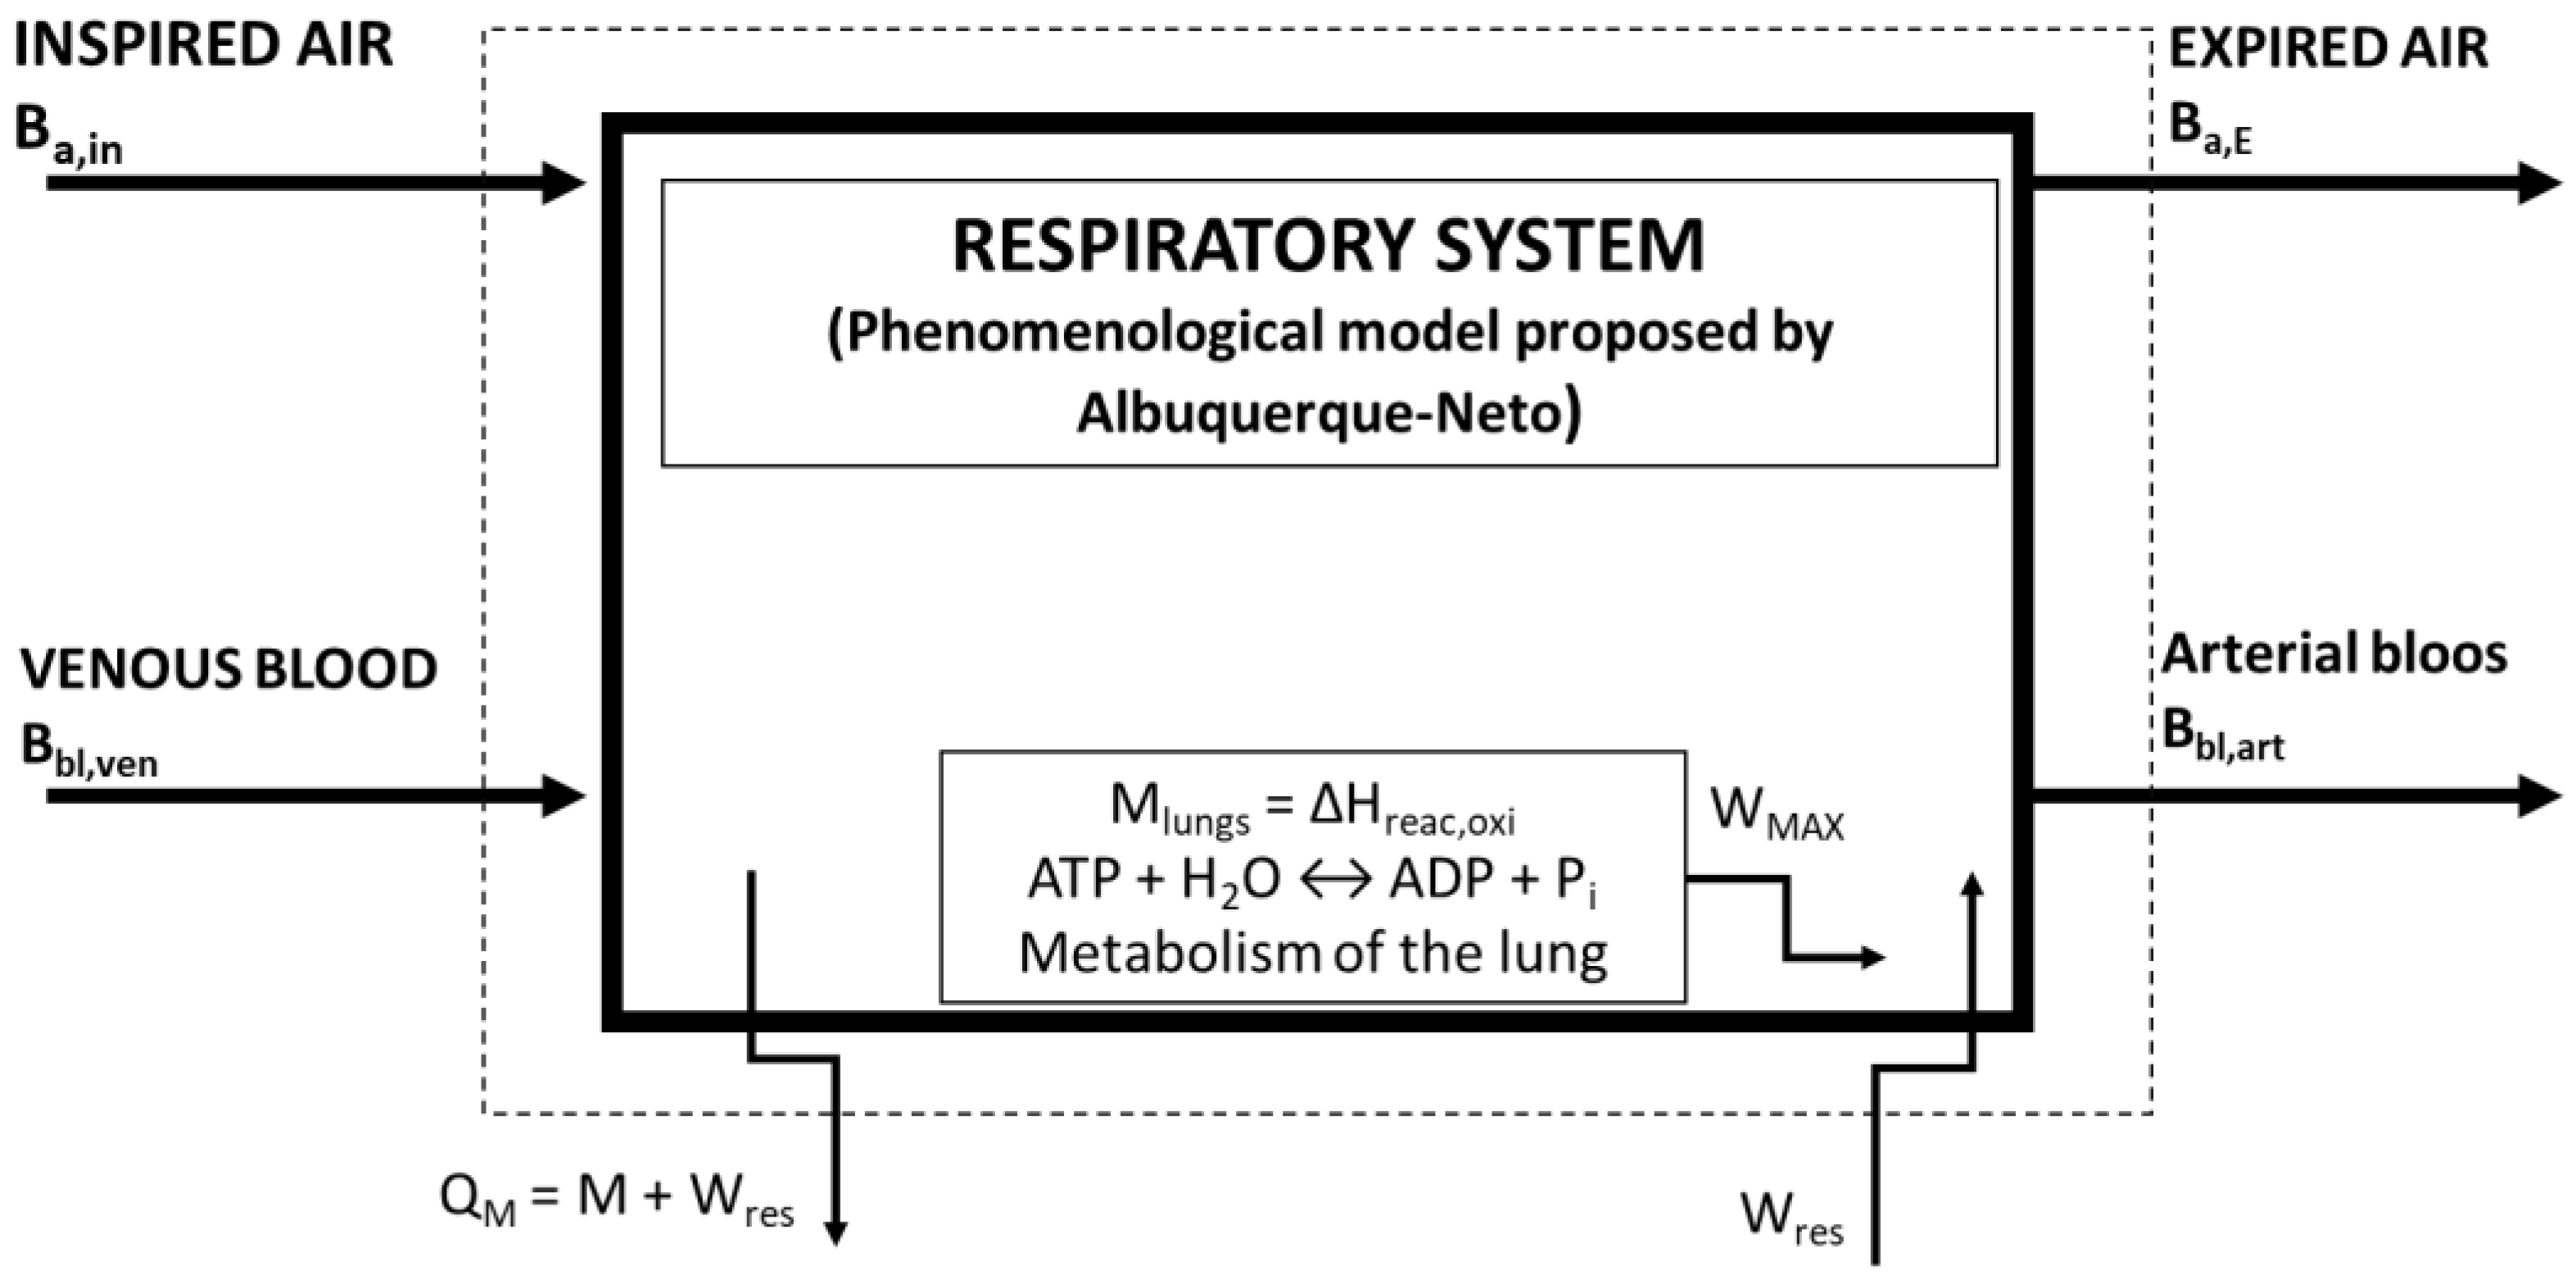
2.2. Second Law of Thermodynamics of the Lung
2.3. Simulations
3. Results and Discussion
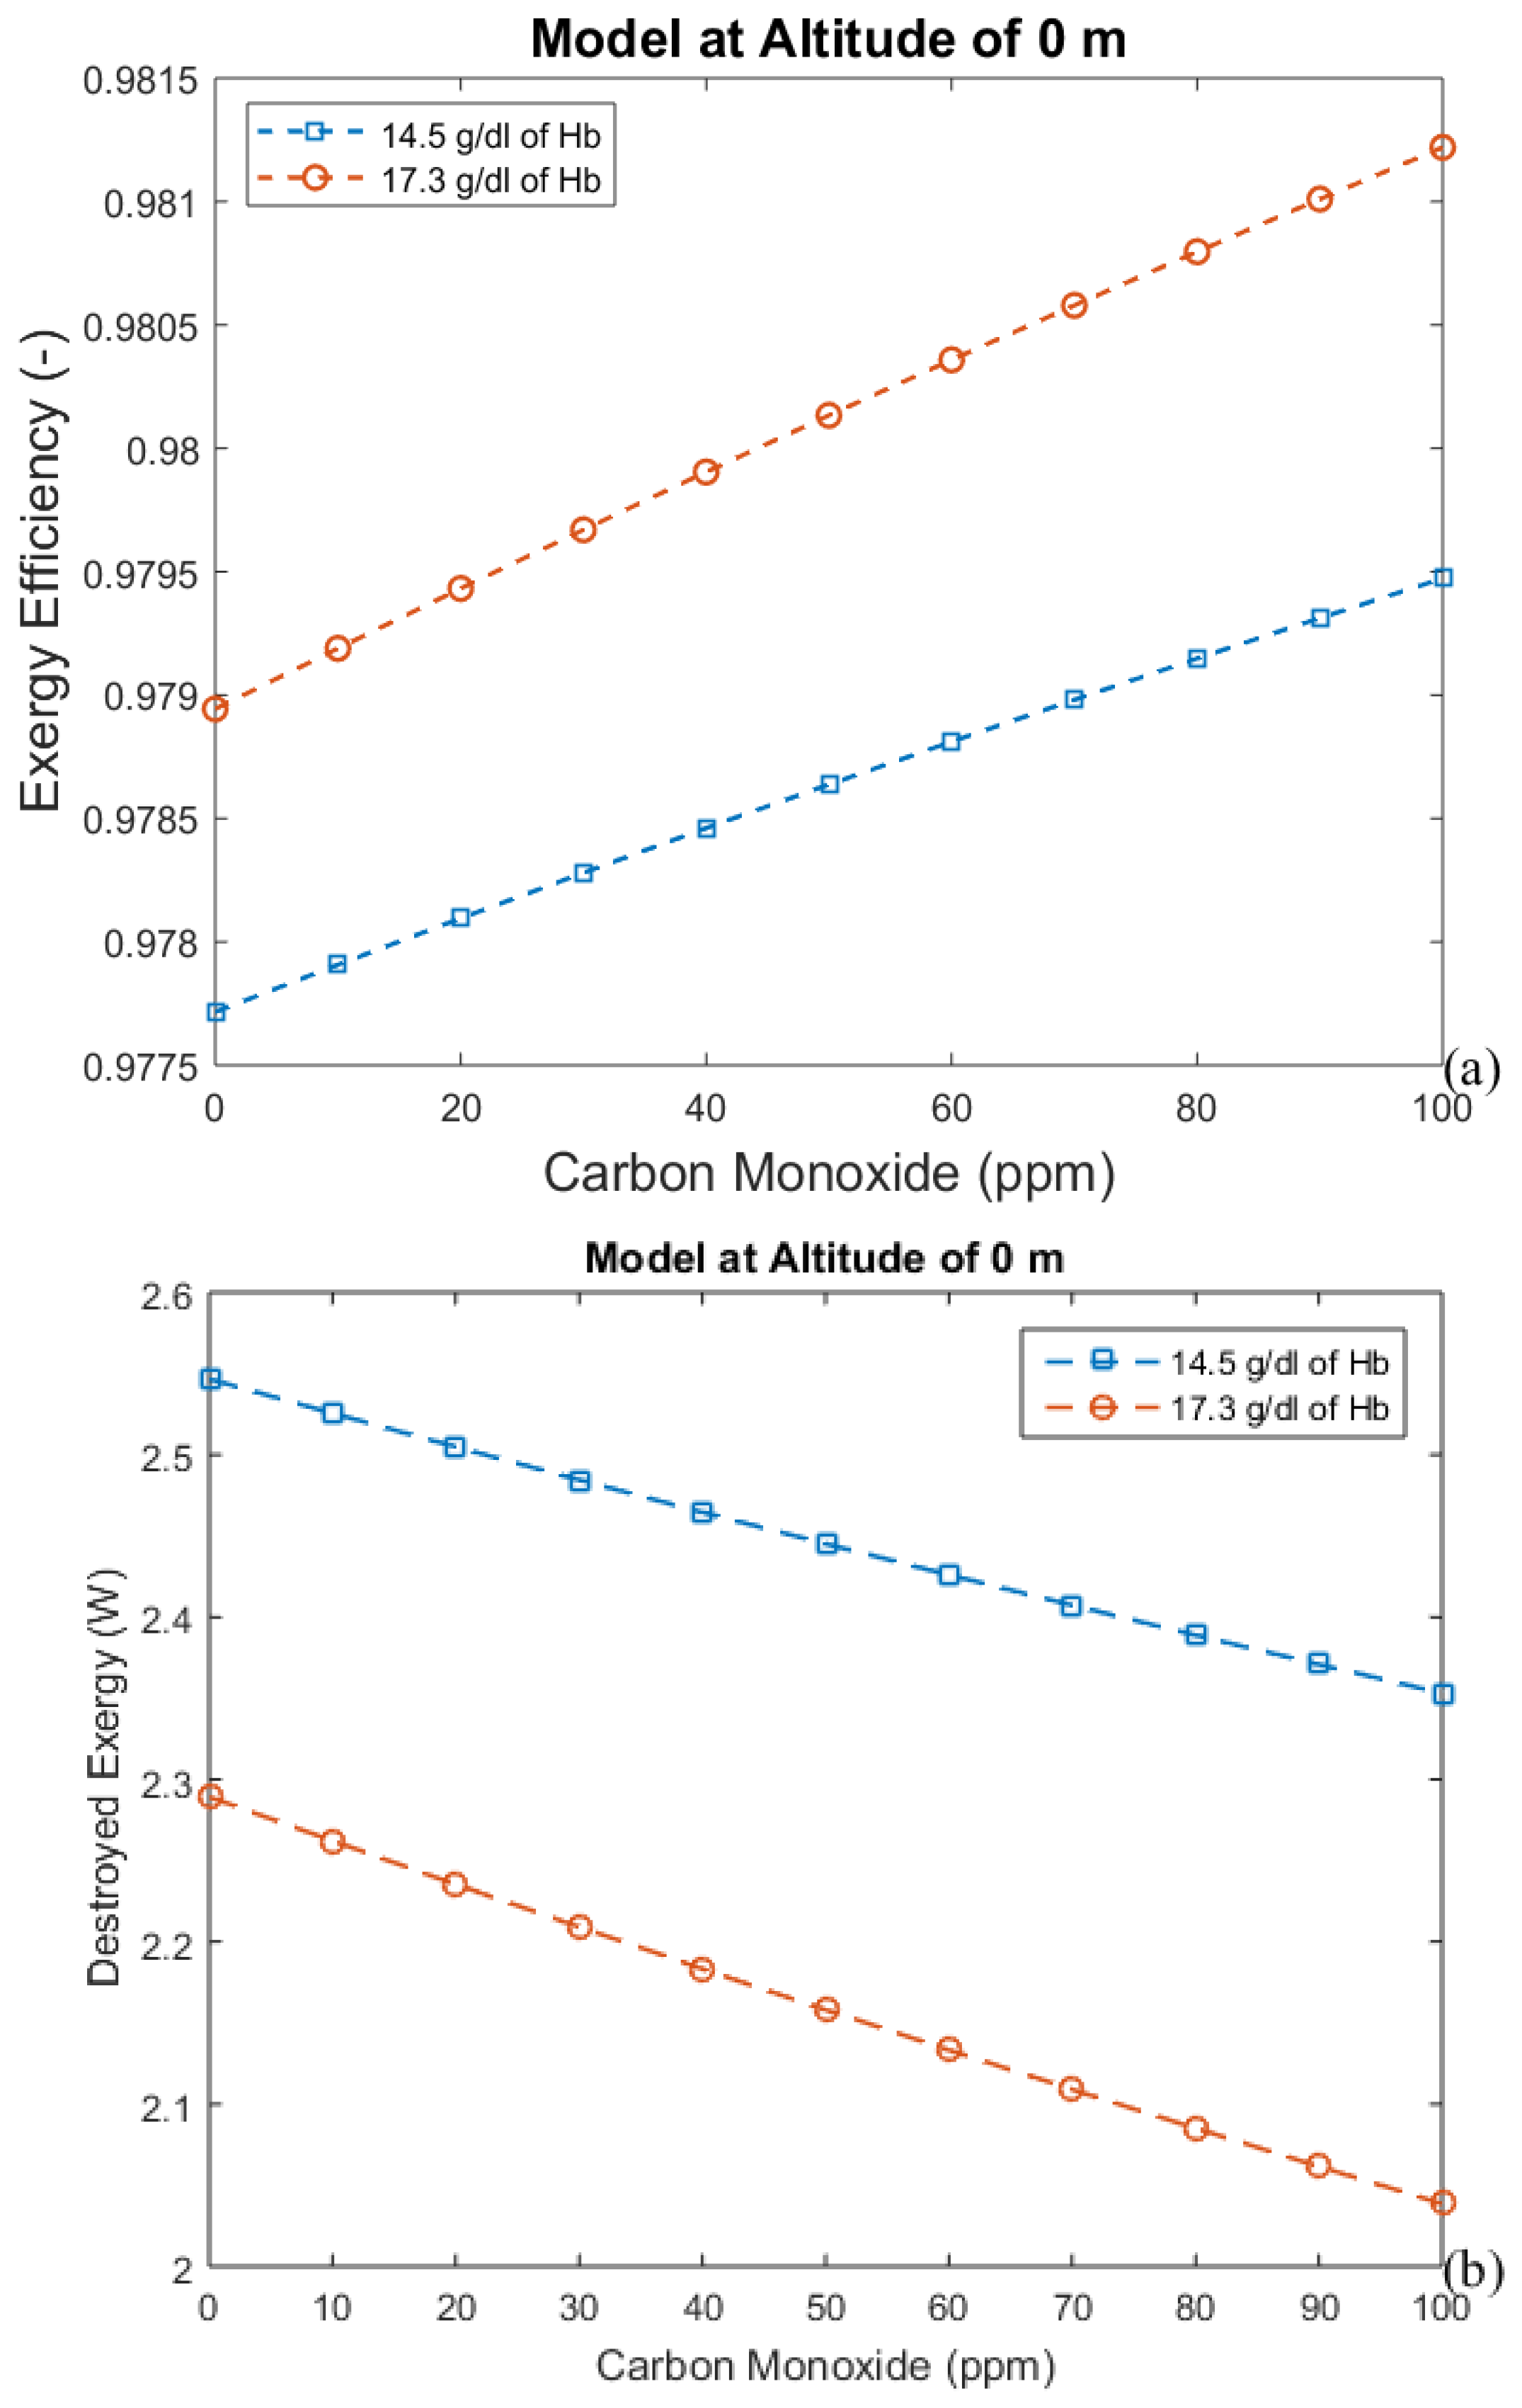
3.1. Considering Gases in the Blood as Ideal Gases
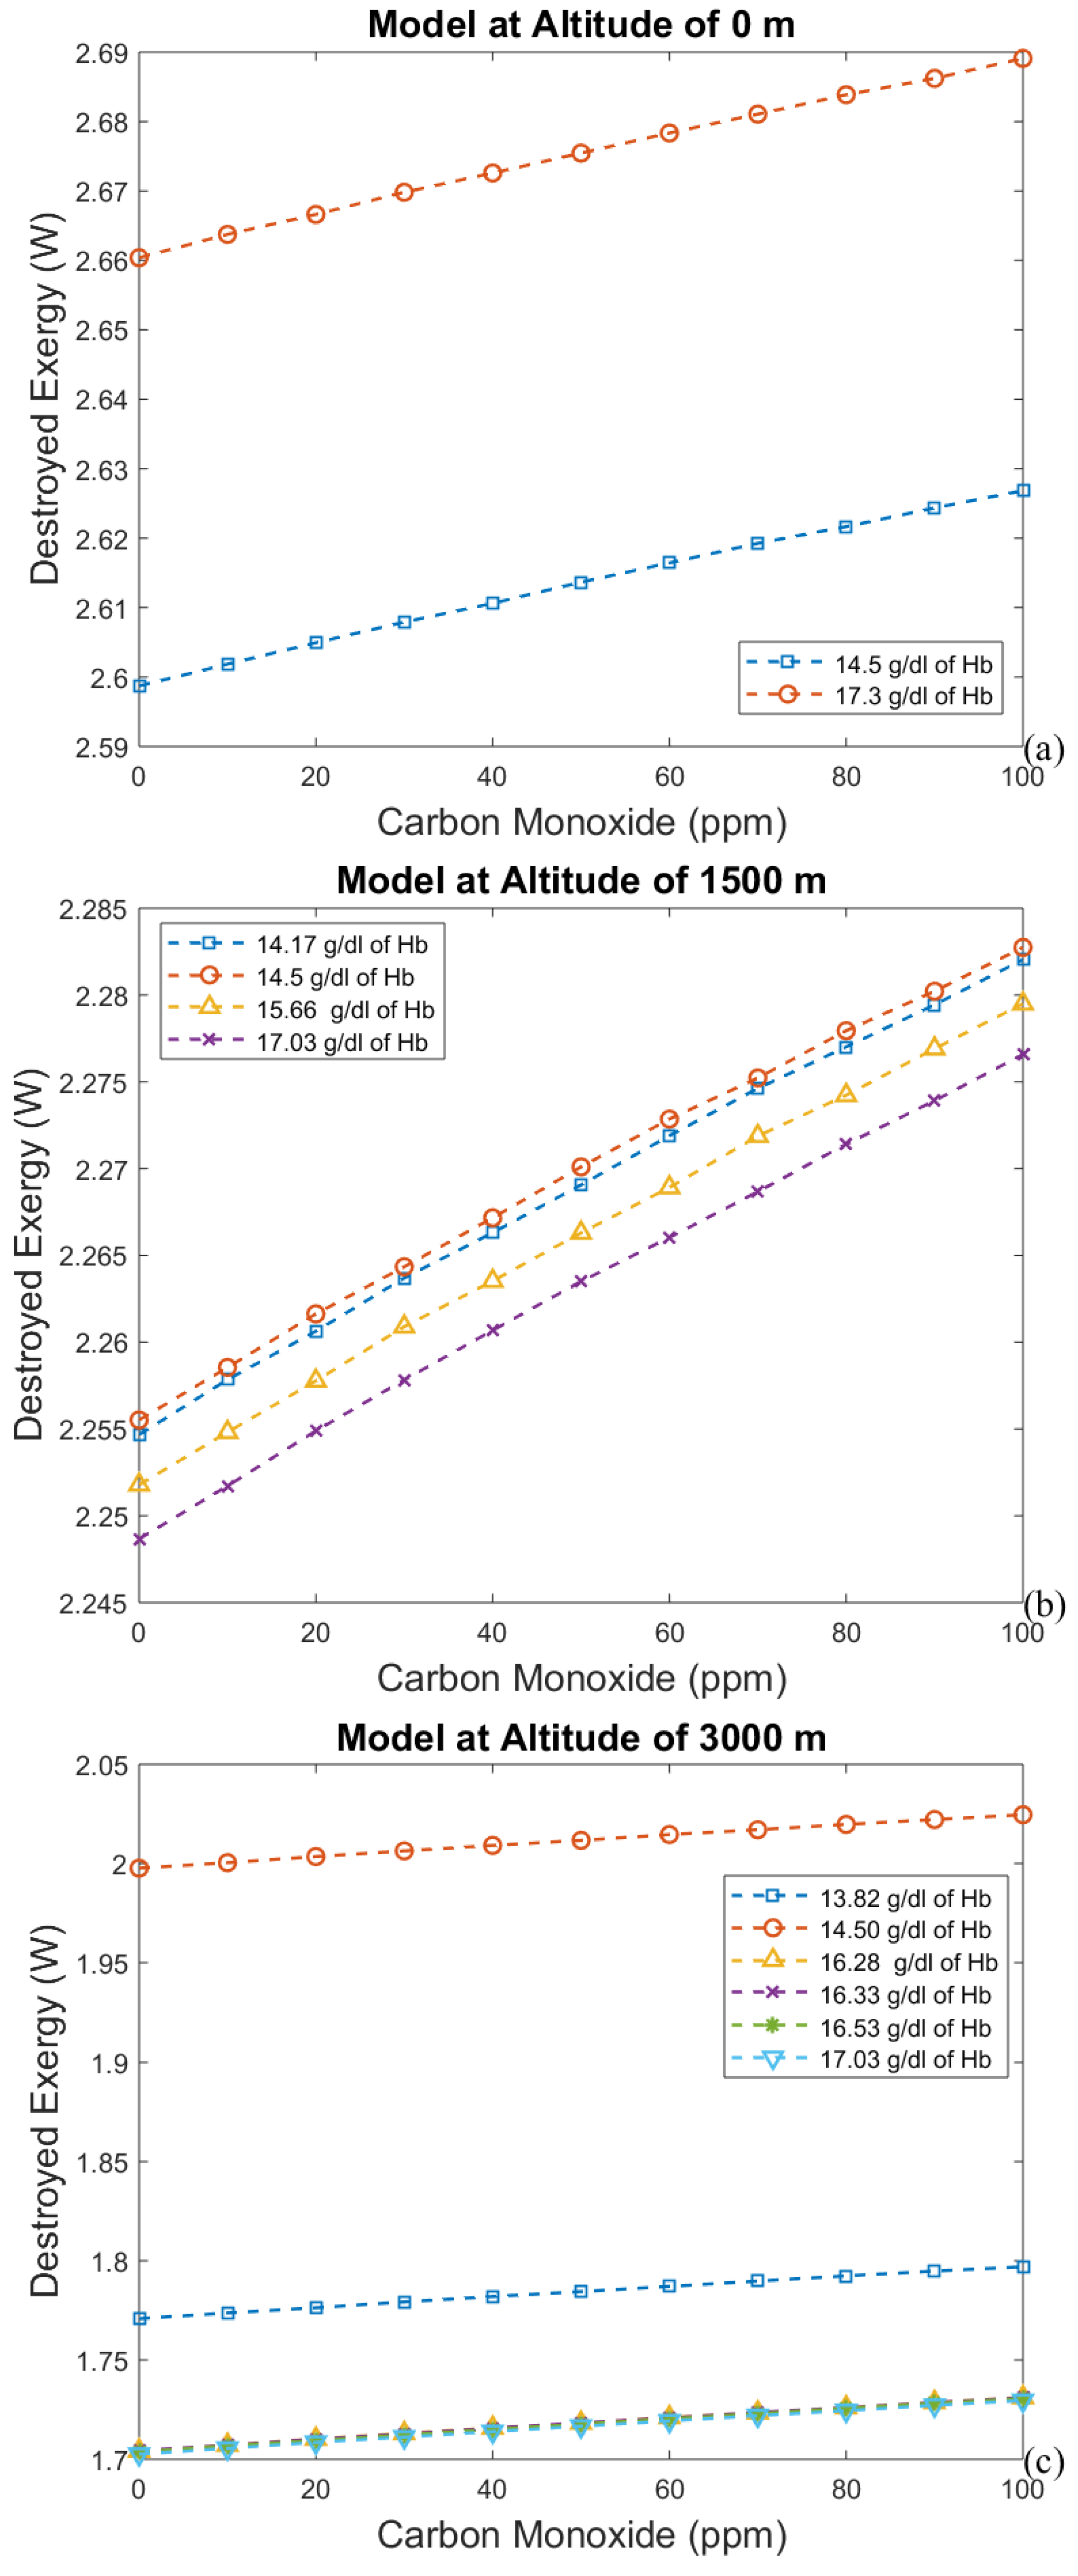
3.2. Considering the Effect of Hemoglobin Reaction with Inspired Gases
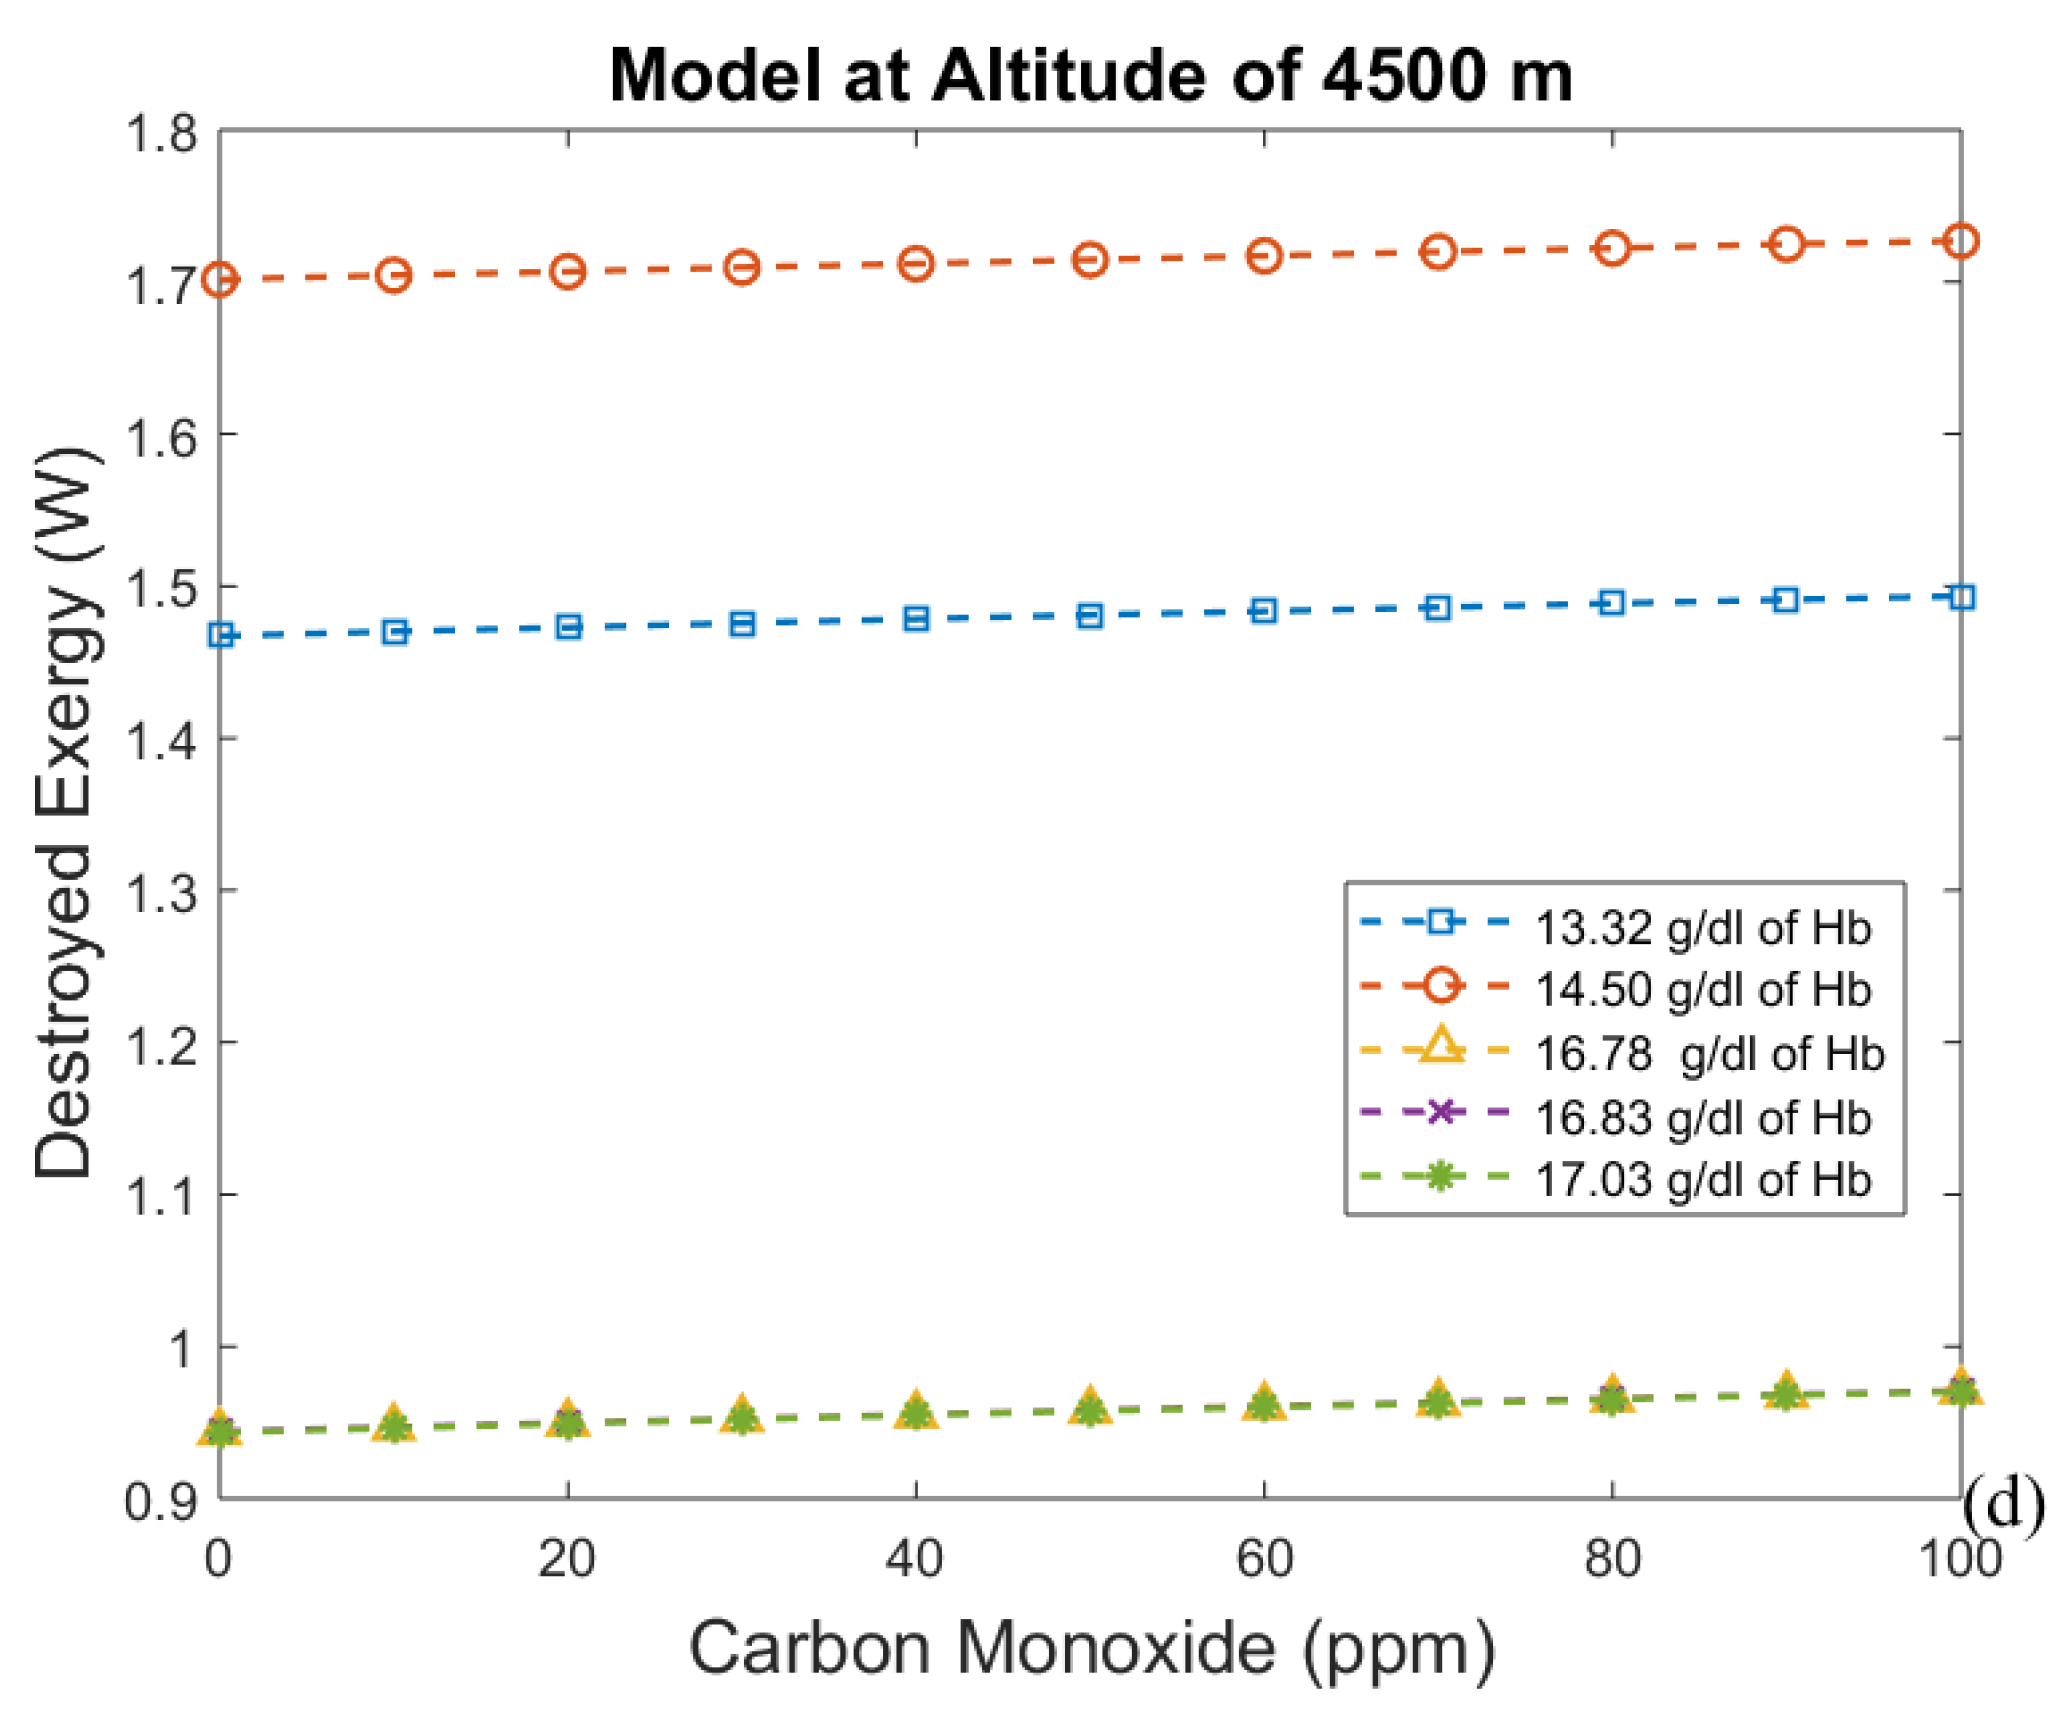
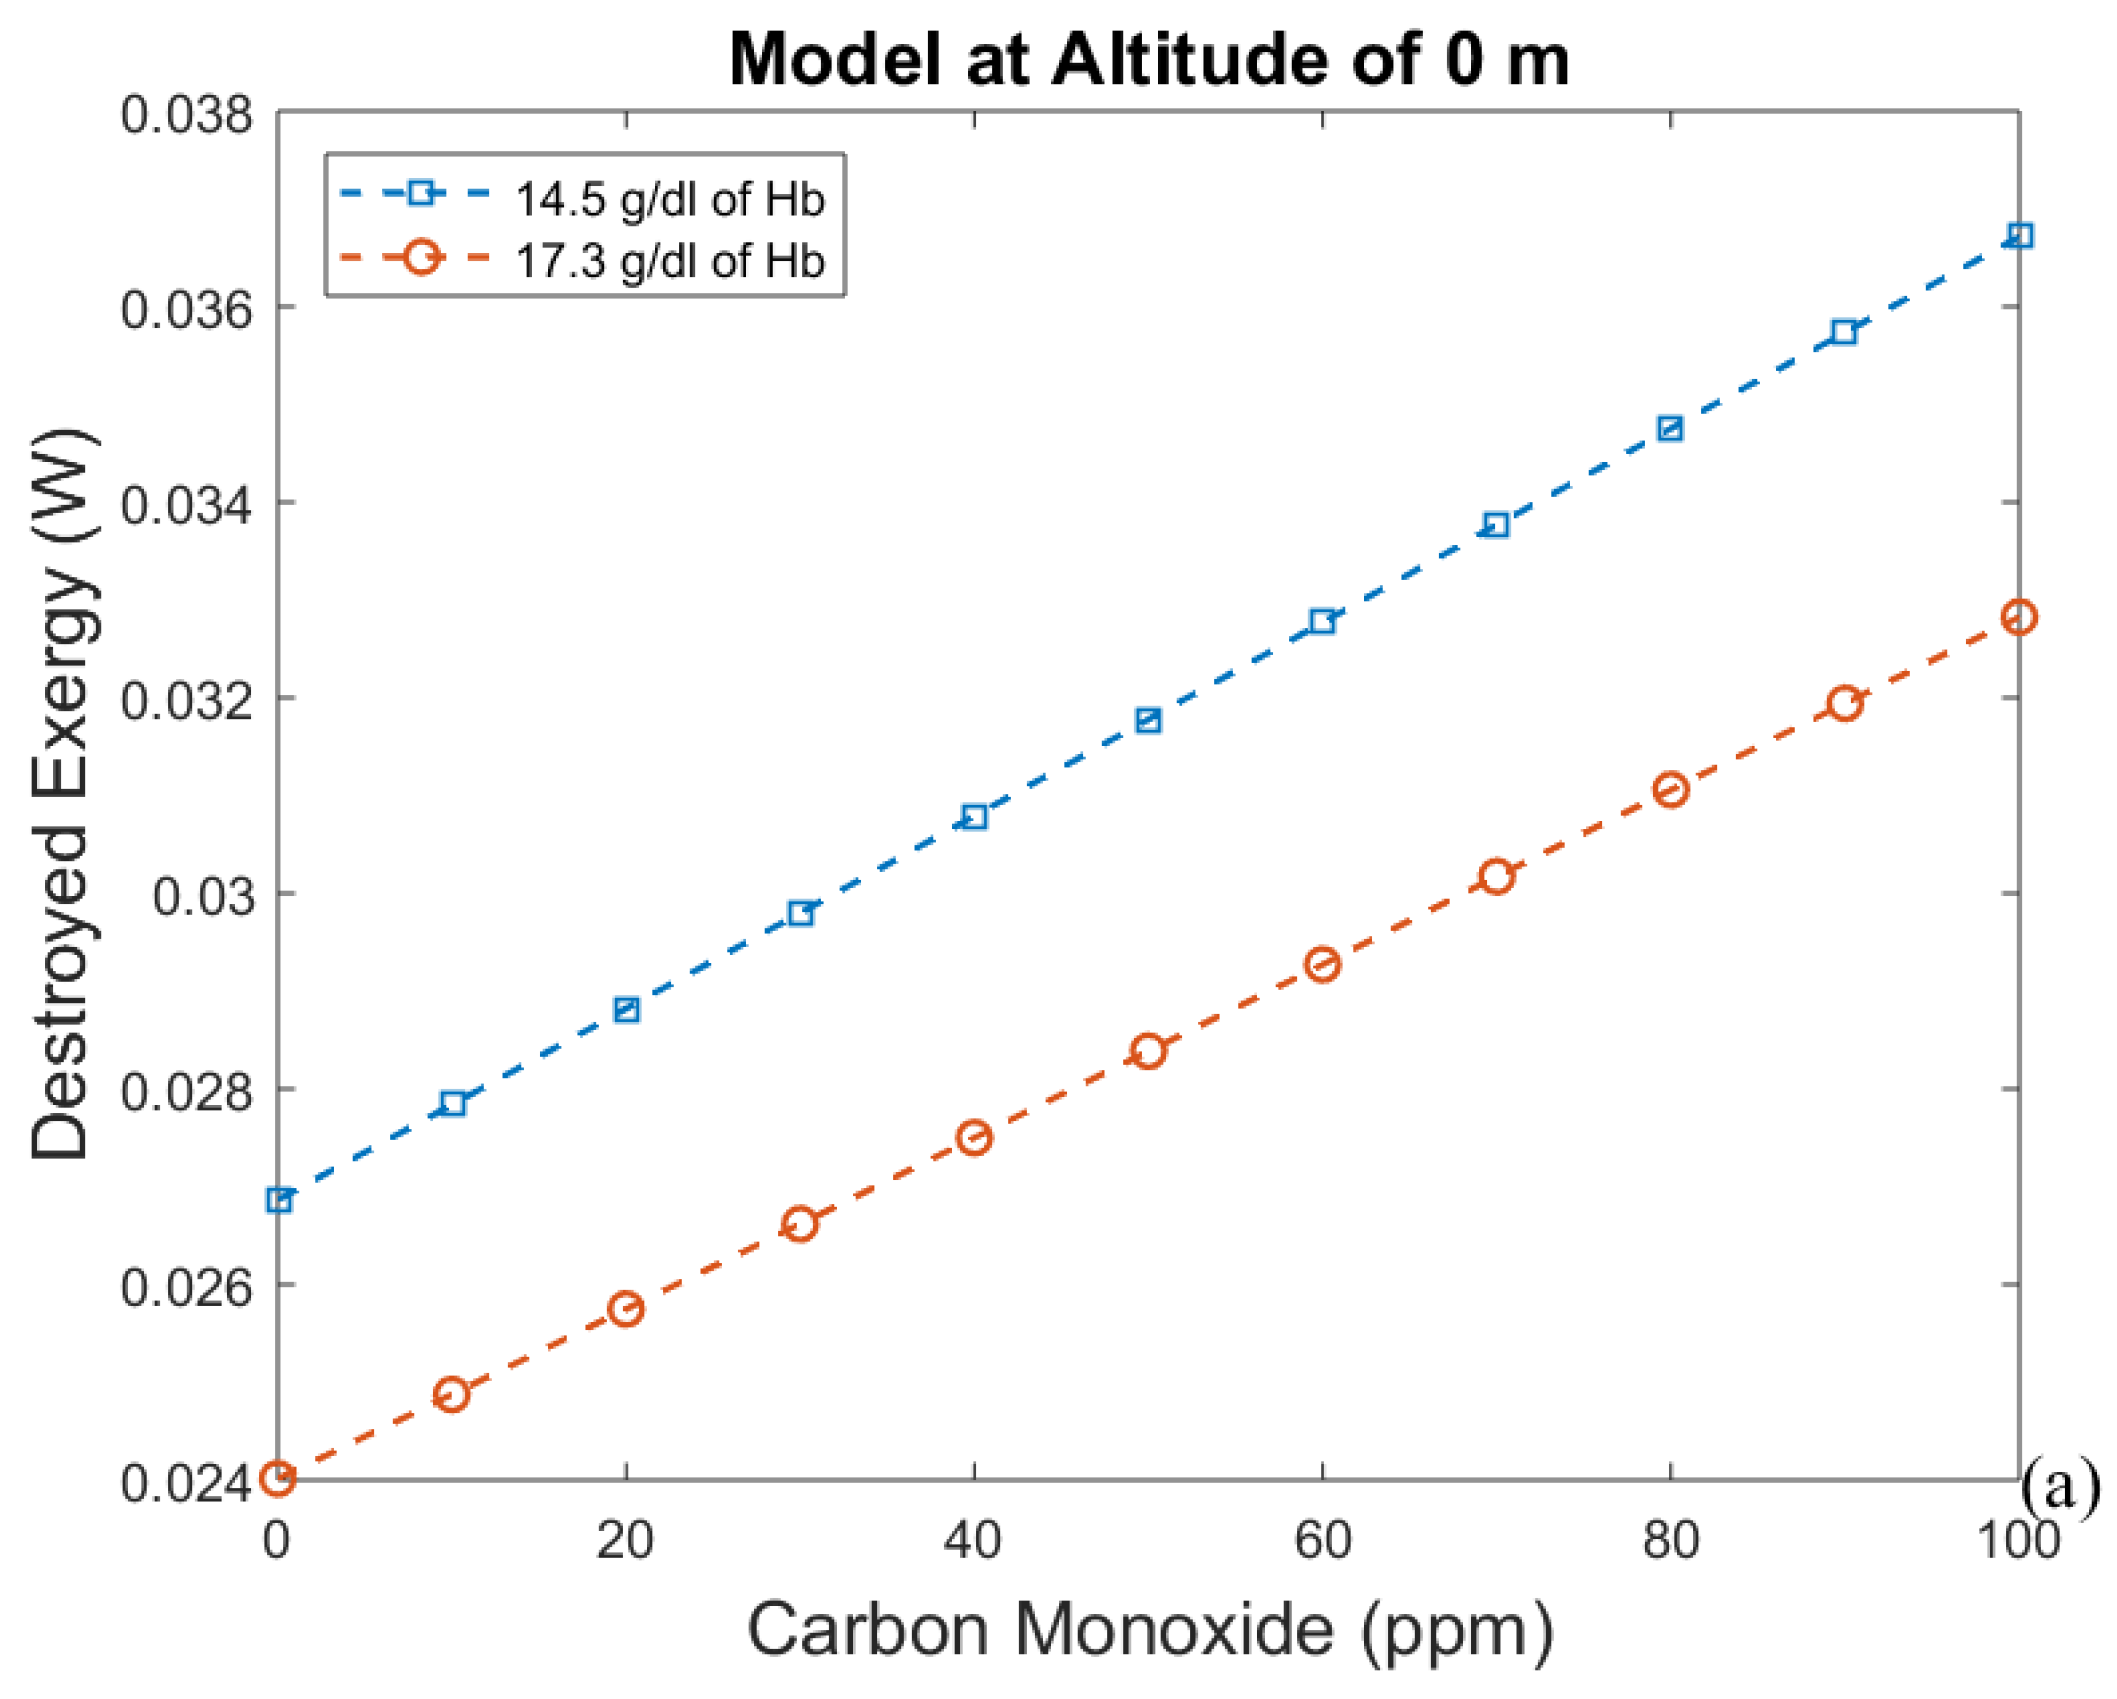
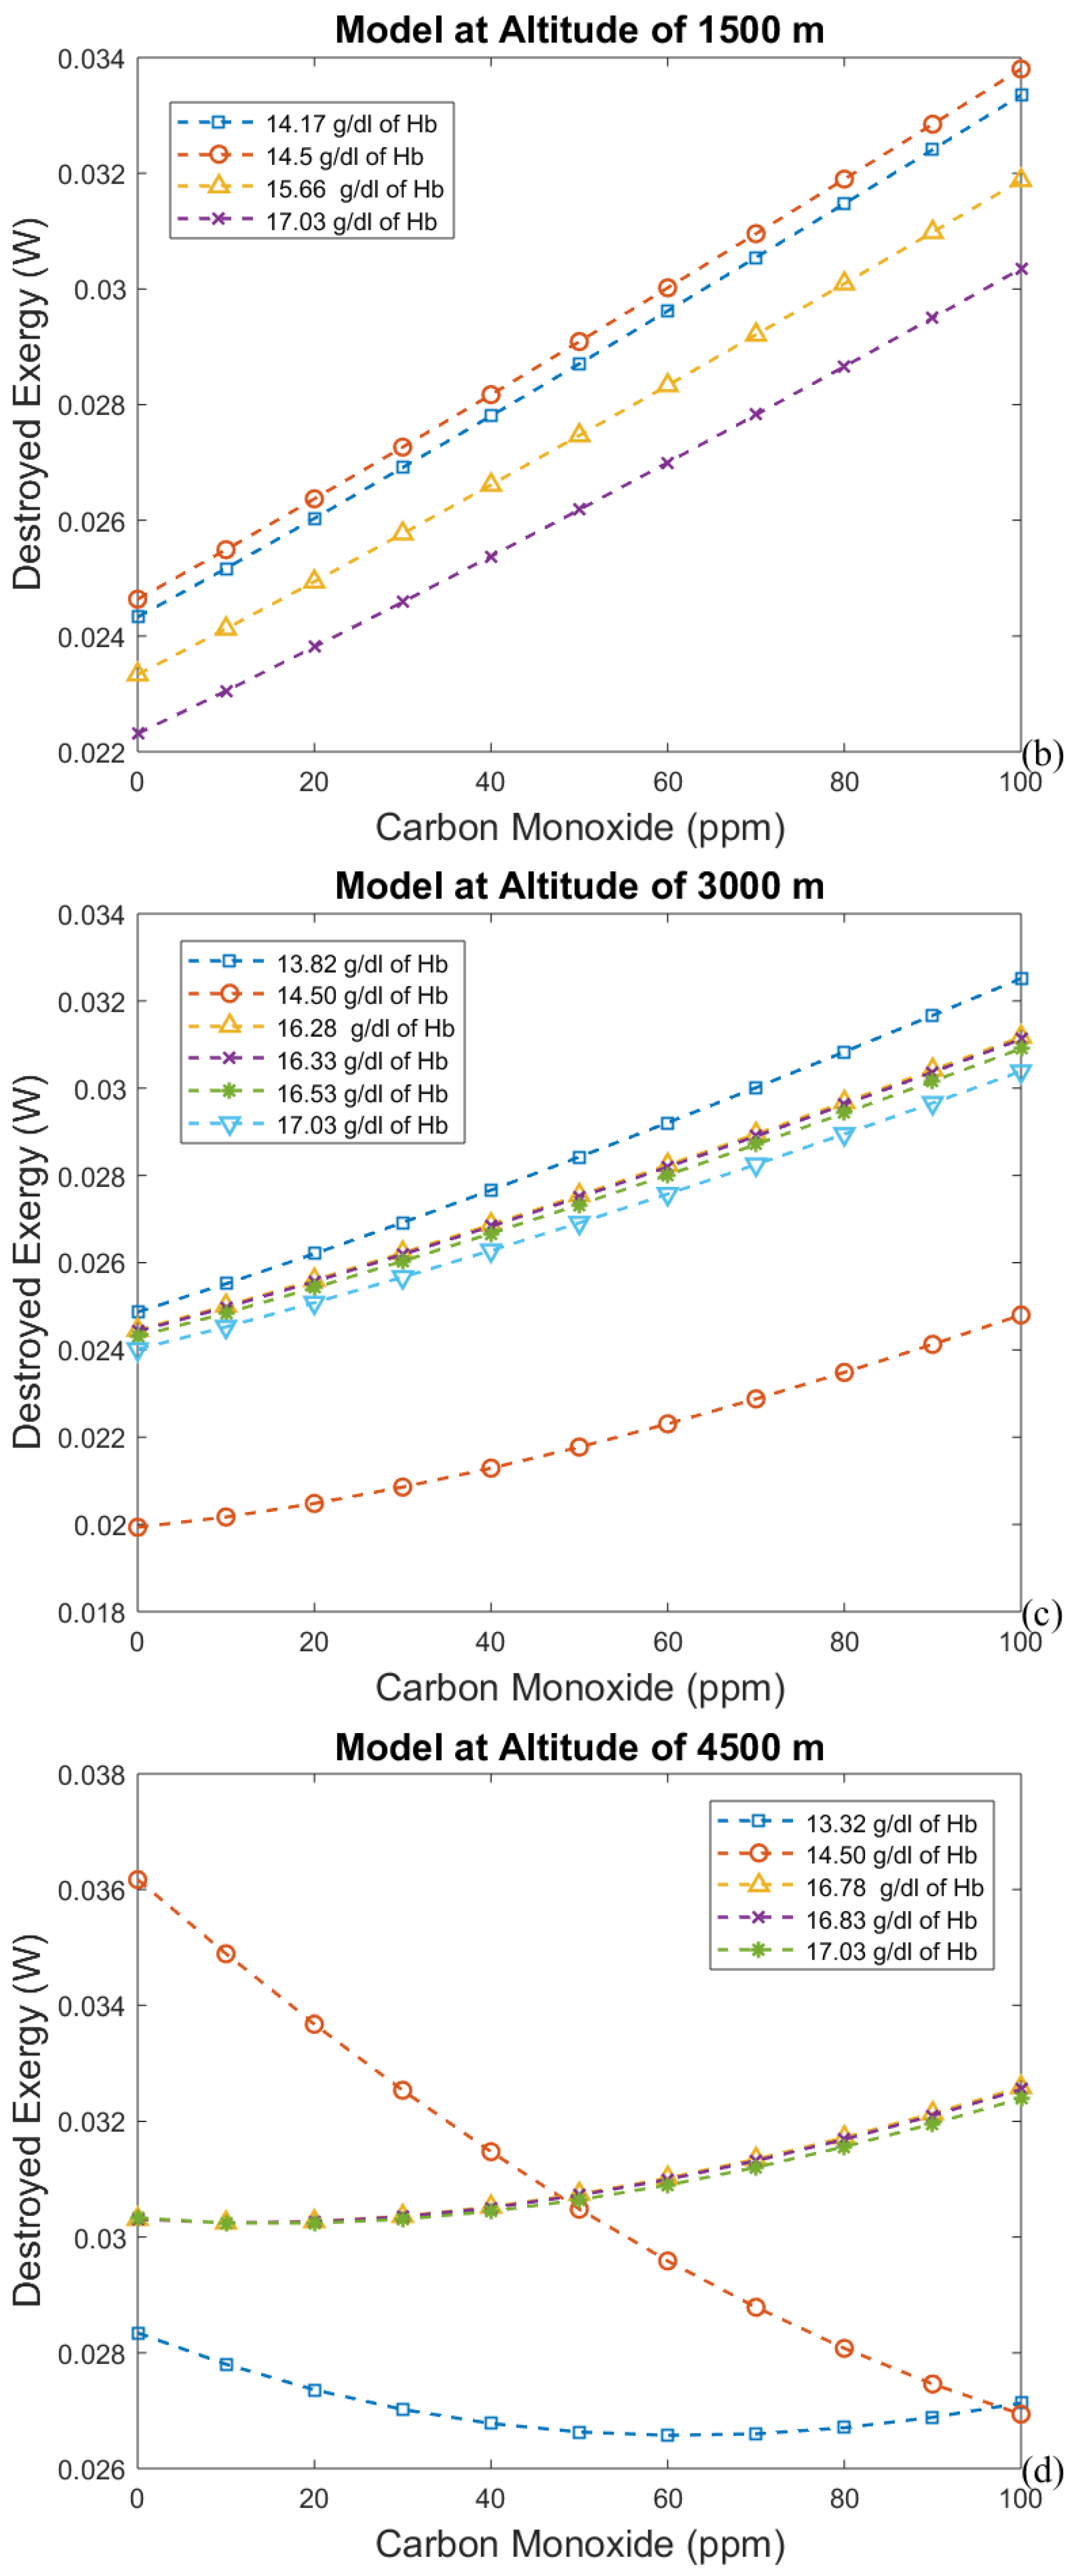
3.3. Irreversibilities Associated with Mass Transfer Rate
4. Conclusions
- The first approach leads to an increase in efficiency (and a decrease in exergy destruction rate) when CO poisoning happens. Acclimatization increases efficiency and altitude decreases it.
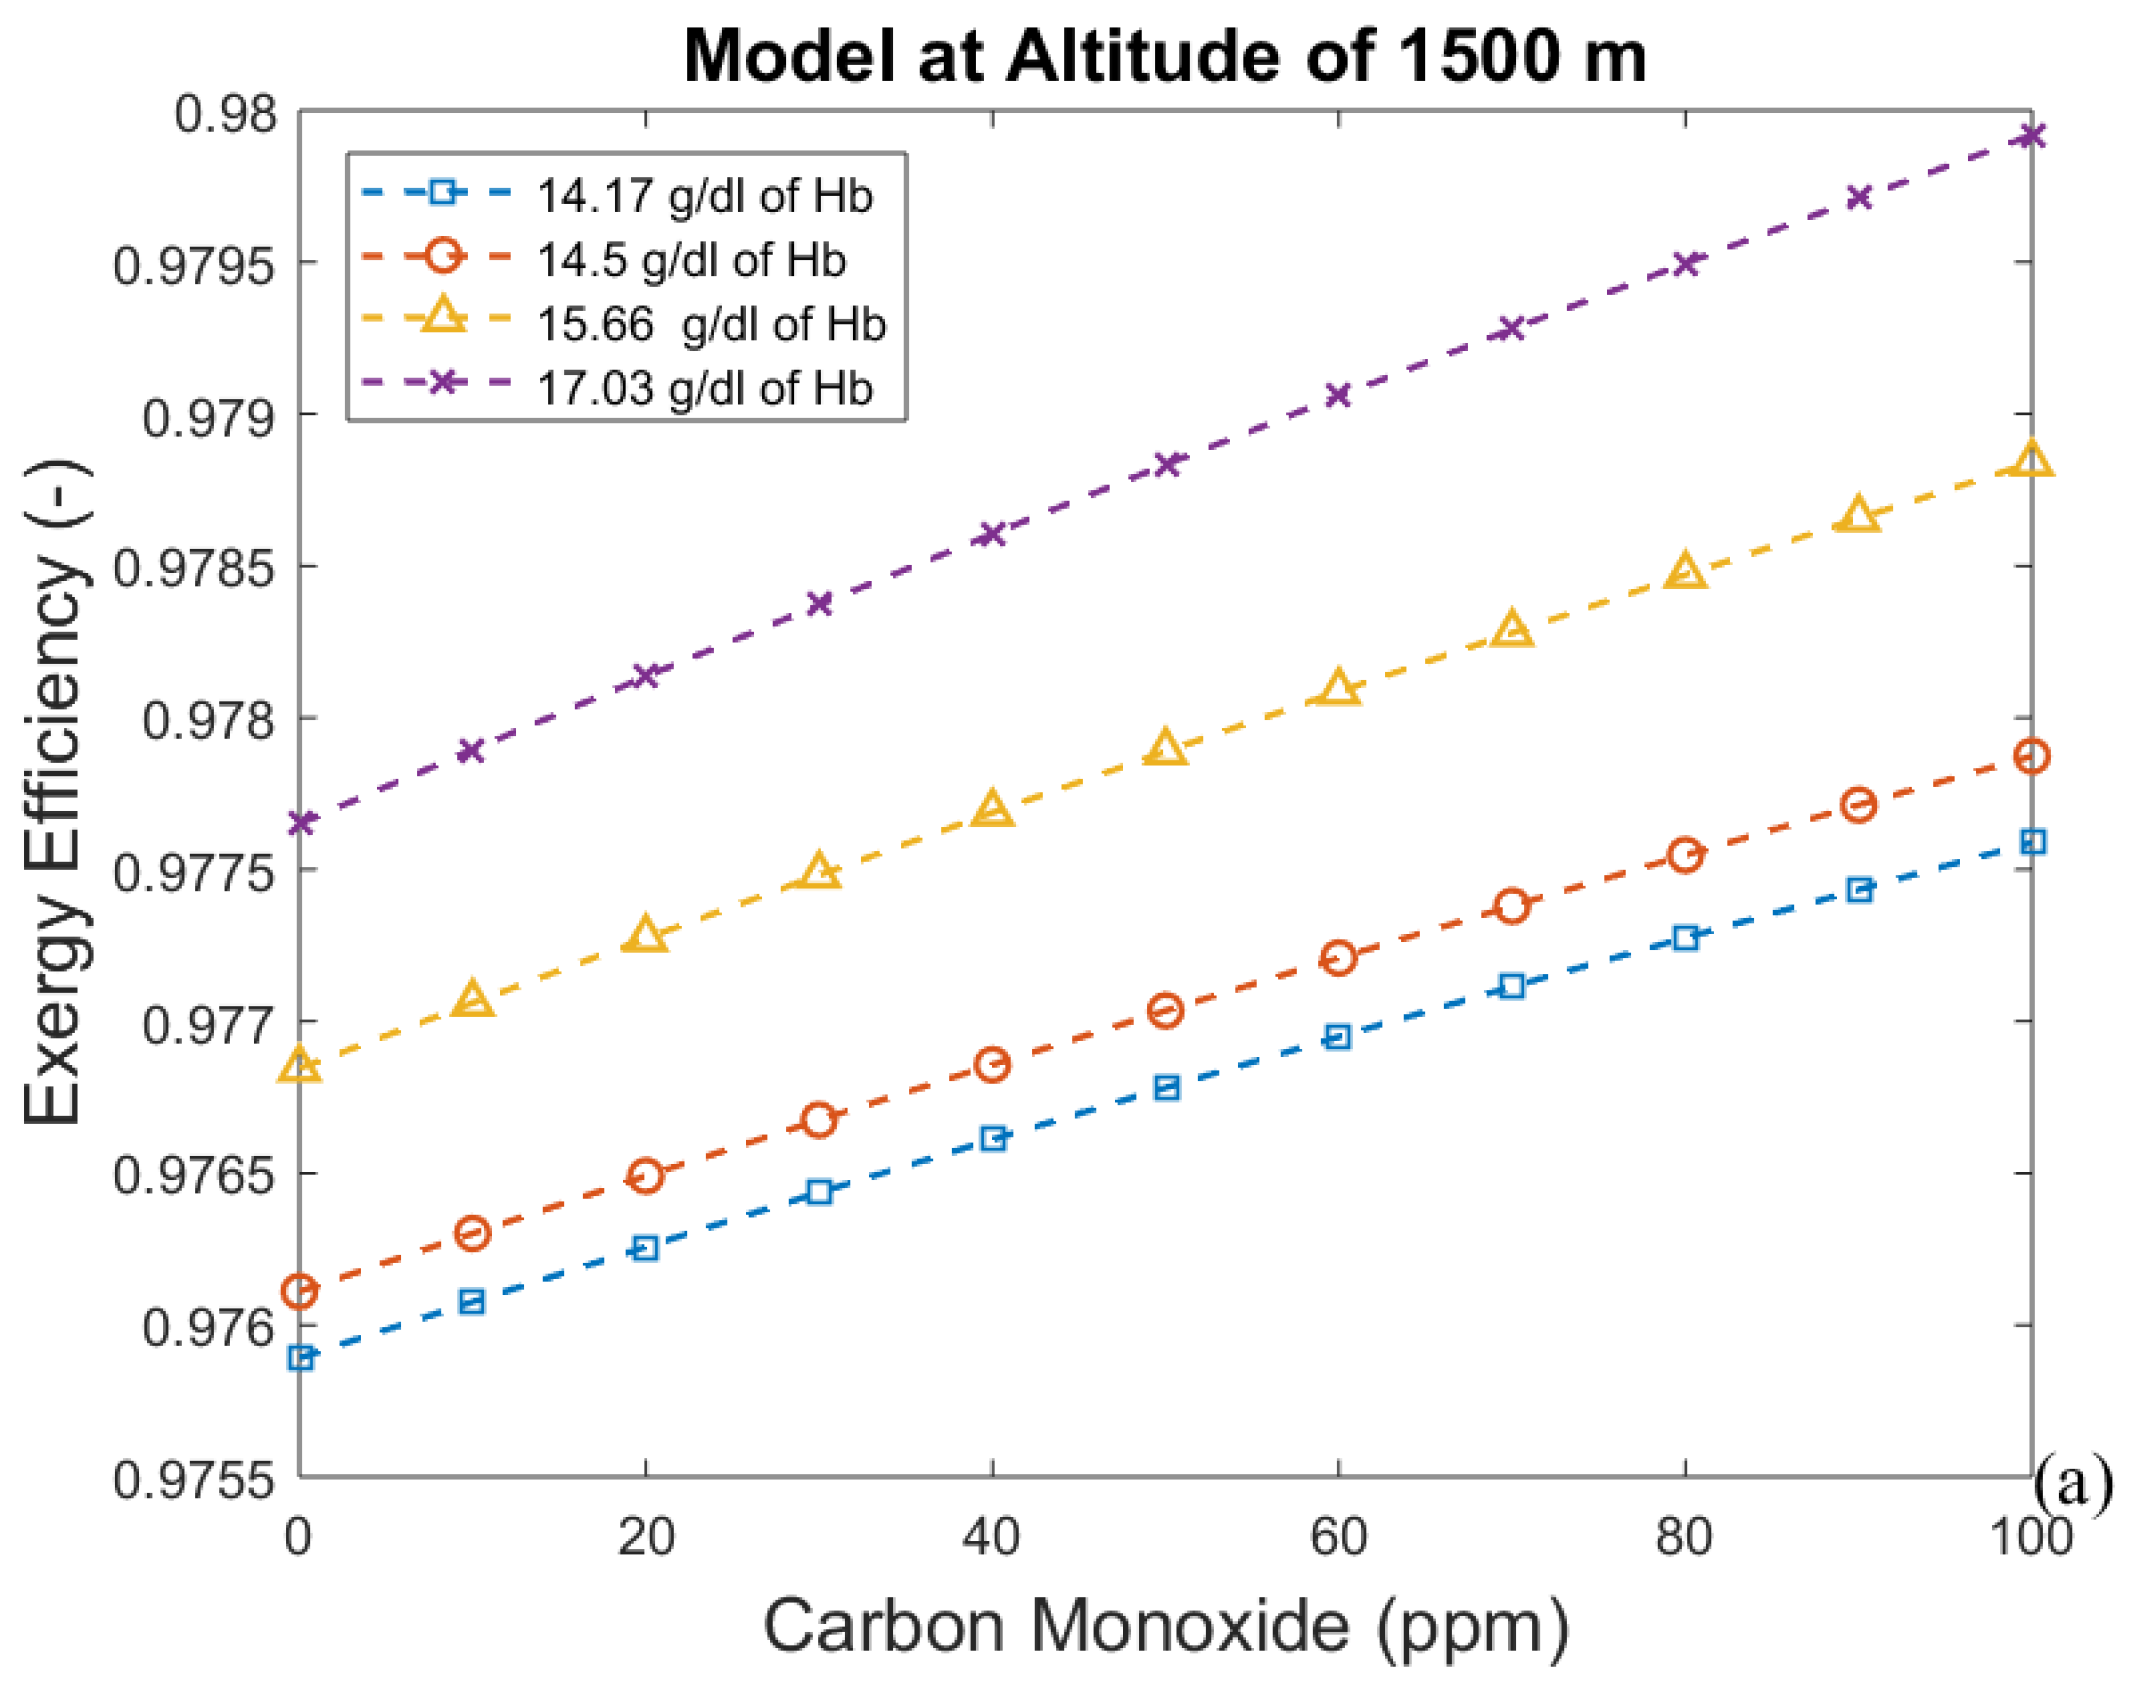
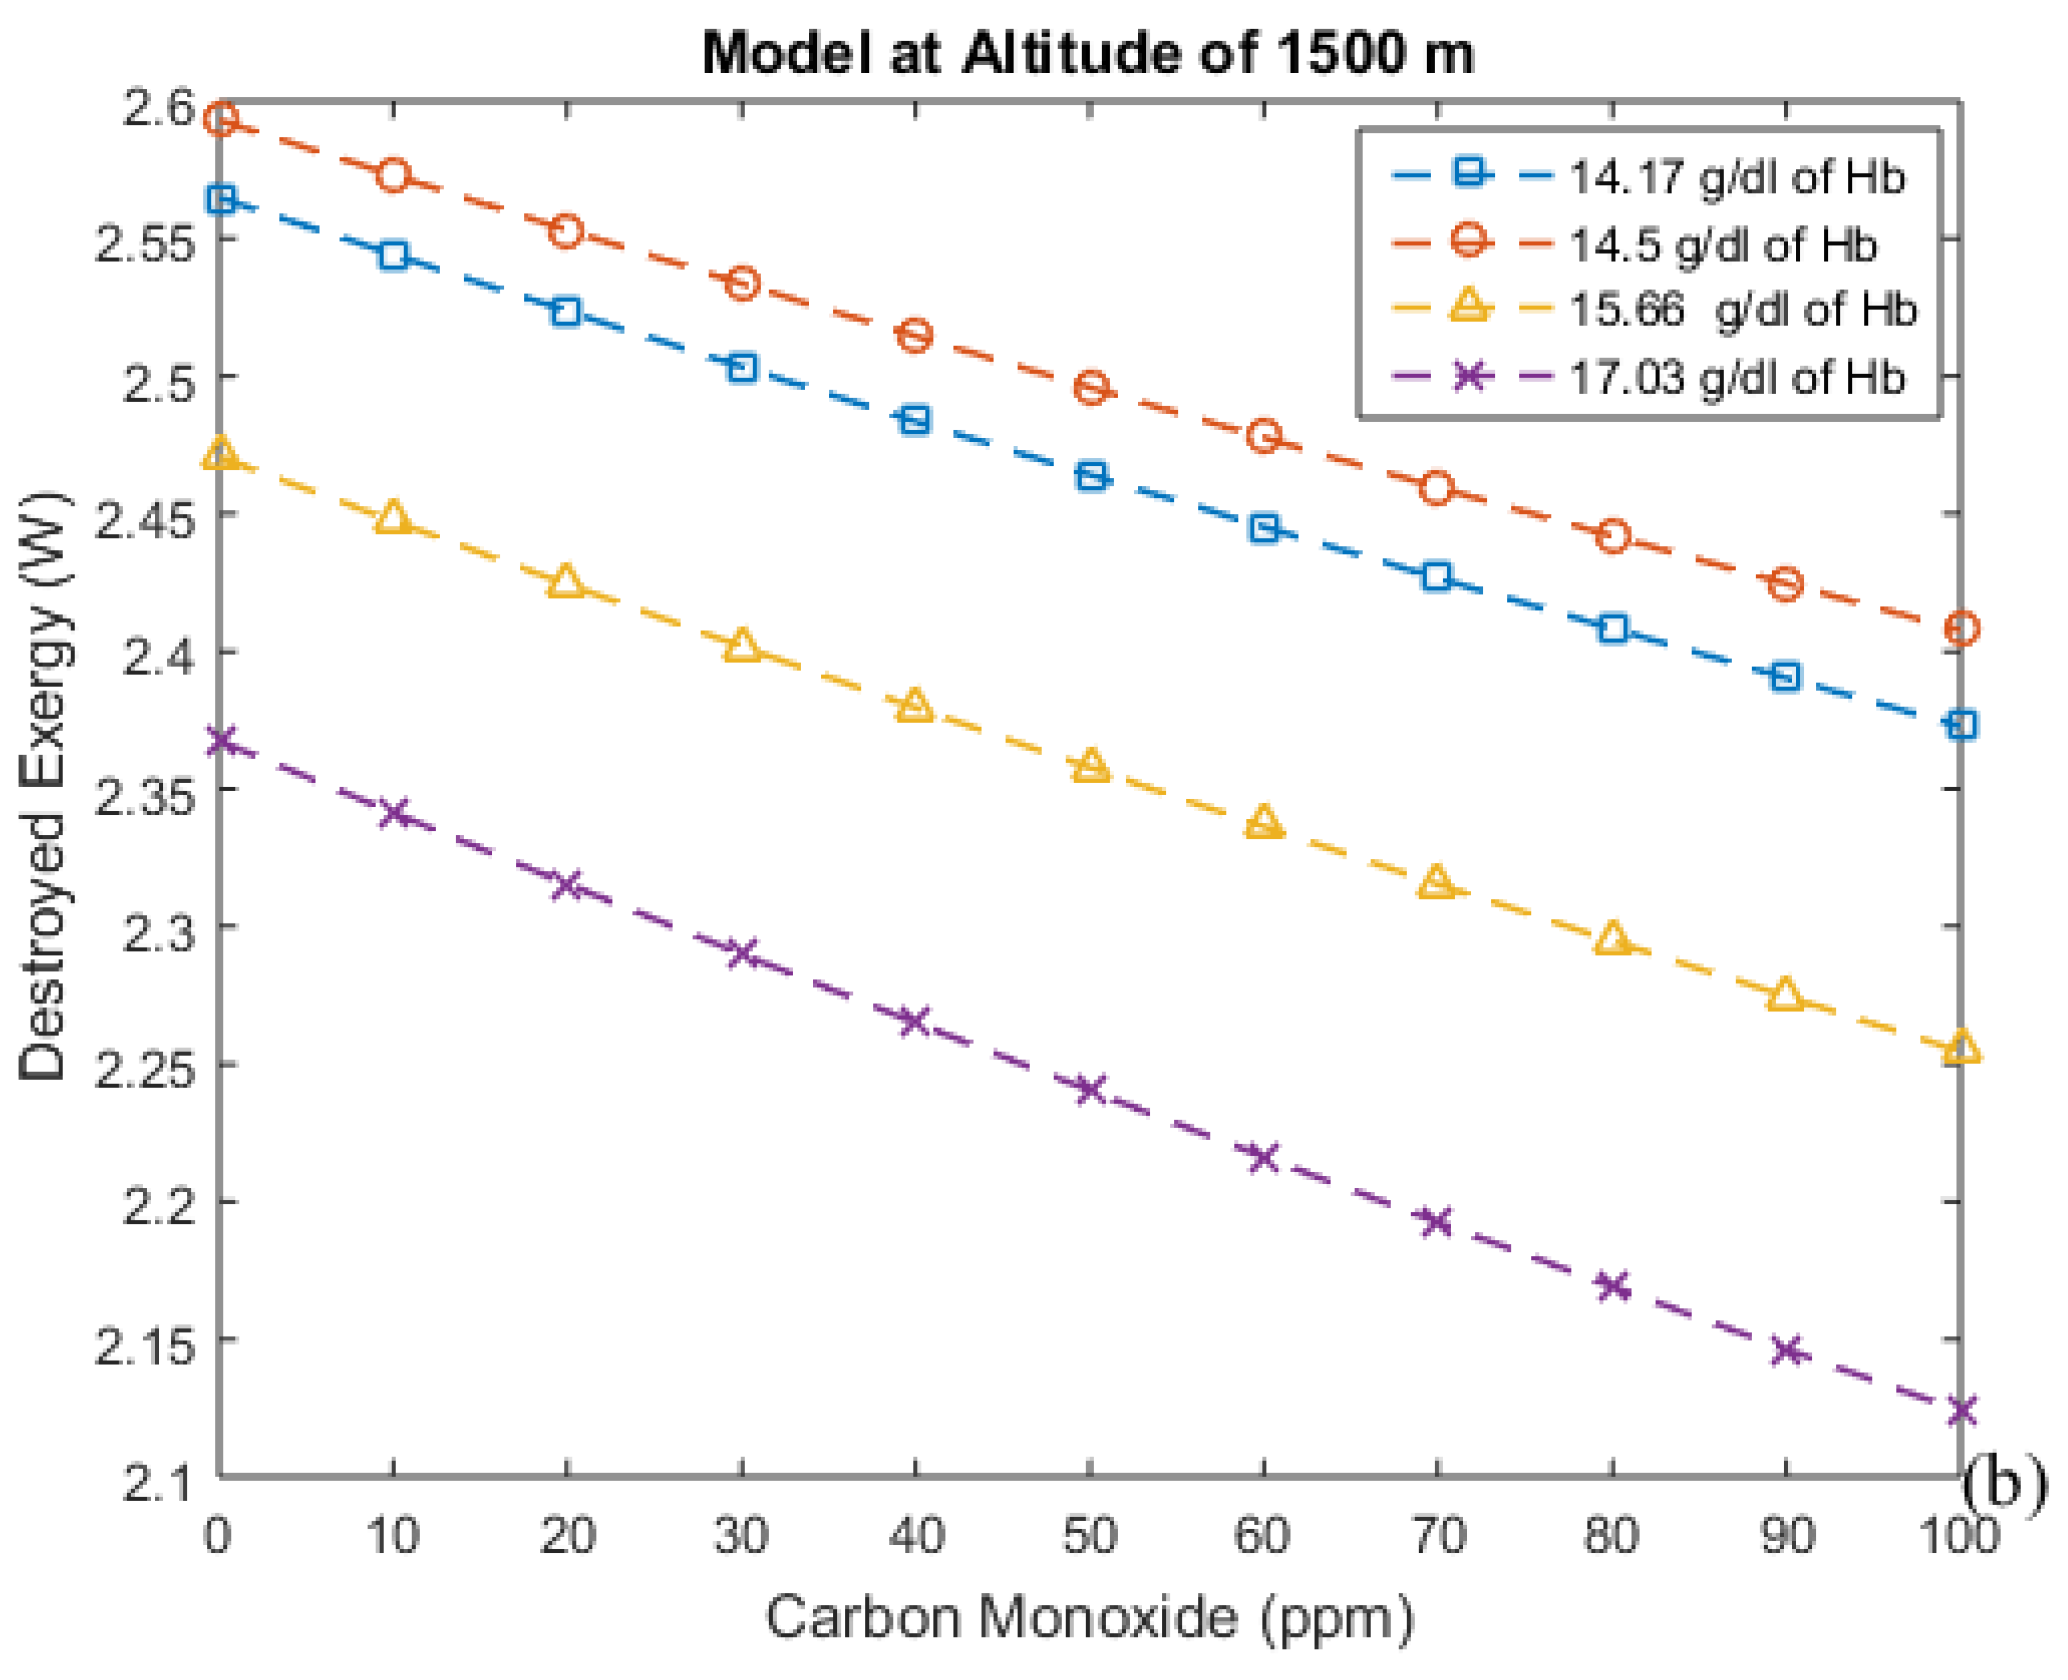
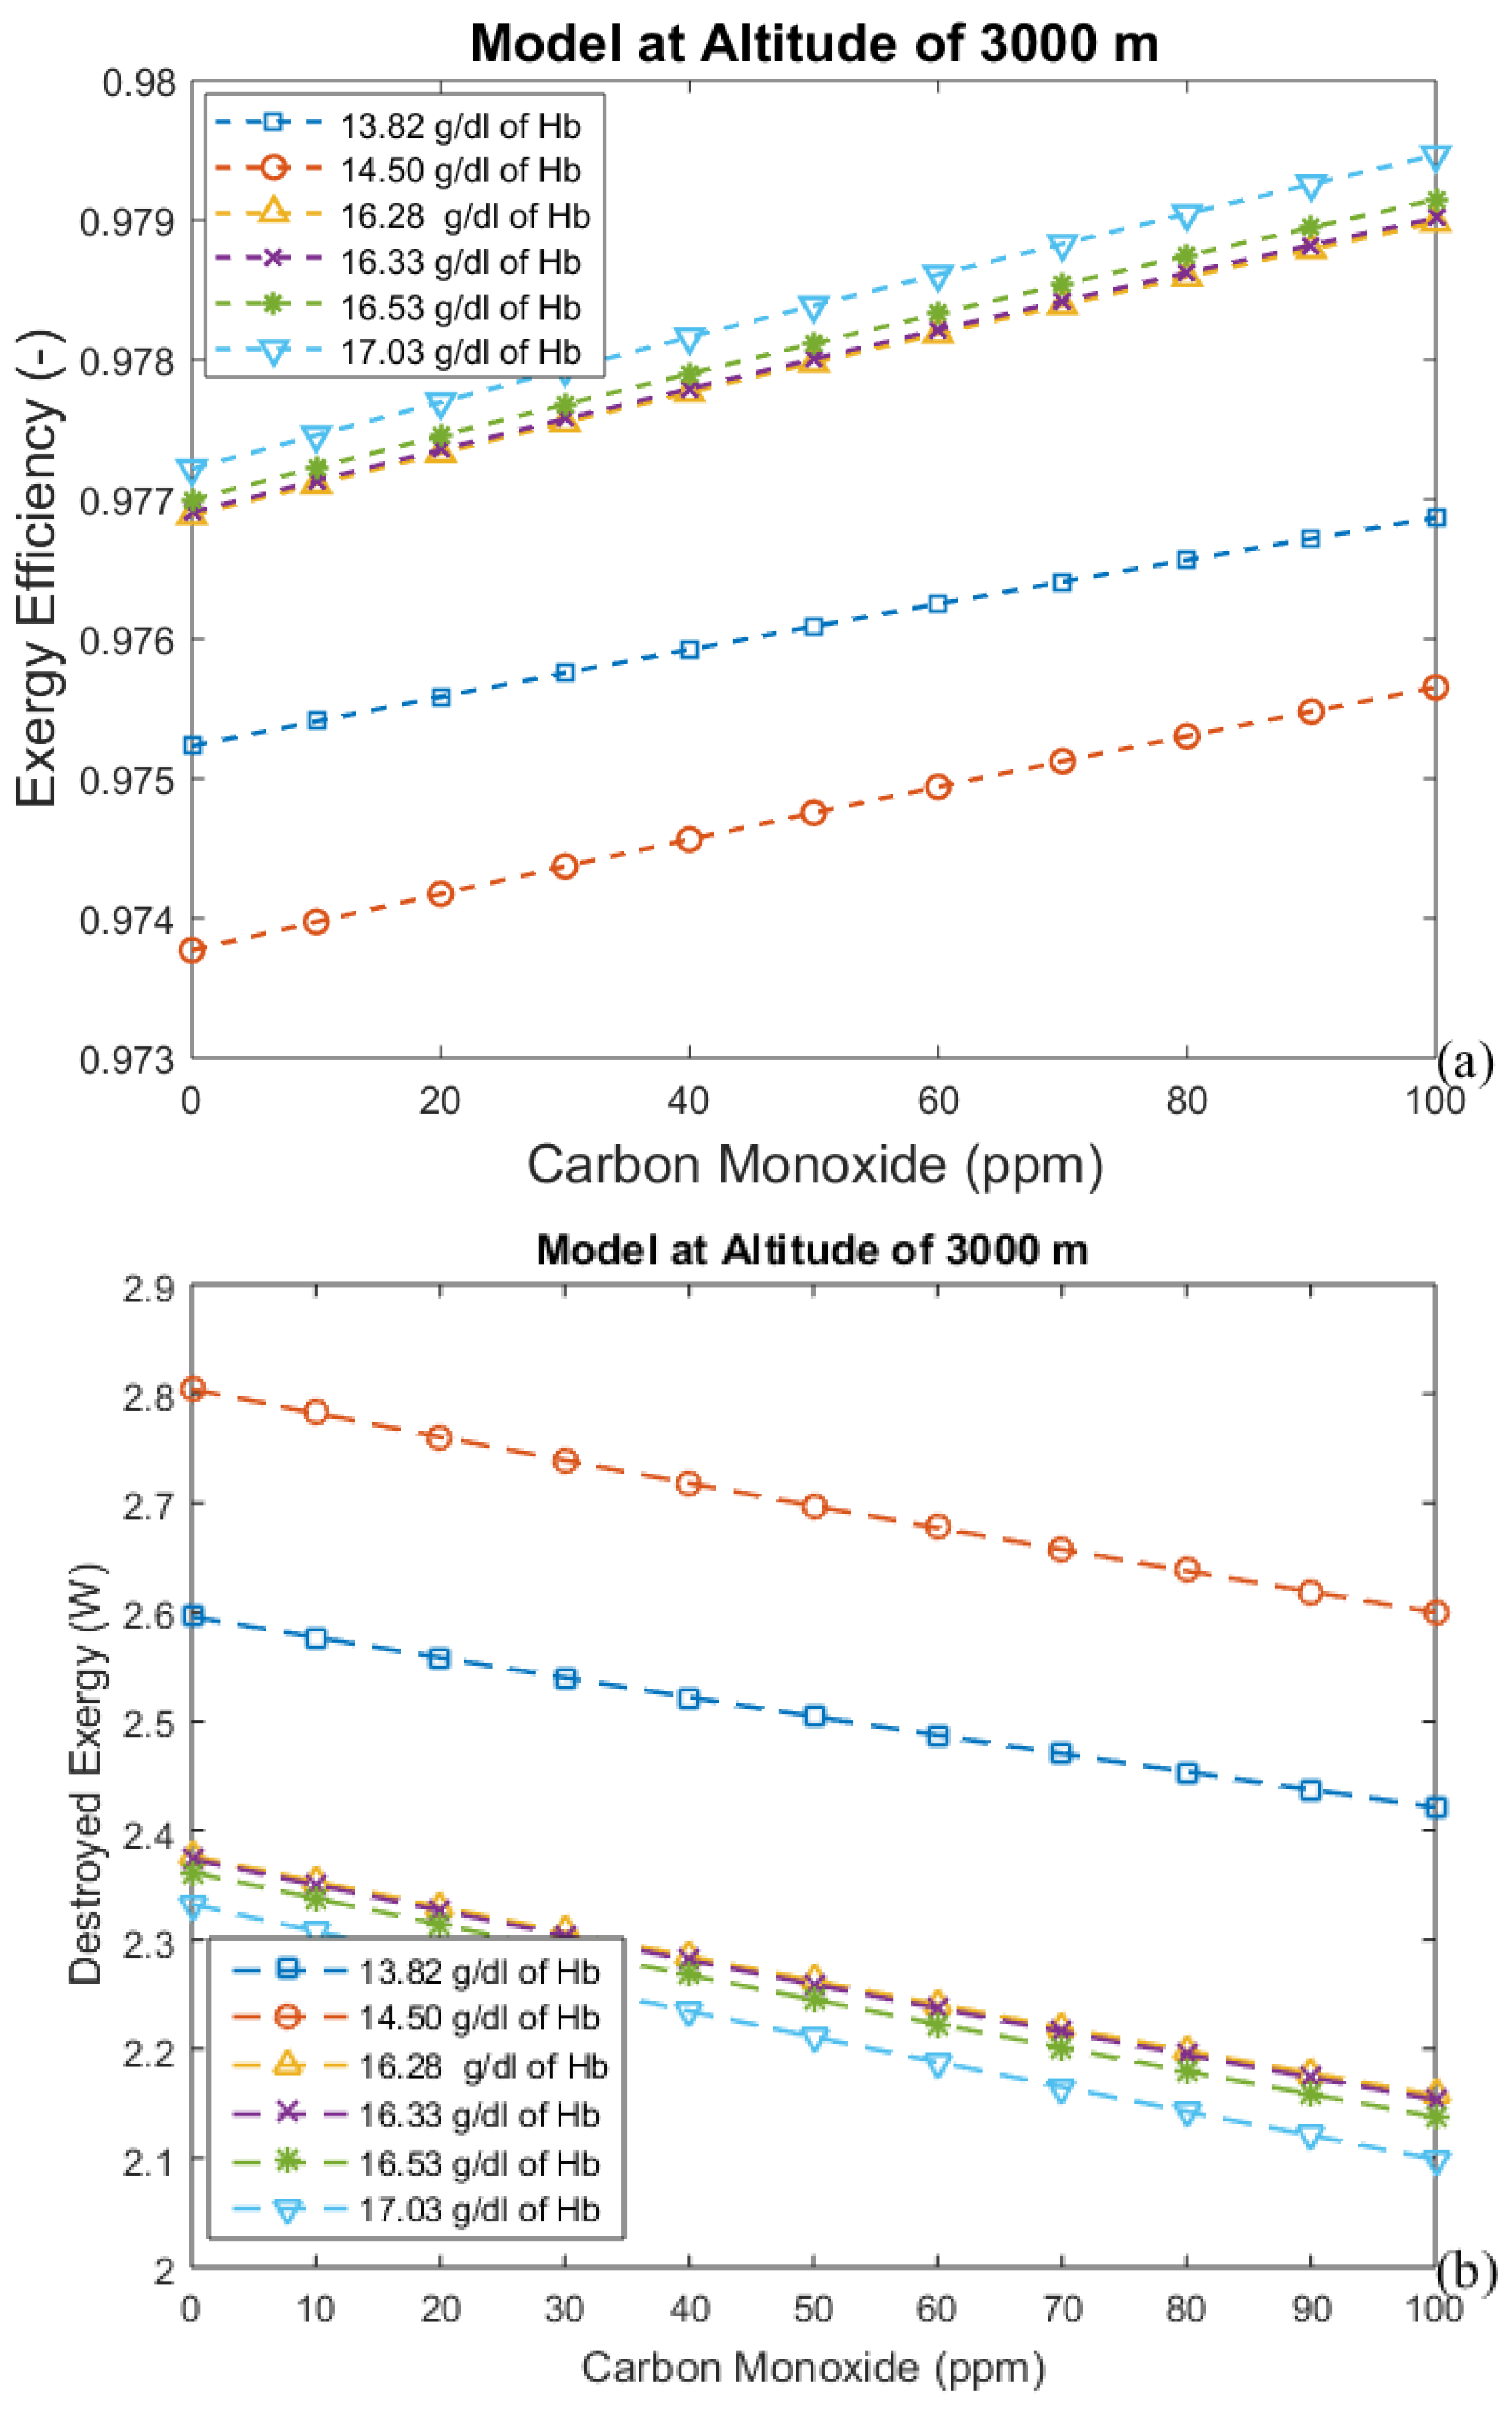
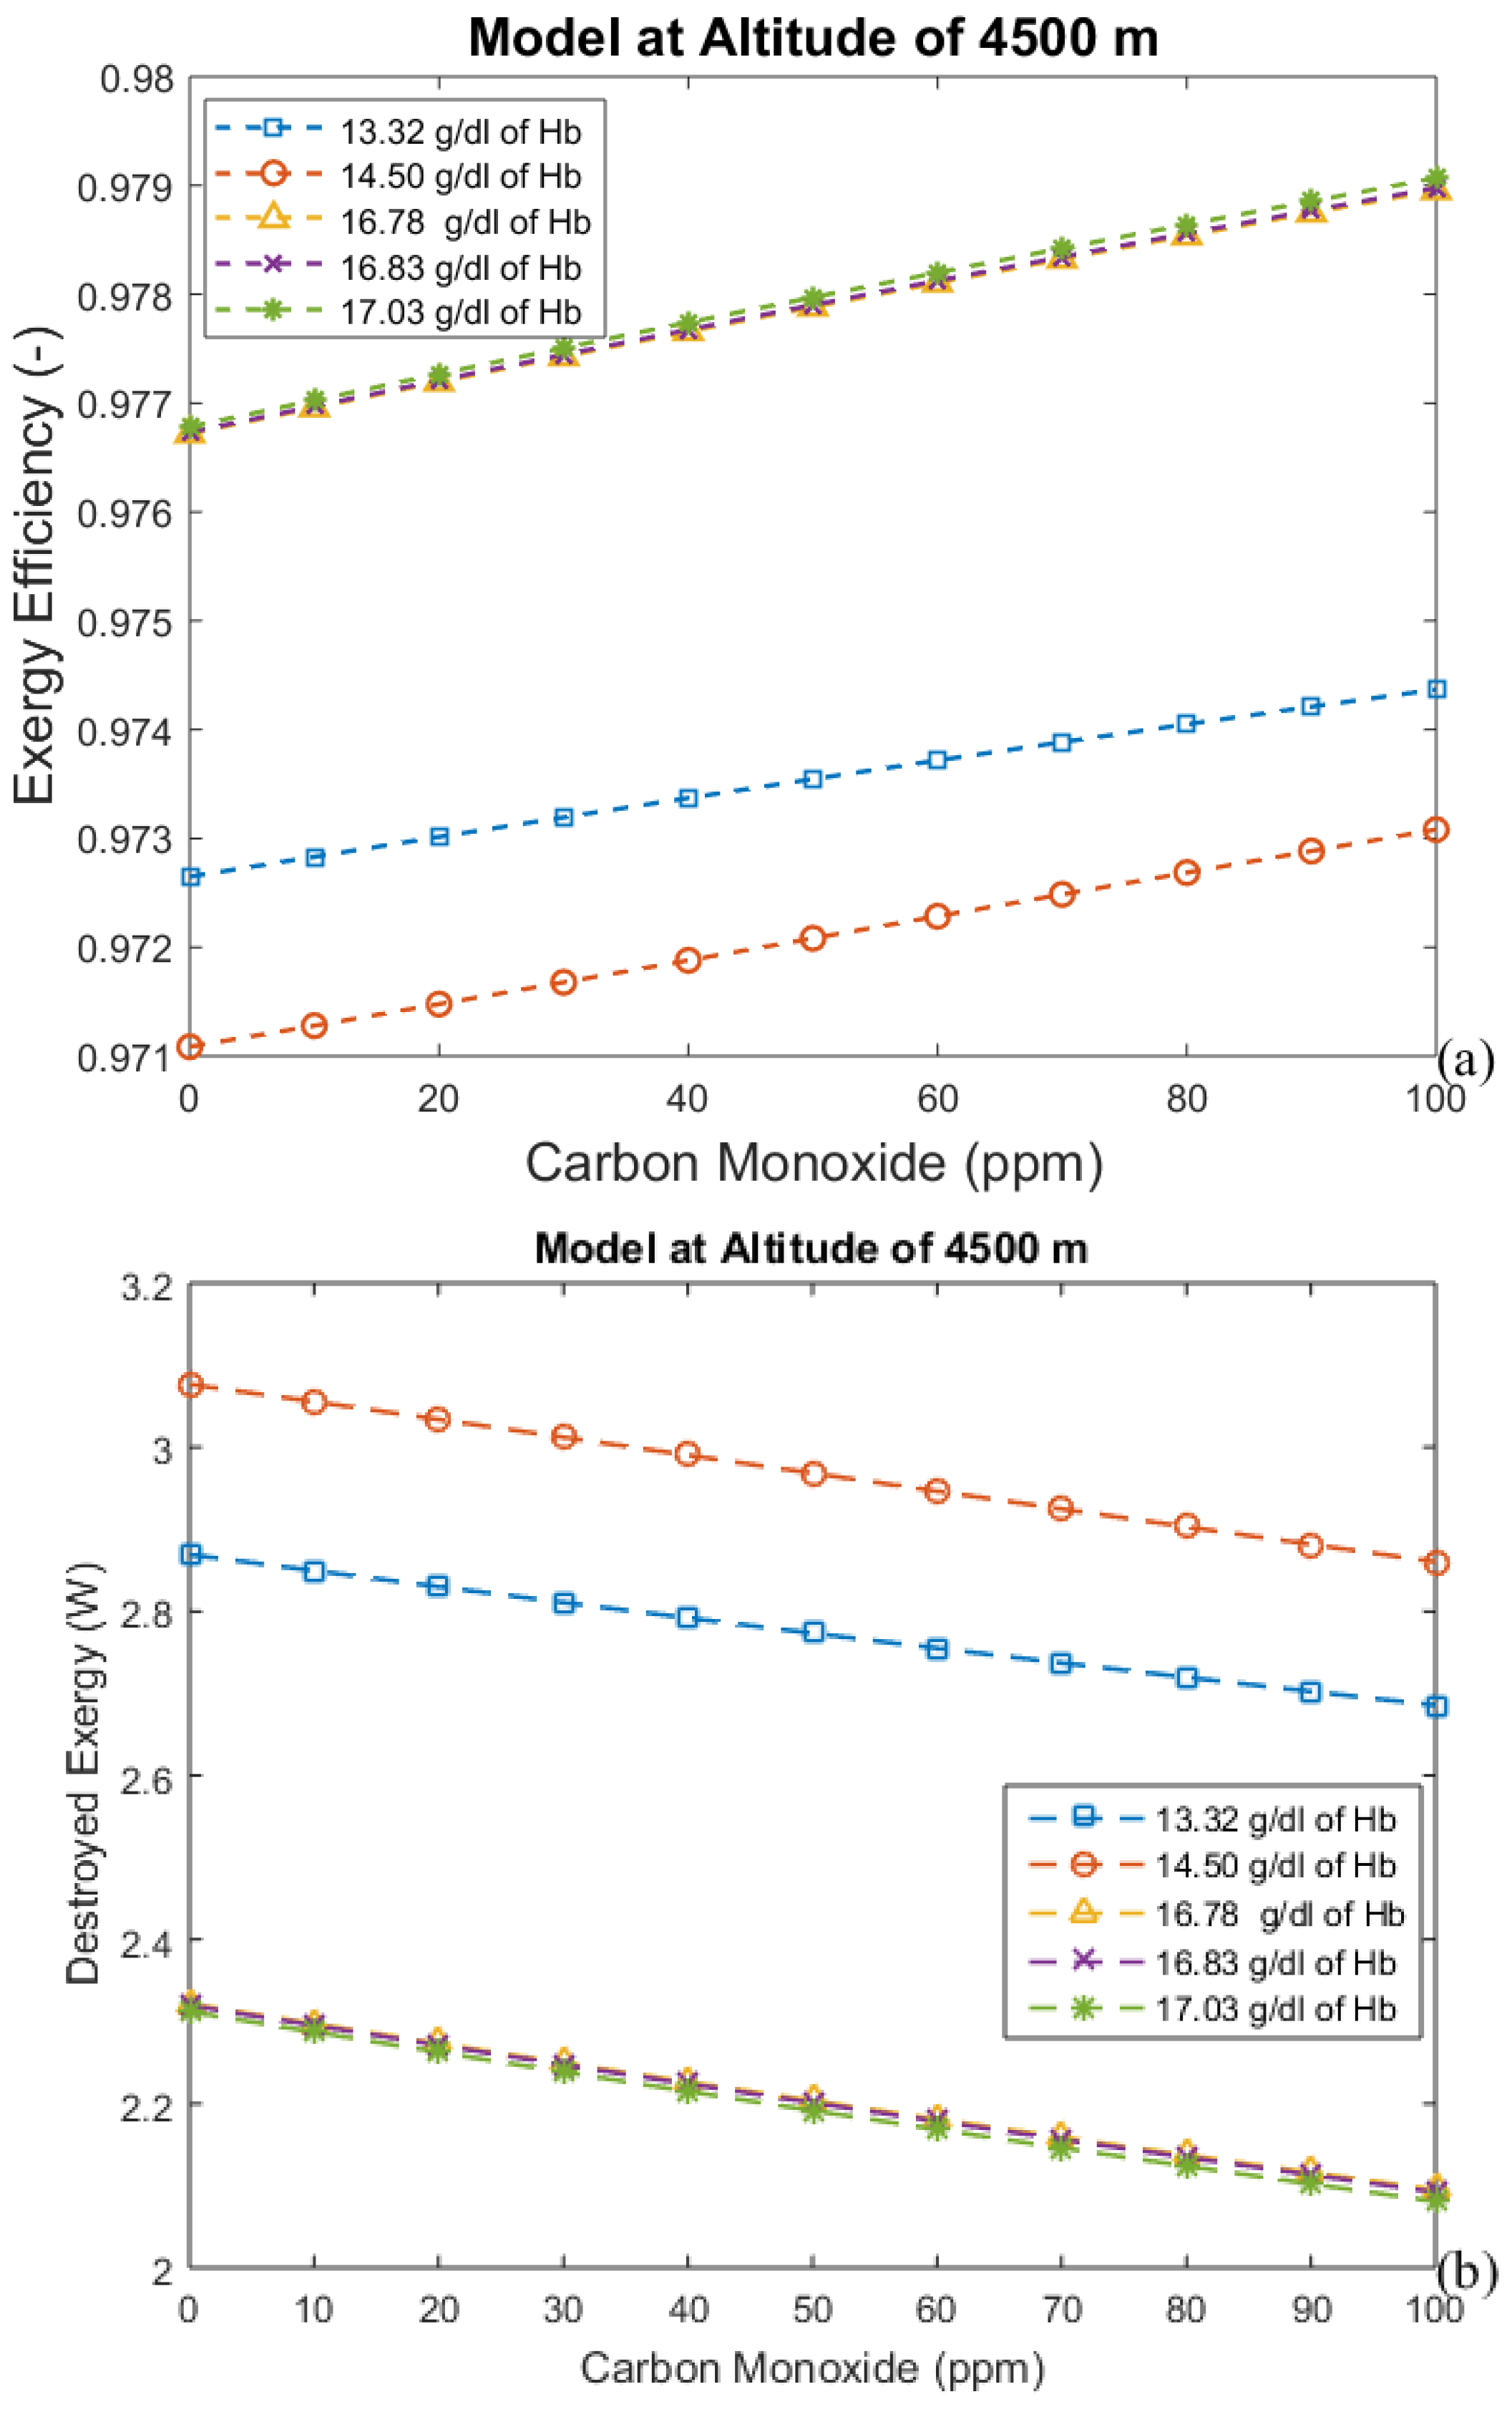
- For the second model, a significant reduction in the effects of CO poisoning can be seen, though it is responsible for a slight increase in the exergy destruction rate. In this model, as in the previous one, acclimatization (increased hemoglobin concentration and ventilation) has a positive effect on the respiratory system, reducing the exergy destruction rate.
- The third analysis gives results that agree with the results of the second one. So, it is possible to conclude that using these two new approaches will lead to a significant discovery in the analysis of the human body.
Author Contributions
Funding
Conflicts of Interest
Nomenclature
| A | altitude, m |
| Ar | area, m2 |
| b | specific exergy, J/kg |
| B | exergy, J |
| exergy rate and flow rate, W | |
| c | specific heat capacity, J/(kg K) |
| G | Gibbs free energy, J |
| g | specific Gibbs free energy, J/kg or J/kmol |
| H | enthalpy flow rate, W |
| K | equilibrium constant |
| M | metabolism, W |
| M | mass flow rate, kg/s |
| heat transfer rate, W | |
| P | pressure, Pa |
| Ri | gas constant of the molecule i, J/(kgK) |
| S | entropy, J/K |
| s | specific entropy J/(kgK) |
| T | temperature, °C or K |
| V | respiratory ventilation, L/min |
| T | time, s |
| performed power, W | |
| Greek symbols | |
| Δ | variation |
| σ | entropy production rate, W/K |
| η | efficiency |
| Subscripts and superscripts | |
| 0 | reference |
| a | air |
| art | arterial |
| body | body |
| bl | blood |
| CO | carbon monoxide |
| CO2 | carbon dioxide |
| D | destroyed |
| ex | expired |
| f | formation |
| g | gas |
| H2O | water |
| in | inflow |
| liq | liquid |
| lung | lung |
| M | metabolic |
| N2 | nitrogen |
| O2 | oxygen |
| out | outflow |
| resp | respiratory |
| ven | venous |
References
- Szargut, J.; Morris, D.R.; Steward, F.R. Exergy Analysis of Thermal, Chemical and Metallurgical Processes; Hemisphere Publishing Corp: New York, NY, USA, 1988. [Google Scholar]
- Mady, C.E.; Ferreira, M.S.; Yanagihara, J.I.; de Oliveira, S., Jr. Human body exergy analysis and the assessment of thermal comfort conditions. Int. J. Thermodyn. 2014, 17, 265–273. [Google Scholar] [CrossRef]
- Mady, C.E.; Albuquerque, C.; Fernandes, T.L.; Hernandez, A.J.; Saldiva, P.H.; Yanagihara, J.I.; de Oliveira, S., Jr. Exergy performance of human body under physical activities. Energy 2013, 62, 370–378. [Google Scholar] [CrossRef]
- Mady, C.E.; Henriques, I.B.; Oliveira-Junior, S. Exergy analysis of human body and lifespan: A first approach. In Proceedings of the 22th International Congress of Mechanical Engineering (COBEM 2013), Ribeirão Preto, Brazil, 3–7 November 2013. [Google Scholar]
- Wang, Z. Where has entropy gone: Theory of general system (II). arxiv 1996. quant-ph/9605018. [Google Scholar]
- Neto, C.A.; Pellegrini, L.F.; Ferreira, M.S.; de Oliveira, S., Jr.; Yanagihara, J.I. Exergy analysis of human respiration under physical activity. Int. J. Appl. Thermodyn. 2010, 13, 105–109. [Google Scholar]
- Mady, C.E.; Oliveira-Junior, S. Human Body Exergy Metabolism. Int. J. Thermodyn. 2013, 16, 73–80. [Google Scholar] [CrossRef]
- Mady, C.E.; Ferreira, M.S.; Yanagihara, J.I.; Saldiva, P.H.N.; Junior, S.O. Modeling the exergy behaviour of human body. Energy 2012, 45, 546–553. [Google Scholar] [CrossRef]
- Henriques, I.B.; Mady, C.E.; Neto, C.A.; Yanagihara, J.I.; Junior, S.O. The effect of altitude and intensity of physical activity on the exergy efficiency of respiratory system. Int. J. Thermodyn. 2014, 17, 265–273. [Google Scholar] [CrossRef]
- Mountcastle, V.B. Medical Physiology; The C.V. Mosby Company: Saint Louis, MO, USA, 1974. [Google Scholar]
- Albuquerque-Neto, C.; Yanagihara, J.I.; Turri, F. A carbon monoxide transport model of the human respiratory system applied to urban atmosphere exposure analysis. J. Braz. Soc. Mech. Sci. Eng. 2008, 30, 253–260. [Google Scholar] [CrossRef] [Green Version]
- Fritts, H.W.; Filler, J.; Fishman, A.P.; Cournand, A. The efficiency of ventilation during voluntary hyperpnea: Studies in normal subjects and in dyspneic patients with either chronic pulmonary emphysema or obesity. J. Clin. Investig. 1959, 38, 1339–1348. [Google Scholar] [CrossRef] [PubMed]
- Huang, S.Y.; Alexander, J.K.; Grover, R.F.; Maher, J.T.; McCullough, R.E.; McCullough, R.G.; Moore, L.G.; Weil, J.V.; Sampson, J.B.; Reeves, J.T. Increased metabolism contributes to increased resting ventilation at high altitude. Respir. Physiol. 1984, 57, 377–385. [Google Scholar] [CrossRef]
- Ainslie, P.N.; Lucas, S.J.; Burgess, K.R. Breathing and sleep at high altitude. Respir. Physiol. Neurobiol. 2013, 188, 233–256. [Google Scholar] [CrossRef] [PubMed]
- Schwarting, R.; Strayer, D. Patologia: Bases Clinicopatológicas da Medicina, 4th ed.; Guanabara Koogan: Rio de Janeiro, Brazil, 2006. (In Portuguese) [Google Scholar]
- De Nevers, N.; Seader, J.D. Lost work: A measure of thermodynamic efficiency. Energy 1980, 5, 757–769. [Google Scholar] [CrossRef]
- Alberty, R.A. Thermodynamics of Biochemical Reactions, 1st ed.; John Wiley & Sons, Inc.: Hoboken, NJ, USA, 2003. [Google Scholar]
- Wagman, D.D.; Evans, W.H.; Parker, V.B.; Schumm, R.H.; Halow, I. The NBS Tables of Chemical Thermodynamic Properties; National Bureau of Standards: Gaithersburg, MD, USA, 1982; Volume 11. [Google Scholar]
- Perrella, M.; Sabionedda, L.; Lamaja, M.; Rossi-Bernardi, L. The intermediate compounds between human hemoglobin and carbon monoxide at equilibrium and during approach to equilibrium. J. Biol. Chem. 1986, 261, 8391–8396. [Google Scholar] [PubMed]
- Wagman, D.D.; Evans, W.H.; Parker, V.B.; Schumm, R.H.; Halow, I. The NBS Tables of Chemical Thermodynamic Properties. Selected Values for Inorganic and C1 and C2 Organic Substances in SI Units. J. Phys. Chem. Ref. Data 1989, 18. [Google Scholar] [CrossRef]


| Equilibrium Constant | CO | O2 |
|---|---|---|
| 4.82 × 10⁵ | 1.96 × 10⁶ | |
| 1.61 × 10⁶ | 1.25 × 10⁶ | |
| 2.50 × 10⁸ | 2.68 × 10⁷ | |
| 4.64 × 10⁸ | 1.52 × 10⁹ |
| Gibbs Free Energy Variation | CO | O2 |
|---|---|---|
| −152.00 | −19.44 | |
| −306.95 | −37.78 | |
| −474.23 | −63.63 | |
| −643.12 | −99.38 |
| Altitude (m) | Atmospheric Pressure (kPa) |
|---|---|
| 0 | 101.3 |
| 1500 | 84.5 |
| 3000 | 70.1 |
| 4500 | 57.7 |
| Altitude (m) | Time (days) | Hemoglobin Concentration (g/dL) | Alveolar Ventilation (mL/min) |
|---|---|---|---|
| 0 | 0 | 14.5 (reference value) | 4212.0 |
| 0 | 2 | 14.5 | 4212.0 |
| 0 | 20 | 14.5 | 4212.0 |
| 0 | 60 | 14.5 | 4212.0 |
| 0 | 90 | 14.5 | 4212.0 |
| 0 | 0 | 17.03 | 4212.0 |
| 1500 | 0 | 14.5 | 5300.0 |
| 1500 | 2 | 14.17 | 5300.0 |
| 1500 | 20 | 15.66 | 5300.0 |
| 1500 | 60 | 15.66 | 5300.0 |
| 1500 | 90 | 15.66 | 5300.0 |
| 1500 | 0 | 17.03 | 5300.0 |
| 3000 | 0 | 14.5 | 5850.0 |
| 3000 | 2 | 13.82 | 6900.0 |
| 3000 | 20 | 16.28 | 7162.5 |
| 3000 | 60 | 16.33 | 7162.5 |
| 3000 | 90 | 16.53 | 7162.5 |
| 3000 | 0 | 17.03 | 7162.5 |
| 4500 | 0 | 14.5 | 6525.0 |
| 4500 | 2 | 13.32 | 7575.0 |
| 4500 | 20 | 16.78 | 9675.0 |
| 4500 | 60 | 16.83 | 9675.0 |
| 4500 | 90 | 17.03 | 9675.0 |
© 2018 by the authors. Licensee MDPI, Basel, Switzerland. This article is an open access article distributed under the terms and conditions of the Creative Commons Attribution (CC BY) license (http://creativecommons.org/licenses/by/4.0/).
Share and Cite
Cenzi, J.R.; Albuquerque, C.; Keutenedjian Mady, C.E. The Effect of Carbon Monoxide on the Exergy Behavior of the Lungs. Bioengineering 2018, 5, 108. https://doi.org/10.3390/bioengineering5040108
Cenzi JR, Albuquerque C, Keutenedjian Mady CE. The Effect of Carbon Monoxide on the Exergy Behavior of the Lungs. Bioengineering. 2018; 5(4):108. https://doi.org/10.3390/bioengineering5040108
Chicago/Turabian StyleCenzi, Juliana Rangel, Cyro Albuquerque, and Carlos Eduardo Keutenedjian Mady. 2018. "The Effect of Carbon Monoxide on the Exergy Behavior of the Lungs" Bioengineering 5, no. 4: 108. https://doi.org/10.3390/bioengineering5040108