
Feasibility of Wave Intensity Analysis from 4D Cardiovascular Magnetic Resonance Imaging Data
 ,
,
Abstract
:1. Introduction
2. Materials and Methods
2.1. Study Participants
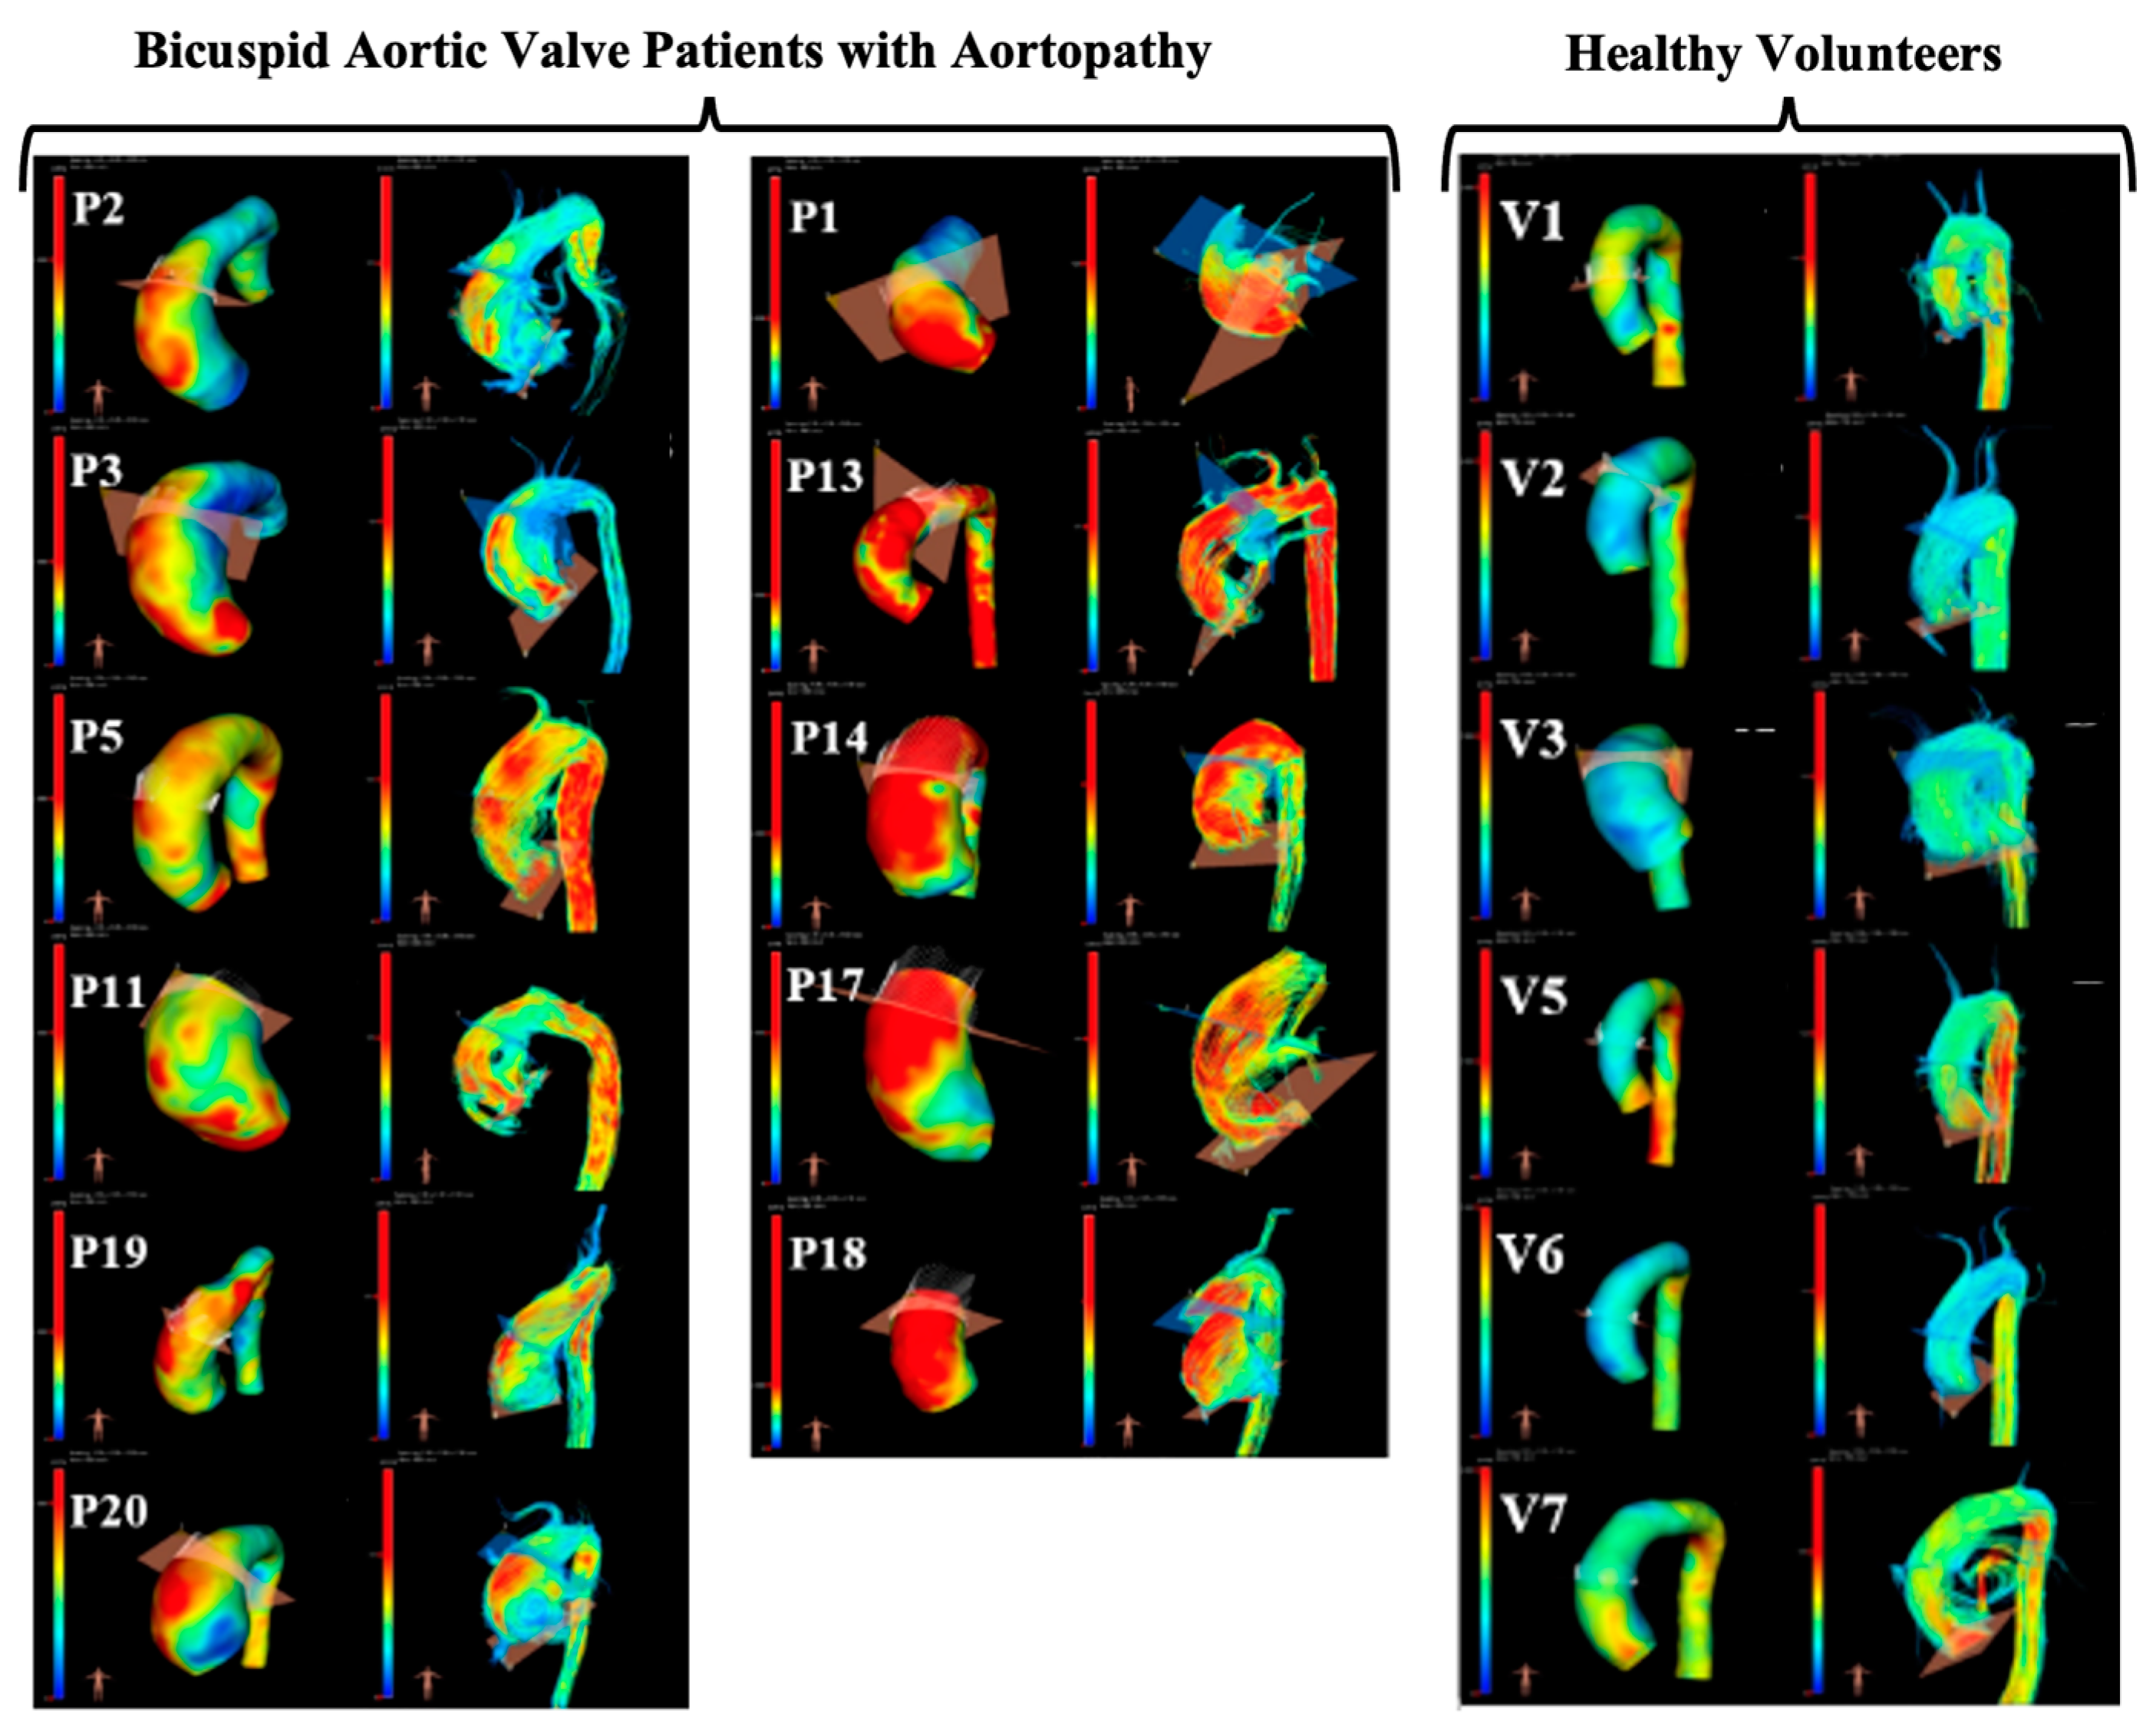
2.2. Image Acquisition and Segmentation
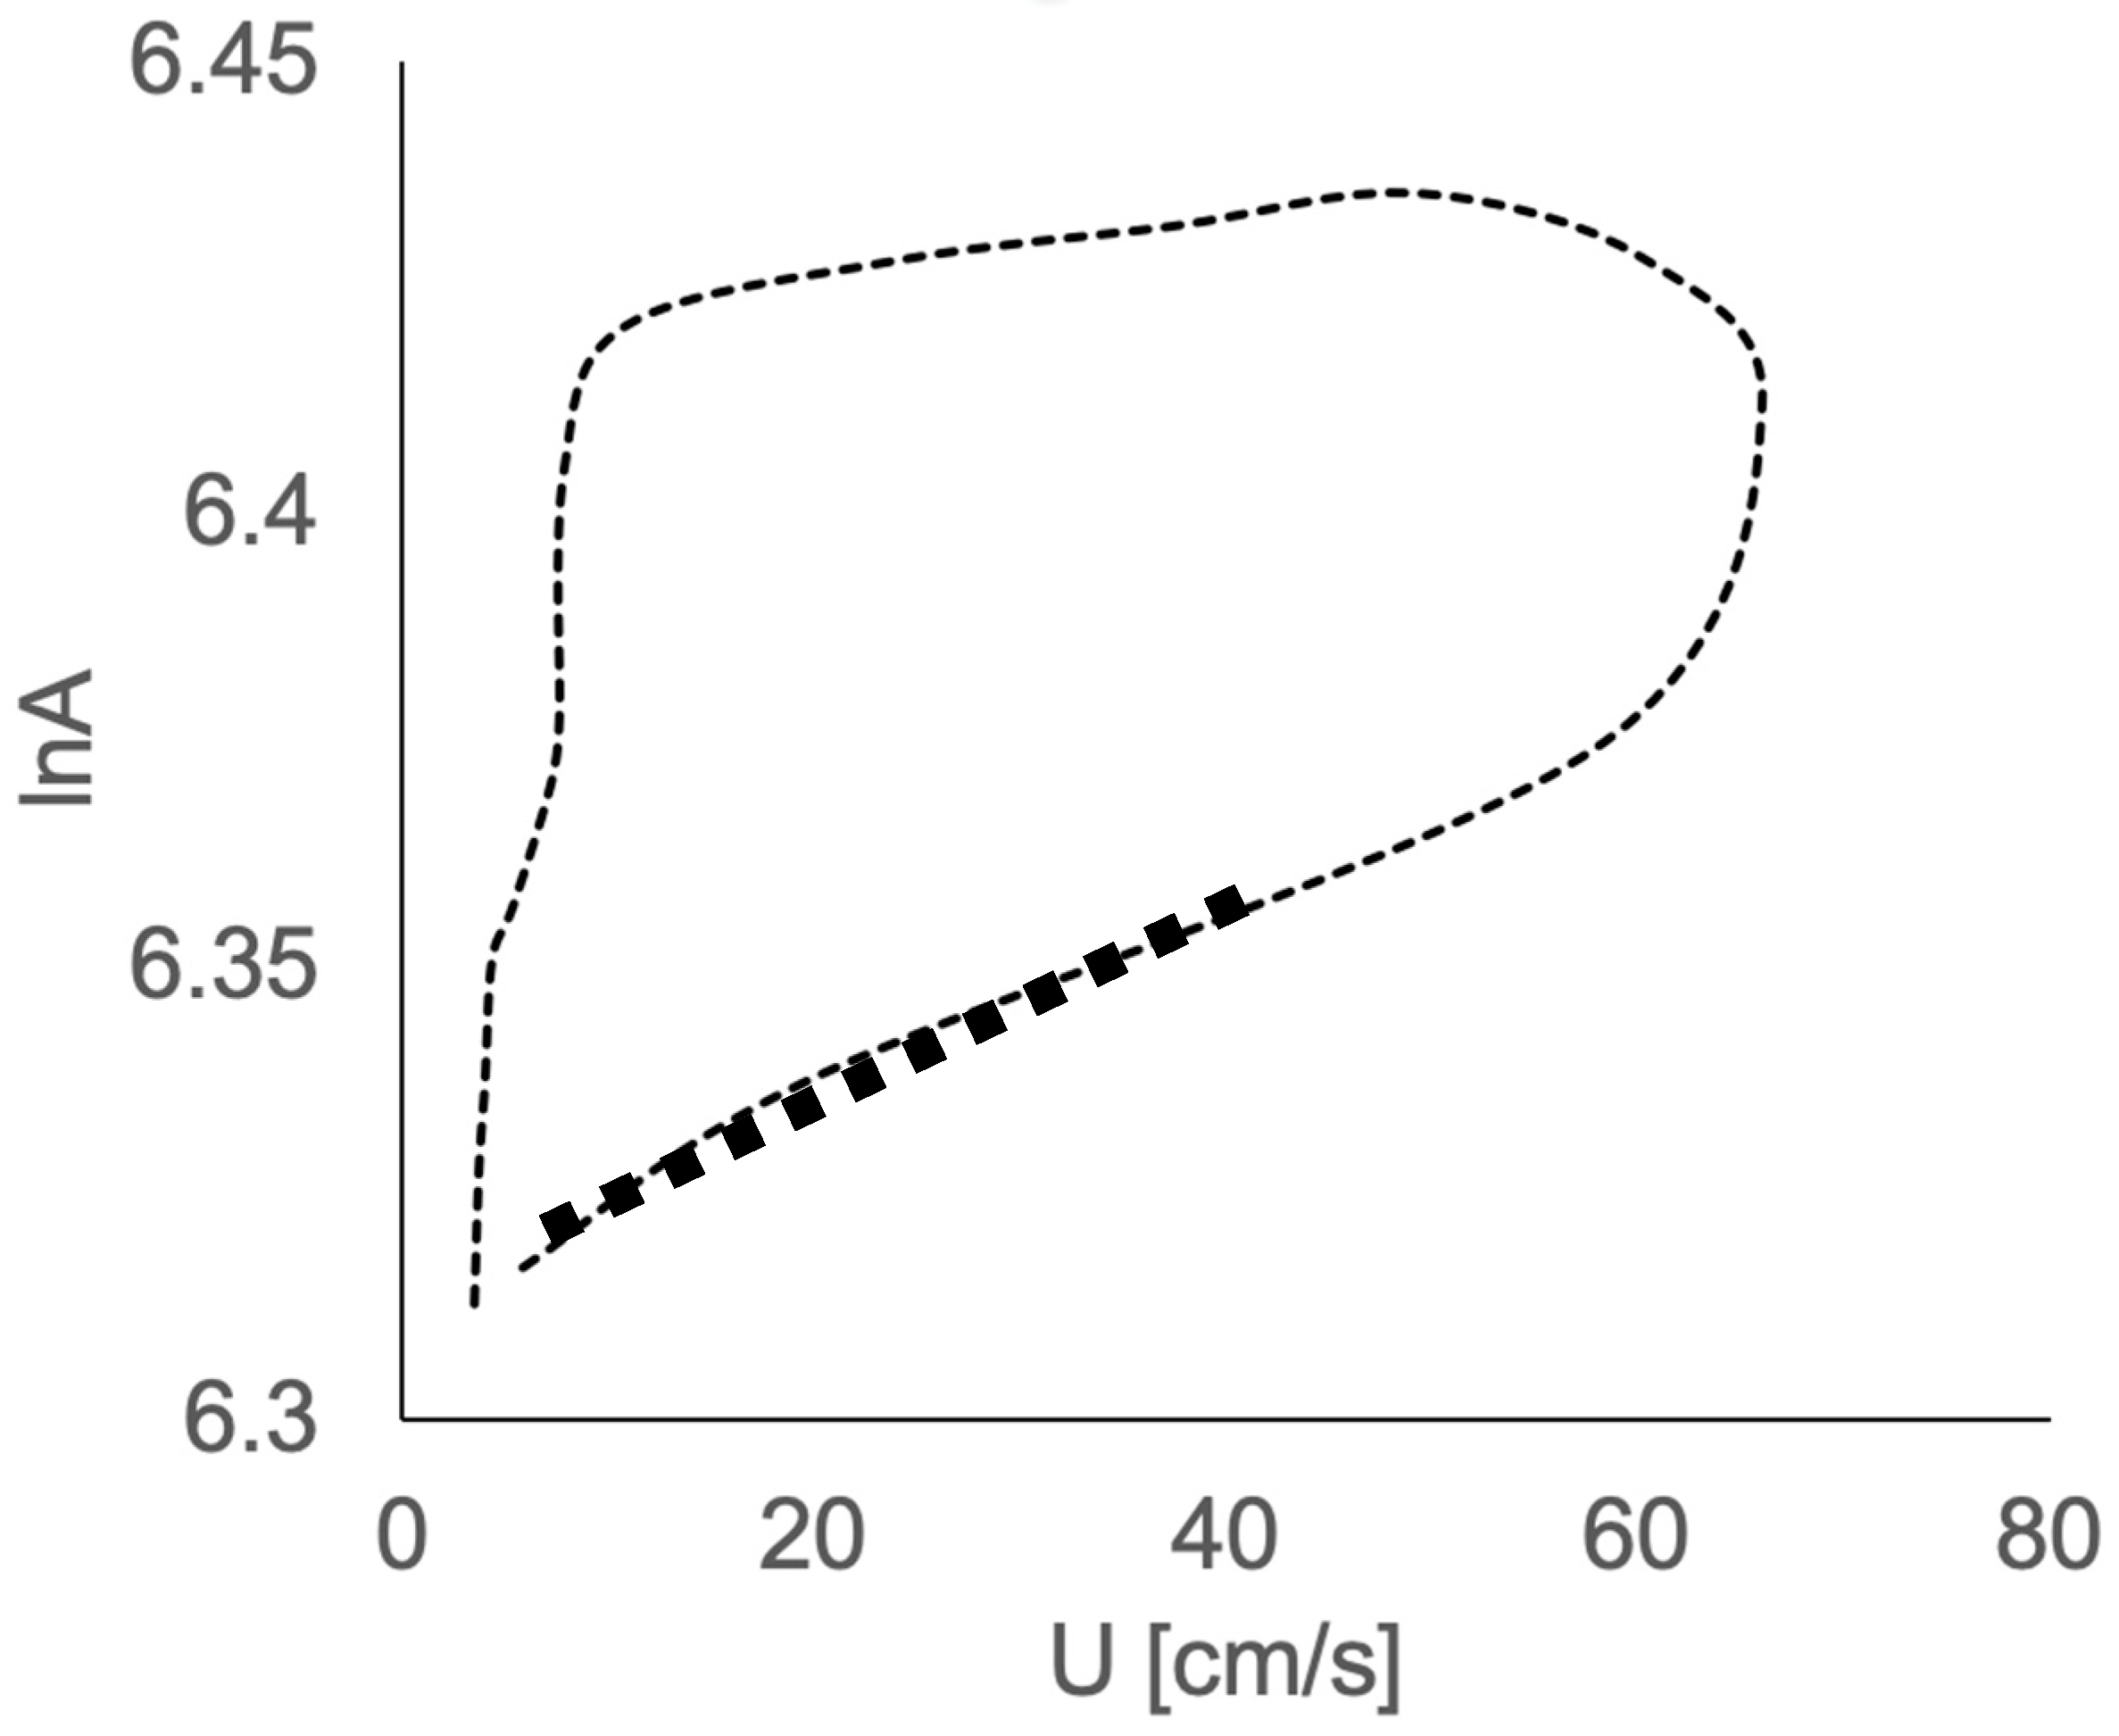
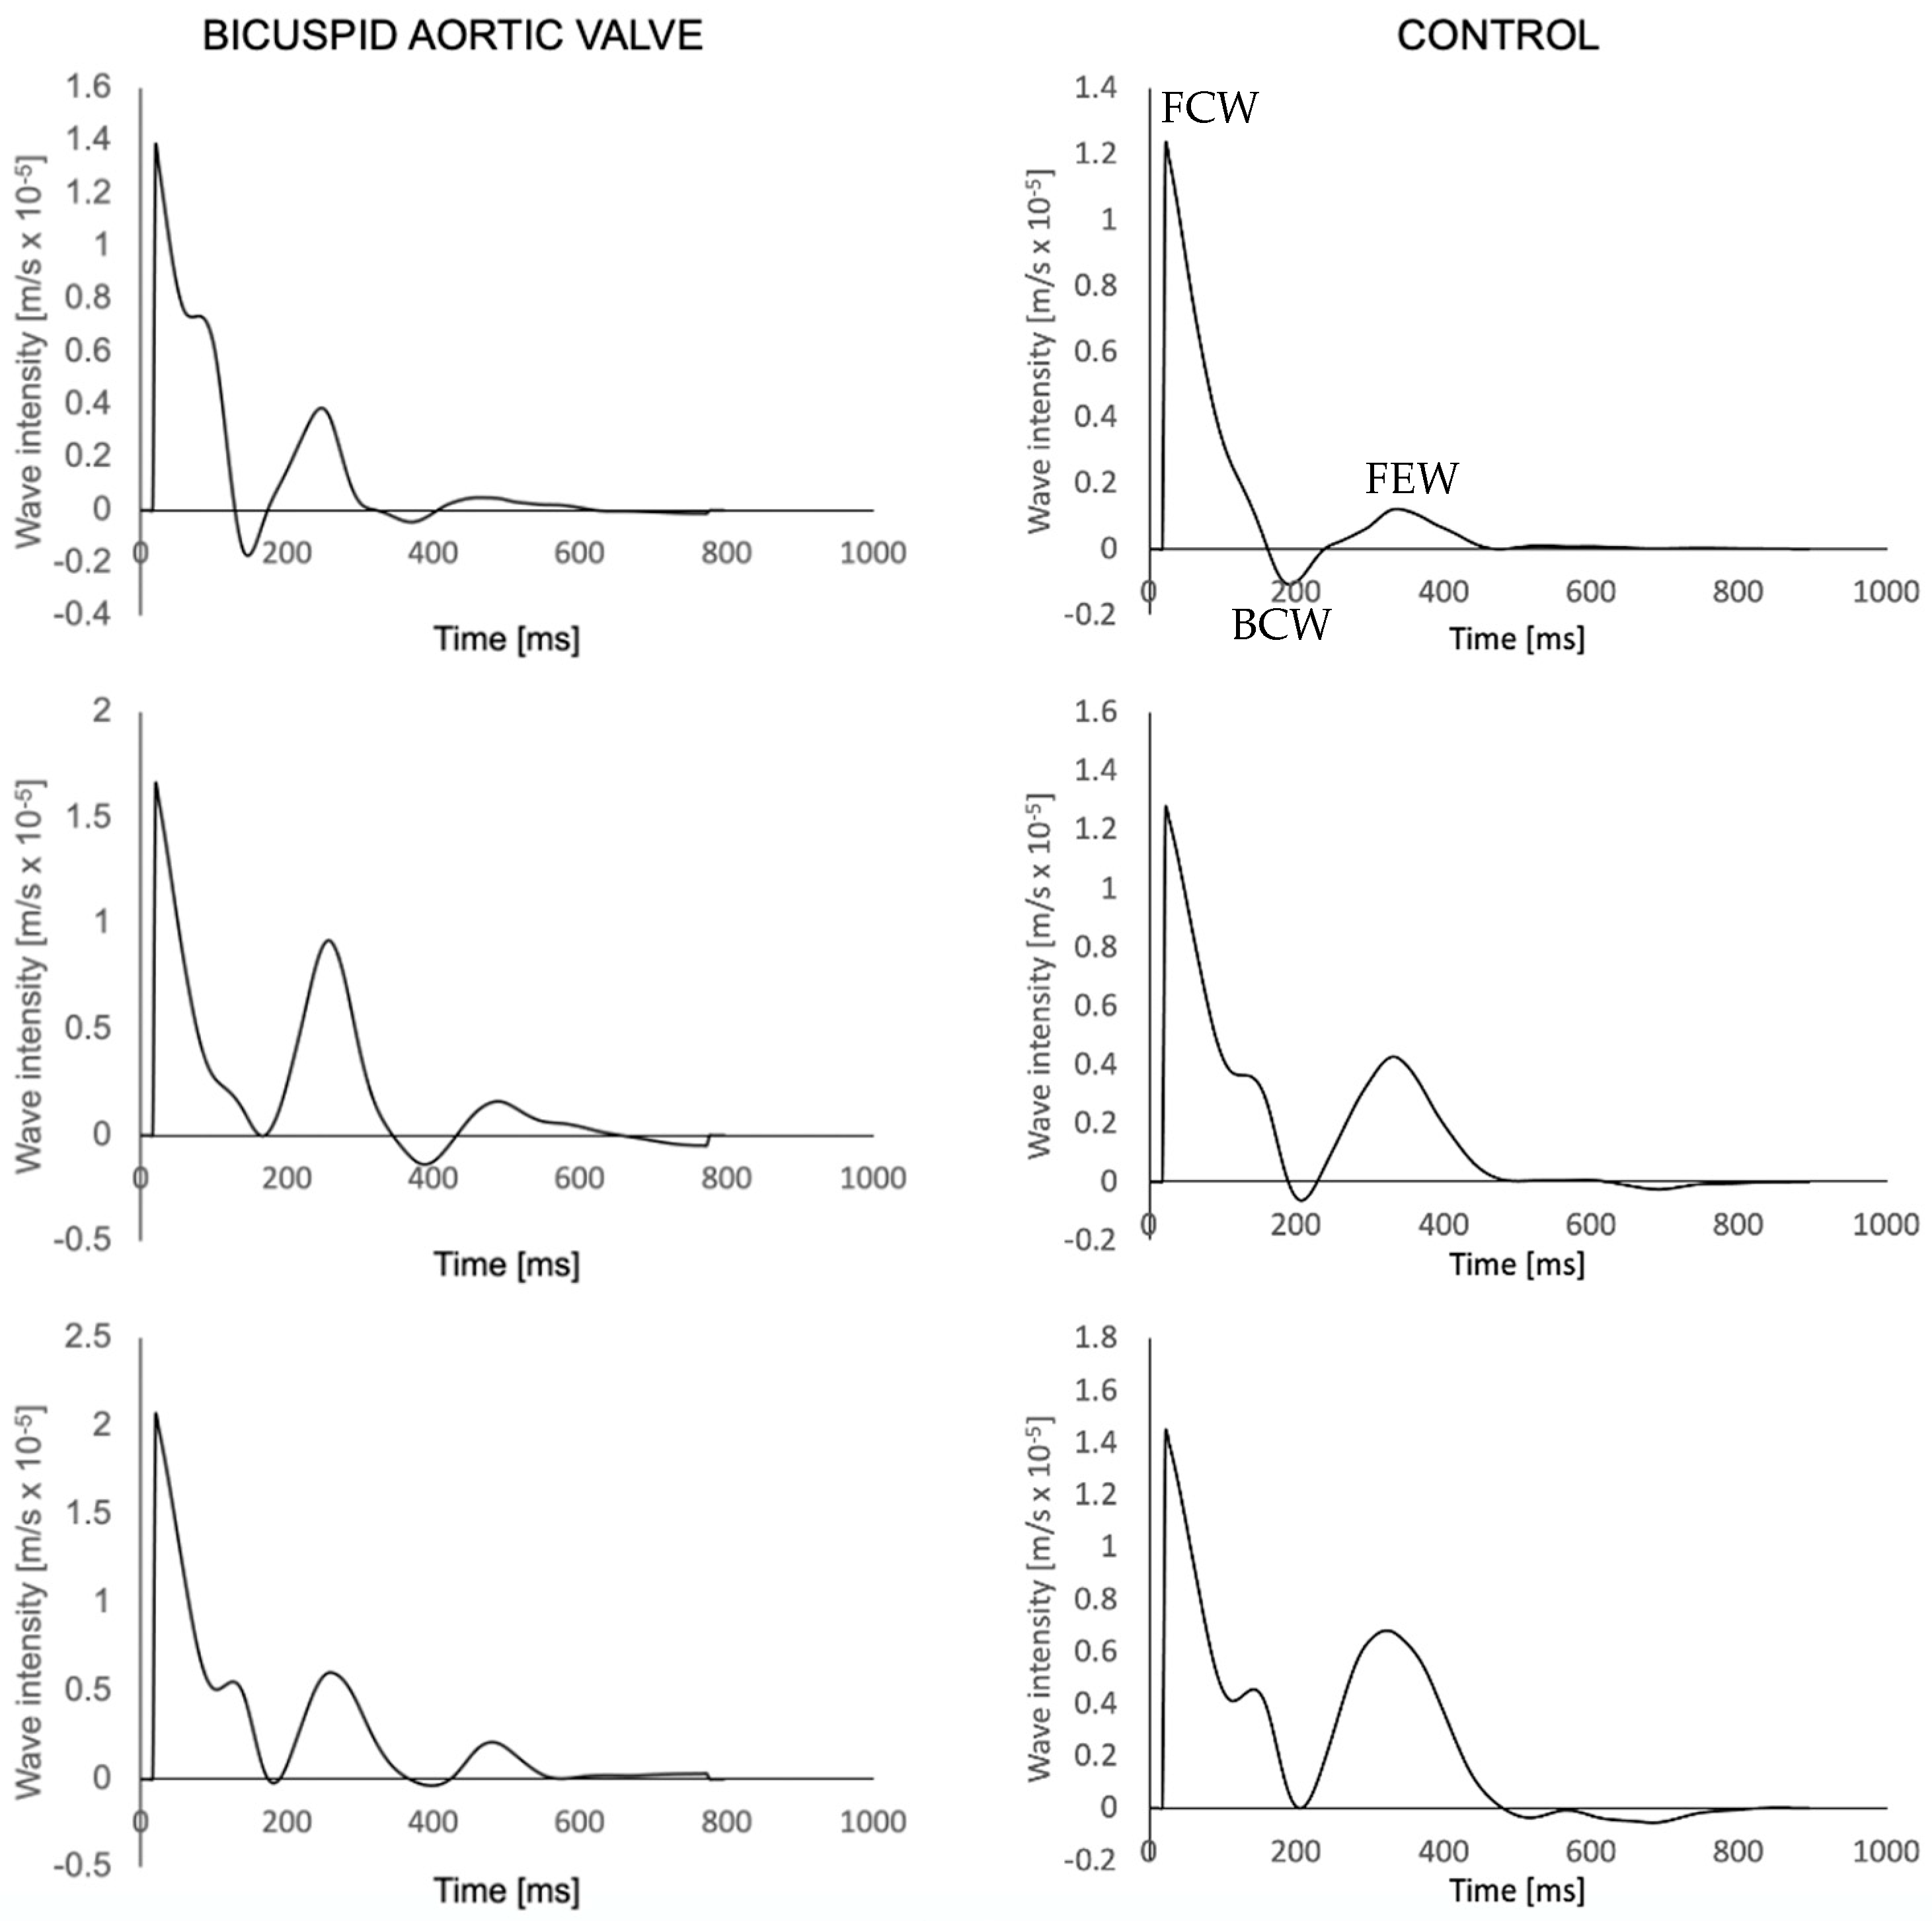
2.3. Wave Intensity Analysis
2.4. Statistical Analysis
3. Results
4. Discussion
5. Limitations
6. Conclusions
Author Contributions
Funding
Institutional Review Board Statement
Informed Consent Statement
Data Availability Statement
Conflicts of Interest
References
- van der Linde, D.; Konings, E.E.M.; Slager, M.A.; Witsenburg, M.; Helbing, W.A.; Takkenberg, J.J.M.; Roos-Hesselink, J.W. Birth prevalence of congenital heart disease worldwide: A systematic review and meta-analysis. J. Am. Coll. Cardiol. 2011, 58, 2241–2247. [Google Scholar] [CrossRef] [PubMed]
- Hope, M.D.; Hope, T.A.; Meadows, A.K.; Ordovas, K.G.; Urbania, T.H.; Alley, M.T.; Higgins, C.B. Bicuspid aortic valve: Four-dimensional MR evaluation of ascending aortic systolic flow patterns. Radiology 2010, 255, 53–61. [Google Scholar] [CrossRef] [PubMed]
- Atkins, S.K.; Sucosky, P. Etiology of bicuspid aortic valve disease: Focus on hemodynamics. World J. Cardiol. 2014, 6, 1227–1233. [Google Scholar] [CrossRef]
- Lawley, C.M.; Broadhouse, K.M.; Callaghan, F.M.; Winlaw, D.S.; Figtree, G.A.; Grieve, S.M. 4D flow magnetic resonance imaging: Role in pediatric congenital heart disease. Asian Cardiovasc. Thorac. Ann. 2017, 26, 28–37. [Google Scholar] [CrossRef]
- Prakash, A.; Powell, A.J.; Geva, T. Multimodality noninvasive imaging for assessment of congenital heart disease. Circ. Cardiovasc. Imaging 2010, 3, 112–125. [Google Scholar] [CrossRef]
- Mooij, C.F.; de Wit, C.J.; Graham, D.A.; Powell, A.J.; Geva, T. Reproducibility of MRI measurements of right ventricular size and function in patients with normal and dilated ventricles. J. Magn. Reson. Imaging 2008, 28, 67–73. [Google Scholar] [CrossRef] [PubMed]
- Nayak, K.S.; Nielsen, J.-F.; Bernstein, M.A.; Markl, M.; Gatehouse, P.D.; Botnar, R.M.; Saloner, D.; Lorenz, C.; Wen, H.; Hu, B.S.; et al. Cardiovascular magnetic resonance phase contrast imaging. J. Cardiovasc. Magn. Reson. 2015, 17, 71. [Google Scholar] [CrossRef]
- Chowdhary, A.; Garg, P.; Das, A.; Nazir, M.S.; Plein, S. Cardiovascular magnetic resonance imaging: Emerging techniques and applications. Heart 2021, 107, 697–704. [Google Scholar] [CrossRef]
- Rizk, J. 4D flow MRI applications in congenital heart disease. Eur. Radiol. 2021, 31, 1160–1174. [Google Scholar] [CrossRef]
- Dyverfeldt, P.; Bissell, M.; Barker, A.J.; Bolger, A.F.; Carlhäll, C.-J.; Ebbers, T.; Francios, C.J.; Frydrychowicz, A.; Geiger, J.; Giese, D.; et al. 4D flow cardiovascular magnetic resonance consensus statement. J. Cardiovasc. Magn. Reson. 2015, 17, 72. [Google Scholar] [CrossRef]
- Oyama-Manabe, N.; Aikawa, T.; Tsuneta, S.; Manabe, O. Clinical Applications of 4D Flow MR Imaging in Aortic Valvular and Congenital Heart Disease. Magn. Reson. Med. Sci. 2022, 21, 319–326. [Google Scholar] [CrossRef] [PubMed]
- Gabbour, M.; Schnell, S.; Jarvis, K.; Robinson, J.D.; Markl, M.; Rigsby, C.K. 4-D flow magnetic resonance imaging: Blood flow quantification compared to 2-D phase-contrast magnetic resonance imaging and Doppler echocardiography. Pediatr. Radiol. 2015, 45, 804–813. [Google Scholar] [CrossRef] [PubMed]
- Nordmeyer, S.; Riesenkampff, E.; Crelier, G.; Khasheei, A.; Schnackenburg, B.; Berger, F.; Kuehne, T. Flow-sensitive four-dimensional cine magnetic resonance imaging for offline blood flow quantification in multiple vessels: A validation study. J. Magn. Reson. Imaging 2010, 32, 677–683. [Google Scholar] [CrossRef] [PubMed]
- Hsiao, A.; Tariq, U.; Alley, M.T.; Lustig, M.; Vasanawala, S.S. Inlet and outlet valve flow and regurgitant volume may be directly and reliably quantified with accelerated, volumetric phase-contrast MRI. J. Magn. Reson. Imaging 2015, 41, 376–385. [Google Scholar] [CrossRef]
- van der Hulst, A.E.; Westenberg, J.J.M.; Kroft, L.J.M.; Bax, J.J.; Blom, N.A.; de Roos, A.; Roest, A.A.W. Tetralogy of fallot: 3D velocity-encoded MR imaging for evaluation of right ventricular valve flow and diastolic function in patients after correction. Radiology 2010, 256, 724–734. [Google Scholar] [CrossRef]
- Jarvis, K.; Vonder, M.; Barker, A.J.; Schnell, S.; Rose, M.; Carr, J.; Robinson, J.D.; Markl, M.; Rigsby, C.K. Hemodynamic evaluation in patients with transposition of the great arteries after the arterial switch operation: 4D flow and 2D phase contrast cardiovascular magnetic resonance compared with Doppler echocardiography. J. Cardiovasc. Magn. Reson. 2016, 18, 59. [Google Scholar] [CrossRef]
- van Wijk, W.H.S.; Breur, J.M.P.J.; Westenberg, J.J.M.; Driessen, M.M.P.; Meijboom, F.J.; Driesen, B.; de Baat, E.C.; Doevendans, P.A.F.M.; Leiner, T.; Grotenhuis, H.B. Validation of aortic valve 4D flow analysis and myocardial deformation by cardiovascular magnetic resonance in patients after the arterial switch operation. J. Cardiovasc. Magn. Reson. 2019, 21, 20. [Google Scholar] [CrossRef]
- She, H.L.; Roest, A.A.; Calkoen, E.E.; van den Boogaard, P.J.; van der Geest, R.J.; Hazekamp, M.G.; de Roos, A.; Westenberg, J.J. Comparative Evaluation of Flow Quantification across the Atrioventricular Valve in Patients with Functional Univentricular Heart after Fontan’s Surgery and Healthy Controls: Measurement by 4D Flow Magnetic Resonance Imaging and Streamline Visualization. Congenit. Heart Dis. 2017, 12, 40–48. [Google Scholar] [CrossRef]
- Rose, M.J.; Jarvis, K.; Chowdhary, V.; Barker, A.J.; Allen, B.D.; Robinson, J.D.; Markl, M.; Rigsby, C.K.; Schnell, S. Efficient method for volumetric assessment of peak blood flow velocity using 4D flow MRI. J. Magn. Reson. Imaging 2016, 44, 1673–1682. [Google Scholar] [CrossRef]
- Parker, K.H.; Jones, C.J.; Dawson, J.R.; Gibson, D.G. What stops the flow of blood from the heart? Heart Vessels 1988, 4, 241–245. [Google Scholar] [CrossRef]
- Parker, K.H. An introduction to wave intensity analysis. Med. Biol. Eng. Comput. 2009, 47, 175–188. [Google Scholar] [CrossRef] [PubMed]
- Biglino, G.; Steeden, J.A.; Baker, C.; Schievano, S.; Taylor, A.M.; Parker, K.H.; Muthurangu, V. A non-invasive clinical application of wave intensity analysis based on ultrahigh temporal resolution phase-contrast cardiovascular magnetic resonance. J. Cardiovasc. Magn. Reson. Off. J. Soc. Cardiovasc. Magn. Reson. 2012, 14, 57. [Google Scholar] [CrossRef] [PubMed]
- Fraser, S.D.; Blakeman, T. Chronic kidney disease: Identification and management in primary care. Pragmatic Obs. Res. 2016, 7, 21–32. [Google Scholar] [CrossRef] [PubMed]
- Das, A.; Kelly, C.; Ben-Arzi, H.; van der Geest, R.J.; Plein, S.; Dall'Armellina, E. Acute intra-cavity 4D flow cardiovascular magnetic resonance predicts long-term adverse remodelling following ST-elevation myocardial infarction. J. Cardiovasc. Magn. Reson. Off. J. Soc. Cardiovasc. Magn. Reson. 2022, 24, 64. [Google Scholar] [CrossRef]
- Zhang, G.; Zhang, S.; Qin, Y.; Fang, J.; Tang, X.; Li, L.; Zhou, Y.; Wu, D.; Yan, S.; Liu, W.V.; et al. Differences in Wall Shear Stress Between High-Risk and Low-Risk Plaques in Patients with Moderate Carotid Artery Stenosis: A 4D Flow MRI Study. Front. Neurosci. 2021, 15, 678358. [Google Scholar] [CrossRef]
- Gupta, A.N.; Avery, R.; Soulat, G.; Allen, B.D.; Collins, J.D.; Choudhury, L.; Bonow, R.O.; Carr, J.; Markl, M.; Elbaz, M.S.M. Direct mitral regurgitation quantification in hypertrophic cardiomyopathy using 4D flow CMR jet tracking: Evaluation in comparison to conventional CMR. J. Cardiovasc. Magn. Reson. 2021, 23, 138. [Google Scholar] [CrossRef]
- Hudani, A.; Ihsan Ali, S.; Patton, D.; Myers, K.A.; Fine, N.M.; White, J.A.; Greenway, S.; Garcia, J. 4D-Flow MRI Characterization of Pulmonary Flow in Repaired Tetralogy of Fallot. Appl. Sci. 2023, 13, 2810. [Google Scholar] [CrossRef]
- Khir, A.W.; O’Brien, A.; Gibbs, J.S.; Parker, K.H. Determination of wave speed and wave separation in the arteries. J. Biomech. 2001, 34, 1145–1155. [Google Scholar] [CrossRef]
- Li, Y.; Borlotti, A.; Parker, K.H.; Khir, A.W. Variation of wave speed determined by the PU-loop with proximity to a reflection site. In Proceedings of the 2011 Annual International Conference of the IEEE Engineering in Medicine and Biology Society, Boston, MA, USA, 30 August–3 September 2011; IEEE: New York, NY, USA, 2011; pp. 199–202. [Google Scholar]
- Rahman, O.; Scott, M.; Bollache, E.; Suwa, K.; Collins, J.; Carr, J.; Fedak, P.; McCarthy, P.; Malaisrie, C.; Barker, A.J.; et al. Interval changes in aortic peak velocity and wall shear stress in patients with bicuspid aortic valve disease. Int. J. Cardiovasc. Imaging 2019, 35, 1925–1934. [Google Scholar] [CrossRef]
- Mathieu, P.; Bossé, Y.; Huggins, G.S.; Della Corte, A.; Pibarot, P.; Michelena, H.I.; Limongelli, G.; Boulanger, M.C.; Evangelista, A.; Bédard, E.; et al. The pathology and pathobiology of bicuspid aortic valve: State of the art and novel research perspectives. J. Pathol. Clin. Res. 2015, 1, 195–206. [Google Scholar] [CrossRef]
- Garcia, J.; Beckie, K.; Hassanabad, A.F.; Sojoudi, A.; White, J.A. Aortic and mitral flow quantification using dynamic valve tracking and machine learning: Prospective study assessing static and dynamic plane repeatability, variability and agreement. JRSM Cardiovasc. Dis. 2018, 10, 2048004021999900. [Google Scholar] [CrossRef]
- Bissell, M.M.; Hess, A.T.; Biasiolli, L.; Glaze, S.J.; Loudon, M.; Pitcher, A.; Davis, A.; Prendergast, B.; Markl, M.; Barker, A.J.; et al. Aortic dilation in bicuspid aortic valve disease: Flow pattern is a major contributor and differs with valve fusion type. Circ. Cardiovasc. Imaging 2013, 6, 499–507. [Google Scholar] [CrossRef]
- Ohyama, Y.; Ambale-Venkatesh, B.; Noda, C.; Kim, J.Y.; Tanami, Y.; Teixido-Tura, G.; Chugh, A.R.; Redheuil, A.; Liu, C.Y.; Wu, C.O.; et al. Aortic Arch Pulse Wave Velocity Assessed by Magnetic Resonance Imaging as a Predictor of Incident Cardiovascular Events: The MESA (Multi-Ethnic Study of Atherosclerosis). Hypertension 2017, 70, 524–530. [Google Scholar] [CrossRef]
- Devos, D.G.; Rietzschel, E.; Heyse, C.; Vandemaele, P.; Van Bortel, L.; Babin, D.; Segers, P.; Westenberg, J.M.; Achten, R. MR pulse wave velocity increases with age faster in the thoracic aorta than in the abdominal aorta. J. Magn. Reson. Imaging 2015, 41, 765–772. [Google Scholar] [CrossRef]
- Voges, I.; Jerosch-Herold, M.; Hedderich, J.; Pardun, E.; Hart, C.; Gabbert, D.D.; Hansen, J.H.; Petko, C.; Kramer, H.H.; Rickers, C. Normal values of aortic dimensions, distensibility, and pulse wave velocity in children and young adults: A cross-sectional study. J. Cardiovasc. Magn. Reson. 2012, 14, 77. [Google Scholar] [CrossRef]
- Milano, E.G.; Neumann, S.; Sophocleous, F.; Pontecorboli, G.; Curtis, S.L.; Bedair, R.; Caputo, M.; Luciani, G.B.; Bucciarelli-Ducci, C.; Biglino, G. Wave Reflection and Ventriculo-Arterial Coupling in Bicuspid Aortic Valve Patients with Repaired Aortic Coarctation. Front. Pediatr. 2021, 9, 770754. [Google Scholar] [CrossRef]
- Nistri, S.; Grande-Allen, J.; Noale, M.; Basso, C.; Siviero, P.; Maggi, S.; Crepaldi, G.; Thiene, G. Aortic elasticity and size in bicuspid aortic valve syndrome. Eur. Heart J. 2008, 29, 472–479. [Google Scholar] [CrossRef]
- Schaefer, B.M.; Lewin, M.B.; Stout, K.K.; Byers, P.H.; Otto, C.M. Usefulness of bicuspid aortic valve phenotype to predict elastic properties of the ascending aorta. Am. J. Cardiol. 2007, 99, 686–690. [Google Scholar] [CrossRef]
- Johnson, E.M.I.; Scott, M.B.; Jarvis, K.; Allen, B.; Carr, J.; Malaisrie, S.C.; McCarthy, P.; Mehta, C.; Fedak, P.W.M.; Barker, A.J.; et al. Global Aortic Pulse Wave Velocity is Unchanged in Bicuspid Aortopathy with Normal Valve Function but Elevated in Patients with Aortic Valve Stenosis: Insights From a 4D Flow MRI Study of 597 Subjects. J. Magn. Reson. Imaging 2022, 57, 126–136. [Google Scholar] [CrossRef]
- Singh, A.; Horsfield, M.A.; Bekele, S.; Greenwood, J.P.; Dawson, D.K.; Berry, C.; Hogrefe, K.; Kelly, D.J.; Houston, J.G.; Guntur Ramkumar, P.; et al. Aortic stiffness in aortic stenosis assessed by cardiovascular MRI: A comparison between bicuspid and tricuspid valves. Eur. Radiol. 2019, 29, 2340–2349. [Google Scholar] [CrossRef]
- Yap, S.-C.; Nemes, A.; Meijboom, F.J.; Galema, T.W.; Geleijnse, M.L.; ten Cate, F.J.; Simoons, M.L.; Roos-Hesselink, J.W. Abnormal aortic elastic properties in adults with congenital valvular aortic stenosis. Int. J. Cardiol. 2008, 128, 336–341. [Google Scholar] [CrossRef] [PubMed]
- Grotenhuis, H.B.; Ottenkamp, J.; Westenberg, J.J.M.; Bax, J.J.; Kroft, L.J.M.; de Roos, A. Reduced aortic elasticity and dilatation are associated with aortic regurgitation and left ventricular hypertrophy in nonstenotic bicuspid aortic valve patients. J. Am. Coll. Cardiol. 2007, 49, 1660–1665. [Google Scholar] [CrossRef] [PubMed]
- Sophocleous, F.; Biffi, B.; Milano, E.G.; Bruse, J.; Caputo, M.; Rajakaruna, C.; Schievano, S.; Emanueli, C.; Bucciarelli-Ducci, C.; Biglino, G. Aortic morphological variability in patients with bicuspid aortic valve and aortic coarctation. Eur. J. Cardio-Thorac. Surg. 2019, 55, 704–713. [Google Scholar] [CrossRef]
- Paraskevas, K.I.; Bessias, N.; Psathas, C.; Akridas, K.; Dragios, T.; Nikitas, G.; Andrikopoulos, V.; Mikhailidis, D.P.; Kyriakides, Z.S. Evaluation of aortic stiffness (aortic pulse-wave velocity) before and after elective abdominal aortic aneurysm repair procedures: A pilot study. Open Cardiovasc. Med. J. 2009, 3, 173–175. [Google Scholar] [CrossRef]
- Iwahashi, T.; Obitsu, Y.; Koizumi, N.; Shiraishi, Y.; Shigematsu, H. Clinical comparison of two different types of bifurcated graft for postoperative baPWV and ABI. Int. Angiol. 2009, 28, 232–237. [Google Scholar]
- Damughatla, A.R.; Raterman, B.; Sharkey-Toppen, T.; Jin, N.; Simonetti, O.P.; White, R.D.; Kolipaka, A. Quantification of aortic stiffness using MR elastography and its comparison to MRI-based pulse wave velocity. J. Magn. Reson. Imaging 2015, 41, 44–51. [Google Scholar] [CrossRef]
- Rogers, W.J.; Hu, Y.L.; Coast, D.; Vido, D.A.; Kramer, C.M.; Pyeritz, R.E.; Reichek, N. Age-associated changes in regional aortic pulse wave velocity. J. Am. Coll. Cardiol. 2001, 38, 1123–1129. [Google Scholar] [CrossRef]
- Taviani, V.; Hickson, S.S.; Hardy, C.J.; McEniery, C.M.; Patterson, A.J.; Gillard, J.H.; Wilkinson, I.B.; Graves, M.J. Age-related changes of regional pulse wave velocity in the descending aorta using Fourier velocity encoded M-mode. Magn. Reson. Med. 2011, 65, 261–268. [Google Scholar] [CrossRef]
- Alvarez, A.; Martinez, V.; Pizarro, G.; Recio, M.; Cabrera, J.Á. Clinical use of 4D flow MRI for quantification of aortic regurgitation. Open Heart 2020, 7, e001158. [Google Scholar] [CrossRef]
- Demirkiran, A.; van Ooij, P.; Westenberg, J.J.M.; Hofman, M.B.M.; van Assen, H.C.; Schoonmade, L.J.; Asim, U.; Blanken, C.P.S.; Nederveen, A.J.; van Rossum, A.C.; et al. Clinical intra-cardiac 4D flow CMR: Acquisition, analysis, and clinical applications. Eur. Hear. J. Cardiovasc. Imaging 2022, 23, 154–165. [Google Scholar] [CrossRef]
- Ntsinjana, H.N.; Chung, R.; Ciliberti, P.; Muthurangu, V.; Schievano, S.; Marek, J.; Parker, K.H.; Taylor, A.M.; Biglino, G. Utility of Cardiovascular Magnetic Resonance-Derived Wave Intensity Analysis as a Marker of Ventricular Function in Children with Heart Failure and Normal Ejection Fraction. Front. Pediatr. 2017, 5, 65. [Google Scholar] [CrossRef]
- Du, G.Q.; Li, H.R.; Xue, J.Y.; Chen, S.; Du, P.; Wu, Y.; Tian, J.W. Wave Intensity Analysis Can Identify Eccentric Cardiac Hypertrophy in Hypertensive Patients with Varied Left Ventricular Configurations. J. Ultrasound Med. 2015, 34, 2019–2027. [Google Scholar] [CrossRef]
- Broyd, C.J.; Davies, J.E.; Escaned, J.E.; Hughes, A.; Parker, K. Wave intensity analysis and its application to the coronary circulation. Glob. Cardiol. Sci. Pract. 2017, 2017, e201705. [Google Scholar] [CrossRef]
- Wang, J.; Deng, W.; Lv, Q.; Li, Y.; Liu, T.; Xie, M. Aortic Dilatation in Patients with Bicuspid Aortic Valve. Front. Physiol. 2021, 12, 615175. [Google Scholar] [CrossRef]
- Corrado, P.A.; Seiter, D.P.; Wieben, O. Automatic measurement plane placement for 4D Flow MRI of the great vessels using deep learning. Int. J. Comput. Assist. Radiol. Surg. 2022, 17, 199–210. [Google Scholar] [CrossRef]


| Control (n = 6) | BAV (n = 10) | |
|---|---|---|
| Ascending aorta dilatation type | ||
| One-sided (n, %) | - | 6 (60) |
| Overall (n, %) | - | 4 (40) |
| Valve phenotype | ||
| RL (n, %) | - | 6 (60) |
| RNC (n, %) | - | 3 (30) |
| LCN (n, %) | - | 1 (10) |
| Degree of aortic regurgitation | ||
| None (n, %) | - | 4 (40) |
| Mild (n, %) | - | 0 |
| Moderate (n, %) | - | 3 (30) |
| Severe (n, %) | - | 3 (30) |
| Degree of aortic stenosis | ||
| None (n, %) | - | 3 (30) |
| Mild (n, %) | - | 2 (20) |
| Moderate (n, %) | - | 2 (20) |
| Severe (n, %) | - | 3 (30) |
| Calcification present (n, %) | - | 3 (30) |
| Ascending Aorta | Thoracic Aorta | Descending Aorta | |||||||
|---|---|---|---|---|---|---|---|---|---|
| Control | BAV | p Value | Control | BAV | p Value | Control | BAV | p Value | |
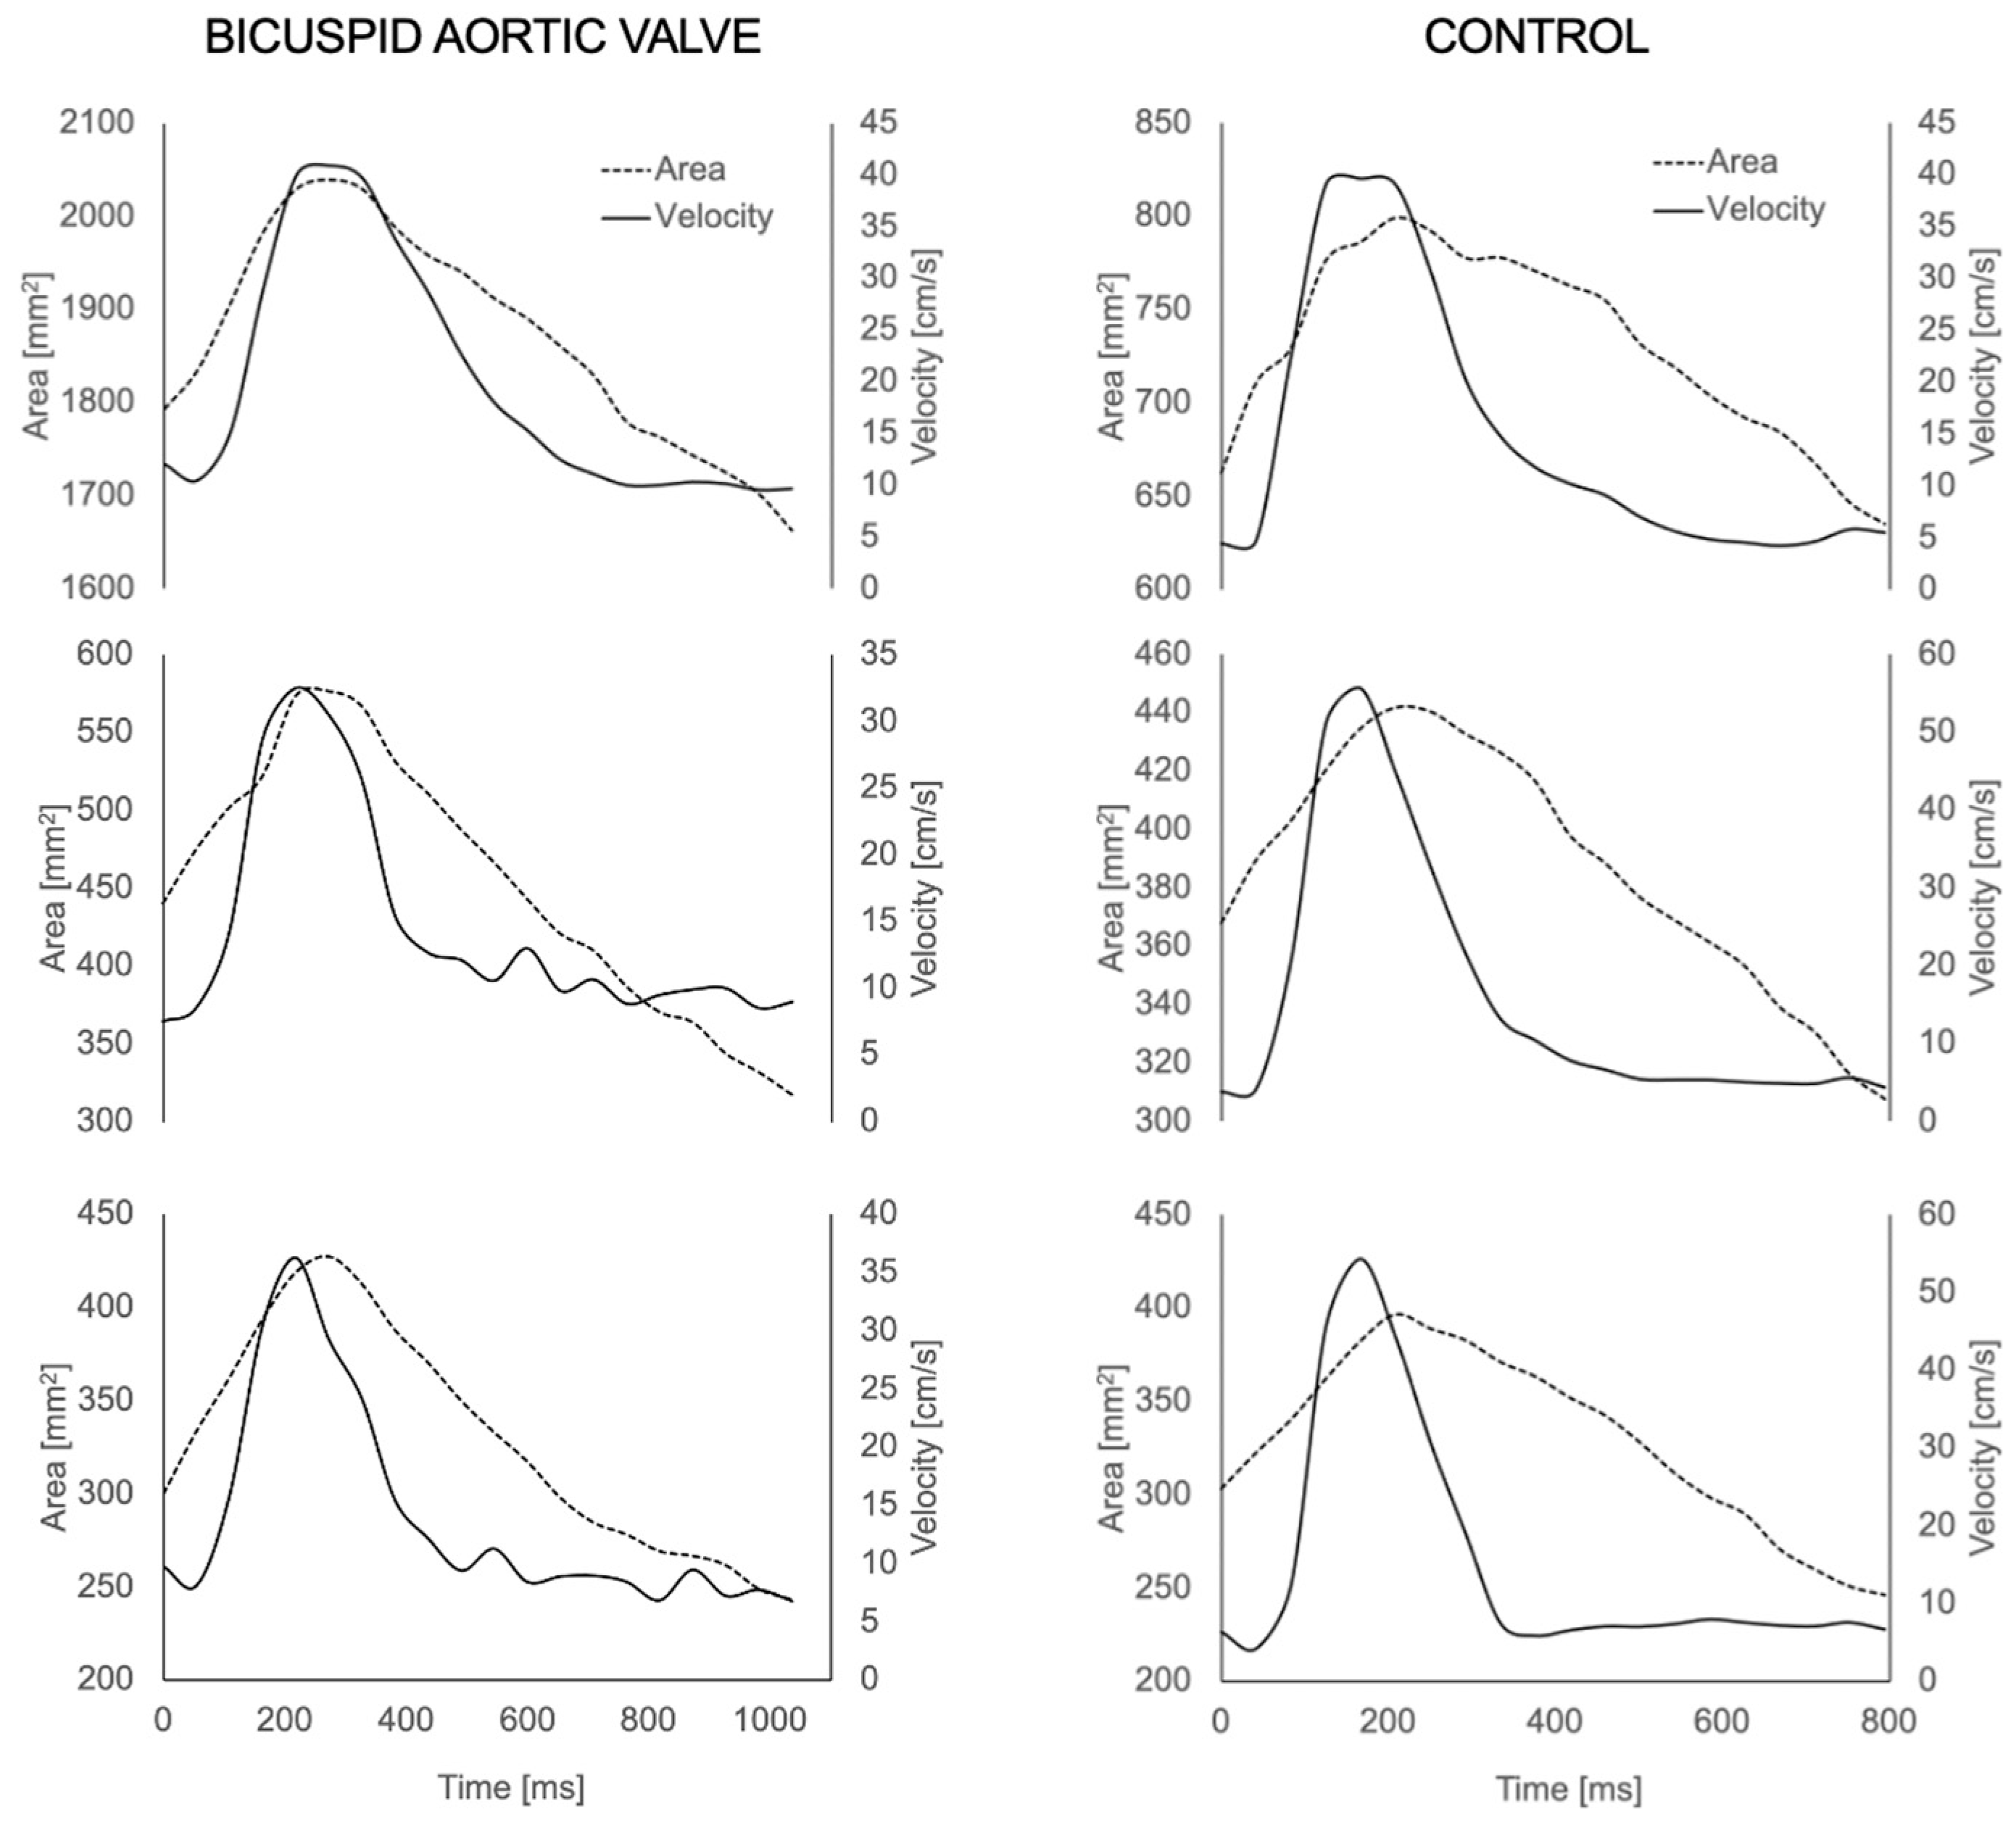
| U peak (cm/sec) | 53.49 ± 14.5 | 58.42 ± 16.62 | 0.22 | 52.94 ± 17.60 | 58.40 ± 26.90 | 0.91 | 57.26 ± 21.5 | 48.35 ± 20.76 | 0.42 |
| U mean (cm/sec) | 17.53 ± 3.73 | 33.74 ± 19.81 | 0.004 | 18.15 ± 1.83 | 32.16 ± 19.61 | 0.03 | 19.86 ± 3.54 | 26.92 ± 14.83 | 0.68 |
| Amax (mm2) | 846.85 ± 197.2 | 1796.58 ±353.82 | 0.0009 | 496.90 ± 197.27 | 739.044 ± 192.45 | 0.0049 | 411.43 ± 41.59 | 602.16 ± 173.73 | 0.0049 |
| Amin (mm2) | 659.02 ± 115.82 | 1452.337 ± 303.52 | 0.0009 | 310.99 ± 17.13 | 437.43 ± 233.69 | 0.056 | 247.11 ± 34.47 | 322.94 ± 165.58 | 0.68 |
| Ascending Aorta | Thoracic Aorta | Descending Aorta | |||||||
|---|---|---|---|---|---|---|---|---|---|
| Control | BAV | p Value | Control | BAV | p Value | Control | BAV | p Value | |
| Wave speed m s−1 | 6.40 ± 1.62 | 4.85 ± 1.75 | 0.09 | 5.90 ± 1.67 | 4.83 ± 1.44 | 0.19 | 5.11 ± 1.53 | 3.67 ± 1.77 | 0.04 |
| FCW (m/s) × 10−5 | 1.01 ± 0.43 | 0.814 ± 0.58 | 0.22 | 1.18 ± 0.77 | 1.46 ± 0.81 | 0.36 | 1.62 ± 0.73 | 1.61 ± 0.64 | 0.48 |
| BCW (m/s) × 10−5 | −0.22 ± 0.20 | −0.06 ± 0.07 | 0.10 | −0.22 ± 0.23 | −0.19 ± 0.36 | 0.48 | −0.35 ± 0.33 | −0.18 ± 0.34 | 0.08 |
| FEW (m/s) × 10−5 | 0.08 ± 0.04 | 0.18 ± 0.11 | 0.07 | 0.27 ± 0.19 | 0.59 ± 0.58 | 0.22 | 0.47 ± 0.30 | 0.50 ± 0.55 | 0.54 |
Disclaimer/Publisher’s Note: The statements, opinions and data contained in all publications are solely those of the individual author(s) and contributor(s) and not of MDPI and/or the editor(s). MDPI and/or the editor(s) disclaim responsibility for any injury to people or property resulting from any ideas, methods, instructions or products referred to in the content. |
© 2023 by the authors. Licensee MDPI, Basel, Switzerland. This article is an open access article distributed under the terms and conditions of the Creative Commons Attribution (CC BY) license (https://creativecommons.org/licenses/by/4.0/).
Share and Cite
Sophocleous, F.; Delchev, K.; De Garate, E.; Hamilton, M.C.K.; Caputo, M.; Bucciarelli-Ducci, C.; Biglino, G. Feasibility of Wave Intensity Analysis from 4D Cardiovascular Magnetic Resonance Imaging Data. Bioengineering 2023, 10, 662. https://doi.org/10.3390/bioengineering10060662
Sophocleous F, Delchev K, De Garate E, Hamilton MCK, Caputo M, Bucciarelli-Ducci C, Biglino G. Feasibility of Wave Intensity Analysis from 4D Cardiovascular Magnetic Resonance Imaging Data. Bioengineering. 2023; 10(6):662. https://doi.org/10.3390/bioengineering10060662
Chicago/Turabian StyleSophocleous, Froso, Kiril Delchev, Estefania De Garate, Mark C. K. Hamilton, Massimo Caputo, Chiara Bucciarelli-Ducci, and Giovanni Biglino. 2023. "Feasibility of Wave Intensity Analysis from 4D Cardiovascular Magnetic Resonance Imaging Data" Bioengineering 10, no. 6: 662. https://doi.org/10.3390/bioengineering10060662