
A Protocol for the Automatic Construction of Highly Curated Genome-Scale Models of Human Metabolism
 , , and
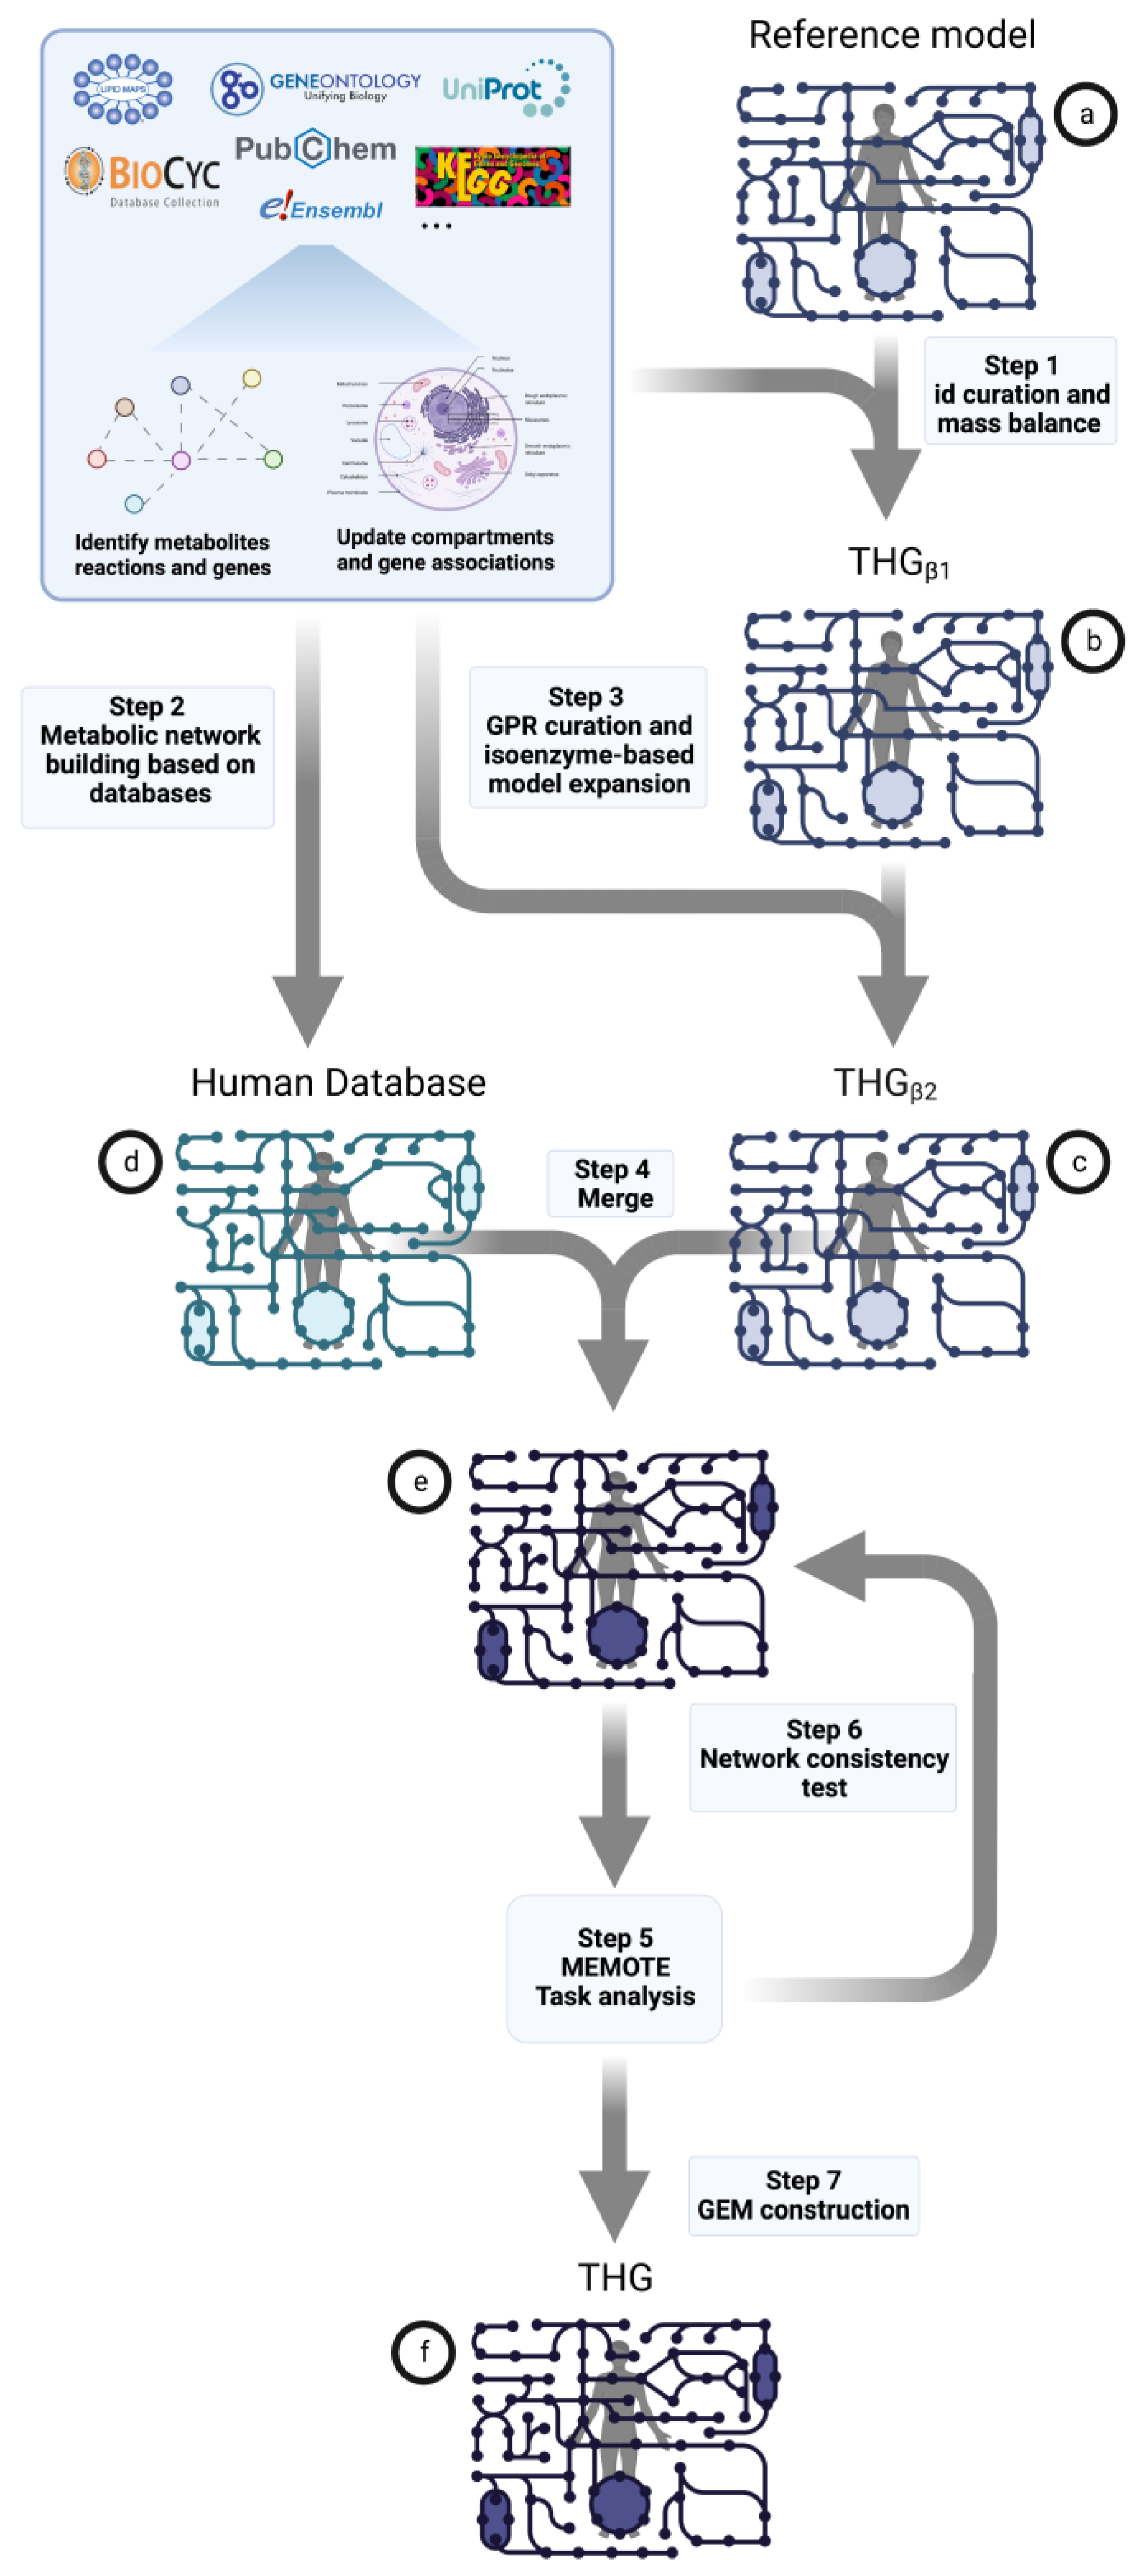
Abstract
:1. Introduction
2. Materials and Methods
2.1. Metabolic Model Building Pipeline
2.1.1. Reference Model Curation
- i.
- First, reactions are identified by their unique combination of substrates and products. This task is performed using Jaccard index (JI) metrics. In this task, KEGG, ChEBI, HMDB and LipidMaps identifiers, as well as the names and formula of the metabolites involved in the reaction, are used as a unique fingerprint that identifies the reaction in the reference model with the information retrieved from online databases.
- ii.
- Finally, the metabolic reactions are mass balanced using the “mass_balance” function. This function sequentially applies four different analyses of the molecular formulas of substrates and products until the balance is achieved.
- 1.
- First, the reaction is analyzed to detect mass balance inconsistencies. This is calculated by considering the molecular formula and the stoichiometry of the species. If the reaction is not mass balanced, a second method is applied;
- 2.
- Here, the metabolic reaction is transformed to a matrix form (M) representing the number of each atom that each metabolite in the reaction has, where rows and columns represent metabolites (substrates and products) and atoms, respectively. The coefficients in the M matrix corresponding to products are multiplied by −1, and the system is solved;
- 3.
- If the previous step provides multiple solutions or no solution, the reduced row echelon form of M matrix is solved. If multiple solutions are found, the one describing the lowest overall stoichiometric coefficients is selected;
- 4.
- Finally, if no solution exists for integer numbers using the previous approaches, the reaction mass balance is formalized as a linear programming problem. Here, the stoichiometric coefficients are the variables to determine, and the difference of atoms between the right and left side of the metabolic reaction is minimized (objective function) while constraining the results to values higher than 0.
2.1.2. Database Model of All Human-Specific Metabolic Information
2.1.3. Reference Model and Database Merging
2.2. Reference Model
2.3. Model Quality Assessment
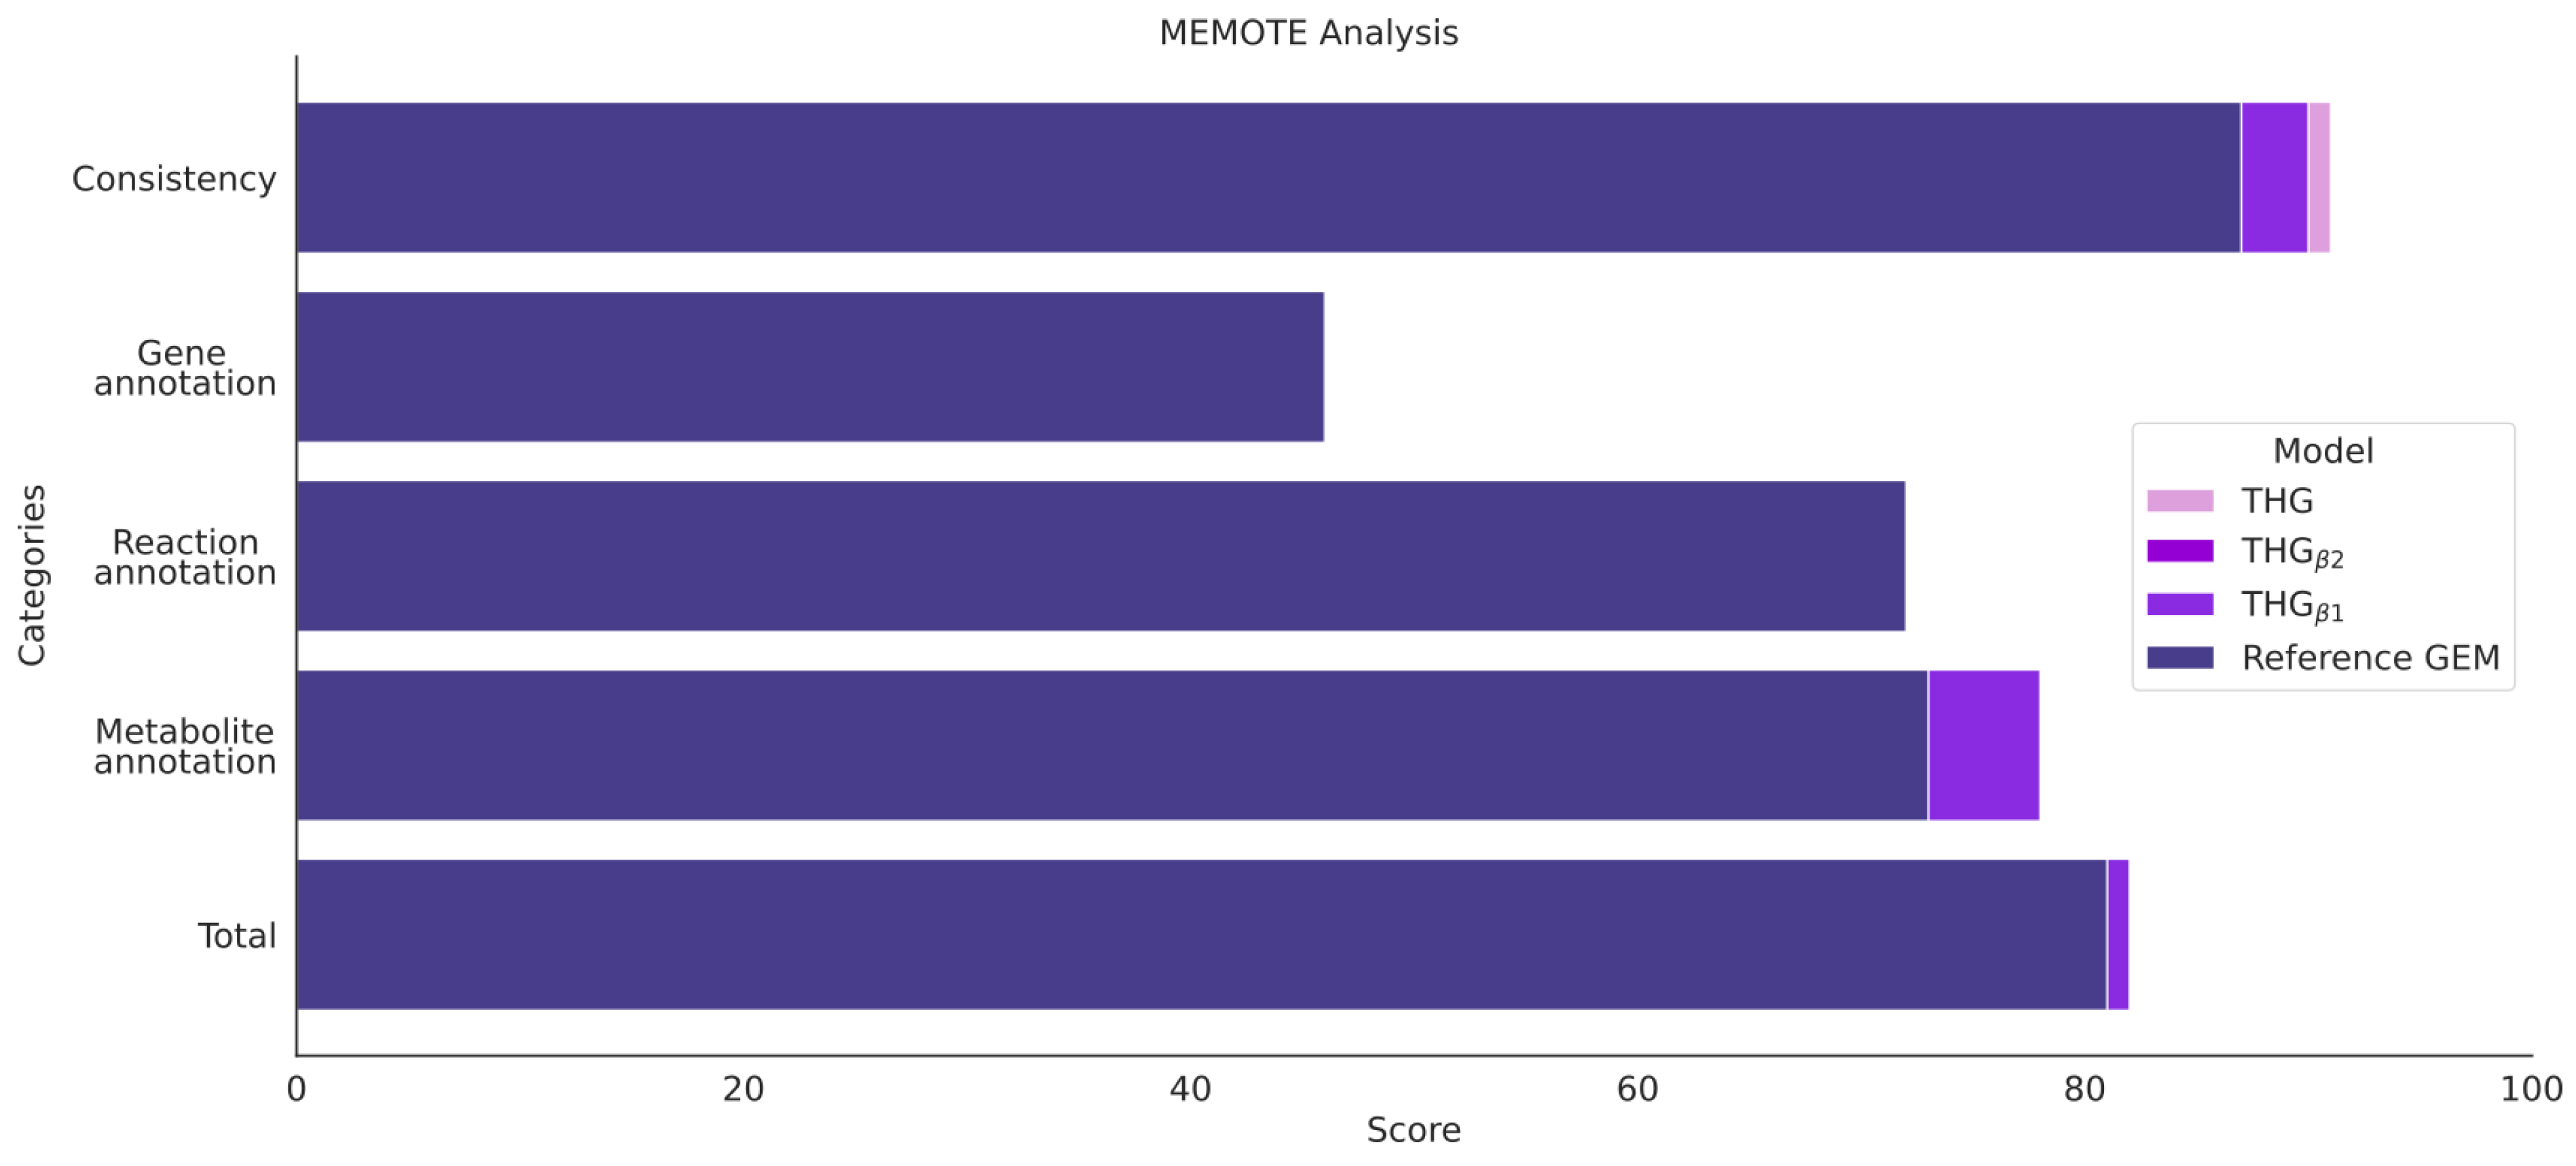
- Testing metabolic model consistency and annotation by applying the metabolic model test (MEMOTE) pipeline (Figure 1 step 5); MEMOTE is a standardized tool for evaluating GEMs [60] and benchmarks GEMs in different areas. First, an evaluation of the semantic description of the domain-specific model components, such as flux bounds, metabolic formulas and annotation, among others, is performed. Next, the model is benchmarked in four general areas:
- GEM annotation according to community standards [61];
- Basic tests check the formal correctness of a model and verify the presence of components such as metabolites, compartments, reactions and genes. These tests also check for metabolite formula and charge information and GPR rules. General quality metrics, such as the degree of metabolic coverage representing the ratio of reactions and genes, are also checked. Since MEMOTE cannot evaluate S-GPRs and building-block-based glycan formulation Glycan, these tests are provided in a separate table;
- A model is tested for production of biomass precursors in different conditions for biomass consistency, for nonzero growth rate and for direct precursors;
- Task analysis (Figure 1 step 5): A metabolic task is defined as the capability that a given model must have to metabolize one or more metabolic products from a specific source of substrate/s. Analysis of essential metabolic tasks describing essential metabolic functions for cell viability is performed in the different GEMs and compared with the reference model. The essential tasks are described for Human1 [24] and are available in its GitHub repository (https://github.com/SysBioChalmers/Human-GEM/, accessed on 24 February 2023). The analysis is performed as described by Henriksen et al. in 2022 [21] and integrated into MEMOTE.
3. Results
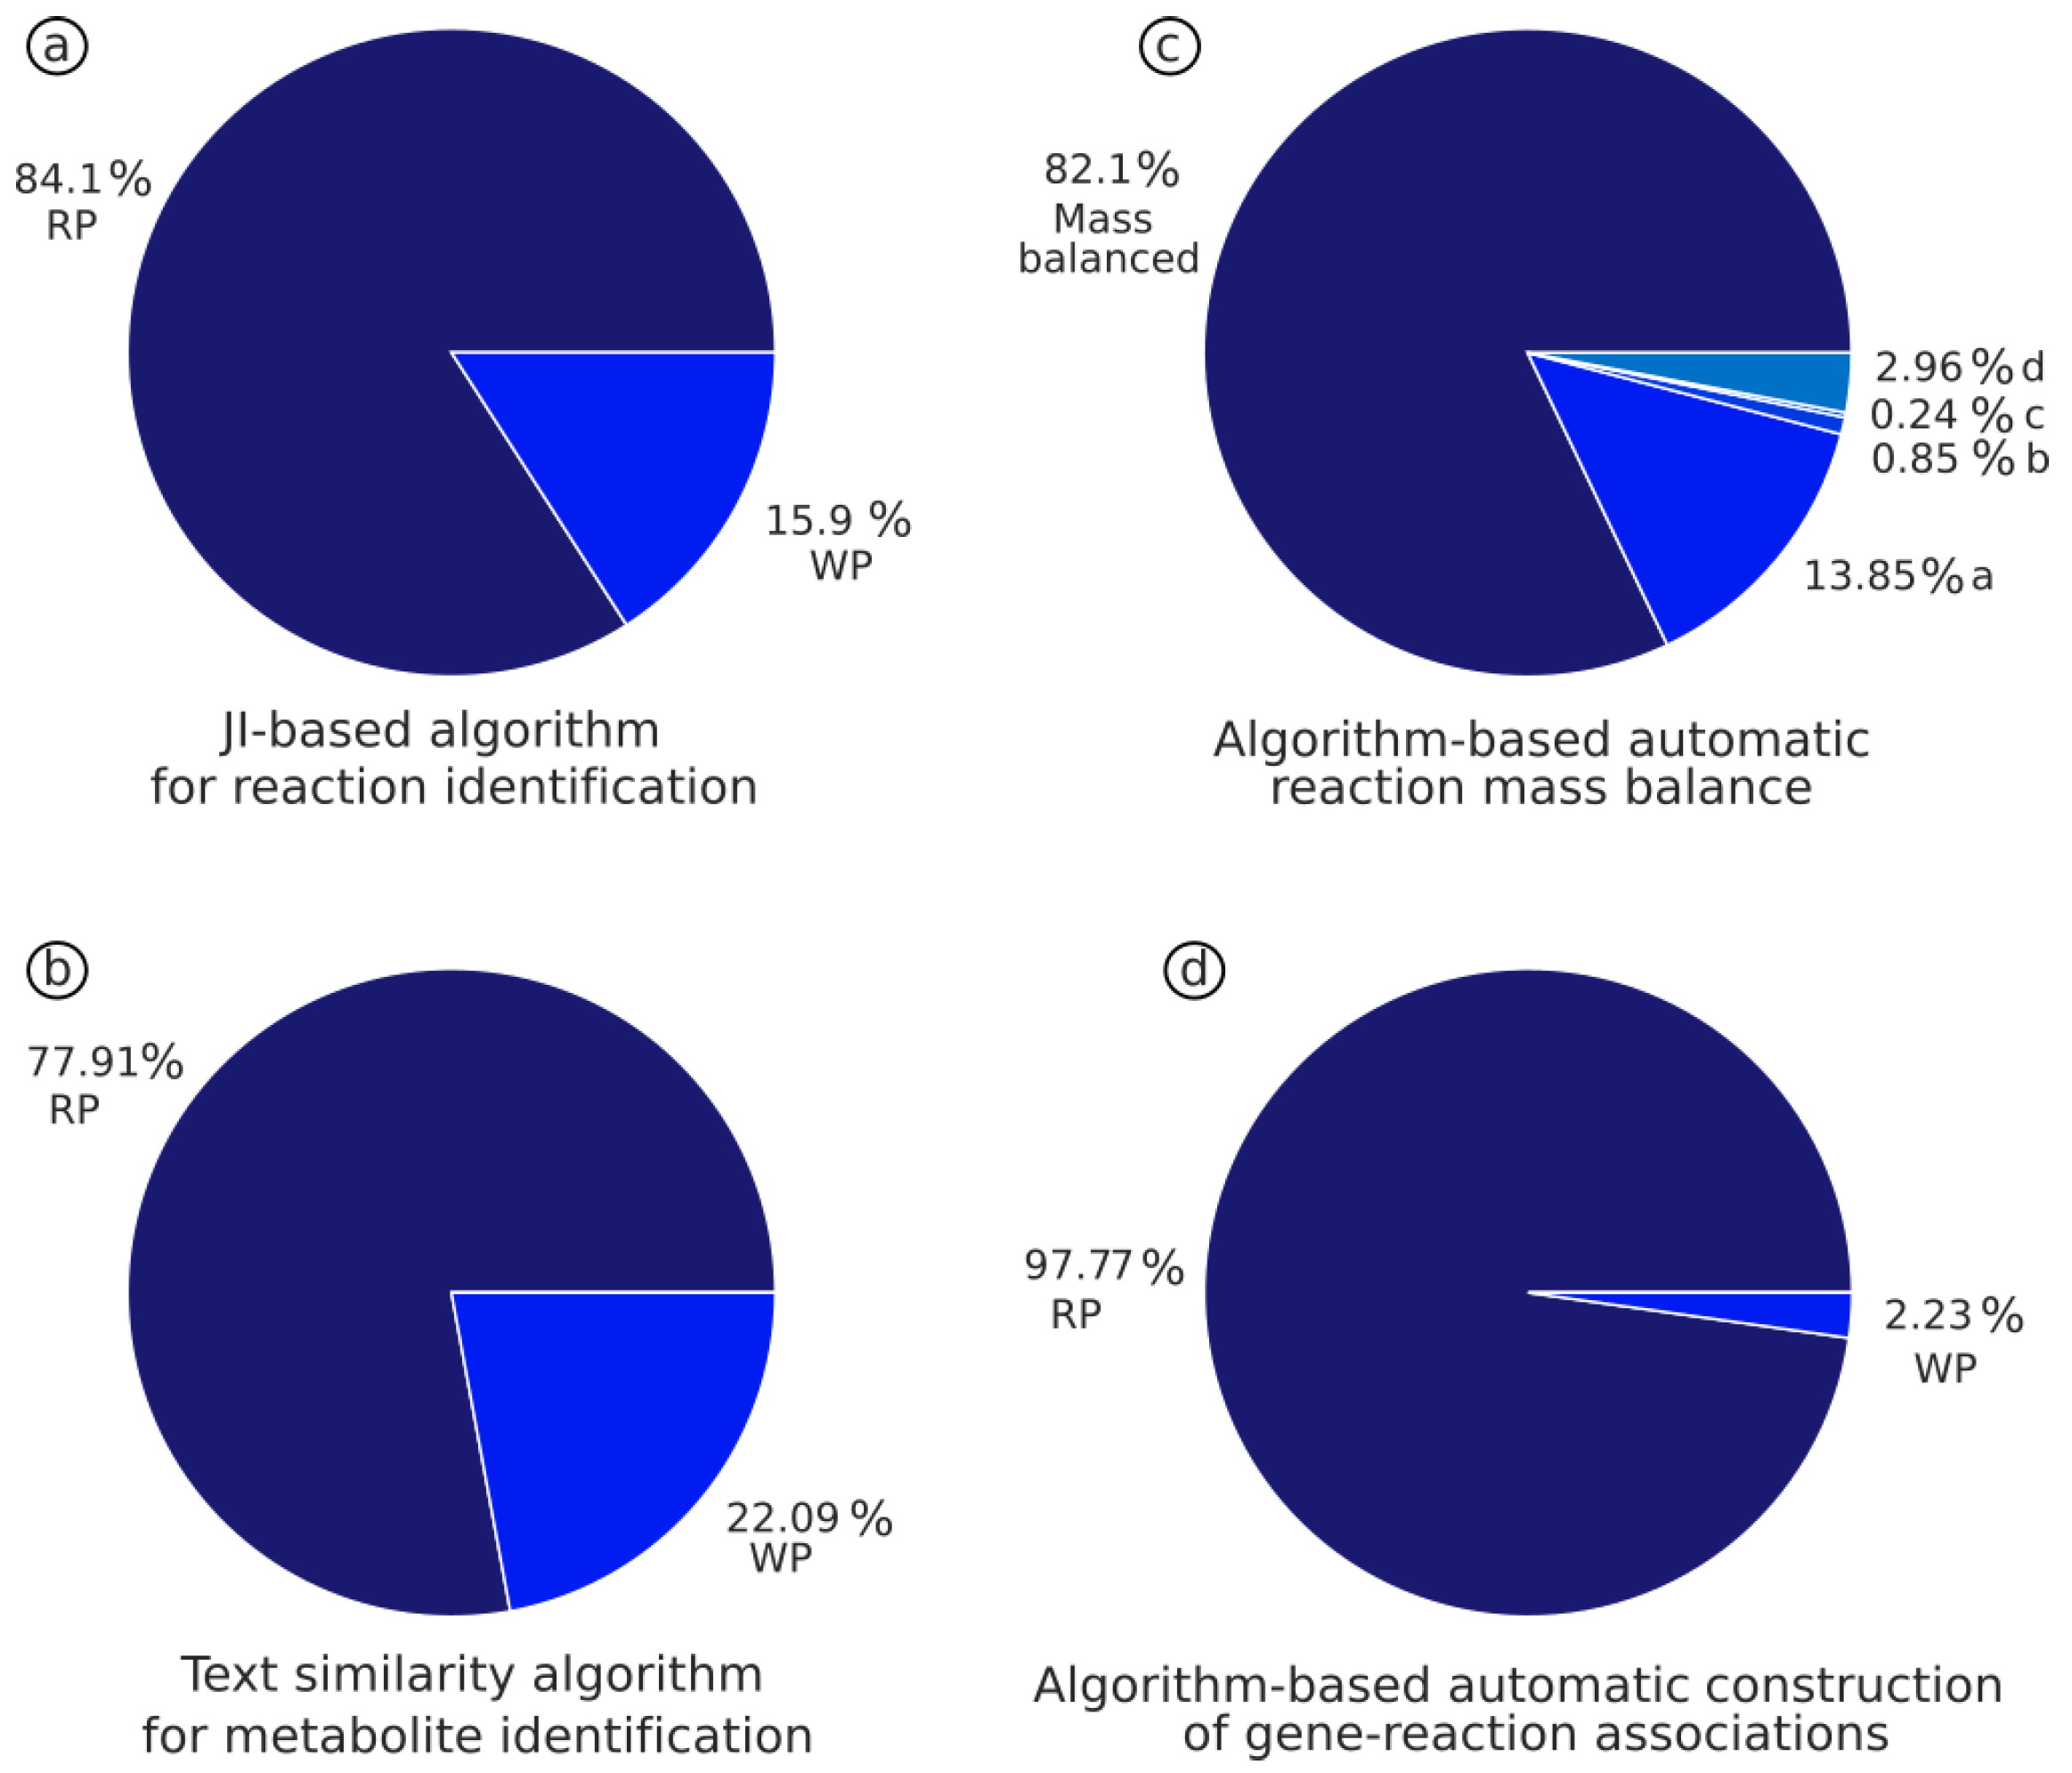
3.1. JI-Based Algorithm Identifies Metabolic Reactions Based on the Unique Combination of Substrates and Products
3.2. Text Similarity Algorithm to Identify Metabolites by Comparing Names and Formula with PubChem Database
3.3. Automatic Identification and Rebalancing of Imbalanced Reaction by Using the Mass Balance Reaction Algorithm
3.4. The Gene-Protein-Reaction Algorithm Enables the Automatic Building of GPRs and S-GPR Based on Current Data from Online Databases
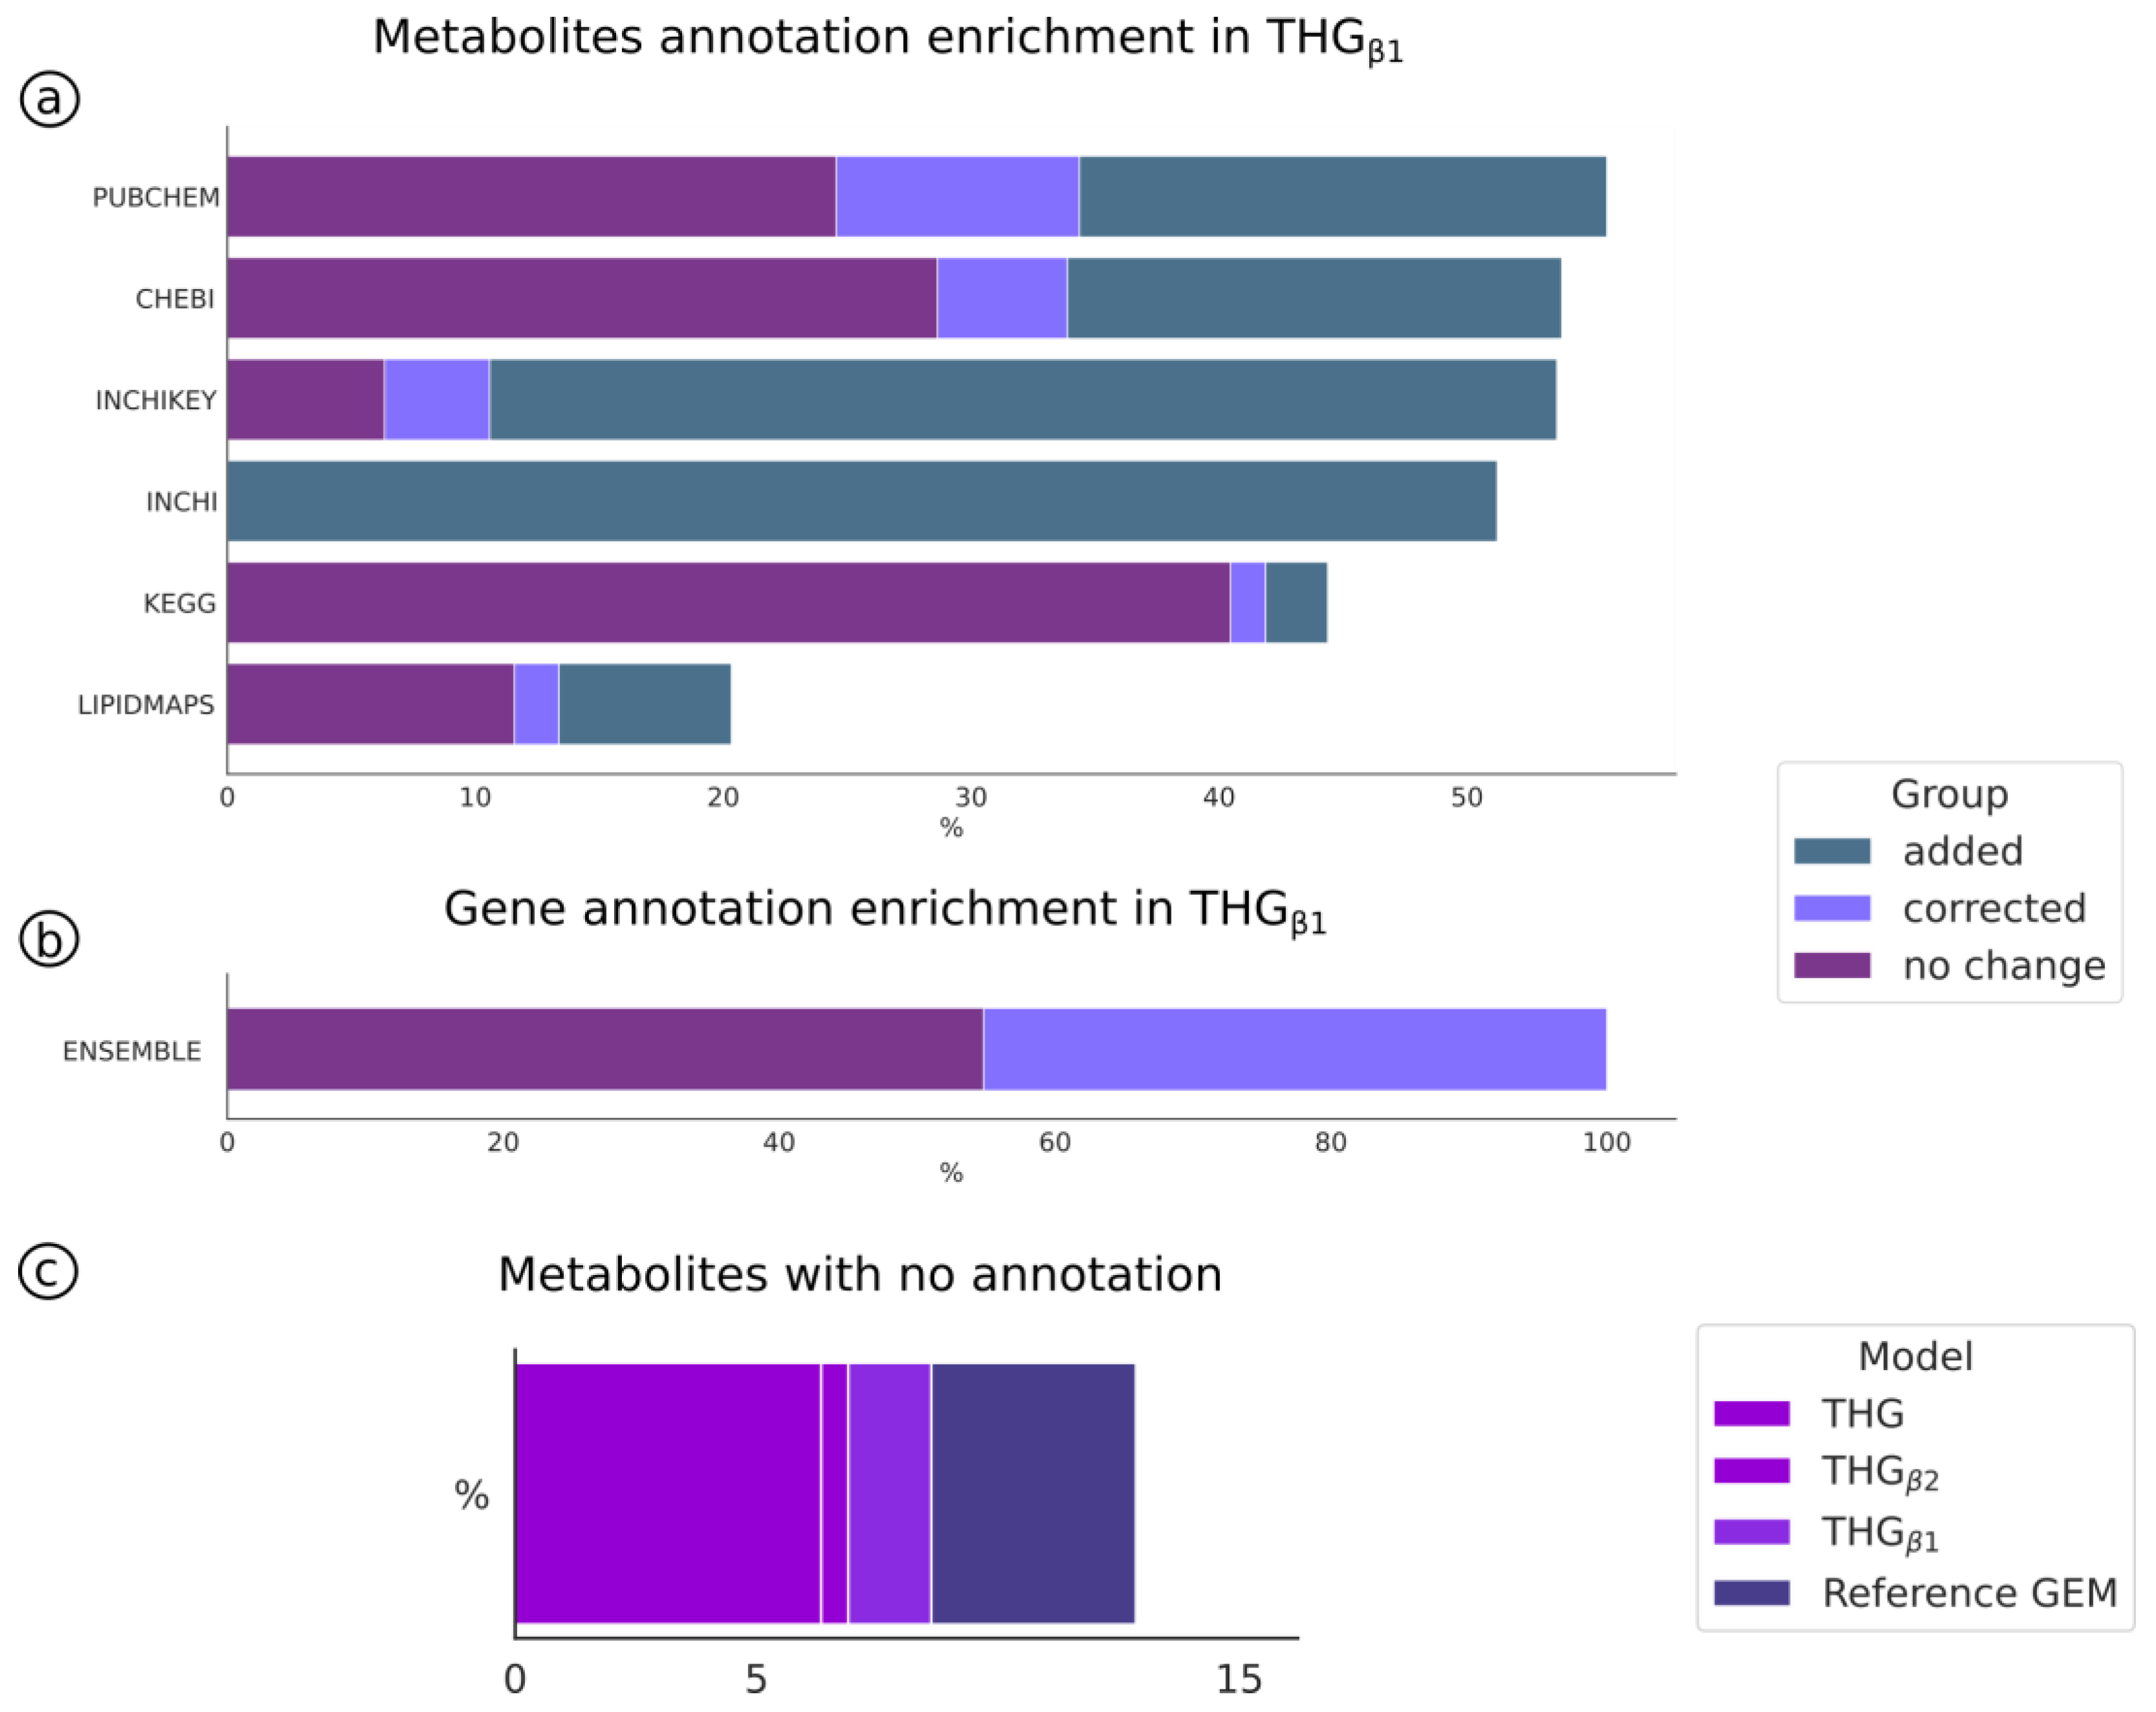
3.5. Improving and Automatic Curation of the Reference Model Annotation (THGβ1)
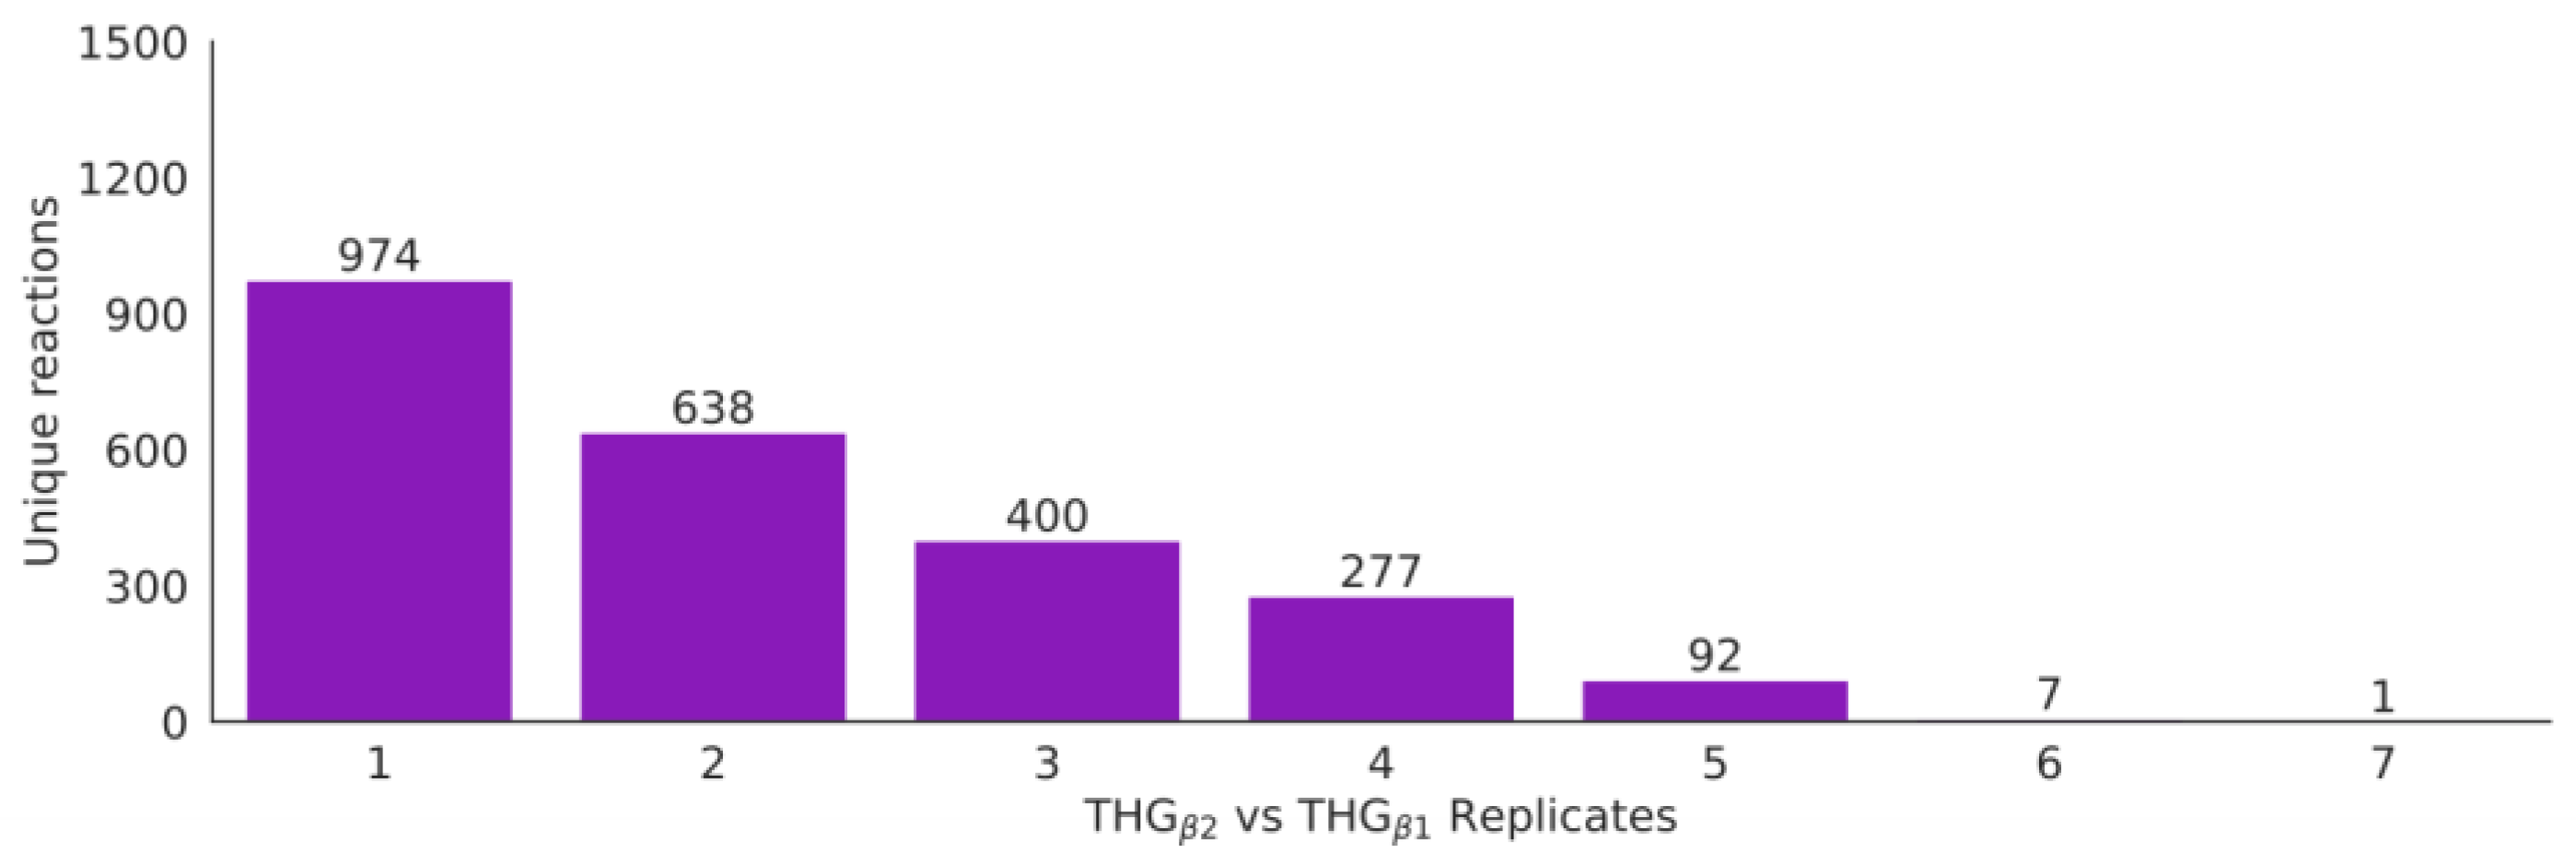
3.6. Automatic Enrichment and Expansion of the Reference Model by Adding Isoenzyme Reactions (THGβ2)
3.7. Applying the Protocol to Build a Database of the Human Metabolism Using Currently Available Online Database Information
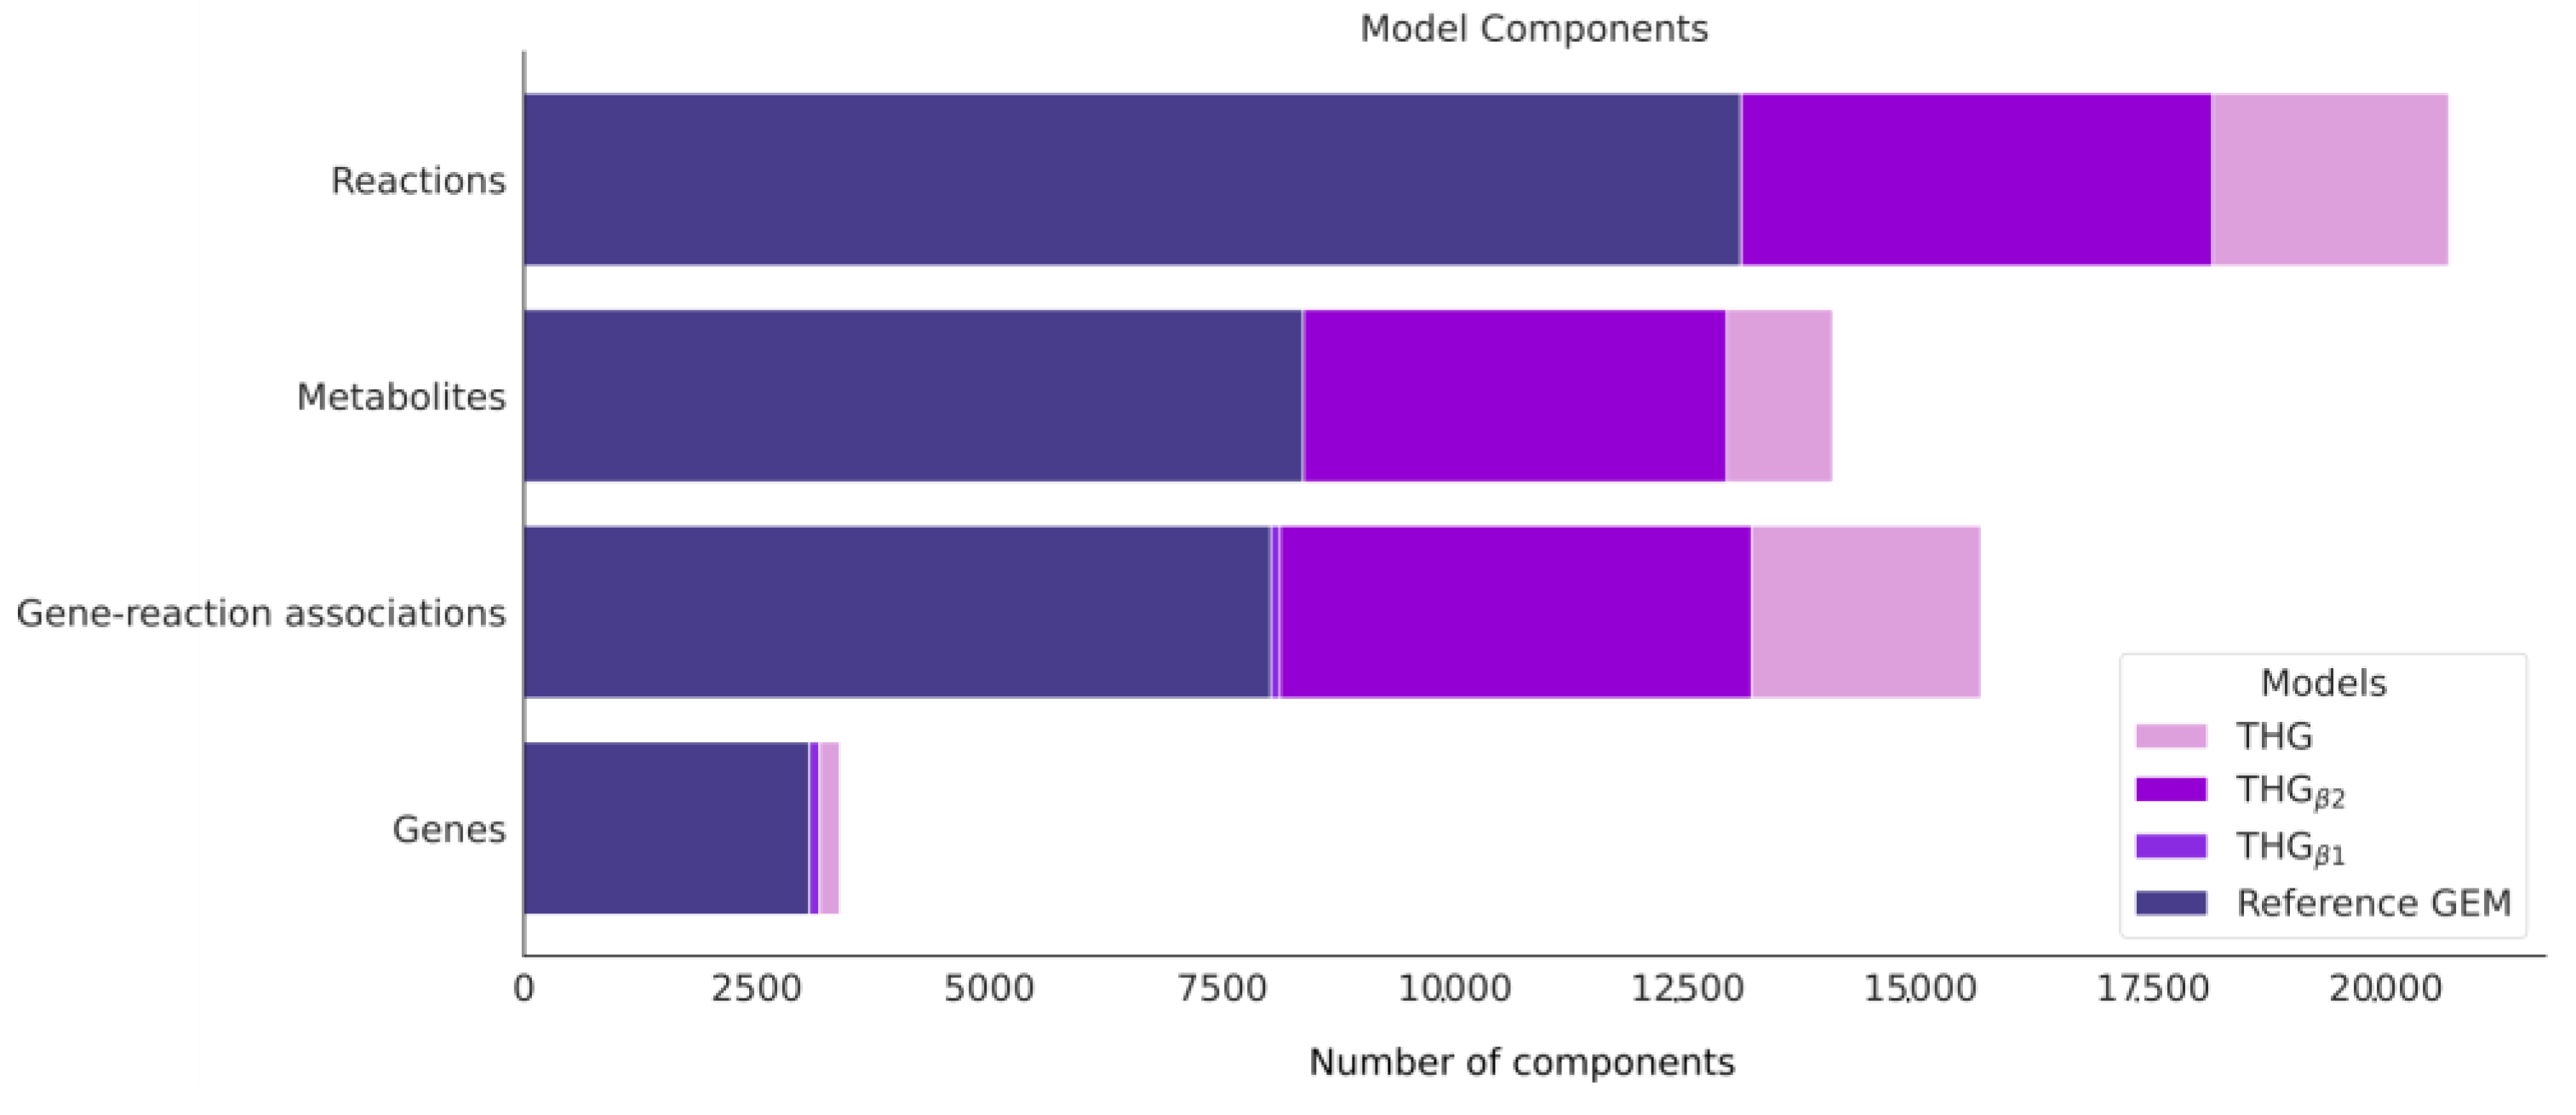
3.8. Applying the Protocol to Combine THGβ2 and the Database of Human Metabolism into a Large and Comprehensive Reconstruction of Human Metabolism: THG
3.9. Model Assessment via MEMOTE and Task Analysis
4. Discussion
5. Conclusions
Supplementary Materials
Author Contributions
Funding
Institutional Review Board Statement
Informed Consent Statement
Data Availability Statement
Conflicts of Interest
Abbreviations
| GEM | Genome-scale metabolic model |
| KEGG | Kyoto Encyclopedia of Genes and Genomes |
| ChEBI | Chemical Entities of Biological Interest |
| THG | The human GEM |
| S-GPR | Stoichiometric gene protein reaction |
| GPR | Gene reaction protein |
| MEMOTE | Metabolic model testing |
| LCS | Longest common sub-string |
| JI | Jaccard index |
| EC | Enzyme commission |
| AST | Abstract syntax tree |
| KGML | KEGG Markup Language |
| GO | Gene ontology |
References
- DeBerardinis, R.J.; Thompson, C.B. Cellular metabolism and disease: What do metabolic outliers teach us? Cell 2012, 148, 1132–1144. [Google Scholar] [CrossRef]
- Ghesquière, B.; Wong, B.W.; Kuchnio, A.; Carmeliet, P. Metabolism of stromal and immune cells in health and disease. Nature 2014, 511, 167–176. [Google Scholar] [CrossRef] [PubMed]
- Emwas, A.H.M.; Salek, R.M.; Griffin, J.L.; Merzaban, J.J. NMR-based metabolomics in human disease diagnosis: Applications, limitations, and recommendations. Metabolomics 2013, 9, 1048–1072. [Google Scholar] [CrossRef]
- Day, E.A.; Ford, R.J.; Steinberg, G.R. AMPK as a Therapeutic Target for Treating Metabolic Diseases. Trends Endocrinol. Metab. 2017, 8, 545–560. [Google Scholar] [CrossRef]
- Dey, P.; Baddour, J.; Muller, F.; Wu, C.C.; Wang, H.; Liao, W.T.; Lan, Z.; Chen, A.; Gutschner, T.; Kang, Y.; et al. Genomic deletion of malic enzyme 2 confers collateral lethality in pancreatic cancer. Nature 2017, 542, 119–123. [Google Scholar] [CrossRef] [PubMed]
- Johnson, C.H.; Ivanisevic, J.; Siuzdak, G. Metabolomics: Beyond biomarkers and towards mechanisms. Nat. Rev. Mol. Cell Biol. 2016, 7, 451–459. [Google Scholar] [CrossRef]
- Sauer, U. Metabolic networks in motion: 13C-based flux analysis. Mol. Syst. Biol. 2006, 2, 62. [Google Scholar] [CrossRef]
- Ye, C.; Wei, X.; Shi, T.; Sun, X.; Xu, N.; Gao, C.; Zou, W. Genome-scale metabolic network models: From first-generation to next-generation. Appl. Microbiol. Biotechnol. 2022, 106, 4907–4920. [Google Scholar] [CrossRef]
- Reed, J.L.; Vo, T.D.; Schilling, C.H.; Palsson, B.O. An expanded genome-scale model of Escherichia coli K-12 (iJR904 GSM/GPR). Genome Biol. 2003, 4, 9R54. [Google Scholar] [CrossRef] [PubMed]
- Benedict, M.N.; Gonnerman, M.C.; Metcalf, W.W.; Price, N.D. Genome-scale metabolic reconstruction and hypothesis testing in the methanogenic archaeon Methanosarcina acetivorans C2A. J. Bacteriol. 2012, 194, 855–865. [Google Scholar] [CrossRef]
- Peterson, J.R.; Thor, S.; Kohler, L.; Kohler, P.R.; Metcalf, W.W.; Luthey-Schulten, Z. Genome-wide gene expression and RNA half-life measurements allow predictions of regulation and metabolic behavior in Methanosarcina acetivorans. BMC Genom. 2016, 17, 924. [Google Scholar] [CrossRef] [PubMed]
- Förster, J.; Famili, I.; Fu, P.; Palsson, B.Ø.; Nielsen, J. Genome-scale reconstruction of the Saccharomyces cerevisiae metabolic network. Genome Res. 2003, 13, 244–253. [Google Scholar] [CrossRef] [PubMed]
- de Oliveira Dal’Molin, C.G.; Quek, L.E.; Palfreyman, R.W.; Brumbley, S.M.; Nielsen, L.K. AraGEM, a genome-scale reconstruction of the primary metabolic network in Arabidopsis. Plant Physiol. 2010, 152, 579–589. [Google Scholar] [CrossRef] [PubMed]
- Mintz-Oron, S.; Meir, S.; Malitsky, S.; Ruppin, E.; Aharoni, A.; Shlomi, T. Reconstruction of Arabidopsis metabolic network models accounting for subcellular compartmentalization and tissue-specificity. Proc. Natl. Acad. Sci. USA 2012, 109, 339–344. [Google Scholar] [CrossRef]
- Sheikh, K.; Förster, J.; Nielsen, L.K. Modeling hybridoma cell metabolism using a generic genome-scale metabolic model of Mus musculus. Biotechnol. Prog. 2005, 21, 112–121. [Google Scholar] [CrossRef]
- Duarte, N.C.; Becker, S.A.; Jamshidi, N.; Thiele, I.; Mo, M.L.; Vo, T.D.; Srivas, R.; Palsson, B.Ø. Global reconstruction of the human metabolic network based on genomic and bibliomic data. Proc. Natl. Acad. Sci. USA 2007, 104, 1777–1782. [Google Scholar] [CrossRef] [PubMed]
- Ma, H.; Sorokin, A.; Mazein, A.; Selkov, A.; Selkov, E.; Demin, O.; Goryanin, I. The Edinburgh human metabolic network reconstruction and its functional analysis. Mol. Syst. Biol. 2007, 3, 135. [Google Scholar] [CrossRef]
- Oberhardt, M.A.; Palsson, B.Ø.; Papin, J.A. Applications of genome-scale metabolic reconstructions. Mol. Syst. Biol. 2009, 5, 320. [Google Scholar] [CrossRef]
- Pál, C.; Papp, B.; Pósfai, G. The dawn of evolutionary genome engineering. Nat. Rev. Genet. 2014, 15, 504–512. [Google Scholar] [CrossRef]
- Park, J.M.; Kim, T.Y.; Lee, S.Y. Constraints-based genome-scale metabolic simulation for systems metabolic engineering. Biotechnol. Adv. 2009, 27, 979–988. [Google Scholar] [CrossRef]
- Blais, E.M.; Chavali, A.K.; Papin, J.A. Linking genome-scale metabolic modeling and genome annotation. Methods Mol. Biol. 2013, 985, 61–83. [Google Scholar]
- Kim, H.U.; Kim, S.Y.; Jeong, H.; Kim, T.Y.; Kim, J.J.; Choy, H.E.; Yi, K.Y.; Rhee, J.H.; Lee, S.Y. Integrative genome-scale metabolic analysis of Vibrio vulnificus for drug targeting and discovery. Mol. Syst. Biol. 2011, 7, 460. [Google Scholar] [CrossRef] [PubMed]
- Henriksen, H.H.; Marín de Mas, I.; Herand, H.; Krocker, J.; Wade, C.E.; Johansson, P.I. Metabolic systems analysis identifies a novel mechanism contributing to shock in patients with endotheliopathy of trauma (EoT) involving thromboxane A2 and LTC4. Matrix Biol. Plus 2022, 15, 100115. [Google Scholar] [CrossRef]
- Brunk, E.; Sahoo, S.; Zielinski, D.C.; Altunkaya, A.; Dräger, A.; Mih, N.; Gatto, F.; Nilsson, A.; Preciat Gonzalez, G.A.; Aurich, M.K.; et al. Recon3D enables a three-dimensional view of gene variation in human metabolism. Nat. Biotechnol. 2018, 36, 272–281. [Google Scholar] [CrossRef]
- Mardinoglu, A.; Agren, R.; Kampf, C.; Asplund, A.; Uhlen, M.; Nielsen, J. Genome-scale metabolic modelling of hepatocytes reveals serine deficiency in patients with non-alcoholic fatty liver disease. Nat. Commun. 2014, 5, 3083. [Google Scholar] [CrossRef] [PubMed]
- Robinson, J.L.; Kocabaş, P.; Wang, H.; Cholley, P.E.; Cook, D.; Nilsson, A.; Anton, M.; Ferreira, R.; Domenzain, I.; Billa, V.; et al. An atlas of human metabolism. Sci. Signal. 2020, 13, eaaz1482. [Google Scholar] [CrossRef]
- Dietmair, S.; Hodson, M.P.; Quek, L.E.; Timmins, N.E.; Gray, P.; Nielsen, L.K. A multi-omics analysis of recombinant protein production in Hek293 cells. PLoS ONE 2012, 7, e43394. [Google Scholar] [CrossRef] [PubMed]
- Thiele, I.; Swainston, N.; Fleming, R.M.; Hoppe, A.; Sahoo, S.; Aurich, M.K.; Haraldsdottir, H.; Mo, M.L.; Rolfsson, O.; Stobbe, M.D.; et al. A community-driven global reconstruction of human metabolism. Nat. Biotechnol. 2013, 31, 419–425. [Google Scholar] [CrossRef]
- Henry, C.S.; DeJongh, M.; Best, A.A.; Frybarger, P.M.; Linsay, B.; Stevens, R.L. High-throughput generation, optimization and analysis of genome-scale metabolic models. Nat. Biotechnol. 2010, 28, 977–982. [Google Scholar] [CrossRef]
- Machado, D.; Andrejev, S.; Tramontano, M.; Patil, K.R. Fast automated reconstruction of genome-scale metabolic models for microbial species and communities. Nucleic Acids Res. 2018, 46, 7542–7553. [Google Scholar] [CrossRef]
- Agren, R.; Liu, L.; Shoaie, S.; Vongsangnak, W.; Nookaew, I.; Nielsen, J. The RAVEN toolbox and its use for generating a genome-scale metabolic model for Penicillium chrysogenum. PLoS Comput. Biol. 2013, 9, e1002980. [Google Scholar] [CrossRef] [PubMed]
- Wang, H.; Marcišauskas, S.; Sánchez, B.J.; Domenzain, I.; Hermansson, D.; Agren, R.; Nielsen, J.; Kerkhoven, E.J. RAVEN 2.0: A versatile toolbox for metabolic network reconstruction and a case study on Streptomyces coelicolor. PLoS Comput. Biol. 2018, 14, e1006541. [Google Scholar] [CrossRef] [PubMed]
- Arkin, A.P.; Cottingham, R.W.; Henry, C.S.; Harris, N.L.; Stevens, R.L.; Maslov, S.; Dehal, P.; Ware, D.; Perez, F.; Canon, S.; et al. Current status and applications of genome-scale metabolic models. Genome Biol. 2019, 20, 121. [Google Scholar]
- Marín de Mas, I.; Torrents, L.; Bedia, C.; Nielsen, L.K.; Cascante, M.; Tauler, R. Stoichiometric gene-to-reaction associations enhance model-driven analysis performance: Metabolic response to chronic exposure to Aldrin in prostate cancer. BMC Genom. 2019, 20, 652. [Google Scholar] [CrossRef] [PubMed]
- Vlassis, N.; Pacheco, M.P.; Sauter, T. Fast reconstruction of compact context-specific metabolic network models. PLoS Comput. Biol. 2014, 10, e1003424. [Google Scholar] [CrossRef] [PubMed]
- Heirendt, L.; Arreckx, S.; Pfau, T.; Mendoza, S.N.; Richelle, A.; Heinken, A.; Haraldsdóttir, H.S.; Wachowiak, J.; Keating, S.M.; Vlasov, V.; et al. Creation and analysis of biochemical constraint-based models using the COBRA Toolbox v.3.0. Nat. Protoc. 2019, 14, 639–702. [Google Scholar] [CrossRef]
- Kim, S.; Thiessen, P.A.; Bolton, E.E.; Chen, J.; Fu, G.; Gindulyte, A.; Han, L.; He, J.; He, S.; Shoemaker, B.A.; et al. PubChem Substance and Compound databases. Nucleic Acids Res. 2016, 44, D1202–D1213. [Google Scholar] [CrossRef]
- Kim, S.; Chen, J.; Cheng, T.; Gindulyte, A.; He, J.; He, S.; Li, Q.; Shoemaker, B.A.; Thiessen, P.A.; Yu, B.; et al. PubChem 2023 update. Nucleic Acids Res. 2023, 51, D1373–D1380. [Google Scholar] [CrossRef]
- Caspi, R.; Billington, R.; Ferrer, L.; Foerster, H.; Fulcher, C.A.; Keseler, I.M.; Kothari, A.; Krummenacker, M.; Latendresse, M.; Mueller, L.A.; et al. The MetaCyc database of metabolic pathways and enzymes and the BioCyc collection of pathway/genome databases. Nucleic Acids Res. 2016, 44, D471–D480. [Google Scholar] [CrossRef]
- Caspi, R.; Billington, R.; Keseler, I.M.; Kothari, A.; Krummenacker, M.; Midford, P.E.; Ong, W.K.; Paley, S.; Subhraveti, P.; Karp, P.D. The MetaCyc database of meta bolic pathways and enzymes—A 2019 update. Nucleic Acids Res. 2020, 48, D445–D453. [Google Scholar] [CrossRef]
- Karp, P.D.; Ouzounis, C.A.; Moore-Kochlacs, C.; Goldovsky, L.; Kaipa, P.; Ahrén, D.; Tsoka, S.; Darzentas, N.; Kunin, V.; López-Bigas, N. Expansion of the BioCyc collection of pathway/genome databases to 160 genomes. Nucleic Acids Res. 2005, 33, 6083–6089. [Google Scholar] [CrossRef] [PubMed]
- Romero, P.; Wagg, J.; Green, M.L.; Kaiser, D.; Krummenacker, M.; Karp, P.D. Computational prediction of human metabolic pathways from the complete human genome. Genome Biol. 2005, 6, R2. [Google Scholar] [CrossRef]
- UniProt Consortium. UniProt: The Universal Protein Knowledgebase in 2023. Nucleic Acids Res. 2023, 51, D523–D531. [Google Scholar] [CrossRef]
- UniProt Consortium. UniProt: The universal protein knowledgebase in 2021. Nucleic Acids Res. 2021, 49, D480–D489. [Google Scholar] [CrossRef]
- Kanehisa, M.; Goto, S. KEGG: Kyoto encyclopedia of genes and genomes. Nucleic Acids Res. 2000, 28, 27–30. [Google Scholar] [CrossRef] [PubMed]
- Schulz, K.U.; Stoyan, M. Fast string correction with Levenshtein automata. Int. J. Doc. Anal. Recognit. 2002, 5, 67–85. [Google Scholar] [CrossRef]
- Ashburner, M.; Ball, C.A.; Blake, J.A.; Botstein, D.; Butler, H.; Cherry, J.M.; Davis, A.P.; Dolinski, K.; Dwight, S.S.; Eppig, J.T.; et al. Gene ontology: Tool for the unification of biology. The Gene Ontology Consortium. Nat. Genet. 2000, 25, 25–29. [Google Scholar] [CrossRef]
- Gene Ontology Consortium. The Gene Ontology resource: Enriching a GOld mine. Nucleic Acids Res. 2021, 49, D325–D334. [Google Scholar] [CrossRef]
- Flicek, P.; Amode, M.R.; Barrell, D.; Beal, K.; Billis, K.; Brent, S.; Carvalho-Silva, D.; Clapham, P.; Coates, G.; Fitzgerald, S.; et al. Ensembl 2014. Nucleic Acids Res. 2014, 42, D749–D755. [Google Scholar] [CrossRef]
- Cunningham, F.; Allen, J.E.; Allen, J.; Alvarez-Jarreta, J.; Amode, M.R.; Armean, I.M.; Austine-Orimoloye, O.; Azov, A.G.; Barnes, I.; Bennett, R.; et al. Ensembl 2022. Nucleic Acids Res. 2022, 50, D988–D995. [Google Scholar] [CrossRef]
- Sud, M.; Fahy, E.; Cotter, D.; Brown, A.; Dennis, E.A.; Glass, C.K.; Merrill, A.H., Jr.; Murphy, R.C.; Raetz, C.R.; Russell, D.W.; et al. LMSD: LIPID MAPS structure database. Nucleic Acids Res. 2007, 35, D527–D532. [Google Scholar] [CrossRef] [PubMed]
- Fahy, E.; Subramaniam, S.; Murphy, R.C.; Nishijima, M.; Raetz, C.R.; Shimizu, T.; Spener, F.; van Meer, G.; Wakelam, M.J.; Dennis, E.A. Update of the LIPID MAPS comprehensive classification system for lipids. J. Lipid Res. 2009, 50 (Suppl.), S9–S14. [Google Scholar] [CrossRef] [PubMed]
- Sayers, E.W.; Bolton, E.E.; Brister, J.R.; Canese, K.; Chan, J.; Comeau, D.C.; Connor, R.; Funk, K.; Kelly, C.; Kim, S.; et al. Database resources of the national center for biotechnology information. Nucleic Acids Res. 2022, 50, D20–D26. [Google Scholar] [CrossRef]
- Hastings, J.; Owen, G.; Dekker, A.; Ennis, M.; Kale, N.; Muthukrishnan, V.; Turner, S.; Swainston, N.; Mendes, P.; Steinbeck, C. ChEBI in 2016: Improved services and an expanding collection of metabolites. Nucleic Acids Res. 2016, 44, D1214–D1219. [Google Scholar] [CrossRef]
- Degtyarenko, K.; de Matos, P.; Ennis, M.; Hastings, J.; Zbinden, M.; McNaught, A.; Alcántara, R.; Darsow, M.; Guedj, M.; Ashburner, M. ChEBI: A database and ontology for chemical entities of biological interest. Nucleic Acids Res. 2008, 36, D344–D350. [Google Scholar] [CrossRef] [PubMed]
- Seal, R.L.; Braschi, B.; Gray, K.; Jones, T.E.M.; Tweedie, S.; Haim-Vilmovsky, L.; Bruford, E.A. Genenames.org: The HGNC resources in 2023. Nucleic Acids Res. 2023, 51, D1003–D1009. [Google Scholar] [CrossRef]
- Heller, S.R.; McNaught, A.; Pletnev, I.; Stein, S.; Tchekhovskoi, D. InChI, the IUPAC International Chemical Identifier. J. Cheminform. 2015, 7, 23. [Google Scholar] [CrossRef]
- Kersey, P.J.; Allen, J.E.; Armean, I.; Boddu, S.; Bolt, B.J.; Carvalho-Silva, D.; Christensen, M.; Davis, P.; Falin, L.J.; Grabmueller, C.; et al. Ensembl Genomes 2016: More genomes, more complexity. Nucleic Acids Res. 2016, 44, D574–D580. [Google Scholar] [CrossRef]
- Gevorgyan, A.; Poolman, M.G.; Fell, D.A. Detection of stoichiometric inconsistencies in biomolecular models. Bioinformatics 2008, 24, 2245–2251. [Google Scholar] [CrossRef]
- Lieven, C.; Beber, M.E.; Olivier, B.G.; Bergmann, F.T.; Ataman, M.; Babaei, P.; Bartell, J.A.; Blank, L.M.; Chauhan, S.; Correia, K.; et al. MEMOTE for standardized genome-scale metabolic model testing. Nat. Biotechnol. 2020, 38, 272–276. [Google Scholar] [CrossRef]
- Le Novère, N.; Finney, A.; Hucka, M.; Bhalla, U.S.; Campagne, F.; Collado-Vides, J.; Crampin, E.J.; Halstead, M.; Klipp, E.; Mendes, P.; et al. Minimum information requested in the annotation of biochemical models (MIRIAM). Nat. Biotechnol. 2005, 23, 1509–1515. [Google Scholar] [CrossRef]
- Fritzemeier, C.J.; Hartleb, D.; Szappanos, B.; Papp, B.; Lercher, M.J. Erroneous energy-generating cycles in published genome scale metabolic networks: Identification and removal. PLoS Comput. Biol. 2017, 13, e1005494. [Google Scholar] [CrossRef]
- Thiele, I.; Palsson, B.Ø. A protocol for generating a high-quality genome-scale metabolic reconstruction. Nat. Protoc. 2010, 5, 93–121. [Google Scholar] [CrossRef] [PubMed]
- Ravikrishnan, A.; Raman, K. Critical assessment of genome-scale metabolic networks: The need for a unified standard. Brief Bioinform. 2015, 16, 1057–1068. [Google Scholar] [CrossRef] [PubMed]
- Han, X.; Gross, R.W. The foundations and development of lipidomics. J. Lipid Res. 2022, 63, 100164. [Google Scholar] [CrossRef] [PubMed]


Disclaimer/Publisher’s Note: The statements, opinions and data contained in all publications are solely those of the individual author(s) and contributor(s) and not of MDPI and/or the editor(s). MDPI and/or the editor(s) disclaim responsibility for any injury to people or property resulting from any ideas, methods, instructions or products referred to in the content. |
© 2023 by the authors. Licensee MDPI, Basel, Switzerland. This article is an open access article distributed under the terms and conditions of the Creative Commons Attribution (CC BY) license (https://creativecommons.org/licenses/by/4.0/).
Share and Cite
Marin de Mas, I.; Herand, H.; Carrasco, J.; Nielsen, L.K.; Johansson, P.I. A Protocol for the Automatic Construction of Highly Curated Genome-Scale Models of Human Metabolism. Bioengineering 2023, 10, 576. https://doi.org/10.3390/bioengineering10050576
Marin de Mas I, Herand H, Carrasco J, Nielsen LK, Johansson PI. A Protocol for the Automatic Construction of Highly Curated Genome-Scale Models of Human Metabolism. Bioengineering. 2023; 10(5):576. https://doi.org/10.3390/bioengineering10050576
Chicago/Turabian StyleMarin de Mas, Igor, Helena Herand, Jorge Carrasco, Lars K. Nielsen, and Pär I. Johansson. 2023. "A Protocol for the Automatic Construction of Highly Curated Genome-Scale Models of Human Metabolism" Bioengineering 10, no. 5: 576. https://doi.org/10.3390/bioengineering10050576