
Comparative Analysis of Three Facial Scanners for Creating Digital Twins by Focusing on the Difference in Scanning Method
 , ,
, ,
Abstract
:
1. Introduction
2. Materials and Methods
2.1. Patient Preparation
2.2. Facial Scanners and Scanning Procedure
2.3. CBCT
2.4. Superimposition and Digital Measurement
2.5. General Appearance
2.6. Statistical Analysis
3. Results
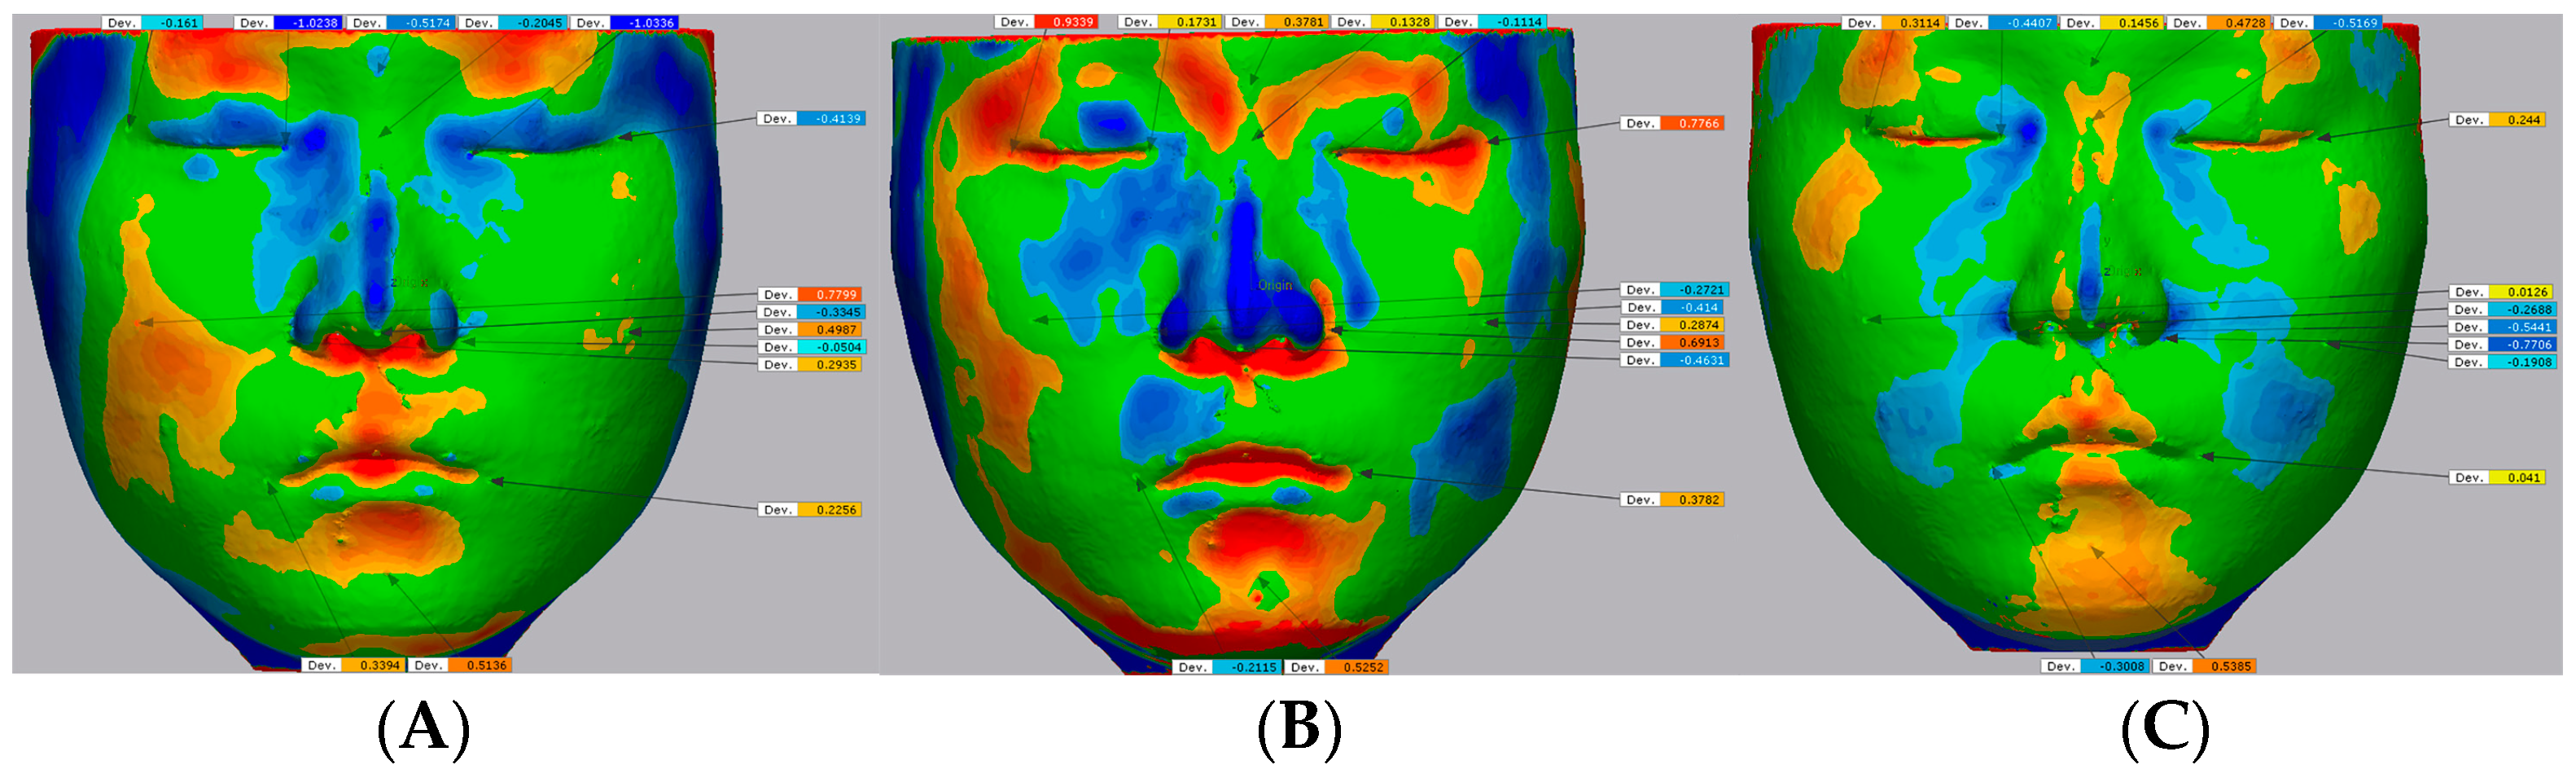
3.1. General Appearance
3.2. Statistical Analysis Results
4. Discussion
4.1. Significance of the Study
4.2. Comparison of Scanners
4.3. Limitations of the Study
5. Conclusions
Author Contributions
Funding
Institutional Review Board Statement
Informed Consent Statement
Data Availability Statement
Acknowledgments
Conflicts of Interest
References
- Carvalho, P.E.G.; Ortega, A.d.O.; Maeda, F.A.; da Silva, L.H.; Carvalho, V.G.G.; Torres, F.C. Digital scanning in modern orthodontics. Curr. Oral Health Rep. 2019, 6, 269–276. [Google Scholar] [CrossRef]
- Emera, R.M.K. Prosthetic reconstruction of maxillo-facial defects by means of 3d optical reverse engineering and prototyping: A review article. Dent. J. 2012, 58, 2639. [Google Scholar]
- Choi, J.W.; Lee, J.Y.; Oh, T.-S.; Kwon, S.M.; Yang, S.J.; Koh, K.S. Frontal soft tissue analysis using a 3 dimensional camera following two-jaw rotational orthognathic surgery in skeletal class III patients. J. Cranio-Maxillofac. Surg. 2014, 42, 220–226. [Google Scholar] [CrossRef] [PubMed]
- Verhoeven, T.; Coppen, C.; Barkhuysen, R.; Bronkhorst, E.; Merkx, M.; Bergé, S.; Maal, T. Three dimensional evaluation of facial asymmetry after mandibular reconstruction: Validation of a new method using stereophotogrammetry. Int. J. Oral Maxillofac. Surg. 2013, 42, 19–25. [Google Scholar] [CrossRef] [PubMed]
- Bruynseels, K.; Santoni de Sio, F.; Van den Hoven, J. Digital twins in health care: Ethical implications of an emerging engineering paradigm. Front. Genet. 2018, 9, 31. [Google Scholar] [CrossRef] [PubMed]
- Jacobson, A.; Jacobson, R. Radiographic Cephalometry: From Basics to 3-D Imaging: Quintessence Pub; Quintessence Pub Co.: Batavia, IL, USA, 2006. [Google Scholar]
- Plooij, J.; Swennen, G.; Rangel, F.; Maal, T.; Schutyser, F.; Bronkhorst, E.; Kuijpers–Jagtman, A.M.; Bergé, S. Evaluation of reproducibility and reliability of 3D soft tissue analysis using 3D stereophotogrammetry. Int. J. Oral Maxillofac. Surg. 2009, 38, 267–273. [Google Scholar] [CrossRef] [PubMed]
- Mailey, B.; Baker, J.L.; Hosseini, A.; Collins, J.; Suliman, A.; Wallace, A.M.; Cohen, S.R. Evaluation of facial volume changes after rejuvenation surgery using a 3-dimensional camera. Aesthetic Surg. J. 2015, 36, 379–387. [Google Scholar] [CrossRef]
- Ohno, K.; Kawahara, T.; Tadokoro, S. Development of 3D laser scanner for measuring uniform and dense 3D shapes of static objects in dynamic environment. In Proceedings of the 2008 IEEE International Conference on Robotics and Biomimetics, Bangkok, Thailand, 22–25 February 2009; pp. 2161–2167. [Google Scholar]
- Georgopoulos, A.; Ioannidis, C.; Valanis, A. Assessing the performance of a structured light scanner. Int. Arch. Photogramm. Remote Sens. Spat. Inf. Sci. 2010, 38, 251–255. [Google Scholar]
- Maal, T.J.J.; Verhamme, L.M.; van Loon, B.; Plooij, J.M.; Rangel, F.A.; Kho, A.; Bronkhorst, E.M.; Bergé, S.J. Variation of the face in rest using 3D stereophotogrammetry. Int. J. Oral Maxillofac. Surg. 2011, 40, 1252–1257. [Google Scholar] [CrossRef]
- Gibelli, D.; Pucciarelli, V.; Poppa, P.; Cummaudo, M.; Dolci, C.; Cattaneo, C.; Sforza, C. Three-dimensional facial anatomy evaluation: Reliability of laser scanner consecutive scans procedure in comparison with stereophotogrammetry. J. Cranio-Maxillofac. Surg. 2018, 46, 1807–1813. [Google Scholar] [CrossRef]
- Zhao, Y.; Xiong, Y.-X.; Wang, Y. Three-dimensional accuracy of facial scan for facial deformities in clinics: A new evaluation method for facial scanner accuracy. PLoS ONE 2017, 12, e0169402. [Google Scholar] [CrossRef]
- Koban, K.C.; Perko, P.; Etzel, L.; Li, Z.; Schenck, T.L.; Giunta, R.E. Validation of two handheld devices against a non-portable three-dimensional surface scanner and assessment of potential use for intraoperative facial imaging. J. Plast. Reconstr. Aesthetic Surg. 2020, 73, 141–148. [Google Scholar] [CrossRef] [PubMed]
- Hasegawa, A.; Shinya, A.; Lassila, L.V.J.; Yokoyama, D.; Nakasone, Y.; Vallittu, P.K.; Shinya, A. Accuracy of three-dimensional finite element modeling using two different dental cone beam computed tomography systems. Odontology 2013, 101, 210–215. [Google Scholar] [CrossRef] [PubMed]
- Son, K.; Lee, W.S.; Lee, K.B. Effect of different software programs on the accuracy of dental scanner using three-dimensional analysis. Int. J. Environ. Res. Public Health 2021, 18, 8449. [Google Scholar] [CrossRef] [PubMed]
- O’Toole, S.; Osnes, C.; Bartlett, D.; Keeling, A. Investigation into the accuracy and measurement methods of sequential 3D dental scan alignment. Dent. Mater. 2019, 35, 495–500. [Google Scholar] [CrossRef]
- Henprasert, P.; Dawson, D.V.; El-Kerdani, T.; Song, X.; Couso-Queiruga, E.; Holloway, J.A. Comparison of the accuracy of implant position using surgical guides fabricated by additive and subtractive techniques. J. Prosthodont. 2020, 29, 534–541. [Google Scholar] [CrossRef]
- Kau, C.H.; Richmond, S.; Zhurov, A.; Ovsenik, M.; Tawfik, W.; Borbely, P.; English, J.D. Use of 3-dimensional surface acquisition to study facial morphology in 5 populations. Am. J. Orthod. Dentofac. Orthop. 2010, 137, S56.e51–S56.e59. [Google Scholar] [CrossRef]
- Verhoeven, T.; Xi, T.; Schreurs, R.; Bergé, S.; Maal, T. Quantification of facial asymmetry: A comparative study of landmark-based and surface-based registrations. J. Cranio-Maxillofac. Surg. 2016, 44, 1131–1136. [Google Scholar] [CrossRef]
- Weinberg, S.M.; Naidoo, S.; Govier, D.P.; Martin, R.A.; Kane, A.A.; Marazita, M.L. Anthropometric precision and accuracy of digital three-dimensional photogrammetry: Comparing the Genex and 3dMD Imaging systems with one another and with direct anthropometry. J. Craniofac. Surg. 2006, 17, 477–483. [Google Scholar] [CrossRef]
- Ma, L.; Xu, T.; Lin, J. Validation of a three-dimensional facial scanning system based on structured light techniques. Comput. Methods Programs Biomed. 2009, 94, 290–298. [Google Scholar] [CrossRef] [PubMed]
- Li, G.; Wei, J.; Wang, X.; Wu, G.; Ma, D.; Wang, B.; Liu, Y.; Feng, X. Three-dimensional facial anthropometry of unilateral cleft lip infants with a structured light scanning system. J. Plast. Reconstr. Aesthetic Surg. 2013, 66, 1109–1116. [Google Scholar] [CrossRef] [PubMed]
- Ye, H.; Lv, L.; Liu, Y.; Liu, Y.; Zhou, Y. Evaluation of the accuracy, reliability, and reproducibility of two different 3D face-scanning systems. Int. J. Prosthodont. 2016, 29, 213–218. [Google Scholar] [CrossRef] [PubMed]
- Liu, C.; Artopoulos, A. Validation of a low-cost porTable 3-dimensional face scanner. Imaging Sci. Dent. 2019, 49, 35–43. [Google Scholar] [CrossRef]
- Piedra-Cascón, W.; Meyer, M.J.; Methani, M.M.; Revilla-León, M. Accuracy (trueness and precision) of a dual-structured light facial scanner and interexaminer reliability. J. Prosthet. Dent. 2020, 124, 567–574. [Google Scholar] [CrossRef]
- De Sá Gomes, C.F.; Libdy, M.R.; Normando, D. Scan time, reliability and accuracy of craniofacial measurements using a 3D light scanner. J. Oral Biol. Craniofac. Res. 2019, 9, 331–335. [Google Scholar] [CrossRef]
- Celakil, T.; Özcan, M. Evaluation of reliability of face scanning using a new depth camera. Int. J. Esthet. Dent. 2021, 16, 324–337. [Google Scholar]
- Modabber, A.; Peters, F.; Kniha, K.; Goloborodko, E.; Ghassemi, A.; Lethaus, B.; Hölzle, F.; Möhlhenrich, S.C. Evaluation of the accuracy of a mobile and a stationary system for three-dimensional facial scanning. J. Cranio-Maxillofac. Surg. 2016, 44, 1719–1724. [Google Scholar] [CrossRef]
- Kacmarcik, J.; Zaimovic-Uzunovic, N.; Lemes, S. Reverse Engineering Using 3D Scanning and FEM Analysis. In Proceedings of the New Technologies, Development and Application III, Sarajevo, Bosnia and Herzegovina, 25–27 June 2020; Springer International Publishing: Cham, Switzerland, 2020; pp. 285–291. [Google Scholar]
- Liu, S.; Srinivasan, M.; Mörzinger, R.; Lancelle, M.; Beeler, T.; Gross, M.; Solenthaler, B.; Fehmer, V.; Sailer, I. Reliability of a three-dimensional facial camera for dental and medical applications: A pilot study. J. Prosthet. Dent. 2019, 122, 282–287. [Google Scholar] [CrossRef]
- Da Silva Marques, D.N.; Aparício Aguiar Alves, R.V.; Marques Pinto, R.J.; Bártolo Caramês, J.R.; de Oliveira Francisco, H.C.; Mendez Caramês, J.M. Facial scanner accuracy with different superimposition methods—In vivo study. Int. J. Prosthodont. 2021, 34, 578–584. [Google Scholar] [CrossRef]


| Scanner 1 | Scanner 2 | Scanner 3 | |
|---|---|---|---|
| Photo |  |  |  |
| Product | RayFACE (RFS100) | MegaGen Face scanner Intel® RealSense™ Depth Camera SR305 * | Artec Eva |
| Company | Ray Co., Ltd. (Hwaseong, Republic of Korea) | MegaGen Implant Co., Ltd. (Daegu, Republic of Korea) Intel® * | Artec 3D (Luxembourg, Luxembourg) |
| Hardware | Horizontally curvilinear shaped, cameras at the middle, right and left side | Standing type with a camera inserted in the arm, which rotates horizontally over the head of the patients | Handheld scanner with flash bulb |
| Portability | Not feasible | Not feasible | Portable device |
| Surface imaging technology | Dual structured light | Coded light (rolling shutter) | Structured light |
| Lens | Nine cameras (3 cameras from 3 angles, 2 RGB cameras, and one depth camera at each angle) | One camera (depth camera with 2MP RGB sensor) |
Three cameras (top, middle, bottom of the machine, middle camera surrounded by flash LEDs to get texture information) |
| Resolution | 2 Mega Pixel | Depth 640 × 480 pixel RGB 1920 × 1080 (30 fps) | 0.2 mm |
| Acquisition time | 0.5 s | 14 s | 15–25 s ** |
| Dimensions (H × W × Dia.) | 813 mm × 500 mm × 550 mm | 2013 mm × 1000 mm × 925 mm | 261.5 mm × 158.2 mm × 63.7 mm |
| Field-of-view | 550 mm × 310 mm | Depth: 69° ± 3° × 54° ± 2° RGB Sensor: 68° × 41.5° (±2°) | 400–1000 mm × 400–1000 mm |
| Weight | 12 kg/26.5 lbs | Not measured | 0.9 kg |
| Output formats | STL, OBJ, Polygon file format | OBJ | All formats (STL, OBJ, PLY) |
| Power | Power cord | Power cord | Power cord |
| Processing Software | RAYFace | Dt3DScan | Artec Studio 17 |
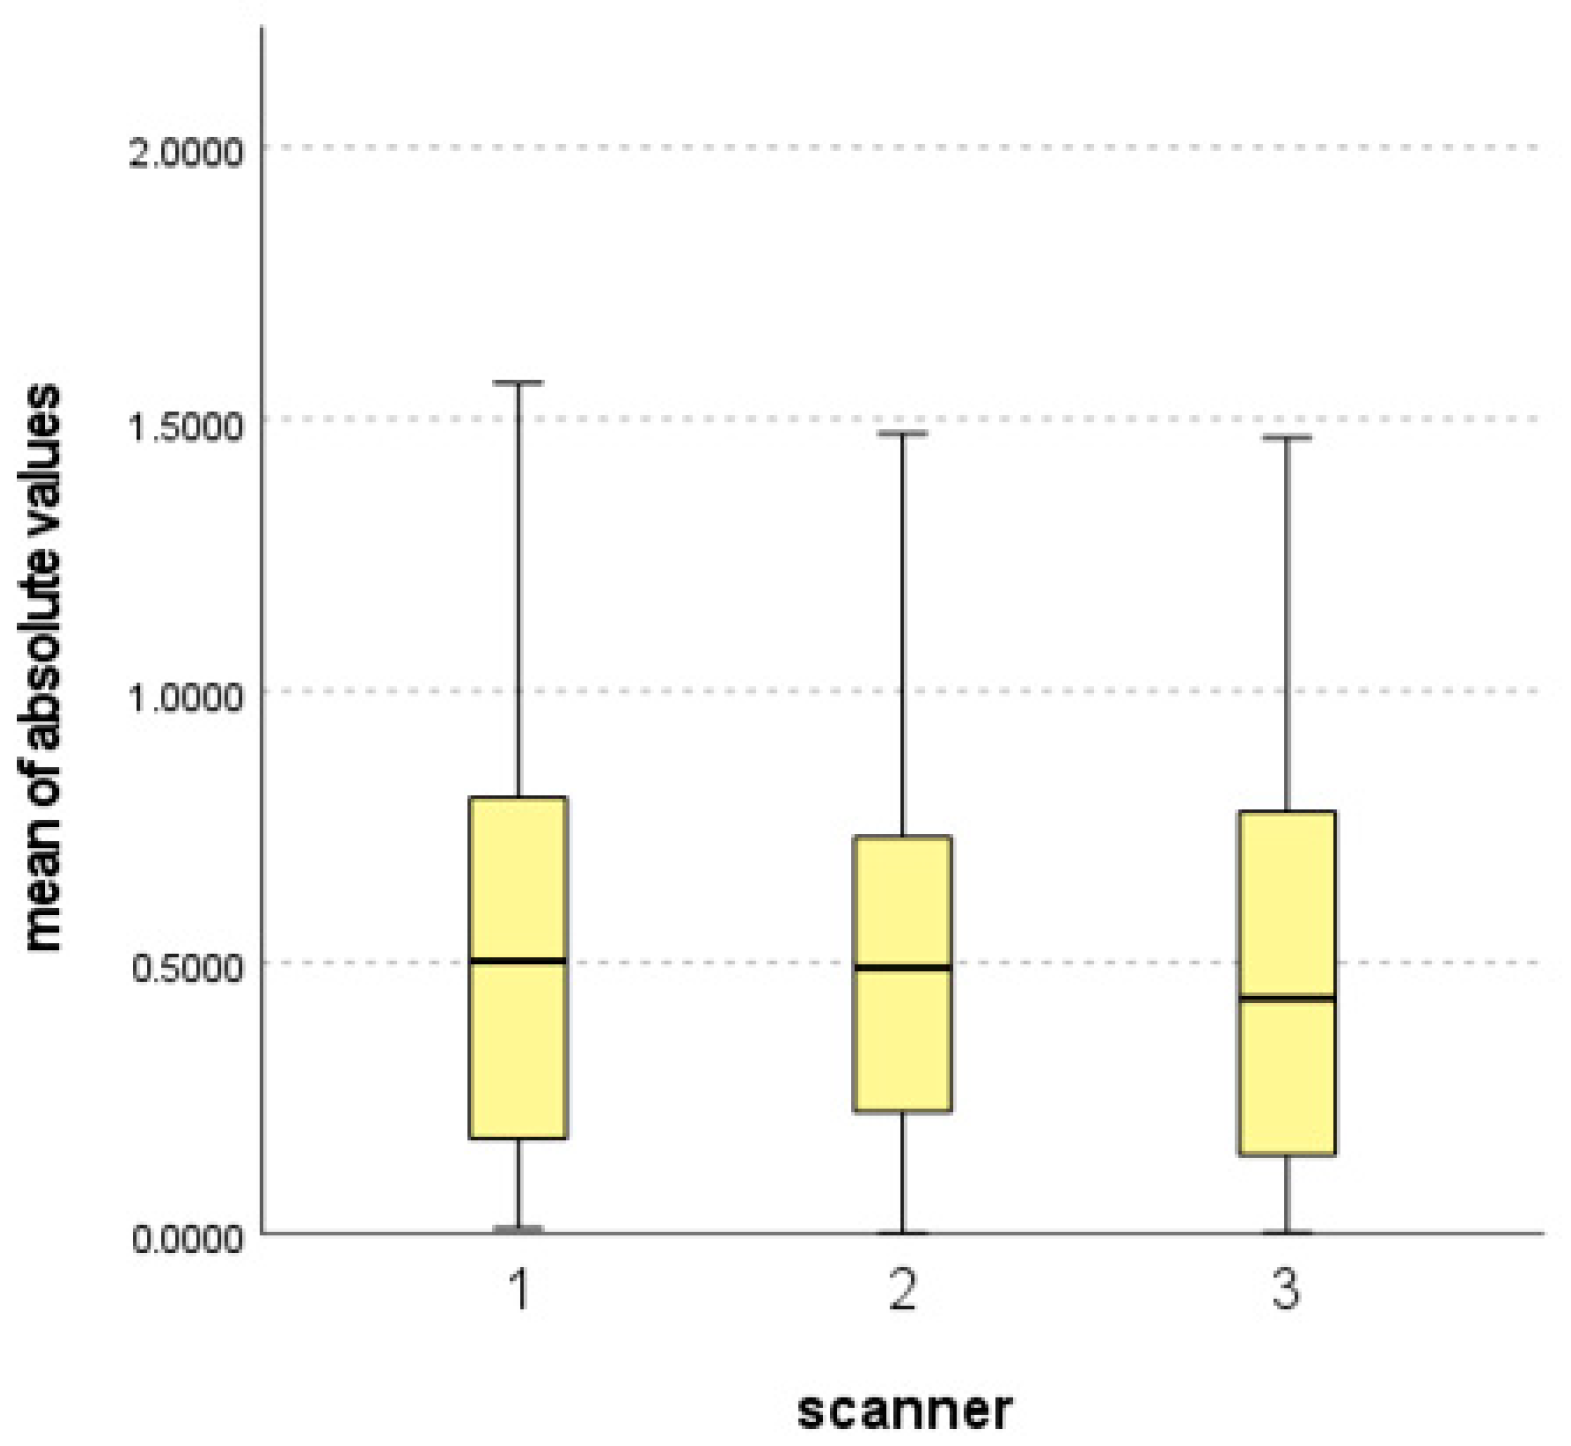
| Scanner | Mean (SD) | p-Value |
|---|---|---|
| 1 | 0.5277 (0.3717) | 0.559 |
| 2 | 0.5098 (0.3484) | |
| 3 | 0.4823 (0.3594) |
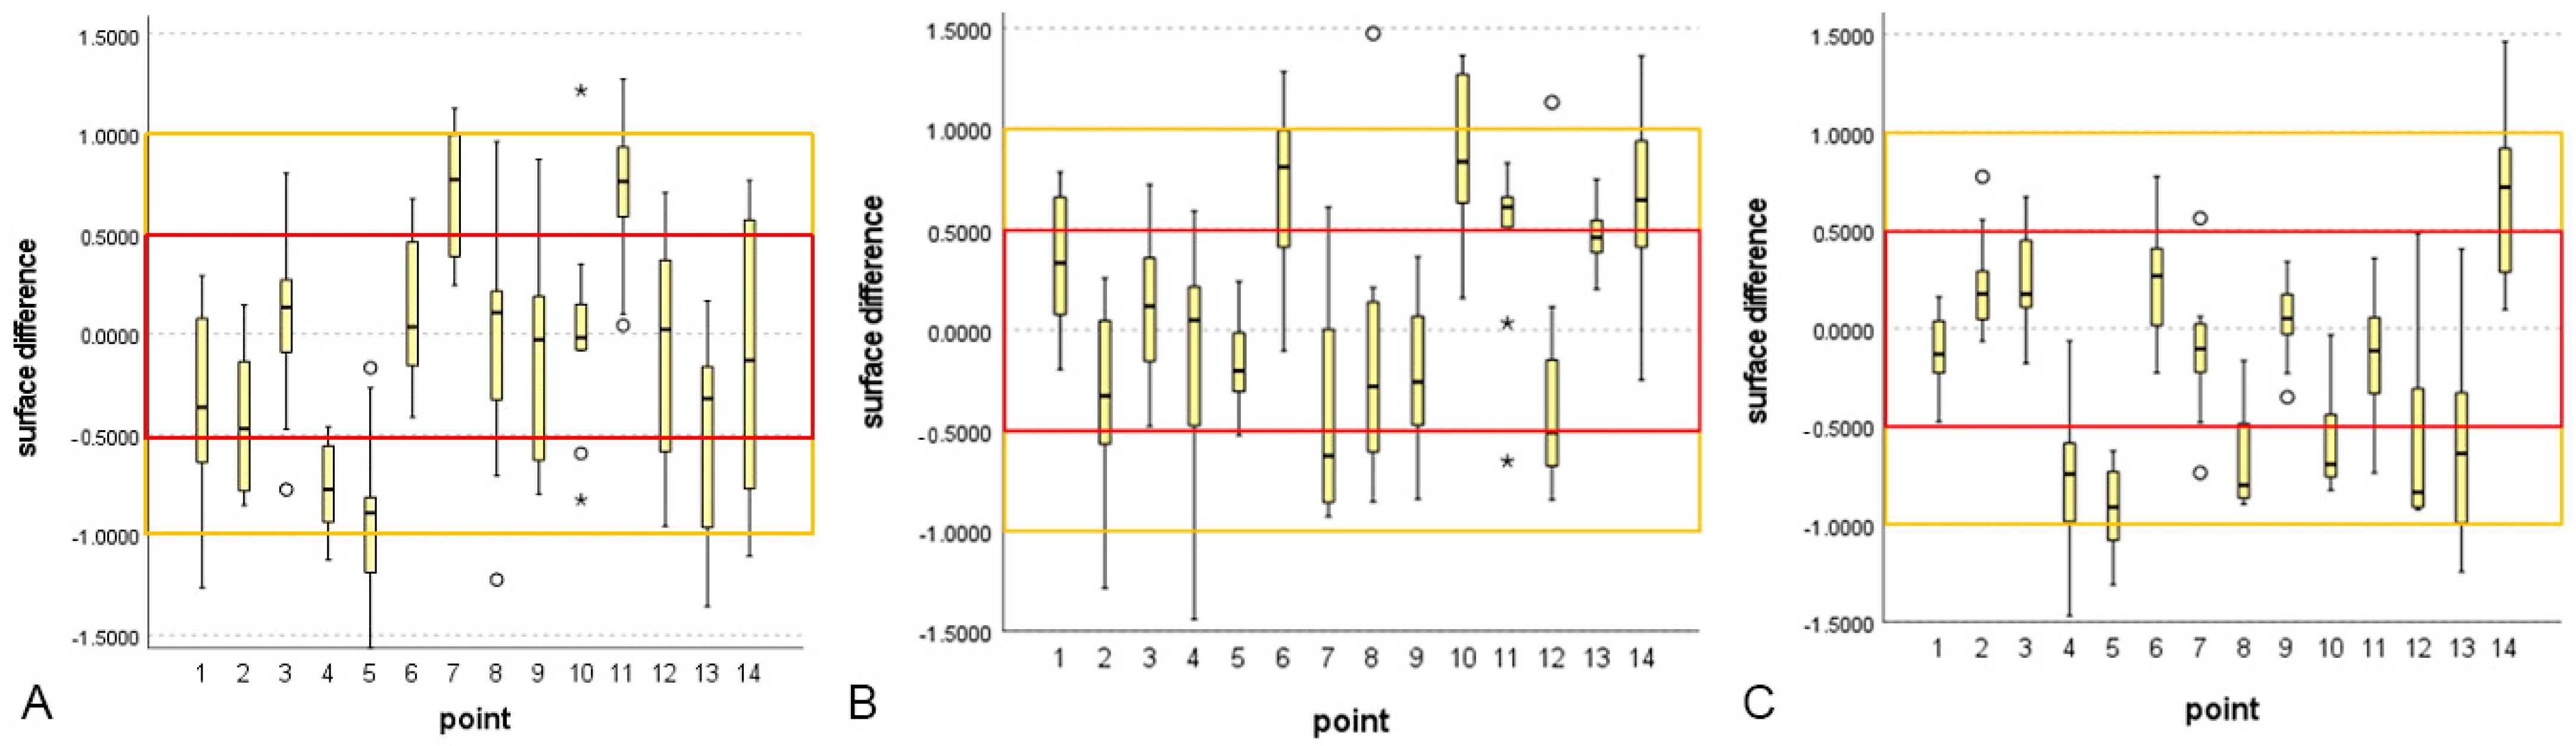
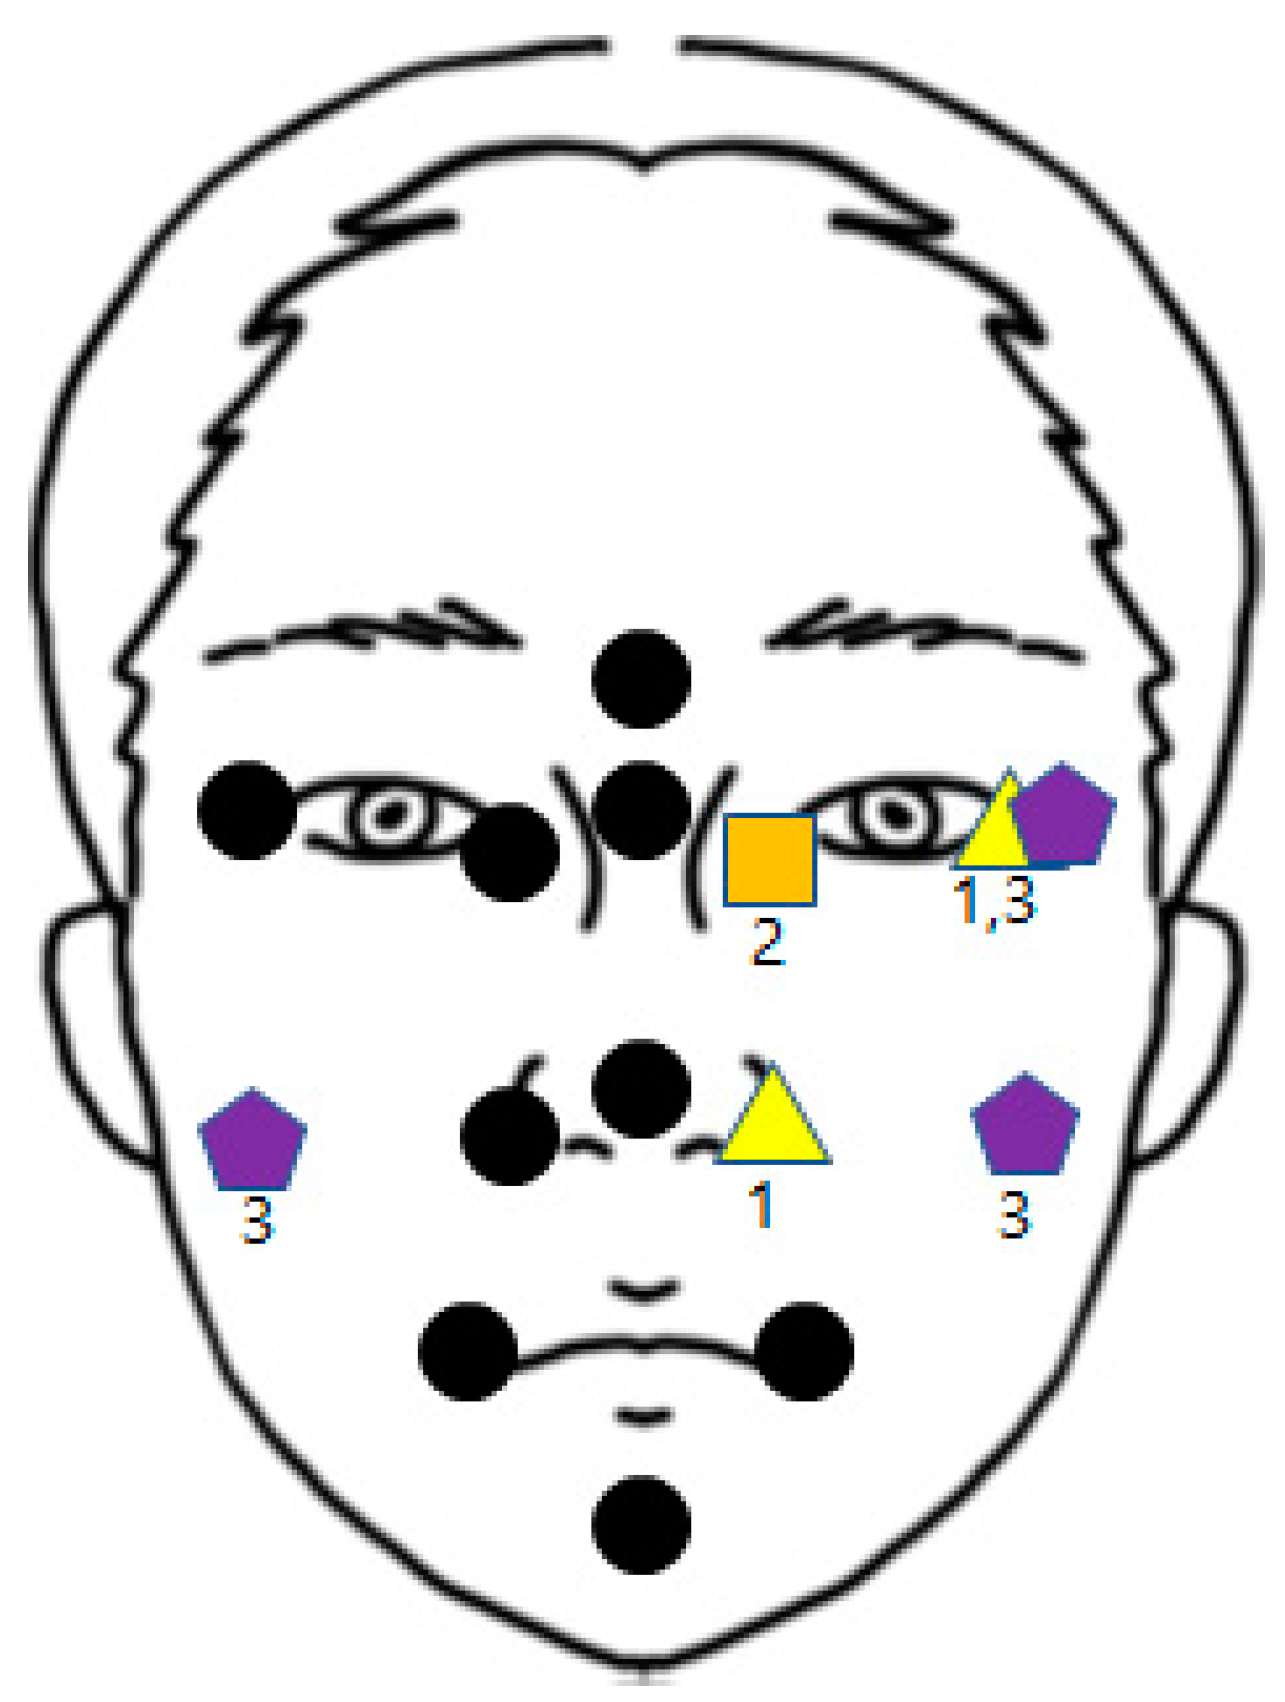
| Point | Mean (SD) | ||
|---|---|---|---|
| Scanner 1 | Scanner 2 | Scanner 3 | |
| 1 | −0.3253 (0.4678) | 0.3392 (0.3554) | −0.1183 (0.1989) |
| 2 | −0.4054 (0.3690) | −0.3396 (0.4441) | 0.2272 (0.2634) |
| 3 | 0.0612 (0.4404) | 0.1297 (0.3725) | 0.2328 (0.2607) |
| 4 | −0.7544 (0.2196) | −0.1774 (0.6493) | −0.7864 (0.3807) |
| 5 | −0.8957 (0.4364) | −0.1862 (0.2393) | -0.9172 (0.2147) |
| 6 | 0.1095 (0.3647) | 0.7075 (0.4166) | 0.2407 (0.3134) |
| 7 | 0.6839 (0.3202) | −0.4093 (0.5304) | −0.1203 (0.3441) |
| 8 | −0.0018 (0.6498) | −0.1278 (0.6522) | −0.6653 (0.2525) |
| 9 | −0.1244 (0.5197) | −0.1986 (0.3845) | 0.0479 (0.2234) |
| 10 | 0.0248 (0.5453) | 0.8559 (0.3859) | −0.5992 (0.2445) |
| 11 | 0.7021 (0.3955) | 0.4638 (0.4502) | −0.1501 (0.3230) |
| 12 | −0.1282 (0.5815) | −0.2921 (0.5779) | −0.6178 (0.4579) |
| 13 | −0.4812 (0.4805) | 0.4797 (0.1629) | −0.5937 (0.4828) |
| 14 | −0.1653 (0.7032) | 0.6639 (0.4426) | 0.6976 (0.5597) |
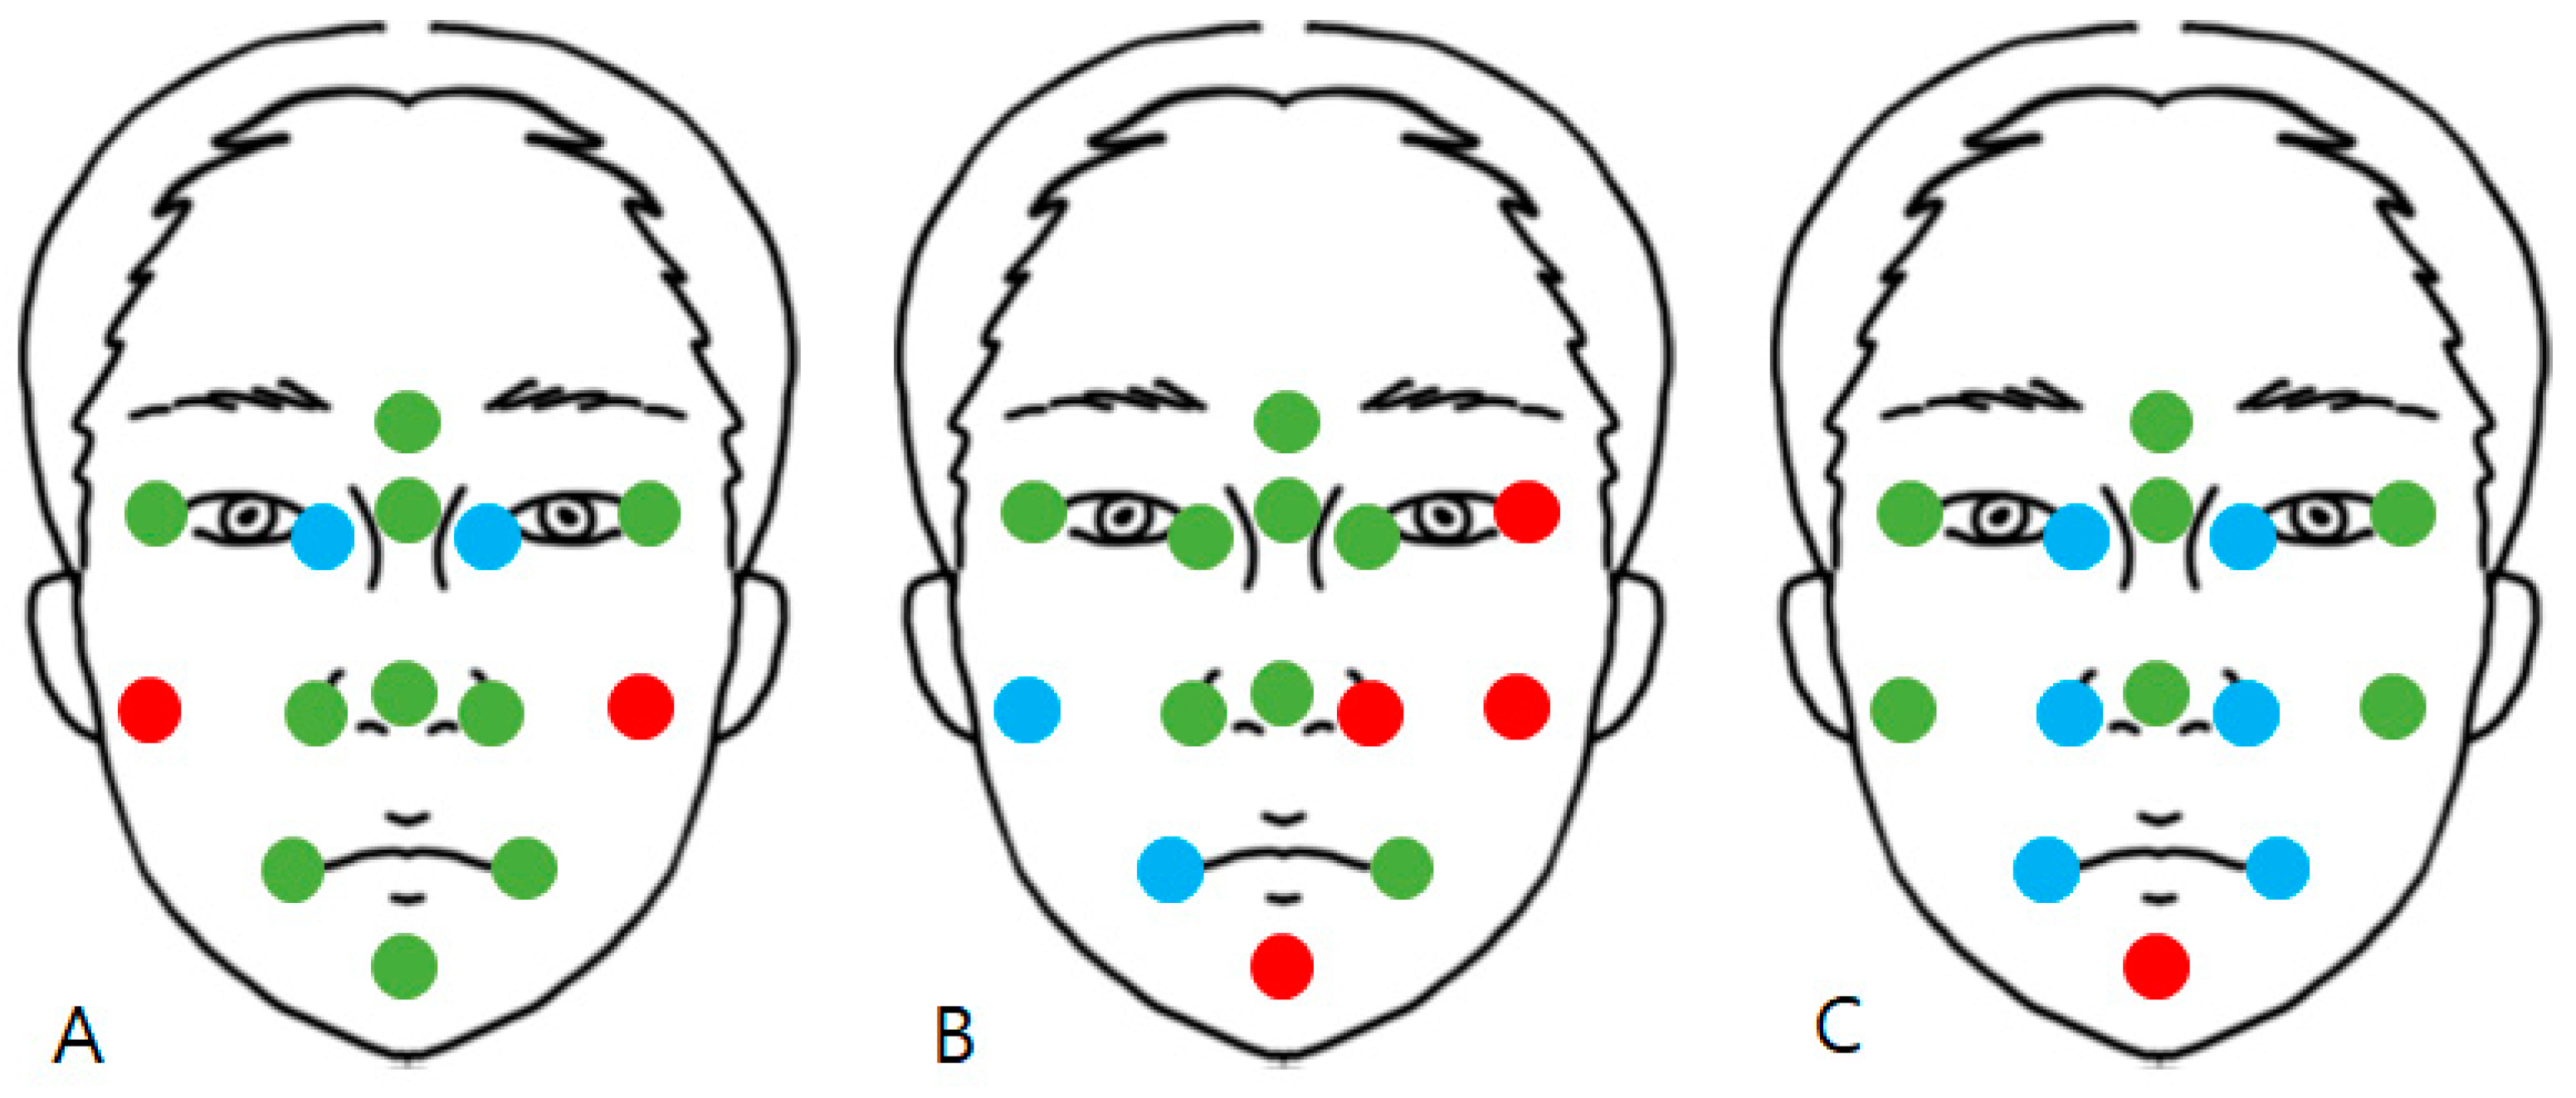
| Point | Significance Level | Post Hoc Test * | Comparison by Scanners ** |
|---|---|---|---|
| 1 | 0.660 | 1 = 2 = 3 | |
| 2 | 0.171 | 1 = 2 = 3 | |
| 3 | 0.951 | 1 = 2 = 3 | |
| 4 | 0.070 | 1 = 2 = 3 | |
| 5 | 0.000 | S2–S1: 0.003, S2–S3: 0.001, S1–S3: 1.000 | 2 > 1 = 3 |
| 6 | 0.013 | S3–S1: 1.000, S3–S2: 0.029, S1–S2: 0.036 | 1 = 3 > 2 |
| 7 | 0.018 | S3–S2: 0.170, S3–S1: 0.16, S2–S1: 1.000 | 3 > 1 = 2 |
| 8 | 0.229 | 1 = 2 = 3 | |
| 9 | 0.107 | 1 = 2 = 3 | |
| 10 | 0.015 | S1–S3: 0.586, S1–S2: 0.011, S3–S2: 0.329 | 1 > 2 = 3 |
| 11 | 0.015 | S3–S2: 0.105, S3–S1: 0.017, S2–S1: 1.000 | 3 > 1 = 2 |
| 12 | 0.259 | 1 = 2 = 3 | |
| 13 | 0.359 | 1 = 2 = 3 | |
| 14 | 0.792 | 1 = 2 = 3 |
Disclaimer/Publisher’s Note: The statements, opinions and data contained in all publications are solely those of the individual author(s) and contributor(s) and not of MDPI and/or the editor(s). MDPI and/or the editor(s) disclaim responsibility for any injury to people or property resulting from any ideas, methods, instructions or products referred to in the content. |
© 2023 by the authors. Licensee MDPI, Basel, Switzerland. This article is an open access article distributed under the terms and conditions of the Creative Commons Attribution (CC BY) license (https://creativecommons.org/licenses/by/4.0/).
Share and Cite
Cho, R.-Y.; Byun, S.-H.; Yi, S.-M.; Ahn, H.-J.; Nam, Y.-S.; Park, I.-Y.; On, S.-W.; Kim, J.-C.; Yang, B.-E. Comparative Analysis of Three Facial Scanners for Creating Digital Twins by Focusing on the Difference in Scanning Method. Bioengineering 2023, 10, 545. https://doi.org/10.3390/bioengineering10050545
Cho R-Y, Byun S-H, Yi S-M, Ahn H-J, Nam Y-S, Park I-Y, On S-W, Kim J-C, Yang B-E. Comparative Analysis of Three Facial Scanners for Creating Digital Twins by Focusing on the Difference in Scanning Method. Bioengineering. 2023; 10(5):545. https://doi.org/10.3390/bioengineering10050545
Chicago/Turabian StyleCho, Ran-Yeong, Soo-Hwan Byun, Sang-Min Yi, Hee-Ju Ahn, Yoo-Sung Nam, In-Young Park, Sung-Woon On, Jong-Cheol Kim, and Byoung-Eun Yang. 2023. "Comparative Analysis of Three Facial Scanners for Creating Digital Twins by Focusing on the Difference in Scanning Method" Bioengineering 10, no. 5: 545. https://doi.org/10.3390/bioengineering10050545