
Swept-Source OCT Mid-Peripheral Retinal Irregularity in Retinal Detachment and Posterior Vitreous Detachment Eyes
 , ,
, ,
Abstract
:1. Introduction
2. Materials and Methods
2.1. Subjects
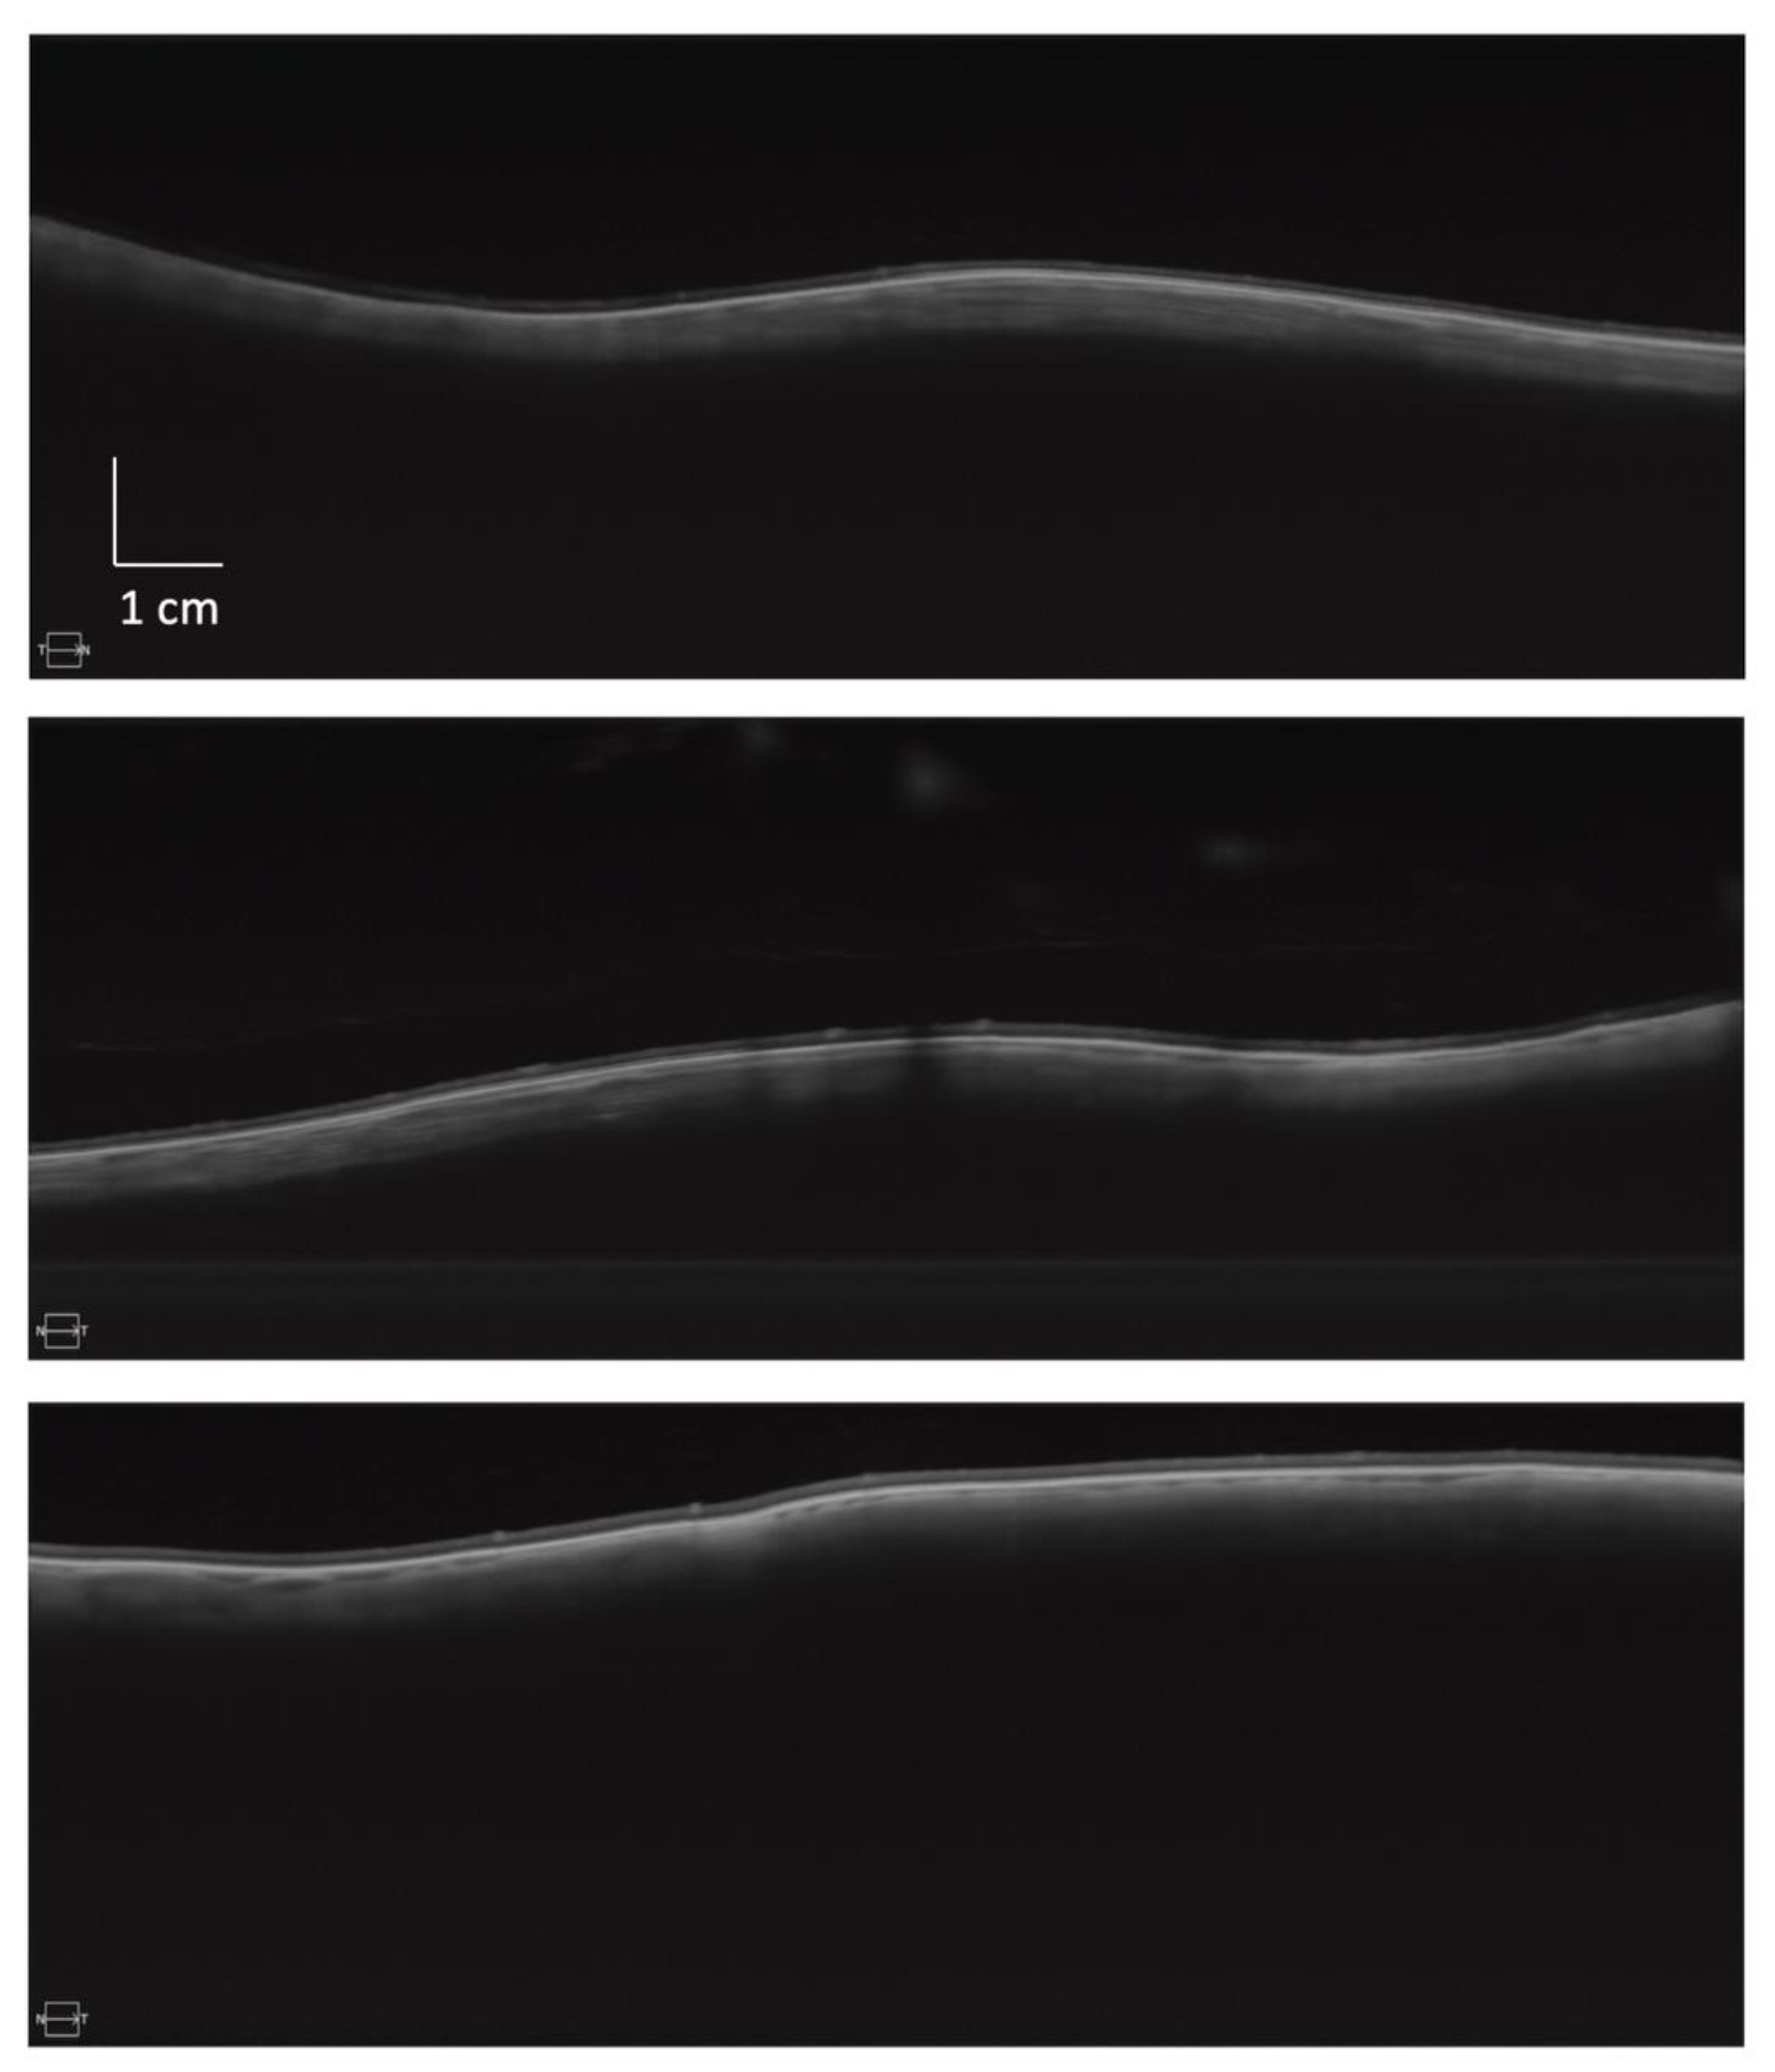
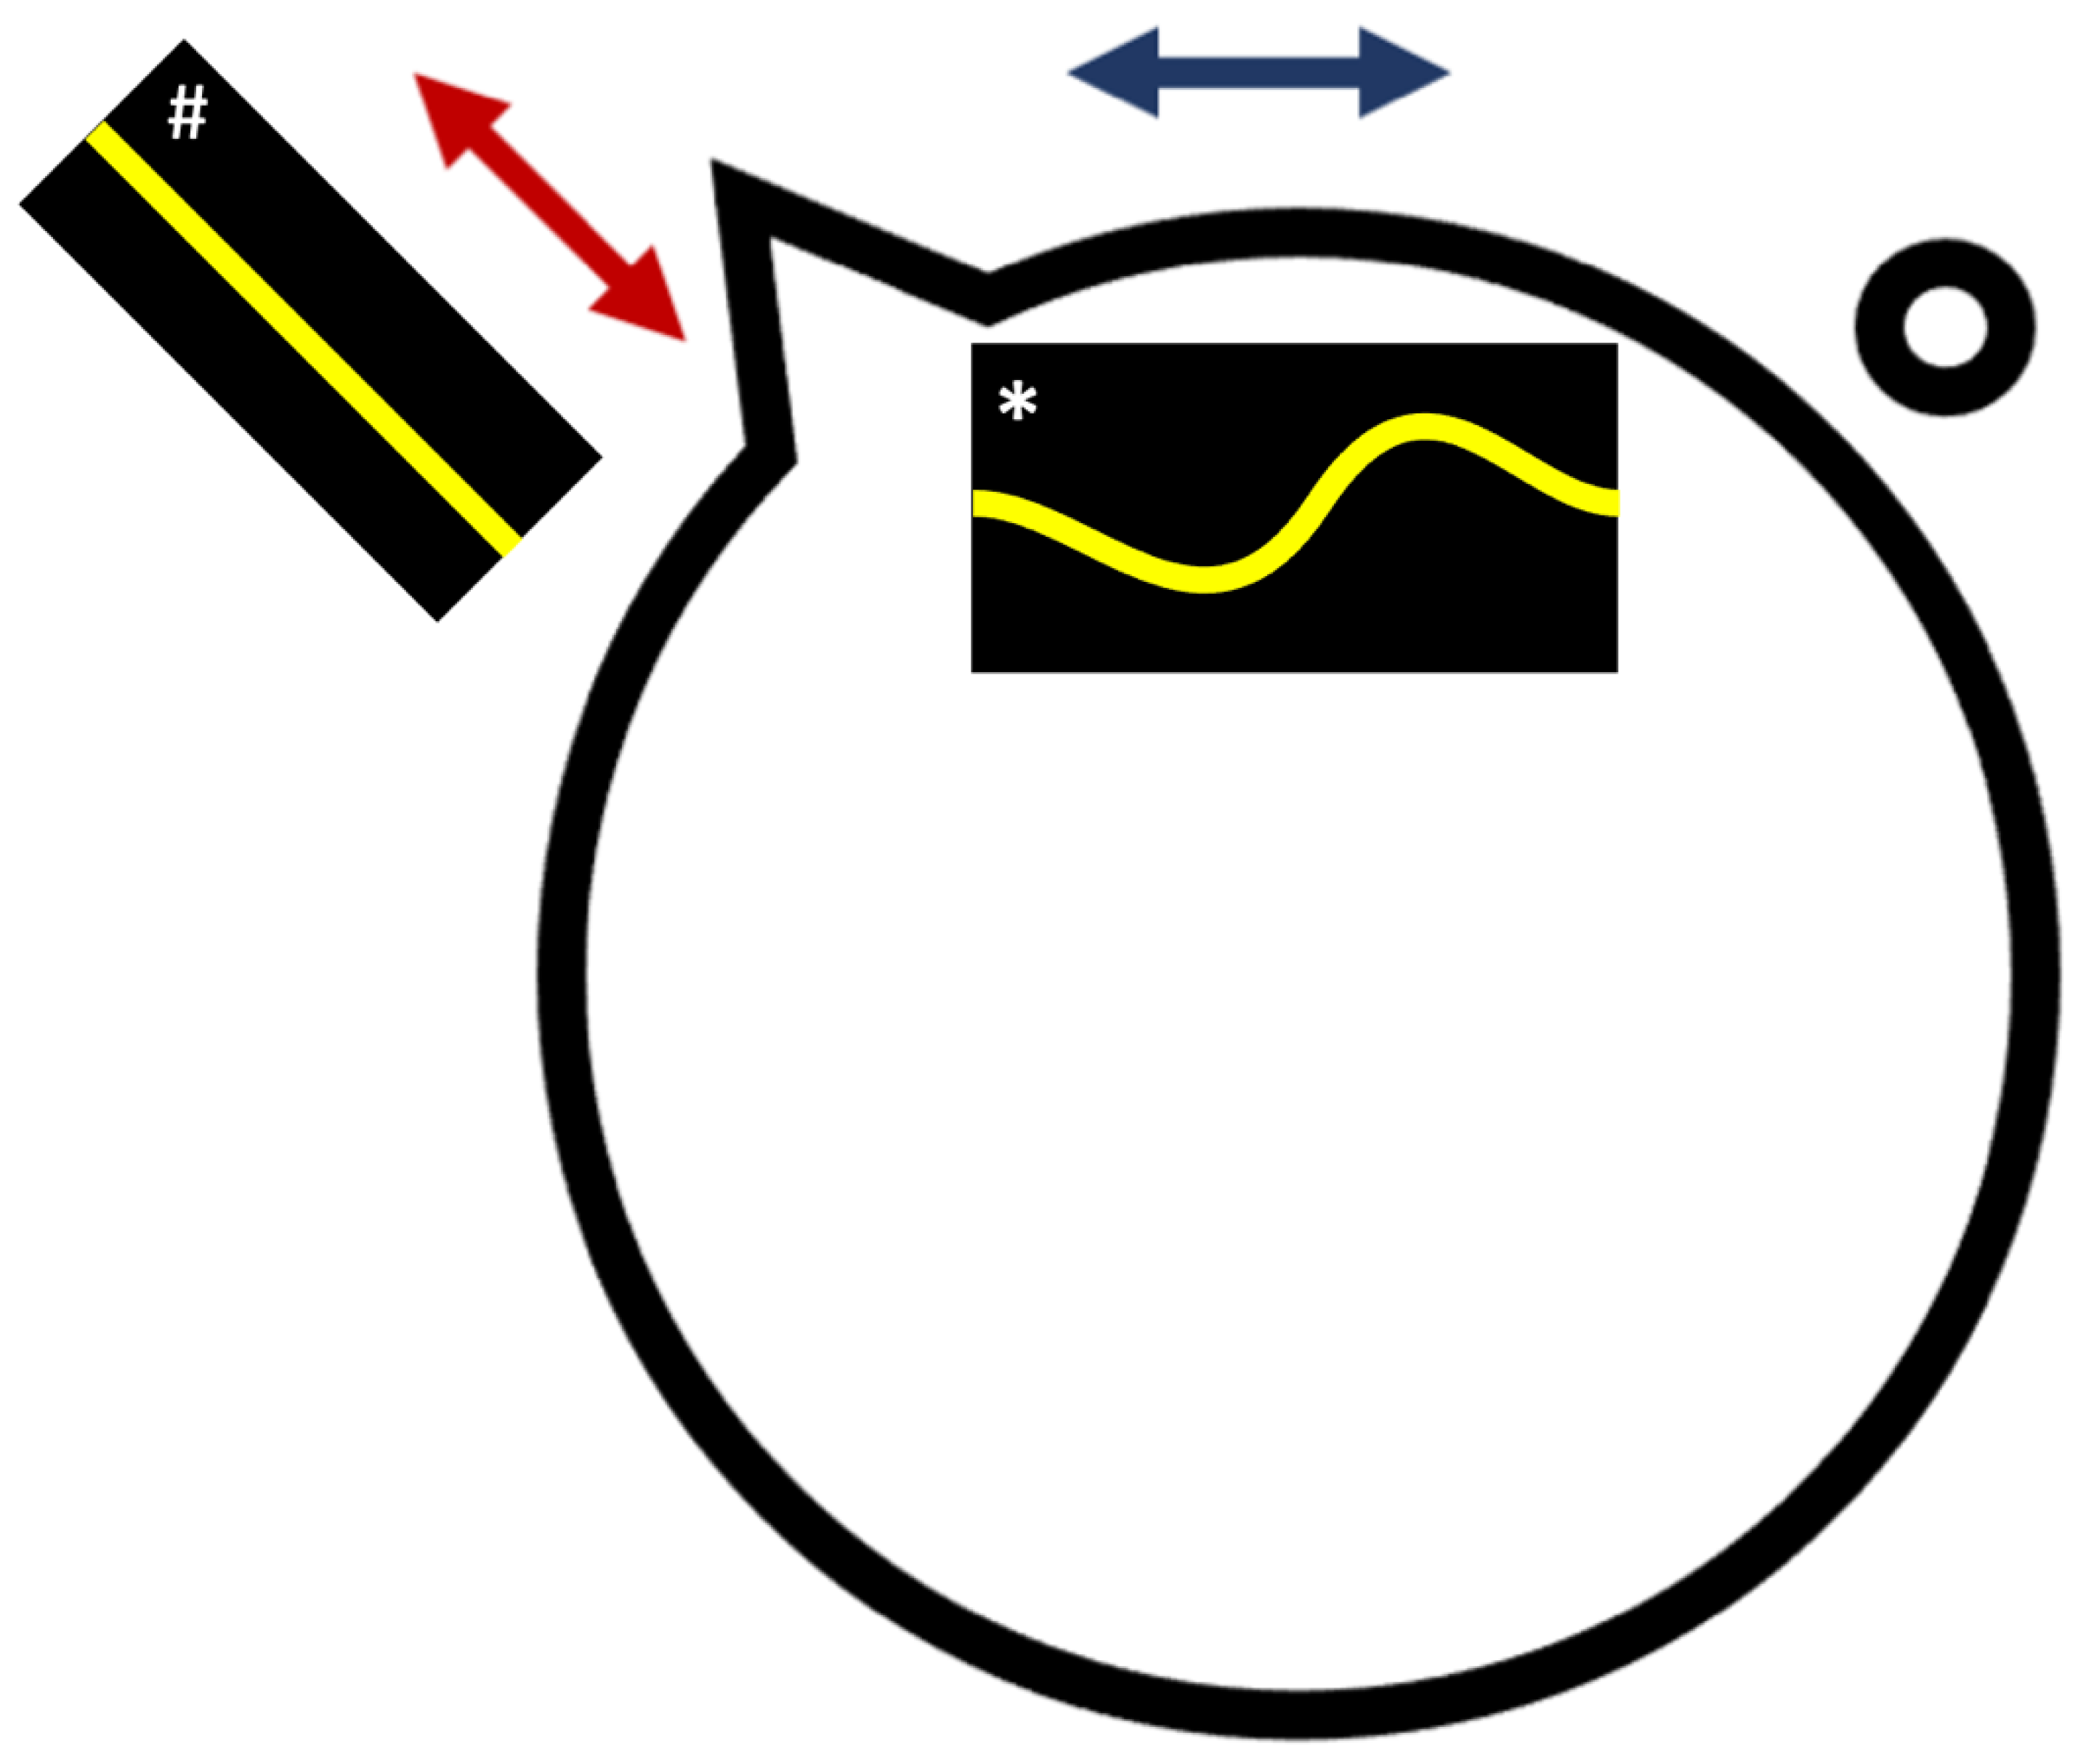
2.2. Image Capture
2.3. Image Processing
2.4. Statistical Methods
2.5. Feature Selection
3. Results
3.1. Subjects
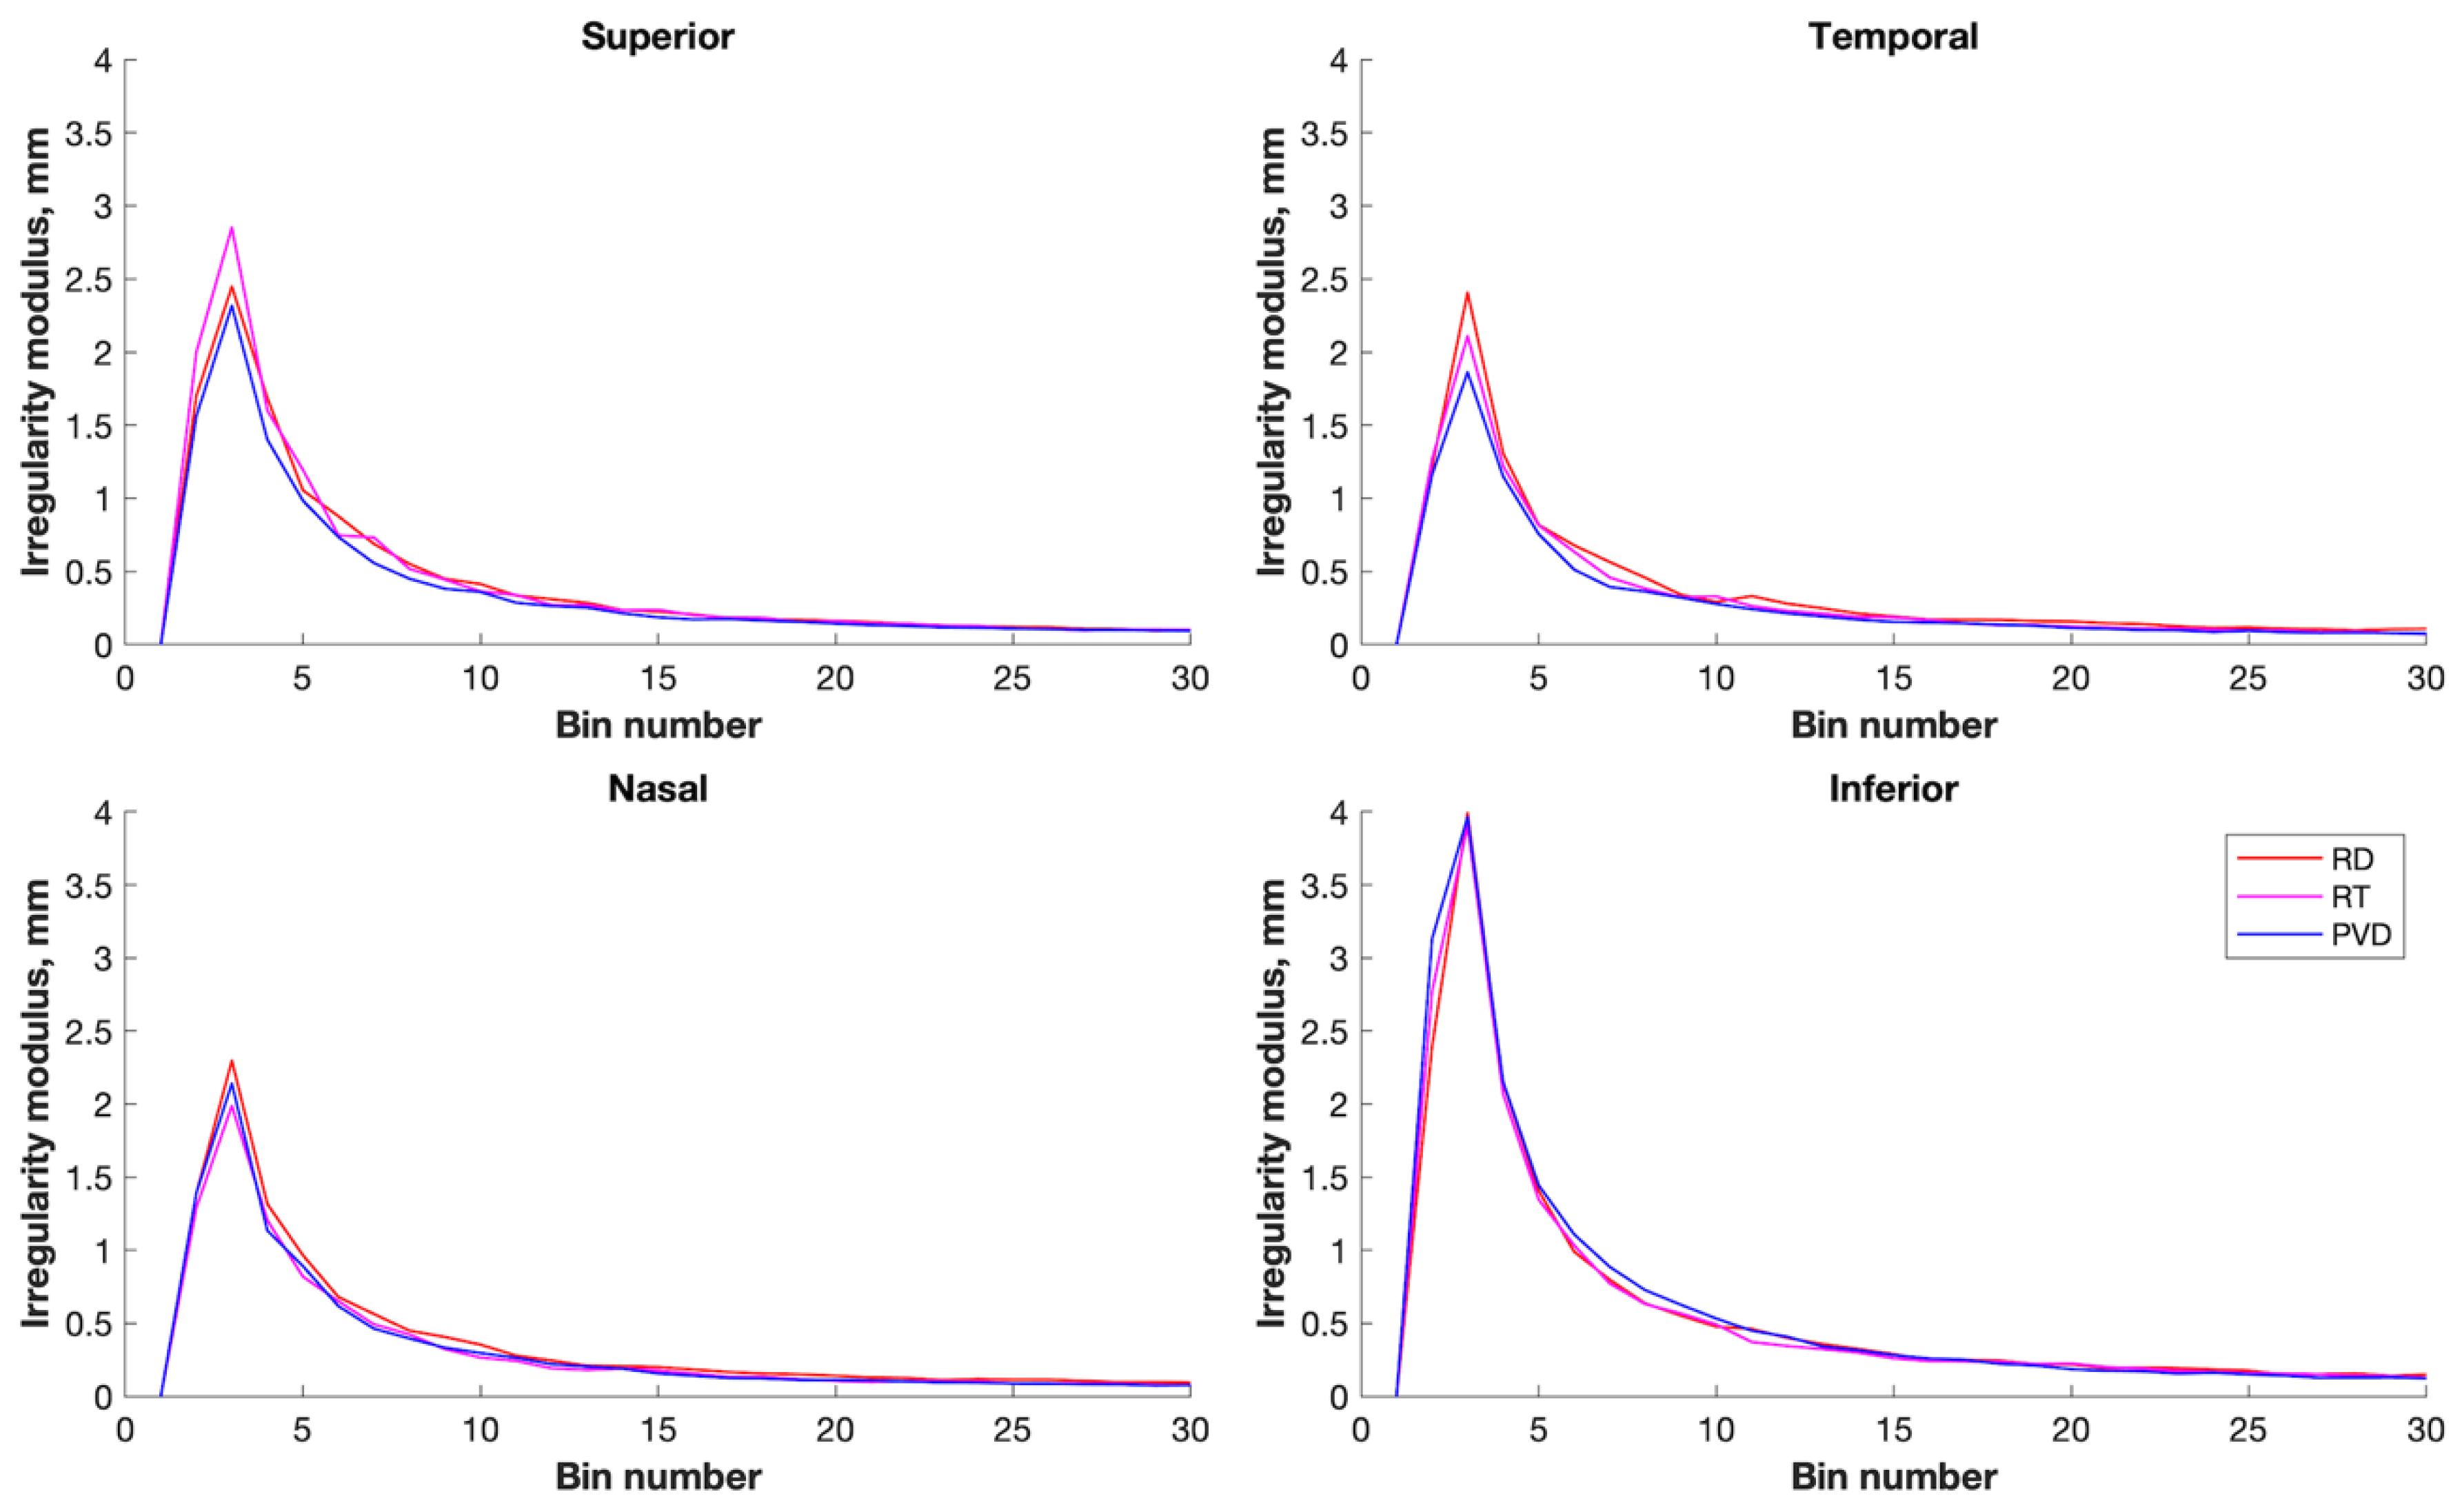
3.2. Within-Eye Distribution of Irregularity
3.3. Between-Group Differences in Irregularity
3.4. Correlation of Irregularity with Axial Length
3.5. Feature Selection
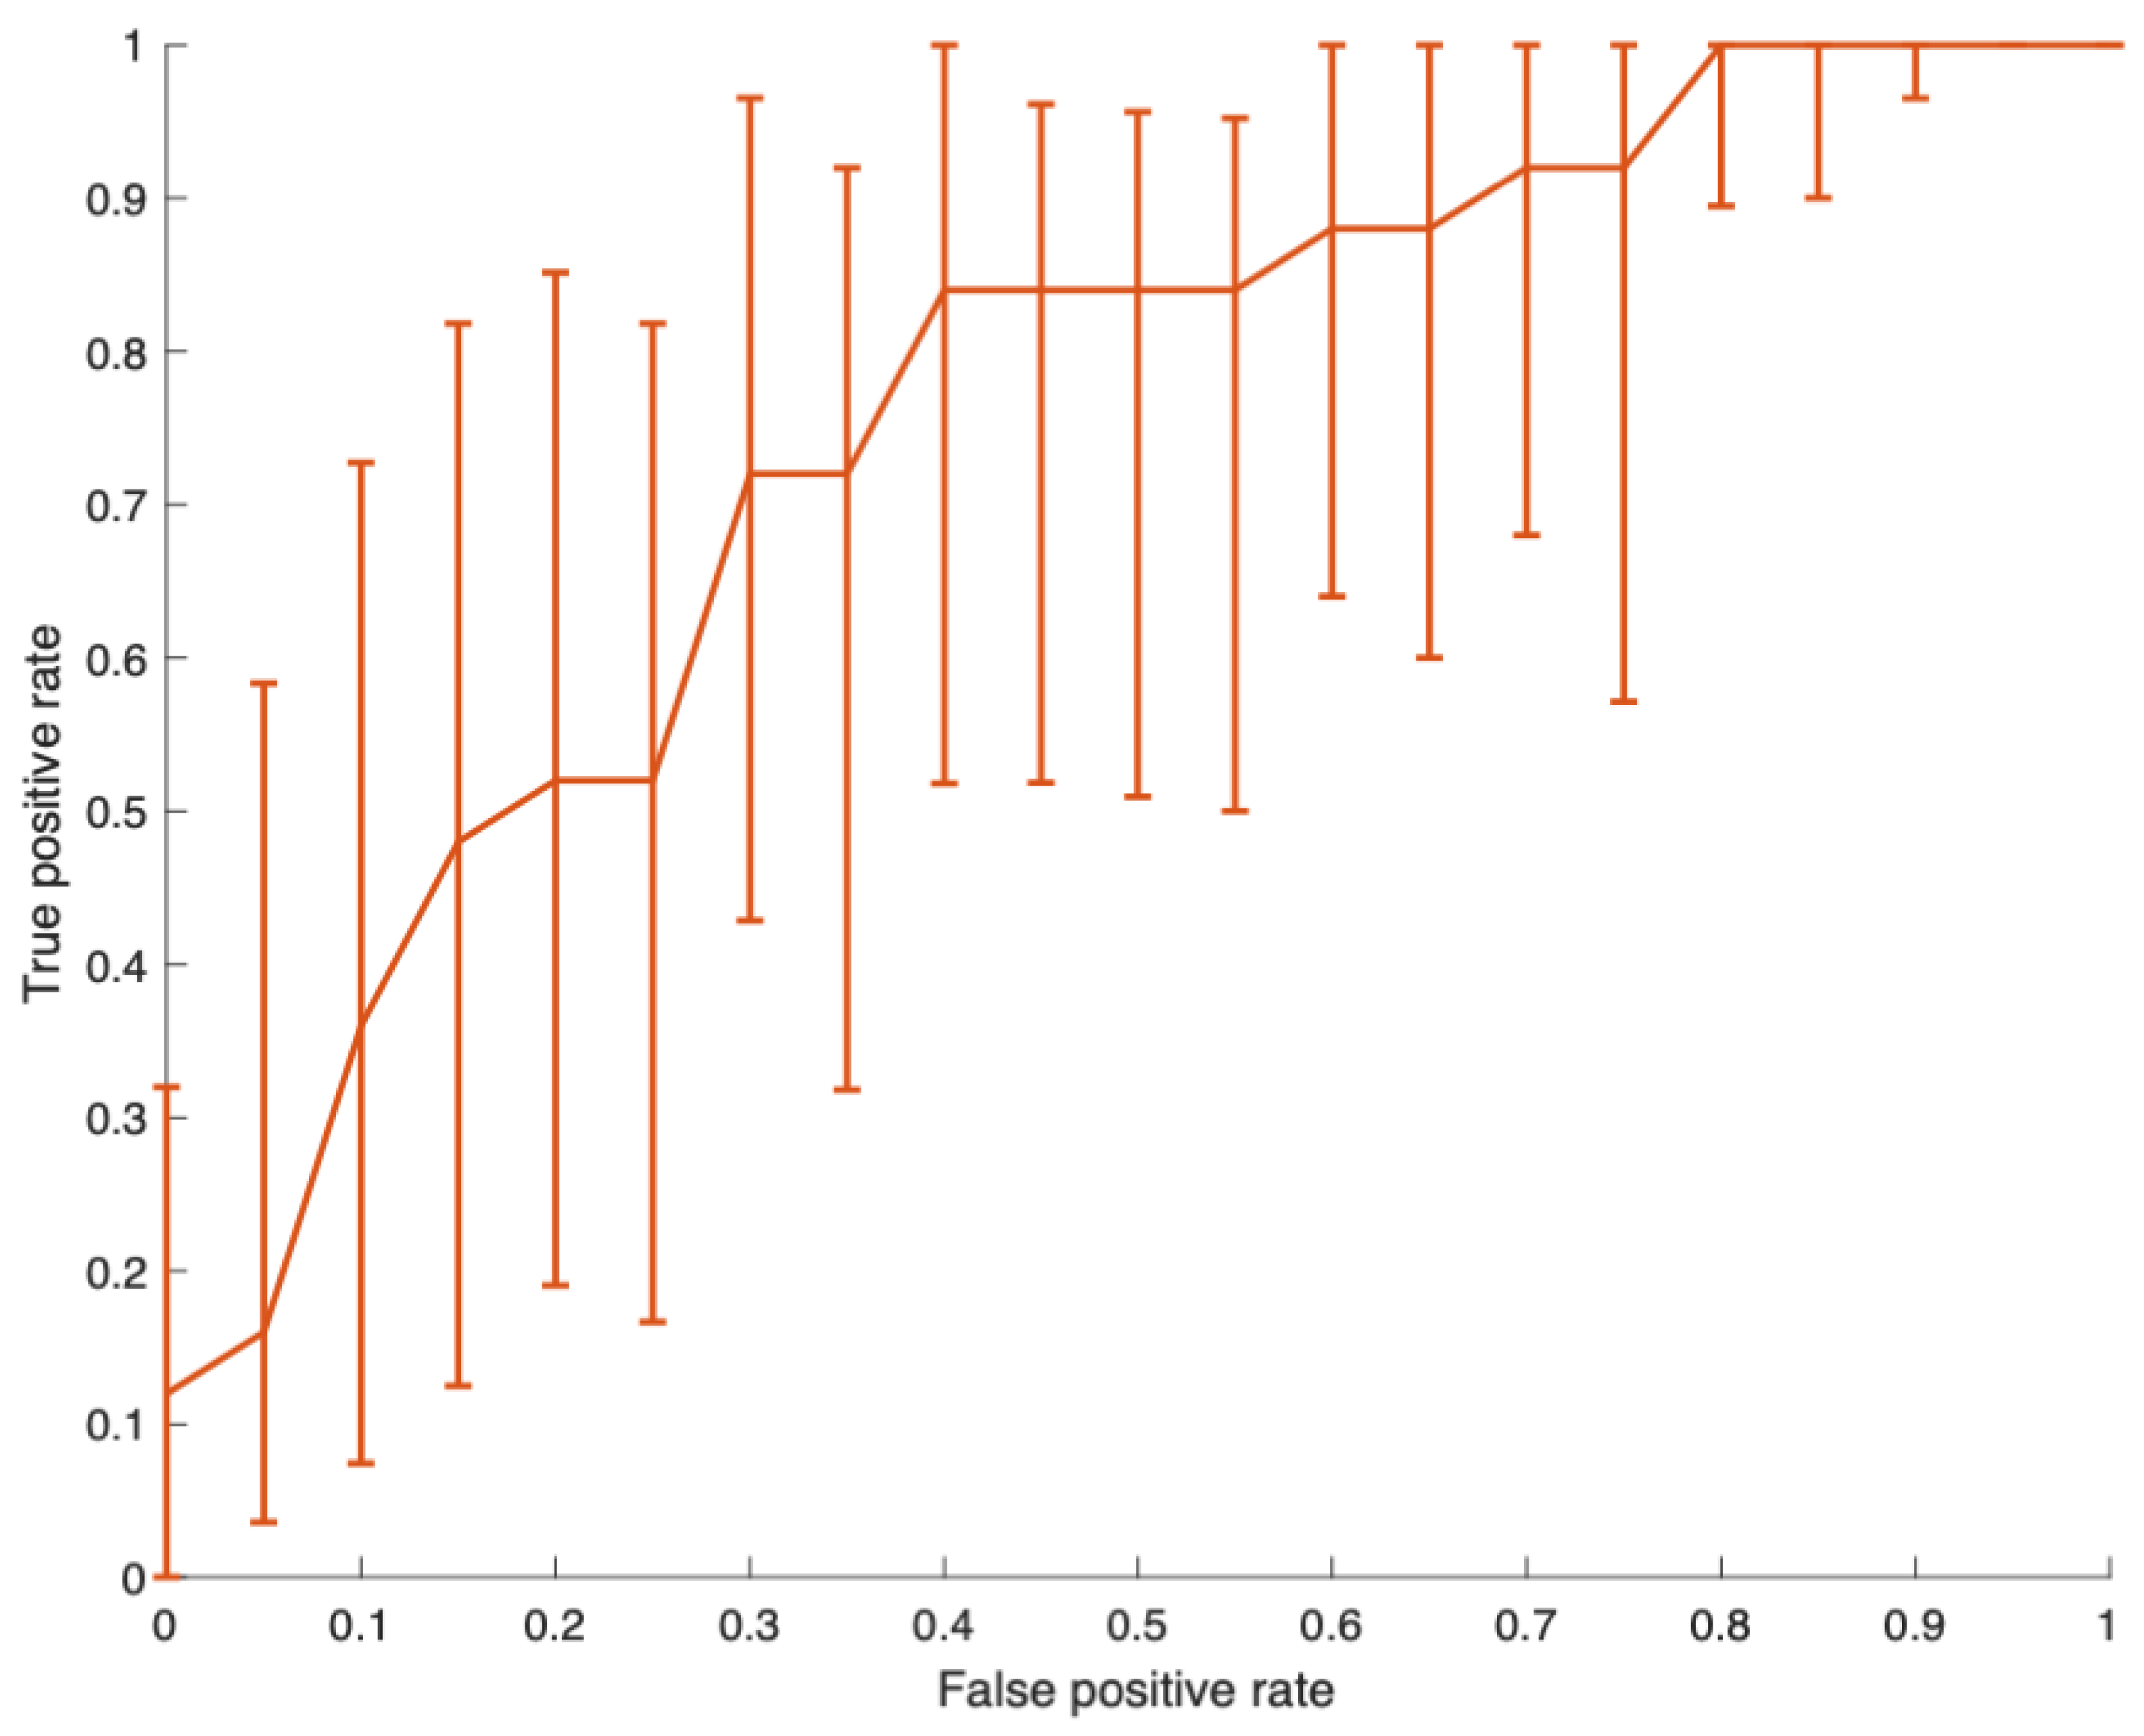
3.6. Training Set Classifier Performance
3.7. Test Set Results
4. Discussion
4.1. Comparison with SD OCT
4.2. Association between Irregularity and Retinal Detachment
4.3. Limitations of This Study
5. Conclusions
Supplementary Materials
Author Contributions
Funding
Institutional Review Board Statement
Informed Consent Statement
Data Availability Statement
Conflicts of Interest
References
- Van de Put, M.A.J.; Hooymans, J.M.M.; Los, L.I. The Incidence of Rhegmatogenous Retinal Detachment in The Netherlands. Ophthalmology 2013, 120, 616–622. [Google Scholar] [CrossRef]
- Xu, Z.Y.; Azuara-Blanco, A.; Kadonosono, K.; Murray, T.; Natarajan, S.; Sii, S.; Smiddy, W.; Steel, D.H.; Wolfensberger, T.J.; Lois, N.; et al. New Classification for the Reporting of Complications in Retinal Detachment Surgical Trials. JAMA Ophthalmol. 2021, 139, 857–864. [Google Scholar] [CrossRef] [PubMed]
- Du, Y.; Mo, X.-H.; Li, X.-L.; Zeng, J.; Luo, W.; Huang, M.-L. Vision-related quality of life and depression in rhegmatogenous retinal detachment patients. Medicine 2019, 98, e14225. [Google Scholar] [CrossRef] [PubMed]
- Straatsma, B.R. Peripheral retinal tears: Classification, prevalence and principles of management. Aust. J. Opthalmol. 1980, 8, 275–279. [Google Scholar] [CrossRef]
- Fincham, G.S.; Pasea, L.; Carroll, C.; McNinch, A.M.; Poulson, A.V.; Richards, A.J.; Scott, J.D.; Snead, M.P. Prevention of retinal detachment in Stickler syndrome: The Cambridge prophylactic cryotherapy protocol. Ophthalmology 2014, 121, 1588–1597. [Google Scholar] [CrossRef] [PubMed] [Green Version]
- Verhoekx, J.S.N.; van Etten, P.G.; Wubbels, R.J.; van Meurs, J.C.; van Overdam, K.A. Prophylactic laser treatment to decrease the incidence of retinal detachment in fellow eyes of idiopathic giant retinal tears. Retina 2020, 40, 1094–1097. [Google Scholar] [CrossRef] [PubMed]
- Wolfensberger, T.J.; Aylward, G.W.; Leaver, P.K. Prophylactic 360° cryotherapy in fellow eyes of patients with spontaneous giant retinal tears. Ophthalmology 2003, 110, 1175–1177. [Google Scholar] [CrossRef]
- Ripandelli, G.; Rossi, T.; Cacciamani, A.; Scarinci, F.; Piaggi, P.; Stirpe, M. Laser prophylactic treatment of the fellow eye in giant retinal tears: Long-Term Follow-up. Retina 2016, 36, 962–966. [Google Scholar] [CrossRef]
- Morris, R.E.; Kuhn, F.; Sipos, T. Preventing Retinal Detachment: Where are We? Implications from Stickler Syndrome. Clin. Ophthalmol. 2022, 16, 4315–4321. [Google Scholar] [CrossRef]
- Naravane, A.V.; Belin, P.J.; Pierce, B.; Quiram, P.A. Risk and prevention of retinal detachments in patients with stickler syndrome. Ophthalmic Surg. Lasers Imaging Retin. 2022, 53, 7–11. [Google Scholar] [CrossRef]
- Linton, E.; Jalil, A.; Sergouniotis, P.; Moussa, G.; Black, G.; Charles, S.; Ivanova, T. Laser Prophylaxis in Stickler Syndrome: The Manchester Protocol. Retina 2023, 43, 88–93. [Google Scholar] [CrossRef] [PubMed]
- Byer, N.E. Rethinking prophylactic therapy of retinal detachment. In Advances in Vitreoretinal Surgery; Ophthalmic Communications Society: New York, NY, USA, 1992; pp. 399–411. [Google Scholar]
- Wilkinson, C.P. Interventions for asymptomatic retinal breaks and lattice degeneration for preventing retinal detachment. Cochrane Database Syst. Rev. 2014, 3, CD003170. [Google Scholar] [CrossRef] [Green Version]
- Fujimoto, J.G.; Drexler, W.; Schuman, J.S.; Hitzenberger, C.K. Optical Coherence Tomography (OCT) in ophthalmology: Introduction. Opt. Express 2009, 17, 3978–3979. [Google Scholar] [CrossRef] [PubMed]
- Shinohara, K.; Shimada, N.; Moriyama, M.; Yoshida, T.; Jonas, J.B.; Yoshimura, N.; Ohno-Matsui, K. Posterior Staphylomas in Pathologic Myopia Imaged by Widefield Optical Coherence Tomography. Investig. Ophthalmol. Vis. Sci. 2017, 58, 3750–3758. [Google Scholar] [CrossRef] [PubMed]
- Caillaux, V.; Gaucher, D.; Gualino, V.; Massin, P.; Tadayoni, R.; Gaudric, A. Morphologic characterization of dome-shaped macula in myopic eyes with serous macular detachment. Am. J. Ophthalmol. 2013, 156, 958–967.e1. [Google Scholar] [CrossRef] [PubMed]
- Ohno-Matsui, K.; Fang, Y.; Shinohara, K.; Takahashi, H.; Uramoto, K.; Yokoi, T. Imaging of Pathologic Myopia. Asia-Pac. J. Ophthalmol. 2019, 8, 172–177. [Google Scholar]
- Gaucher, D.; Erginay, A.; Lecleire-Collet, A.; Haouchine, B.; Puech, M.; Cohen, S.Y.; Massin, P.; Gaudric, A. Dome-shaped macula in eyes with myopic posterior staphyloma. Am. J. Ophthalmol. 2008, 145, 909–914. [Google Scholar] [CrossRef]
- Frisina, R.; Baldi, A.; Cesana, B.M.; Semeraro, F.; Parolini, B. Morphological and clinical characteristics of myopic posterior staphyloma in Caucasians. Graefes Arch. Clin. Exp. Ophthalmol. 2016, 11, 2119–2129. [Google Scholar] [CrossRef] [PubMed]
- Naz, S.; Ahmed, A.; Akram, M.U.; Khan, S.A. Automated segmentation of RPE layer for the detection of age macular degeneration using OCT images. In Proceedings of the 2016 Sixth International Conference on Image Processing Theory, Tools and Applications (IPTA) 1–4 (IEEE, 2016), Oulu, Finland, 12–15 December 2016. [Google Scholar] [CrossRef]
- Srinivasan, P.P.; Kim, L.A.; Mettu, P.S.; Cousins, S.W.; Comer, G.M.; Izatt, J.A.; Farsiu, S. Fully automated detection of diabetic macular edema and dry age-related macular degeneration from optical coherence tomography images. Biomed. Opt. Express 2014, 5, 3568–3577. [Google Scholar] [CrossRef] [PubMed] [Green Version]
- Kafieh, R.; Rabbani, H.; Abramoff, M.D.; Sonka, M. Curvature correction of retinal OCTs using graph-based geometry detection. Phys. Med. Biol. 2013, 58, 2925–2938. [Google Scholar] [CrossRef] [PubMed] [Green Version]
- Xu, H.; Zeng, F.; Shi, D.; Sun, X.; Chen, X.; Bai, Y. Focal Choroidal Excavation Complicated by Choroidal Neovascularization. Ophthalmology 2014, 121, 246–250. [Google Scholar] [CrossRef]
- Kuo, A.N.; McNabb, R.P.; Chiu, S.J.; El-Dairi, M.A.; Farsiu, S.; Toth, C.A.; Izatt, J.A. Correction of ocular shape in retinal optical coherence tomography and effect on current clinical measures. Am. J. Ophthalmol. 2013, 156, 304–311. [Google Scholar] [CrossRef] [Green Version]
- Lake, S.; Bottema, M.; Williams, K.; Reynolds, K. The correlation between optical coherence tomography retinal shape irregularity and axial length. PLoS ONE 2019, 14, e0227207. [Google Scholar] [CrossRef] [PubMed] [Green Version]
- Lake, S.R.; Bottema, M.J.; Williams, K.A.; Lange, T.; Reynolds, K.J. Retinal Shape-Based Classification of Retinal Detachment and Posterior Vitreous Detachment Eyes. Ophthalmol. Ther. 2022, 12, 155–165. [Google Scholar] [CrossRef]
- Meleppat, R.K.; Fortenbach, C.R.; Jian, Y.; Martinez, E.S.; Wagner, K.; Modjtahedi, B.S.; Motta, M.J.; Ramamurthy, D.L.; Schwab, I.R.; Zawadzki, R.J. In Vivo Imaging of Retinal and Choroidal Morphology and Vascular Plexuses of Vertebrates Using Swept-Source Optical Coherence Tomography. Transl. Vis. Sci. Technol. 2022, 11, 11. [Google Scholar] [CrossRef] [PubMed]
- Meleppat, R.K.; Zhang, P.; Ju, M.J.; Manna, S.K.K.; Jian, Y.; Pugh, E.N.; Zawadzki, R.J. Directional optical coherence tomography reveals melanin concentration-dependent scattering properties of retinal pigment epithelium. J. Biomed. Opt. 2019, 24, 66011. [Google Scholar] [CrossRef] [PubMed]
- Kolokoltsev, O.; Gómez-Arista, I.; Treviño-Palacios, C.G.; Qureshi, N.; Mejia-Uriarte, E.V. Swept Source OCT Beyond the Coherence Length Limit. IEEE J. Sel. Top. Quantum Electron. 2016, 22, 222–227. [Google Scholar] [CrossRef]
- More, S.; Kubach, S.; Gregori, G.; Shen, M.; Wang, L.; Jiang, X.; Laiginhas, R.; Shi, Y.; De Sisternes, L.; Rosenfeld, P.J. Comparison of retinal pigment epithelium elevation between scans acquired at 200 kHz and 100 kHz rates. Investig. Ophthalmol. Vis. Sci. 2021, 62, 2529. [Google Scholar]
- Akman, A. Optical Coherence Tomography: Manufacturers and Current Systems. In Optical Coherence Tomography in Glaucoma; Akman, A., Bayer, A., Nouri-Mahdavi, K., Eds.; Springer International Publishing: New York, NY, USA, 2018; pp. 27–37. [Google Scholar] [CrossRef]
- Adhi, M.; Liu, J.J.; Qavi, A.H.; Grulkowski, I.; Lu, C.D.; Mohler, K.J.; Ferrara, D.; Kraus, M.F.; Baumal, C.R.; Witkin, A.J.; et al. Choroidal Analysis in Healthy Eyes Using Swept-Source Optical Coherence Tomography Compared to Spectral Domain Optical Coherence Tomography. Am. J. Ophthalmol. 2014, 157, 1272–1281.e1. [Google Scholar] [CrossRef]
- Zheng, F.; Zhang, Q.; Shi, Y.; Russell, J.F.; Motulsky, E.H.; Banta, J.T.; Chu, Z.; Zhou, H.; Patel, N.A.; de Sisternes, L.; et al. Age-dependent Changes in the Macular Choriocapillaris of Normal Eyes Imaged With Swept-Source Optical Coherence Tomography Angiography. Am. J. Ophthalmol. 2019, 200, 110–122. [Google Scholar] [CrossRef]
- Ruiz-Medrano, J.; Flores-Moreno, I.; Montero, J.A.; Duker, J.S.; Ruiz-Moreno, J.M. Morphologic features of the choroidoscleral interface in a healthy population using swept-source optical coherence tomography. Am. J. Ophthalmol. 2015, 160, 596–601.e1. [Google Scholar] [CrossRef] [PubMed]
- Minami, S.; Ito, Y.; Ueno, S.; Kataoka, K.; Takeuchi, J.; Ito, H.; Nakano, Y.; Kitagawa, M.; Leahy, C.; Straub, J.; et al. Analysis of macular curvature in normal eyes using swept-source optical coherence tomography. Jpn. J. Ophthalmol. 2020, 64, 180–186. [Google Scholar] [CrossRef] [PubMed]
- Choma, M.A.; Sarunic, M.V.; Yang, C.; Izatt, J.A. Sensitivity advantage of swept source and Fourier domain optical coherence tomography. Opt. Express 2003, 11, 2183–2189. [Google Scholar] [CrossRef] [Green Version]
- Klein, T.; Wieser, W.; Eigenwillig, C.M.; Biedermann, B.R.; Huber, R. Megahertz OCT for ultrawide-field retinal imaging with a 1050nm Fourier domain mode-locked laser. Opt. Express 2011, 19, 3044–3062. [Google Scholar] [CrossRef] [PubMed]
- Kishi, S. Impact of swept source optical coherence tomography on ophthalmology. Taiwan J. Ophthalmol. 2016, 6, 58–68. [Google Scholar] [CrossRef] [Green Version]
- Lange, T.; Lake, S.; Reynolds, K.; Bottema, M. Automated Computational Diagnosis of Peripheral Retinal Pathology in Optical Coherence Tomography (OCT) Scans using Graph Theory. In Proceedings of the 2020 Digital Image Computing: Techniques and Applications (DICTA) 1–3 (2020), Melbourne, Australia, 29 November–2 December 2020. [Google Scholar] [CrossRef]
- Zou, H.; Hastie, T.; Tibshirani, R. On the “degrees of freedom” of the lasso. Ann. Stat. 2007, 35, 2173–2192. [Google Scholar] [CrossRef]
- Ho, K.M. Effect of non-linearity of a predictor on the shape and magnitude of its receiver-operating-characteristic curve in predicting a binary outcome. Sci. Rep. 2017, 7, 10155. [Google Scholar] [CrossRef] [PubMed] [Green Version]
- Jonas, J.B.; Ohno-Matsui, K.; Panda-Jonas, S. Myopia: Anatomic Changes and Consequences for Its Etiology. Asia-Pac. J. Ophthalmol. 2019, 8, 355–359. [Google Scholar] [CrossRef] [PubMed]
- Jonas, J.B.; Jonas, R.A.; Bikbov, M.M.; Wang, Y.X.; Panda-Jonas, S. Myopia: Histology, clinical features, and potential implications for the etiology of axial elongation. Prog. Retin. Eye Res. 2022, 101156. [Google Scholar] [CrossRef]
- Jonas, J.B.; Ohno-Matsui, K.; Jiang, W.J.; Panda-Jonas, S. Bruch membrane and the mechanism of myopization: A new theory. Retina 2017, 37, 1428–1440. [Google Scholar] [CrossRef] [PubMed]
- Atchison, D.A.; Jones, C.E.; Schmid, K.L.; Pritchard, N.; Pope, J.M.; Strugnell, W.E.; Riley, R.A. Eye Shape in Emmetropia and Myopia. Investig. Ophthalmol. Vis. Sci. 2004, 45, 3380–3386. [Google Scholar] [CrossRef] [PubMed] [Green Version]
- Boutin, T.S.; Charteris, D.G.; Chandra, A.; Campbell, S.; Hayward, C.; Campbell, A.; UK Biobank Eye & Vision Consortium; Nandakumar, P.; Hinds, D.; 23andMe Research Team; et al. Insights into the genetic basis of retinal detachment. Hum. Mol. Genet. 2020, 29, 689–702. [Google Scholar] [CrossRef] [Green Version]
- Johnston, T.; Chandra, A.; Hewitt, A.W. Current Understanding of the Genetic Architecture of Rhegmatogenous Retinal Detachment. Ophthalmic Genet. 2016, 37, 121–129. [Google Scholar] [CrossRef]
- Mitry, D.; Singh, J.; Yorston, D.; Siddiqui, M.A.R.; Murphy, A.L.; Wright, A.F.; Fleck, B.W.; Campbell, H.; Charteris, D.G. The fellow eye in retinal detachment: Findings from the Scottish Retinal Detachment Study. Br. J. Ophthalmol. 2012, 96, 110–113. [Google Scholar] [CrossRef] [PubMed]
- Törnquist, R.; Stenkula, S.; Törnquist, P. Retinal detachment. Acta Ophthalmol. 1987, 65, 213–222. [Google Scholar] [CrossRef] [PubMed]
- Wallsh, J.O.; Langevin, S.T.; Kumar, A.; Huz, J.; Falk, N.S.; Bhatnagar, P. Fellow Eye Retinal Detachment Risk as Stratified by Hyaloid Status on Optical Coherence Tomography. Ophthalmology 2023. Online ahead of print. [Google Scholar] [CrossRef]
- Burton, T.C. The influence of refractive error and lattice degeneration on the incidence of retinal detachment. Trans. Am. Ophthalmol. Soc. 1989, 87, 143–147. [Google Scholar]
- Meguro, A.; Ideta, H.; Ota, M.; Ito, N.; Ideta, R.; Yonemoto, J.; Takeuchi, M.; Uemoto, R.; Nishide, T.; Iijima, Y.; et al. Common Variants in the COL4A4 Gene Confer Susceptibility to Lattice Degeneration of the Retina. PLoS ONE 2012, 7, e39300. [Google Scholar] [CrossRef] [Green Version]


| Group | N | OD/OS | M/F | Age ± SD (Years) | Axial Length ± SD (mm) |
|---|---|---|---|---|---|
| PVD | 88 | 47/41 | 42/46 | 65.3 ± 6.1 | 24.41 ± 1.10 |
| Retinal detachment | 67 | 36/31 | 41/26 | 62.6 ± 8.5 * | 25.10 ± 1.10 ** |
| Retinal tear | 53 | 30/23 | 37/16 | 64.1 ± 6.5 | 24.41 ± 1.12 *** |
| Label 1 | Label 2 | Total | |
|---|---|---|---|
| PVD | 26 | 5 | 31 |
| Retinal detachment | 13 | 12 | 25 |
| Total | 39 | 17 | 56 |
Disclaimer/Publisher’s Note: The statements, opinions and data contained in all publications are solely those of the individual author(s) and contributor(s) and not of MDPI and/or the editor(s). MDPI and/or the editor(s) disclaim responsibility for any injury to people or property resulting from any ideas, methods, instructions or products referred to in the content. |
© 2023 by the authors. Licensee MDPI, Basel, Switzerland. This article is an open access article distributed under the terms and conditions of the Creative Commons Attribution (CC BY) license (https://creativecommons.org/licenses/by/4.0/).
Share and Cite
Lake, S.R.; Bottema, M.J.; Lange, T.; Williams, K.A.; Reynolds, K.J. Swept-Source OCT Mid-Peripheral Retinal Irregularity in Retinal Detachment and Posterior Vitreous Detachment Eyes. Bioengineering 2023, 10, 377. https://doi.org/10.3390/bioengineering10030377
Lake SR, Bottema MJ, Lange T, Williams KA, Reynolds KJ. Swept-Source OCT Mid-Peripheral Retinal Irregularity in Retinal Detachment and Posterior Vitreous Detachment Eyes. Bioengineering. 2023; 10(3):377. https://doi.org/10.3390/bioengineering10030377
Chicago/Turabian StyleLake, Stewart R., Murk J. Bottema, Tyra Lange, Keryn A. Williams, and Karen J. Reynolds. 2023. "Swept-Source OCT Mid-Peripheral Retinal Irregularity in Retinal Detachment and Posterior Vitreous Detachment Eyes" Bioengineering 10, no. 3: 377. https://doi.org/10.3390/bioengineering10030377