

Left Ventricular Assist Device Pump Obstruction Reduces Native Heart Efficiency
Abstract
:1. Introduction
2. Materials and Methods
2.1. Data Analysis
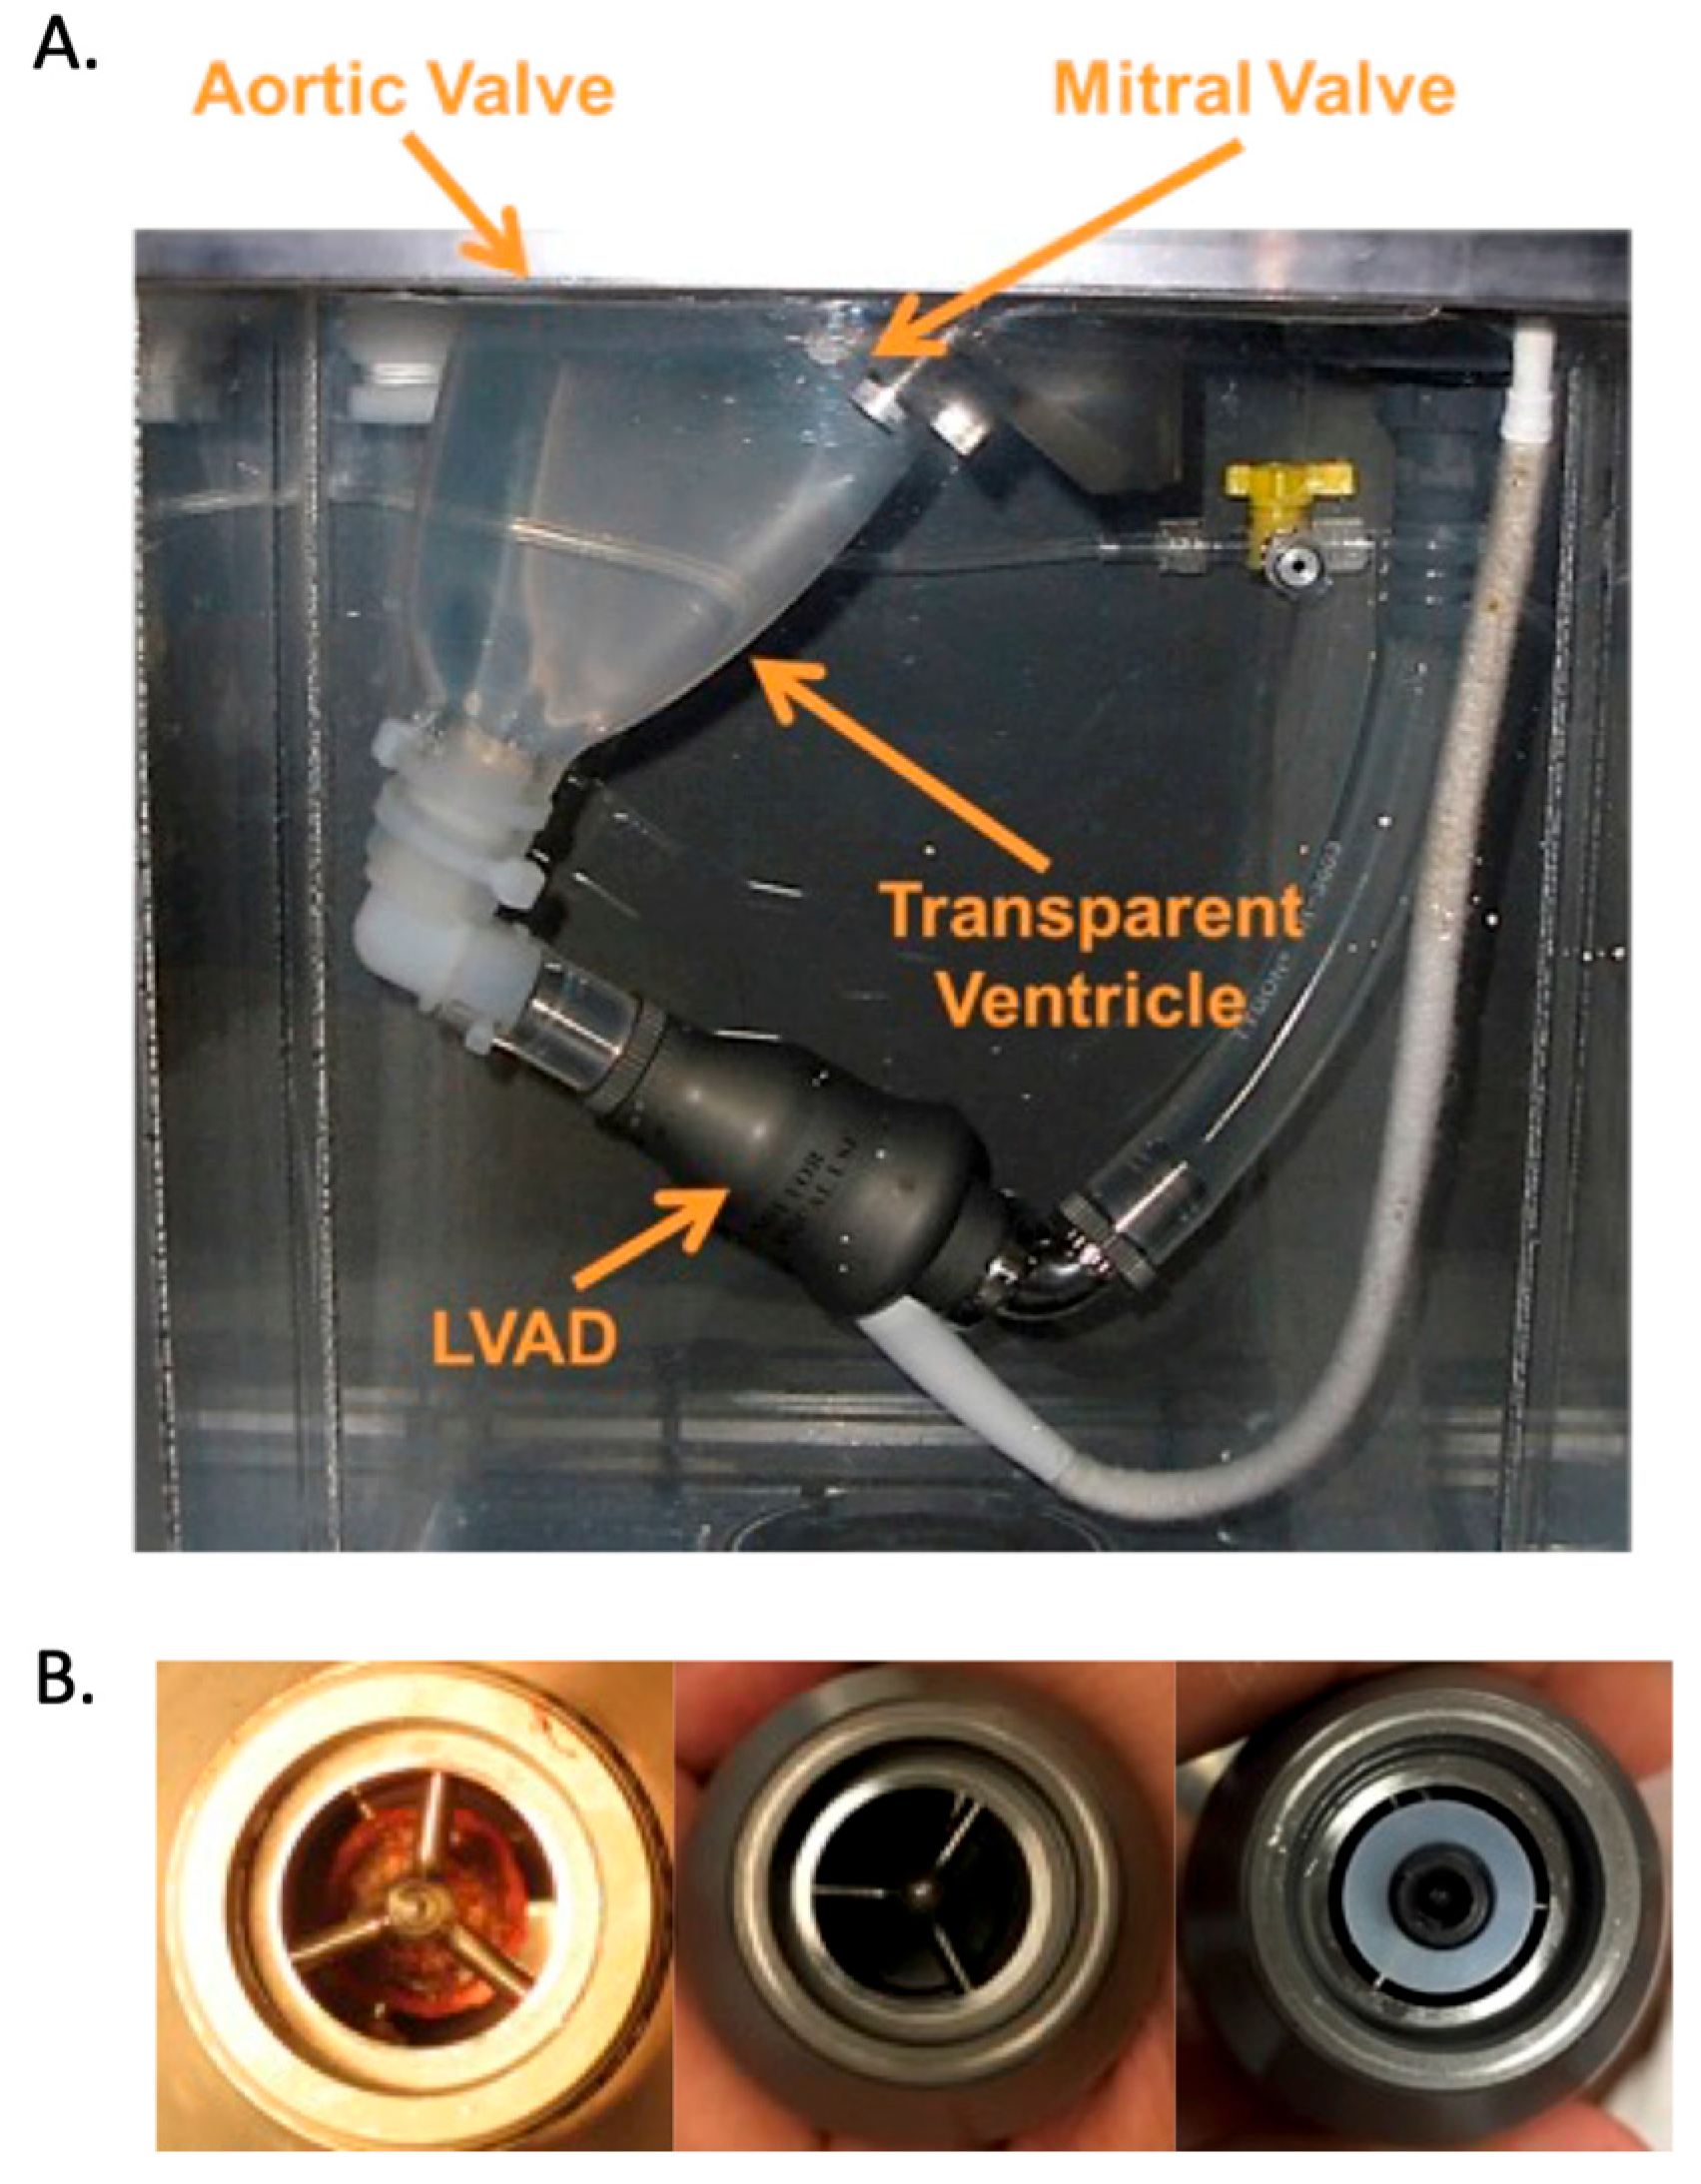
2.2. Image Analysis
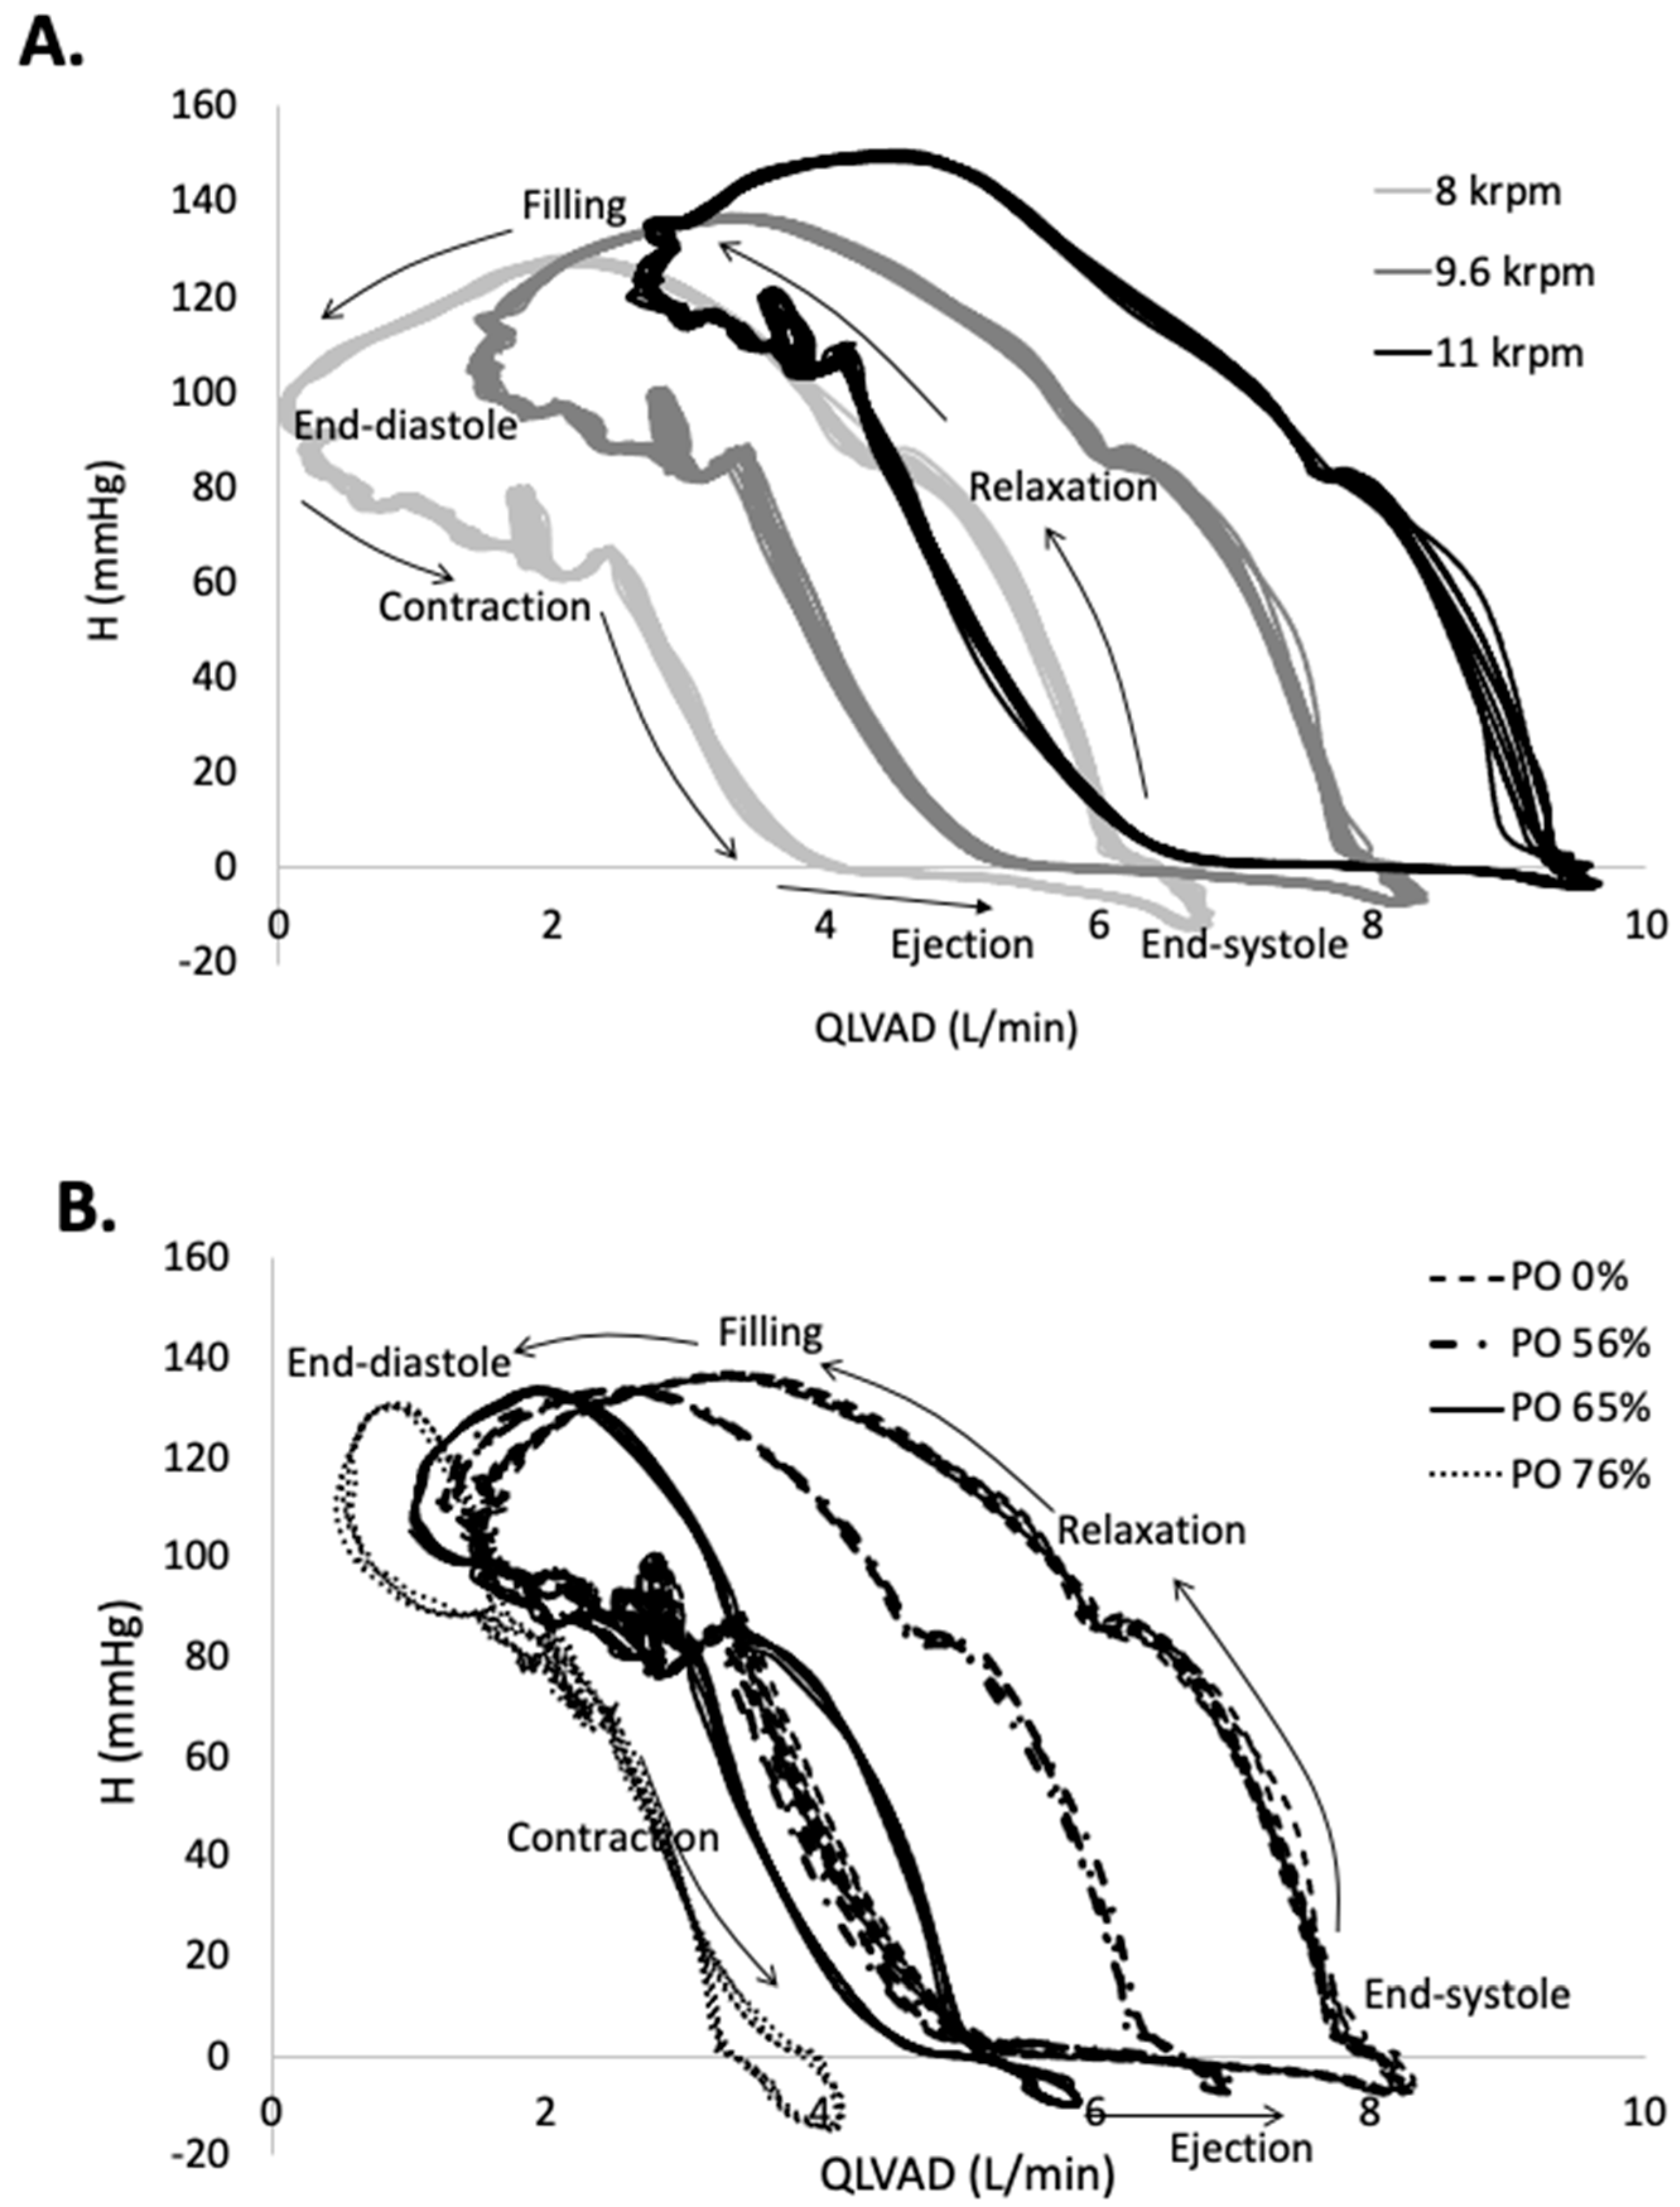
3. Results
4. Discussion
4.1. Limitations
4.2. Conclusions
Supplementary Materials
Author Contributions
Funding
Institutional Review Board Statement
Informed Consent Statement
Data Availability Statement
Acknowledgments
Conflicts of Interest
Acronyms
| AVOT | Aortic valve opening time |
| CW | Clockwise |
| CCW | Counter-clockwise |
| EW | External work |
| H-Q | Pressure-flow |
| HM2 | HeartMate II LVAD |
| LV | Left ventricle |
| LVAD | Left ventricular assist device |
| PI | Pulsatility index |
| PO | Pump obstruction |
Appendix A. Equations Used in the Data and Image Analysis
References
- Barac, Y.D.; Nevo, A.; Schroder, J.N.; Milano, C.A.; Daneshmand, M.A. LVAD Outflow Graft Role in Pump Thrombosis. ASAIO J. 2020, 66, 128–131. [Google Scholar] [CrossRef] [PubMed]
- Aigner, P.; Schlöglhofer, T.; Plunger, L.C.; Beitzke, D.; Wielandner, A.; Schima, H.; Zimpfer, D.; Moscato, F. Pump position and thrombosis in ventricular assist devices: Correlation of radiographs and CT data. Int. J. Artif. Organs 2021, 44, 956–964. [Google Scholar] [CrossRef]
- Najjar, S.S.; Slaughter, M.S.; Pagani, F.D.; Starling, R.C.; McGee, E.C.; Eckman, P.; Tatooles, A.J.; Moazami, N.; Kormos, R.L.; Hathaway, D.R.; et al. An analysis of pump thrombus events in patients in the HeartWare ADVANCE bridge to transplant and continued access protocol trial. J. Heart Lung Transplant. 2014, 33, 23–34. [Google Scholar] [CrossRef] [PubMed]
- Mehra, M.R.; Naka, Y.; Uriel, N.; Goldstein, D.J.; Cleveland, J.C., Jr.; Colombo, P.C.; Walsh, M.N.; Milano, C.A.; Patel, C.B.; Jorde, U.P.; et al. A Fully Magnetically Levitated Circulatory Pump for Advanced Heart Failure. N. Engl. J. Med. 2017, 376, 440–450. [Google Scholar] [CrossRef]
- Eulert-Grehn, J.-J.; Krabatsch, T.; Potapov, E. A case of an obstructive inflow thrombus in a HeartMate 3 from the left ventricle into the pump. J. Heart Lung Transplant. Off. Publ. Int. Soc. Heart Transplant. 2018, 37, 172–173. [Google Scholar] [CrossRef] [PubMed]
- Lilja, D.; Schalit, I.; Espinoza, A.; Fiane, A.E.; Dahle, G.; Littorin-Sandbu, H.; Pettersen, F.-J.; Russell, K.E.; Thiara, A.P.S.; Elle, O.J.; et al. Detection of inflow obstruction in left ventricular assist devices by accelerometer: A porcine model study. J. Heart Lung Transplant. 2023, 42, 1005–1014. [Google Scholar] [CrossRef] [PubMed]
- Pappalardo, F.; Bertoldi, L.F.; Sanvito, F.; Marini, C.; Consolo, F. Inflow cannula obstruction of the HeartWare left ventricular assist device: What do we really know? Cardiovasc. Pathol. Off. J. Soc. Cardiovasc. Pathol. 2021, 50, 107299. [Google Scholar] [CrossRef] [PubMed]
- Maltais, S.; Kilic, A.; Nathan, S.; Keebler, M.; Emani, S.; Ransom, J.; Katz, J.N.; Sheridan, B.; Brieke, A.; Egnaczyk, G.; et al. PREVENtion of HeartMate II Pump Thrombosis through Clinical Management: The PREVENT multi-center study. J. Heart Lung Transplant. 2017, 36, 1–12. [Google Scholar] [CrossRef]
- Uriel, N.; Han, J.; Morrison, K.A.; Nahumi, N.; Yuzefpolskaya, M.; Garan, A.R.; Duong, J.; Colombo, P.C.; Takayama, H.; Thomas, S.; et al. Device thrombosis in HeartMate II continuous-flow left ventricular assist devices: A multifactorial phenomenon. J. Heart Lung Transplant. 2014, 33, 51–59. [Google Scholar] [CrossRef]
- Acharya, D.; Hashim, T.; Kirklin, J.K.; Holman, W.L.; Pamboukian, S.V.; Tallaj, J.A.; Loyaga-Rendon, R.Y.; Singh, S.P. Use of retrospectively gated CT angiography to diagnose systolic LVAD inflow obstruction. ASAIO J. 2013, 59, 542–546. [Google Scholar] [CrossRef]
- Piche, S.L.; Nei, S.D.; Frazee, E.; Schettle, S.D.; Boilson, B.A.; Plevak, M.F.; Dierkhising, R.A.; Stulak, J.M. Baseline Thromboelastogram as a Predictor of Left Ventricular Assist Device Thrombosis. ASAIO J. 2019, 65, 443–448. [Google Scholar] [CrossRef] [PubMed]
- Boilson, B.A.; Bechtum, E.L.; Behnken, A.L.; Loga, L.A.; Luckhardt, A.J.; Schettle, S.D.; Clavell, A.L.; Dragomir-Daescu, D.; Stulak, J.M. Acoustic Properties of Axial and Centrifugal Flow Left Ventricular Assist Devices and Prediction of Pump Thrombosis. Mayo Clin. Proc. 2021, 96, 887–900. [Google Scholar] [CrossRef] [PubMed]
- Uriel, N.; Morrison, K.A.; Garan, A.R.; Kato, T.S.; Yuzefpolskaya, M.; Latif, F.; Restaino, S.W.; Mancini, D.M.; Flannery, M.; Takayama, H.; et al. Development of a novel echocardiography ramp test for speed optimization and diagnosis of device thrombosis in continuous-flow left ventricular assist devices: The Columbia ramp study. J. Am. Coll. Cardiol. 2012, 60, 1764–1775. [Google Scholar] [CrossRef]
- Kato, T.S.; Colombo, P.C.; Nahumi, N.; Kitada, S.; Takayama, H.; Naka, Y.; Di Tullio, M.R.; Homma, S.; Mancini, D.; Jorde, U.P.; et al. Value of serial echo-guided ramp studies in a patient with suspicion of device thrombosis after left ventricular assist device implantation. Echocardiography 2014, 31, E5–E9. [Google Scholar] [CrossRef] [PubMed]
- Moazami, N.; Dembitsky, W.P.; Adamson, R.; Steffen, R.J.; Soltesz, E.G.; Starling, R.C.; Fukamachi, K. Does pulsatility matter in the era of continuous-flow blood pumps? J. Heart Lung Transplant. 2015, 34, 999–1004. [Google Scholar] [CrossRef]
- Alemu, Y.; Bluestein, D. Flow-induced Platelet Activation and Damage Accumulation in a Mechanical Heart Valve: Numerical Studies. Artif. Organs 2007, 31, 677–688. [Google Scholar] [CrossRef] [PubMed]
- Sheriff, J.; Bluestein, D.; Girdhar, G.; Jesty, J. High-Shear Stress Sensitizes Platelets to Subsequent Low-Shear Conditions. Ann. Biomed. Eng. 2008, 141, 520–529. [Google Scholar] [CrossRef]
- Wong, K.; Samaroo, G.; Ling, I.; Dembitsky, W.; Adamson, R.; del Álamo, J.; May-Newman, K. Intraventricular flow patterns and stasis in the LVAD-assisted heart. J. Biomech. 2014, 47, 1485–1494. [Google Scholar] [CrossRef]
- Adamson, R.M.; Mangi, A.A.; Kormos, R.L.; Farrar, D.J.; Dembitsky, W.P. Principles of HeartMate II implantation to avoid pump malposition and migration. J. Card. Surg. 2015, 30, 296–299. [Google Scholar] [CrossRef]
- Matsumoto, Y.; Fujita, T.; Fukushima, S.; Hata, H.; Shimahara, Y.; Kume, Y.; Yamashita, K.; Kuroda, K.; Nakajima, S.; Sato, T.; et al. Comparison of Hemodynamic Performance and Clinical Results with EVAHEART Versus HeartMate II. ASAIO J. 2017, 63, 562–567. [Google Scholar] [CrossRef]
- Maurer, M.M.; Burkhoff, D.; Maybaum, S.; Franco, V.; Vittorio, T.J.; Williams, P.; White, L.; Kamalakkannan, G.; Myers, J.; Mancini, D.M. A Multicenter Study of Noninvasive Cardiac Output by Bioreactance during Symptom-limited Exercise. J. Card. Fail. 2009, 15, 689–699. [Google Scholar] [CrossRef] [PubMed]
- Strickland, K.C.; Watkins, J.C.; Couper, G.S.; Givertz, M.M.; Padera, R.F. Thrombus around the redesigned HeartWare HVAD inflow cannula: A pathological case series. J. Heart Lung Transplant. 2016, 35, 926–930. [Google Scholar] [CrossRef] [PubMed]
- Tolpen, S.; Janmaat, J.; Reider, C.; Kallel, F.; Farrar, D.; May-Newman, K. Programmed Speed Reduction Enables Aortic Valve Opening and Increased Pulsatility in the LVAD-Assisted Heart. ASAIO J. 2015, 61, 540–547. [Google Scholar] [CrossRef] [PubMed]
- May-Newman, K. Dynamic pressure—Flow curve analysis of the native heart and left ventricular assist device for full and partial bypass conditions. Artif. Organs 2022, 46, 1077–1085. [Google Scholar] [CrossRef] [PubMed]
- Bermejo, J.; Benito, Y.; Alhama, M.; Yotti, R.; Martínez-Legazpi, P.; del Villar, C.P.; Pérez-David, E.; González-Mansilla, A.; Santa-Marta, C.; Barrio, A.; et al. Intraventricular vortex properties in nonischemic dilated cardiomyopathy. Am. J. Physiol. Heart Circ. Physiol. 2014, 306, H718–H729. [Google Scholar] [CrossRef] [PubMed]
- Lilja, D.; Schalit, I.; Espinoza, A.; Pettersen, F.-J.; Elle, O.J.; Halvorsen, P.S. Detection of inflow obstruction in left ventricular assist devices by accelerometer: An in vitro study. Med Eng. Phys. 2022, 110, 103917. [Google Scholar] [CrossRef]
- May-Newman, K. A Mathematical Model of Artificial Pulse Synchronization for the HeartMate3 Left Ventricular Assist Device. ASAIO J. 2023, 69, 284–289. [Google Scholar] [CrossRef] [PubMed]
- Rossini, L.; Martinez-Legazpi, P.; Vu, V.; Fernández-Friera, L.; del Villar, C.P.; Rodríguez-López, S.; Benito, Y.; Borja, M.-G.; Pastor-Escuredo, D.; Yotti, R.; et al. A clinical method for mapping and quantifying blood stasis in the left ventricle. J. Biomech. 2016, 49, 2152–2161. [Google Scholar] [CrossRef]
- Acharya, D.; Loyaga-Rendon, R.; Morgan, C.J.; Sands, K.A.; Pamboukian, S.V.; Rajapreyar, I.; Holman, W.L.; Kirklin, J.K.; Tallaj, J.A. INTERMACS Analysis of Stroke during Support with Continuous-Flow Left Ventricular Assist Devices. JACC Hear. Fail. 2017, 5, 703–711. [Google Scholar] [CrossRef]
- Scandroglio, A.M.; Kaufmann, F.; Pieri, M.; Kretzschmar, A.; Müller, M.; Pergantis, P.; Dreysse, S.; Falk, V.; Krabatsch, T.; Potapov, E.V. Diagnosis and Treatment Algorithm for Blood Flow Obstructions in Patients with Left Ventricular Assist Device. J. Am. Coll. Cardiol. 2016, 67, 2758–2768. [Google Scholar] [CrossRef]
- Klodell, C.T.; Massey, H.T.; Adamson, R.M.; Dean, D.A.; Horstmanshof, D.A.; Ransom, J.M.; Salerno, C.T.; Cowger, J.A.; Aranda, J.M.; Chen, L.; et al. Factors Related to Pump Thrombosis with the Heartmate II Left Ventricular Assist Device. J. Card. Surg. 2015, 30, 775–780. [Google Scholar] [CrossRef]
- Garcia, D.; del Alamo, J.C.; Tanne, D.; Yotti, R.; Cortina, C.; Bertrand, É.; Antoranz, J.C.; Perez-David, E.; Rieu, R.; Fernandez-Aviles, F.; et al. Two-dimensional intraventricular flow mapping by digital processing conventional color-doppler echocardiography images. IEEE Trans. Med. Imaging 2010, 29, 1701–1713. [Google Scholar] [CrossRef]


| PO (%) | LVAD Speed krpm | AoP mmHg | QTotal L/min | QLVAD L/min | PI Total | PI LVAD | AVOT ms |
|---|---|---|---|---|---|---|---|
| 0% | 8 | 85.9 ± 0.7 | 4.43 ± 0.16 | 2.67 ± 0.06 | 4.56 | 2.48 | 188 ± 5 |
| 17% | 8 | 86.3 ± 0.6 | 4.37 ± 0.16 | 2.60 ± 0.06 | 4.63 | 2.50 | 203 ± 5 |
| 39% | 8 | 86.1 ± 0.7 | 4.40 ± 0.15 | 2.62 ± 0.05 | 4.60 | 2.42 | 202 ± 5 |
| 56% | 8 | 82.8 ± 0.7 | 4.35 ± 0.16 | 2.40 ± 0.06 | 4.89 | 2.47 | 198 ± 4 |
| 65% | 8 | 81.0 ± 0.7 | 4.26 ± 0.16 | 2.17 ± 0.04 | 5.16 | 2.42 | 205 ± 7 |
| 76% | 8 | 77.3 ± 0.7 | 4.18 ± 0.17 | 1.63 ± 0.03 | 5.26 | 2.55 | 212 ± 7 |
| 0% | 9.6 | 103.2 ± 0.7 | 5.01 ± 0.13 | 3.88 ± 0.06 | 3.34 | 1.75 | 175 ± 5 |
| 17% | 9.6 | 103.6 ± 0.6 | 4.97 ± 0.13 | 3.79 ± 0.06 | 3.38 | 1.75 | 187 ± 5 |
| 39% | 9.6 | 103.0 ± 0.6 | 4.96 ± 0.13 | 3.80 ± 0.06 | 3.40 | 1.66 | 188 ± 5 |
| 56% | 9.6 | 98.7 ± 0.6 | 4.89 ± 0.14 | 3.51 ± 0.05 | 3.63 | 1.62 | 190 ± 5 |
| 65% | 9.6 | 95.1 ± 0.6 | 4.76 ± 0.14 | 3.14 ± 0.04 | 3.94 | 1.53 | 197 ± 8 |
| 76% | 9.6 | 87.2 ± 0.7 | 4.59 ± 0.16 | 2.38 ± 0.03 | 4.27 | 1.50 | 207 ± 8 |
| 0% | 11 | 121.0 ± 0.5 | 5.55 ± 0.10 | 4.98 ± 0.06 | 2.41 | 1.40 | 152 ± 5 |
| 17% | 11 | 121.2 ± 0.5 | 5.51 ± 0.10 | 4.85 ± 0.06 | 2.45 | 1.39 | 167 ± 6 |
| 39% | 11 | 120.3 ± 0.4 | 5.52 ± 0.10 | 4.87 ± 0.06 | 2.46 | 1.31 | 167 ± 5 |
| 56% | 11 | 114.4 ± 0.5 | 5.37 ± 0.12 | 4.50 ± 0.05 | 2.72 | 1.23 | 170 ± 6 |
| 65% | 11 | 108.4 ± 0.5 | 5.20 ± 0.12 | 3.99 ± 0.04 | 3.05 | 1.12 | 185 ± 7 |
| 76% | 11 | 95.5 ± 0.6 | 4.92 ± 0.14 | 3.03 ± 0.02 | 3.51 | 1.06 | 202 ± 8 |
| PO (%) | LVAD Speed (krpm) | EWTotal (J) | EWHeart (J) | EWLVAD (J) | EWHeart_LVAD (J) | EWForward_AA (J) | EWCompliance_AA (J) |
|---|---|---|---|---|---|---|---|
| 0% | 8 | 1.116 | 1.016 | 0.316 | 0.891 | 0.125 | −0.216 |
| 17% | 8 | 0.926 | 1.097 | 0.316 | 1.005 | 0.091 | −0.487 |
| 39% | 8 | 0.943 | 1.065 | 0.316 | 0.926 | 0.138 | −0.438 |
| 56% | 8 | 0.301 | 0.510 | 0.316 | 0.358 | 0.152 | −0.525 |
| 65% | 8 | 0.097 | 0.234 | 0.316 | 0.142 | 0.092 | −0.453 |
| 76% | 8 | 0.173 | 0.232 | 0.316 | 0.111 | 0.121 | −0.375 |
| 0% | 9.6 | 1.455 | 1.001 | 0.582 | 0.937 | 0.064 | −0.128 |
| 17% | 9.6 | 1.353 | 1.192 | 0.582 | 1.144 | 0.048 | −0.421 |
| 39% | 9.6 | 1.266 | 1.068 | 0.582 | 1.068 | 0.022 | −0.384 |
| 56% | 9.6 | 0.718 | 0.666 | 0.582 | 0.569 | 0.097 | −0.530 |
| 65% | 9.6 | 0.500 | 0.411 | 0.582 | 0.311 | 0.100 | −0.492 |
| 76% | 9.6 | 0.573 | 0.167 | 0.582 | 0.047 | 0.119 | −0.175 |
| 0% | 11 | 1.792 | 1.020 | 0.845 | 0.997 | 0.023 | −0.073 |
| 17% | 11 | 1.764 | 1.287 | 0.845 | 1.286 | 0.001 | −0.368 |
| 39% | 11 | 1.710 | 1.147 | 0.845 | 1.144 | 0.003 | −0.282 |
| 56% | 11 | 1.027 | 0.636 | 0.845 | 0.562 | 0.073 | −0.454 |
| 65% | 11 | 0.749 | 0.354 | 0.845 | 0.274 | 0.081 | −0.451 |
| 76% | 11 | 0.723 | 0.081 | 0.845 | 0.005 | 0.092 | −0.203 |
| PO (%) | LVAD Speed krpm | ΓCW ×10−3 m2/s | ΓCCW ×10−3 m2/s | KECW J/m | KECCW J/m | RCW cm | RCCW cm | ARCW | ARCCW |
|---|---|---|---|---|---|---|---|---|---|
| 0% | 8 | 27.4 ± 17.5 | −5.5 ± 8.3 | 41.9 ± 57.4 | 10.4 ± 18.6 | 0.87 ± 0.18 | 0.34 ± 0.10 | 1.85 ± 0.43 | 1.61 ± 0.54 |
| 17% | 8 | 29.1 ± 16.4 | −5.3 ± 7.6 | 37.4 ± 37.3 | 8.9 ± 16.4 | 0.88 ± 0.20 | 0.34 ± 0.10 | 1.70 ± 0.44 | 1.52 ± 0.90 |
| 39% | 8 | 28.6 ± 15.8 | −6.0 ± 8.0 | 38.4 ± 44.2 | 11.2 ± 17.8 | 0.88 ± 0.18 | 0.42 ± 0.20 | 1.83 ± 0.51 | 1.65 ± 0.60 |
| 56% | 8 | 28.1 ± 15.9 | −5.3 ± 6.9 | 36.0 ± 38.6 | 10.1 ± 17.3 | 0.87 ± 0.17 | 0.38 ± 0.12 | 1.72 ± 0.39 | 1.56 ± 0.47 |
| 65% | 8 | 27.3 ± 15.3 | −5.2 ± 7.2 | 35.2 ± 37.9 | 9.4 ± 15.5 | 0.91 ± 0.21 | 0.35 ± 0.15 | 1.74 ± 0.39 | 1.69 ± 0.88 |
| 76% | 8 | 25.5 ± 16.4 | −4.6 ± 6.9 | 33.8 ± 43.0 | 8.1 ± 15.8 | 0.88 ± 0.20 | 0.35 ± 0.10 | 1.78 ± 0.44 | 1.45 ± 0.90 |
| 0% | 9.6 | 29.8 ± 17.4 | −5.7 ± 10.2 | 43.5 ± 56.3 | 14.5 ± 35.0 | 0.89 ± 0.20 | 0.39 ± 0.14 | 1.81 ± 0.43 | 1.66 ± 0.68 |
| 17% | 9.6 | 28.3 ± 18.6 | −6.4 ± 8.6 | 37.3 ± 39.8 | 12.4 ± 18.9 | 0.89 ± 0.16 | 0.45 ± 0.39 | 1.76 ± 0.47 | 1.68 ± 0.40 |
| 39% | 9.6 | 29.7 ± 16.3 | −5.9 ± 8.0 | 39.2 ± 41.4 | 12.6 ± 20.7 | 0.88 ± 0.20 | 0.4 ± 0.13 | 1.68 ± 0.37 | 1.58 ± 0.53 |
| 56% | 9.6 | 29.1 ± 16.7 | −5.5 ± 7.6 | 37.6 ± 40.7 | 9.8 ± 15.4 | 0.89 ± 0.17 | 0.43 ± 0.14 | 1.8 0± 0.47 | 1.89 ± 0.94 |
| 65% | 9.6 | 27.9 ± 15.4 | −5.5 ± 7.5 | 36.9 ± 45.9 | 9.5 ± 18.2 | 0.89 ± 0.17 | 0.37 ± 0.17 | 1.73 ± 0.39 | 1.68 ± 0.59 |
| 76% | 9.6 | 26.3 ± 16.3 | −5.1 ± 7.1 | 35.6 ± 45.4 | 9.7 ± 15.3 | 0.87 ± 0.16 | 0.43 ± 0.39 | 1.83 ± 0.47 | 1.68 ± 0.40 |
| 0% | 11 | 30.2 ± 18.2 | −5.2 ± 8.9 | 41.7 ± 50.6 | 11.6 ± 22.9 | 0.93 ± 0.18 | 0.44 ± 0.17 | 1.82 ± 0.43 | 1.93 ± 0.68 |
| 17% | 11 | 29.5 ± 17.8 | −6.3 ± 8.2 | 38.2 ± 40.4 | 11.4 ± 17.5 | 0.91 ± 0.20 | 0.43 ± 0.22 | 1.73 ± 0.46 | 1.59 ± 0.45 |
| 39% | 11 | 28.8 ± 17.7 | −5.4 ± 8.6 | 42.1 ± 50.7 | 11.3 ± 19.6 | 0.89 ± 0.17 | 0.37 ± 0.17 | 1.74 ± 0.47 | 1.62 ± 0.57 |
| 56% | 11 | 28.5 ± 16.6 | −5.3 ± 8.9 | 37.7 ± 42.0 | 9.9 ± 23.6 | 0.88 ± 0.18 | 0.41 ± 0.19 | 1.74 ± 0.52 | 1.91 ± 0.68 |
| 65% | 11 | 27.8 ± 15.9 | −5.0 ± 6.7 | 36.2 ± 43.4 | 9.3 ± 14.7 | 0.92 ± 0.21 | 0.33 ± 0.13 | 1.77 ± 0.49 | 1.77 ± 0.70 |
| 76% | 11 | 26.5 ± 17.1 | −5.3 ± 7.6 | 37.1 ± 46.5 | 10.1 ± 16.2 | 0.89 ± 0.20 | 0.42 ± 0.22 | 1.89 ± 0.46 | 1.82 ± 0.45 |
Disclaimer/Publisher’s Note: The statements, opinions and data contained in all publications are solely those of the individual author(s) and contributor(s) and not of MDPI and/or the editor(s). MDPI and/or the editor(s) disclaim responsibility for any injury to people or property resulting from any ideas, methods, instructions or products referred to in the content. |
© 2023 by the authors. Licensee MDPI, Basel, Switzerland. This article is an open access article distributed under the terms and conditions of the Creative Commons Attribution (CC BY) license (https://creativecommons.org/licenses/by/4.0/).
Share and Cite
Montes, R.; Ueckert, S.S.; Vu, V.; May-Newman, K. Left Ventricular Assist Device Pump Obstruction Reduces Native Heart Efficiency. Bioengineering 2023, 10, 1403. https://doi.org/10.3390/bioengineering10121403
Montes R, Ueckert SS, Vu V, May-Newman K. Left Ventricular Assist Device Pump Obstruction Reduces Native Heart Efficiency. Bioengineering. 2023; 10(12):1403. https://doi.org/10.3390/bioengineering10121403
Chicago/Turabian StyleMontes, Ricardo, Saniya Salim Ueckert, Vi Vu, and Karen May-Newman. 2023. "Left Ventricular Assist Device Pump Obstruction Reduces Native Heart Efficiency" Bioengineering 10, no. 12: 1403. https://doi.org/10.3390/bioengineering10121403