

Synthesis of sEMG Signals for Hand Gestures Using a 1DDCGAN

Abstract
:1. Introduction
Related Work
- Section 1: Introduction, which provides the background on sEMG signals and the challenges with acquiring data, as well as an overview of using GANs to generate synthetic medical data.
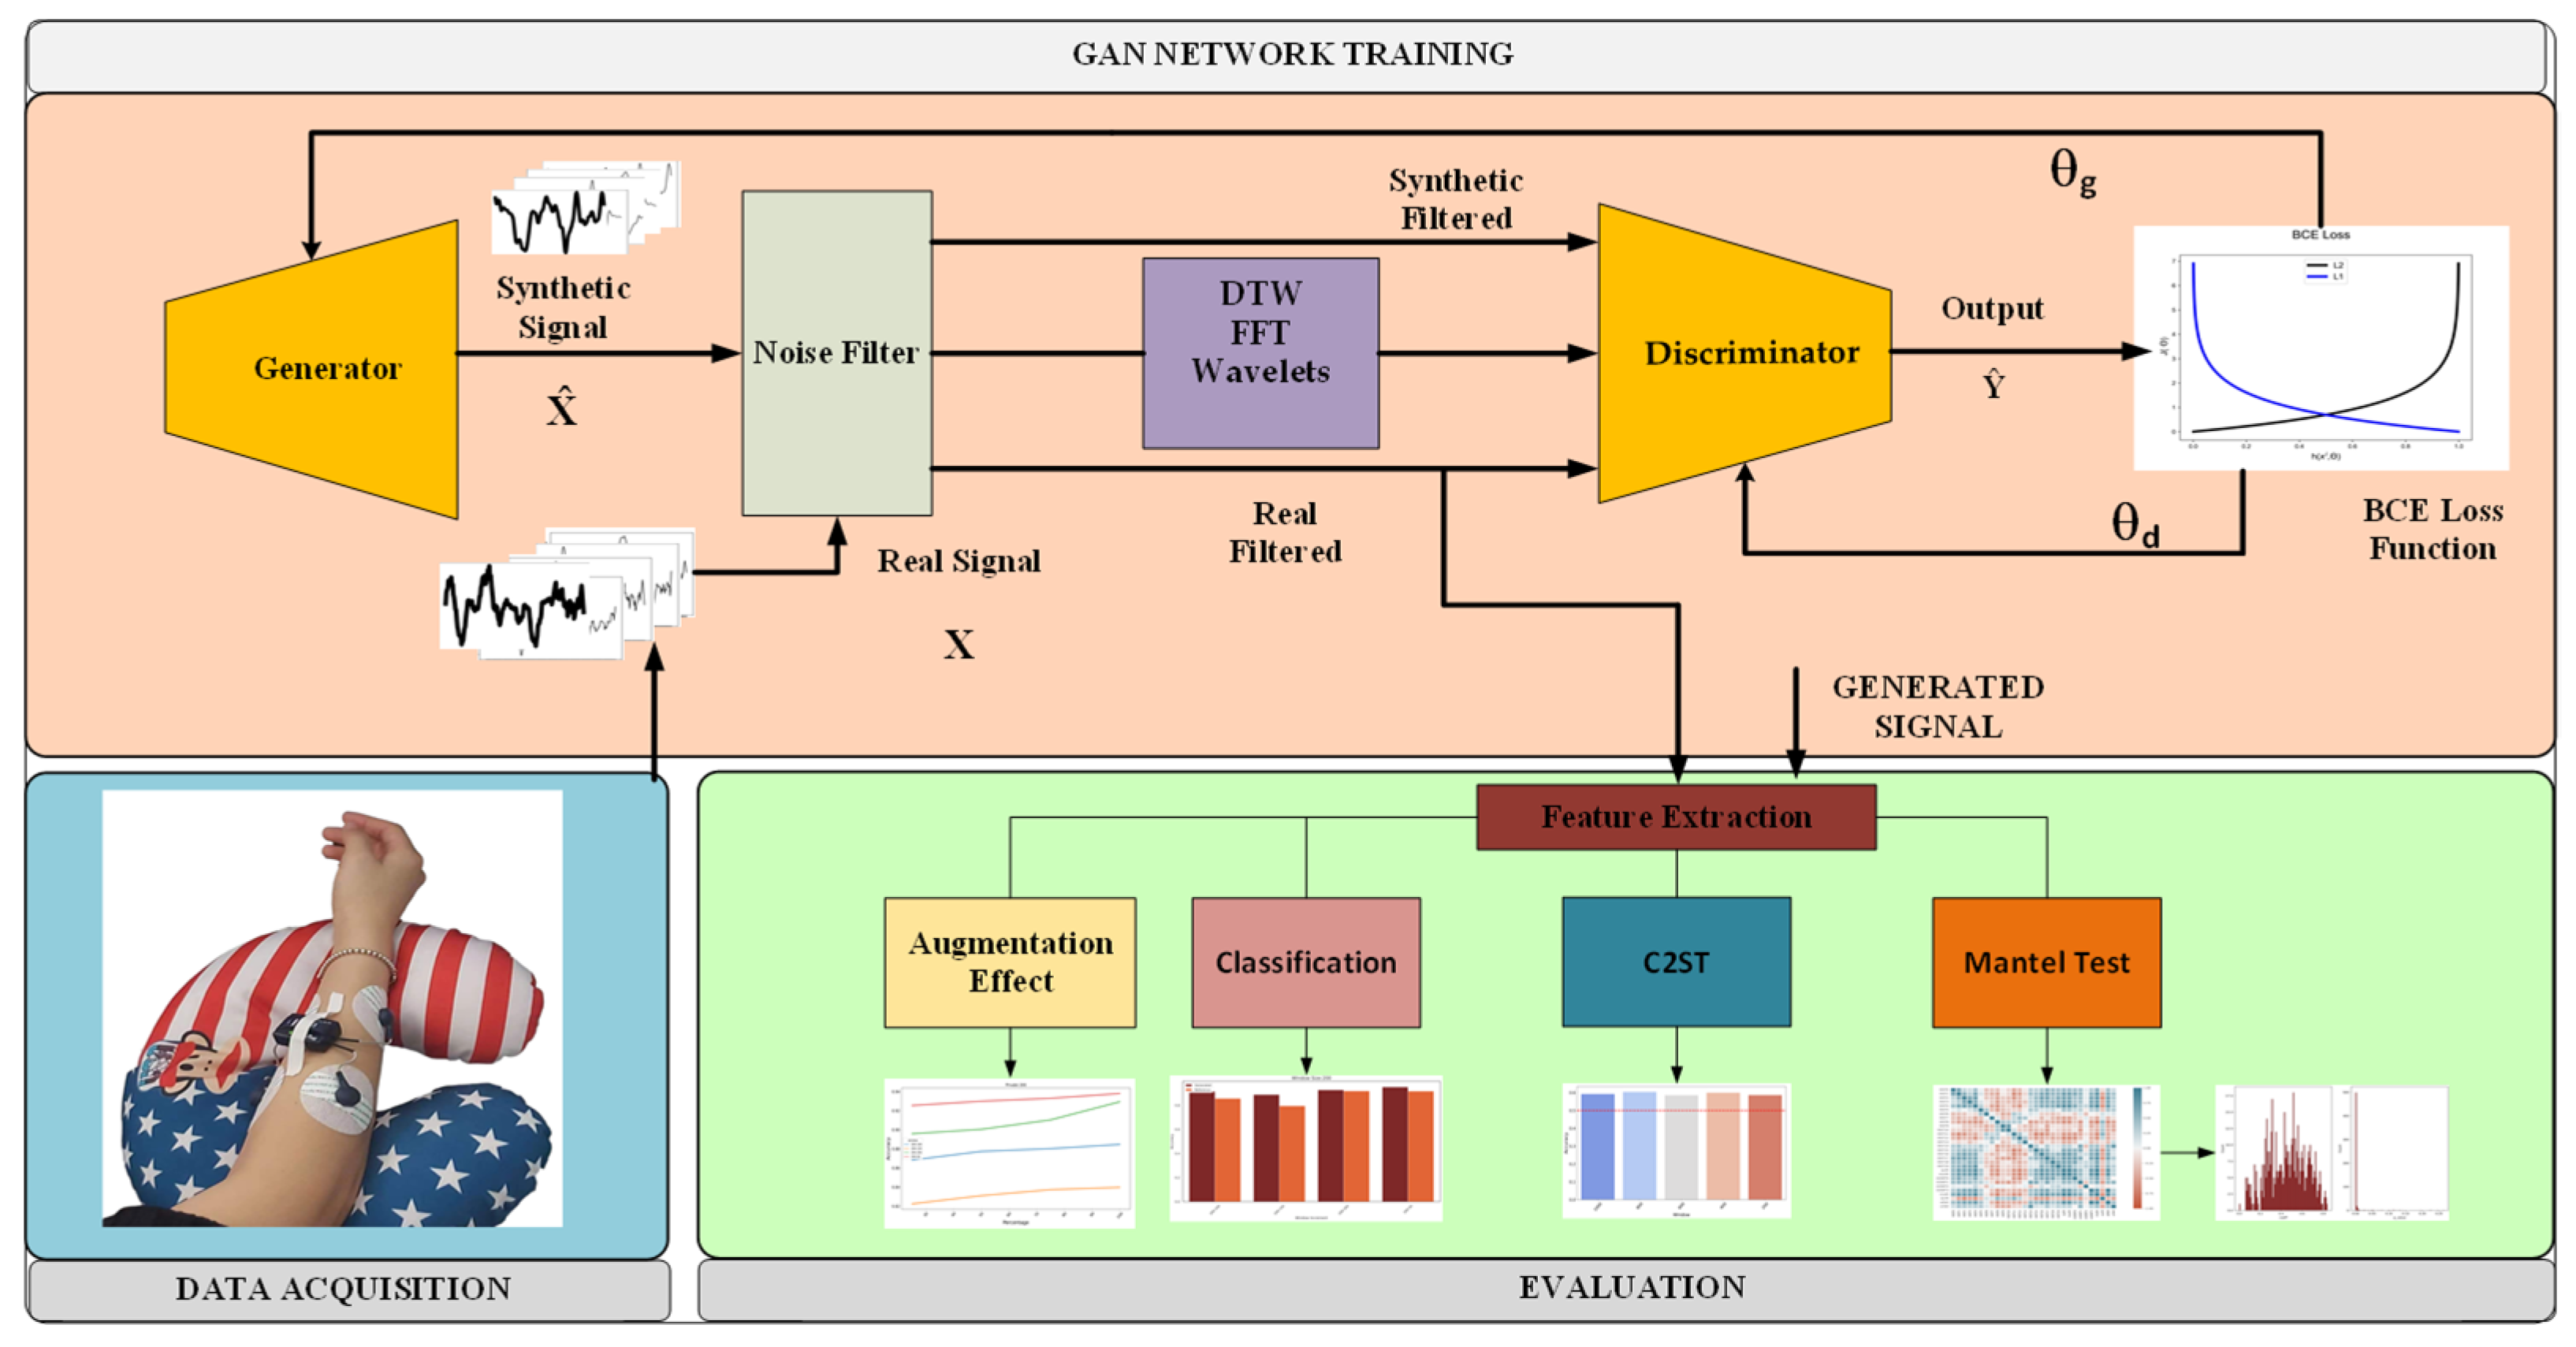
- Section 2: Materials and Methods, which details the data acquisition, signal processing, proposed 1DDCGAN architecture and evaluation methods, including the Mantel test, classification, augmentation test and classifier two-sample test.
- Section 3: Results, which presents the results of the Mantel test, classification, augmentation test and classifier two-sample test in assessing the quality of the synthesised sEMG signals.
- Section 4: Discussion, which analyses and interprets the results, comparing them with previous literature.
- Section 5: Conclusion, which summarises the efficacy of using 1DDCGAN to generate synthetic sEMG signals based on the evaluation metrics.
2. Materials and Methods
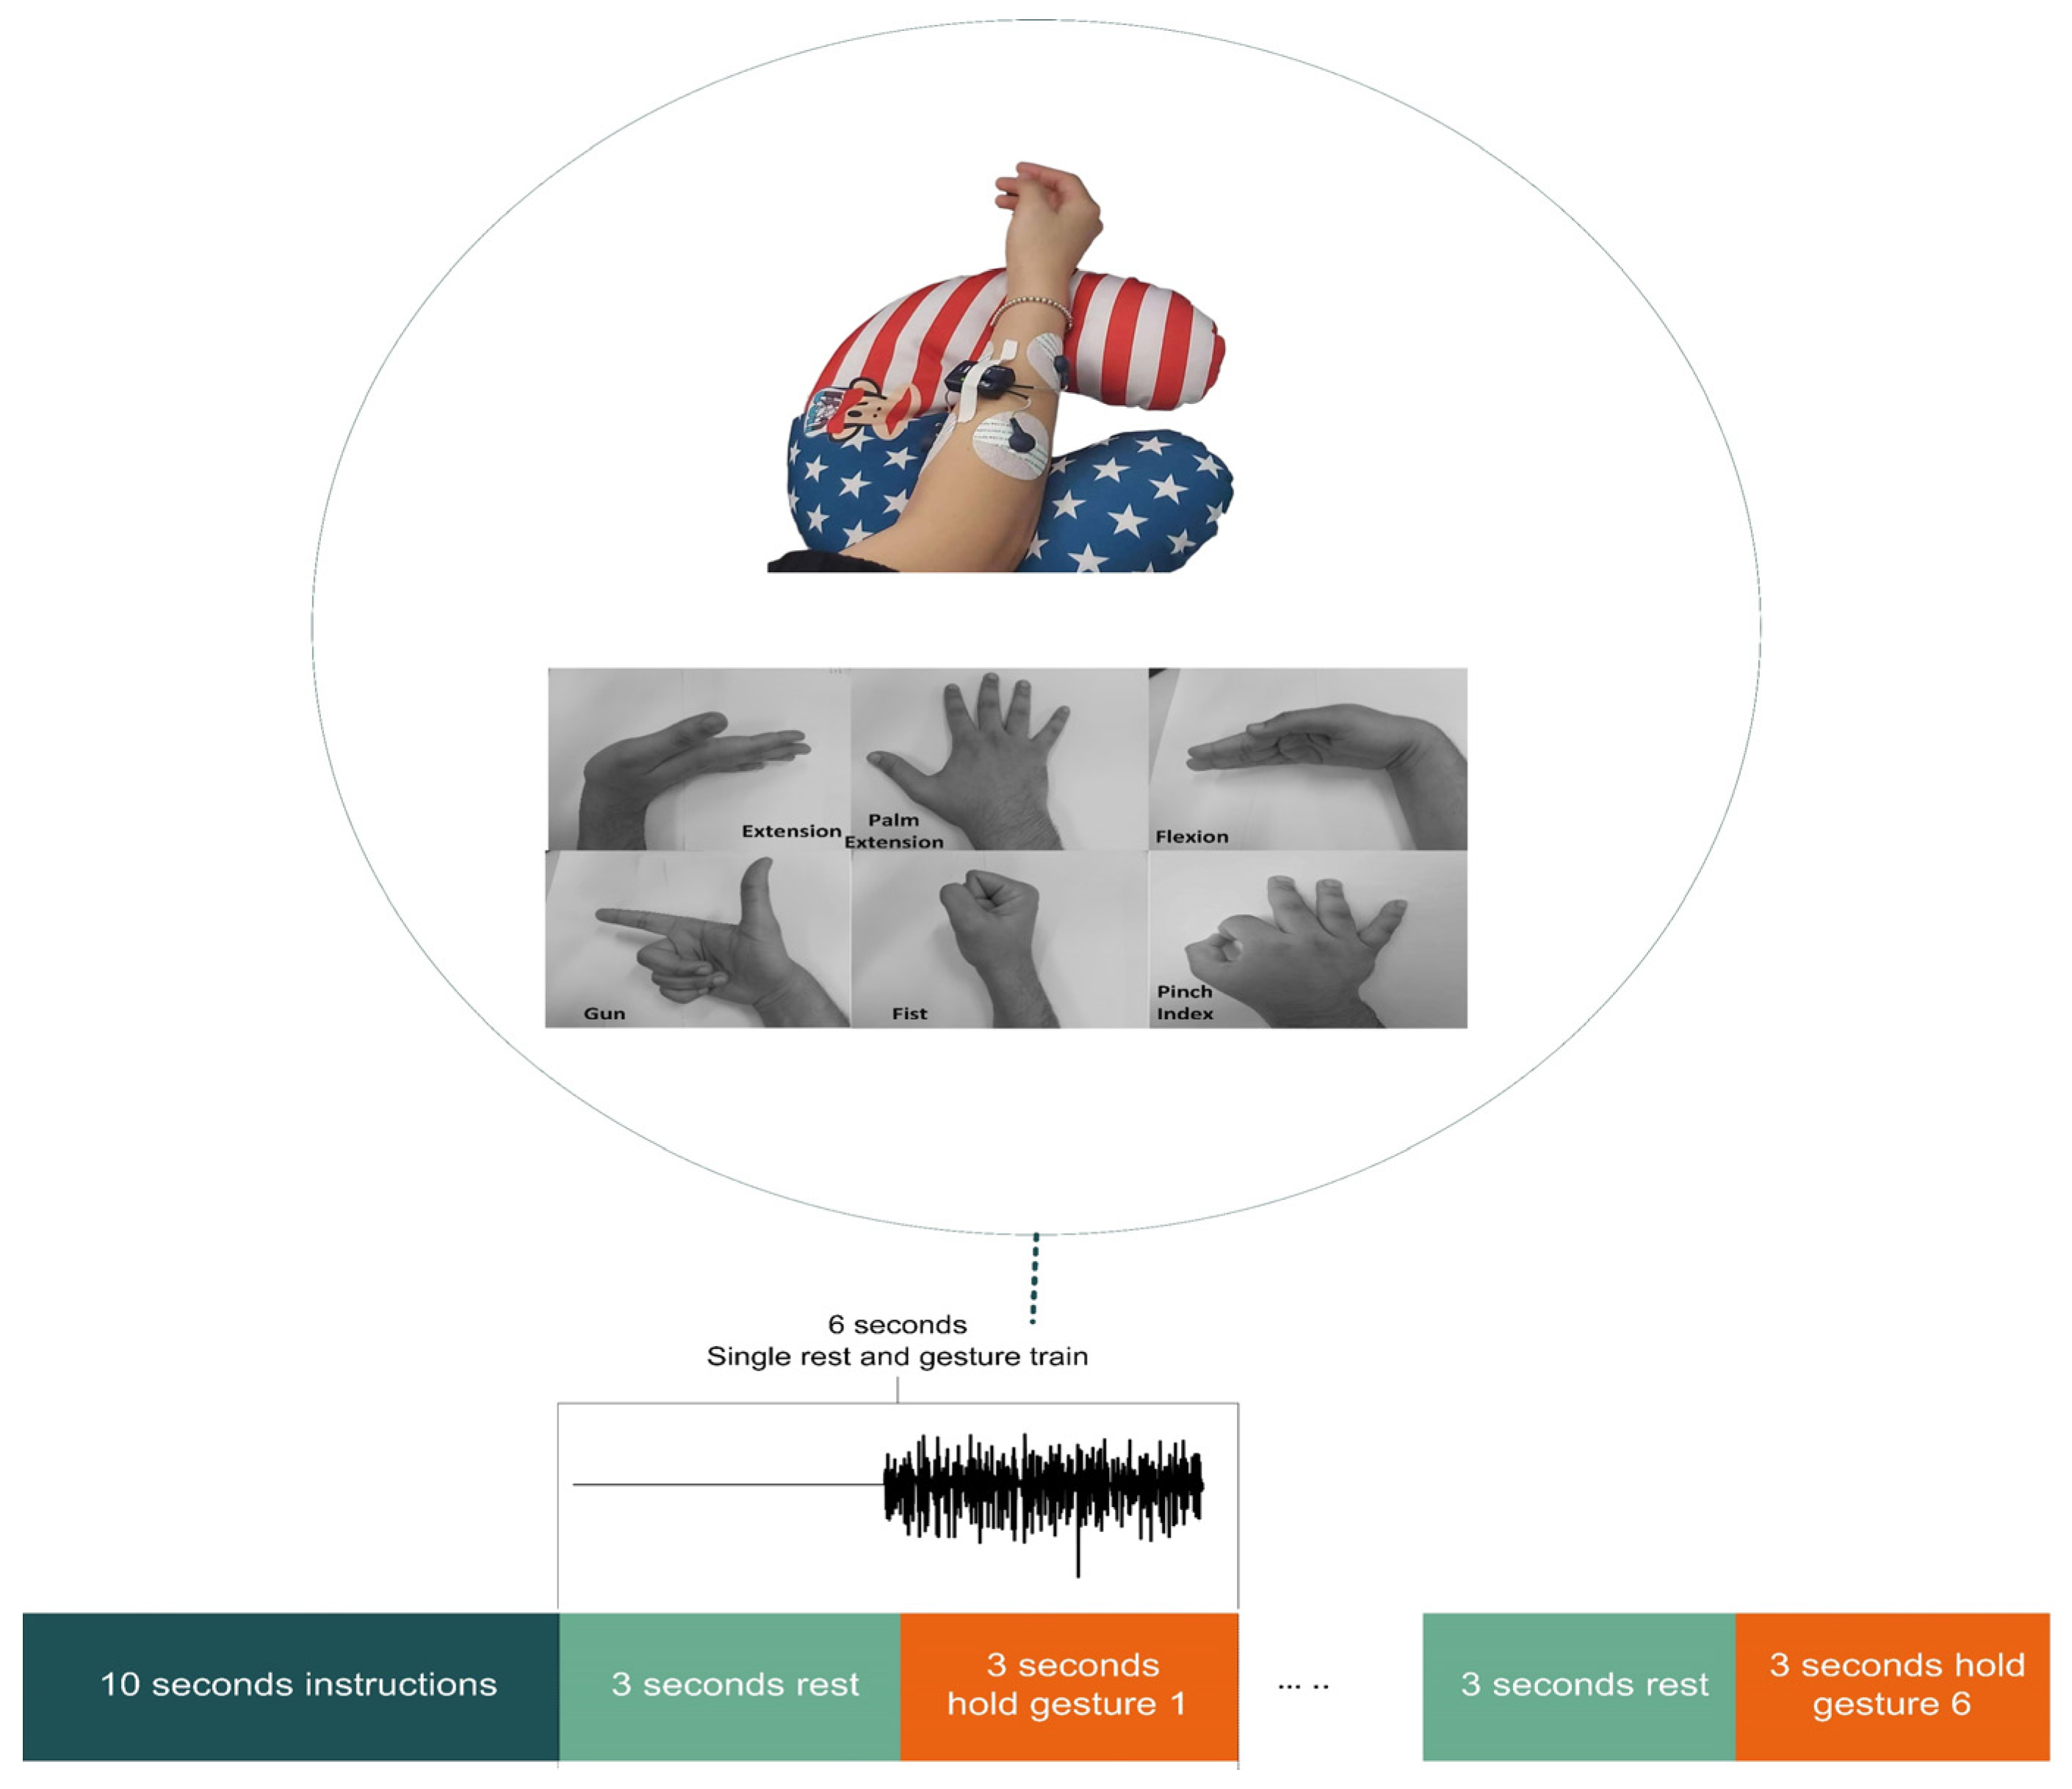
2.1. Data Acquisition
2.2. Signal Processing
2.2.1. Filtering
2.2.2. Feature Extraction
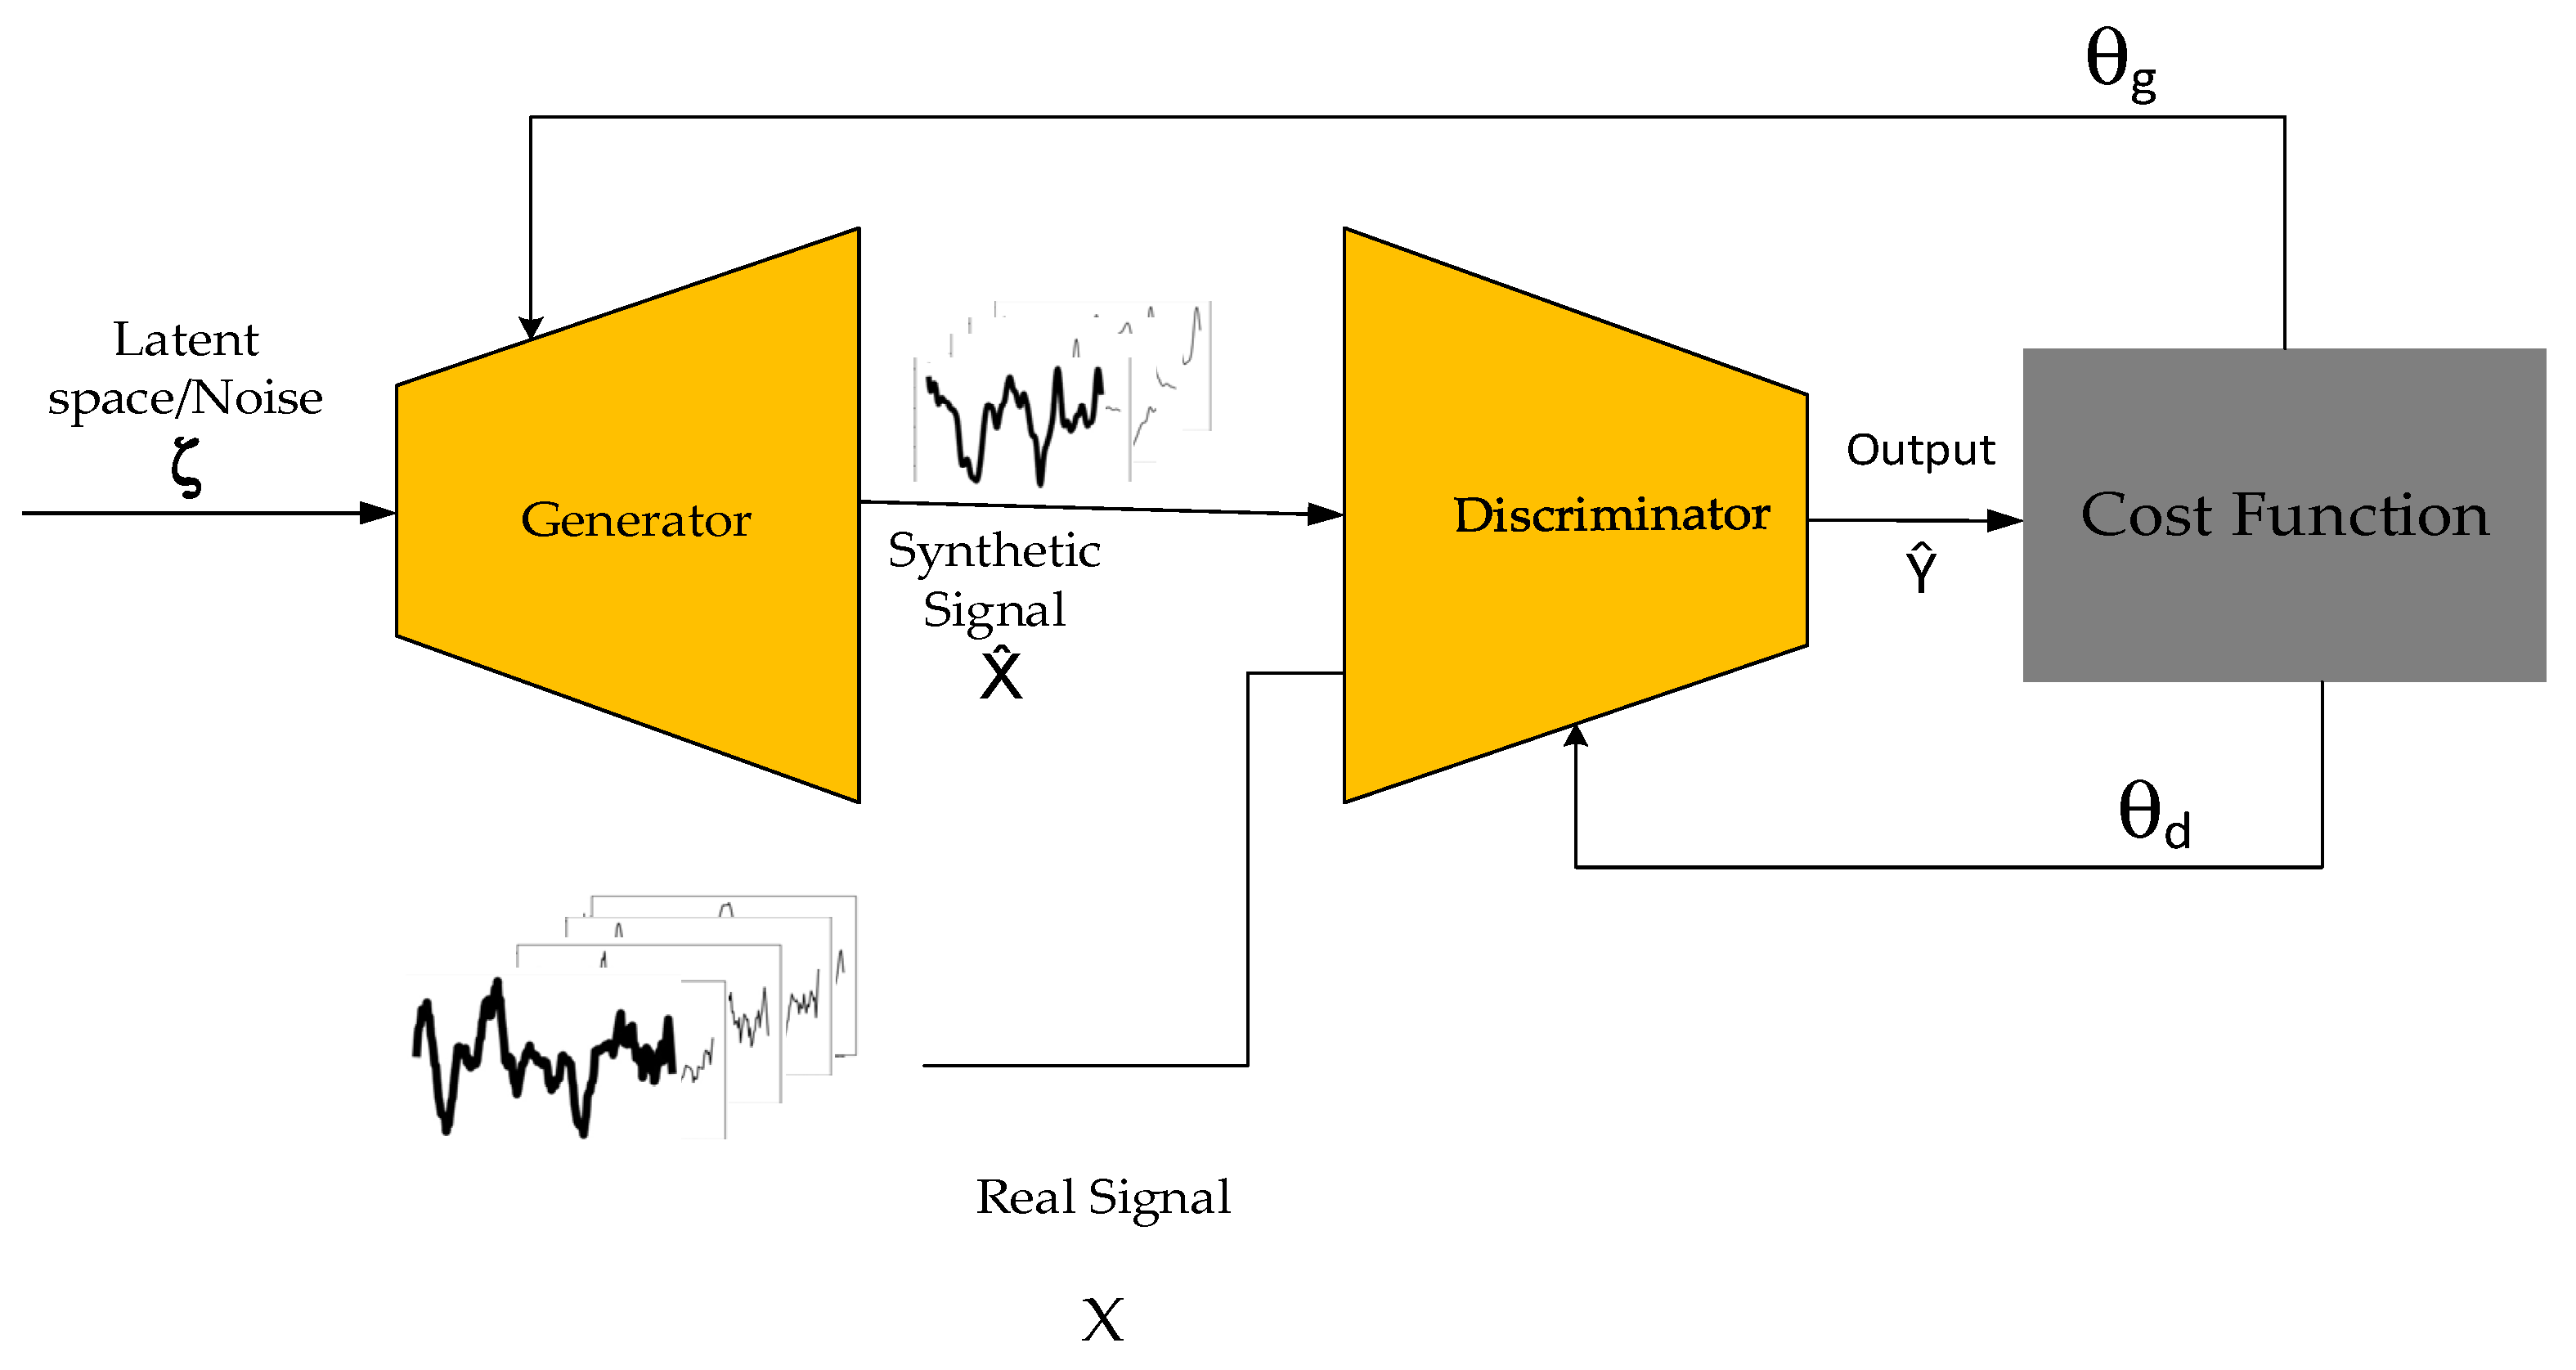
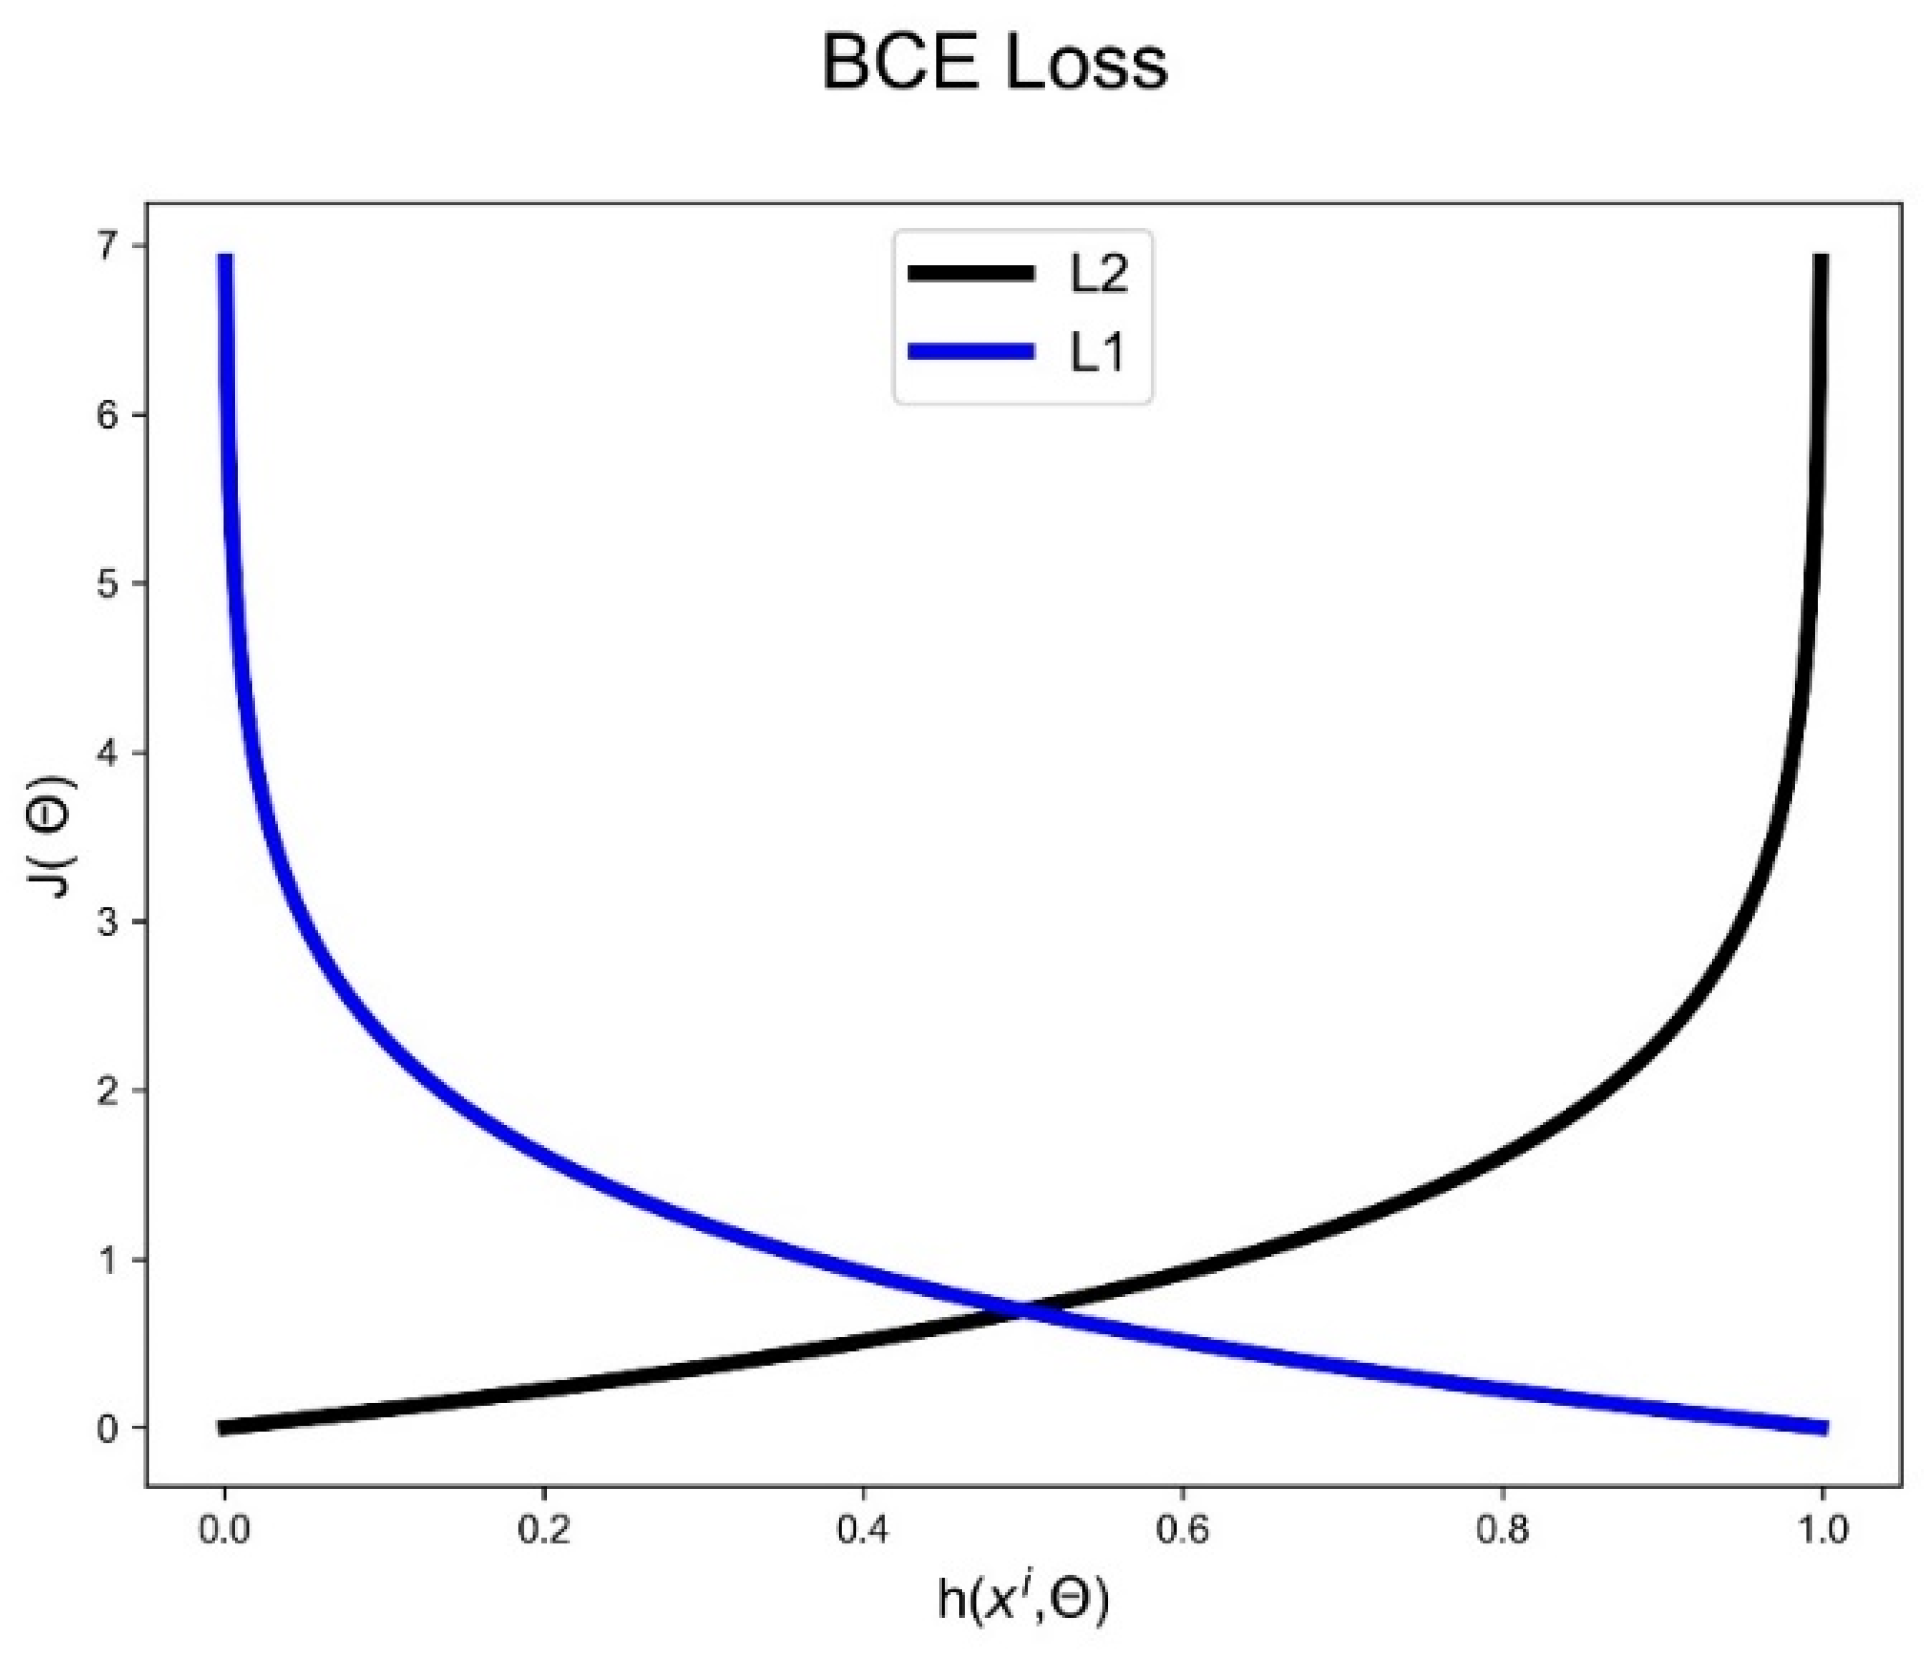
2.3. Generative Adversarial Network
- h: prediction,
- X: features,
- : parameters,
- y: label,
- J: average patch loss.
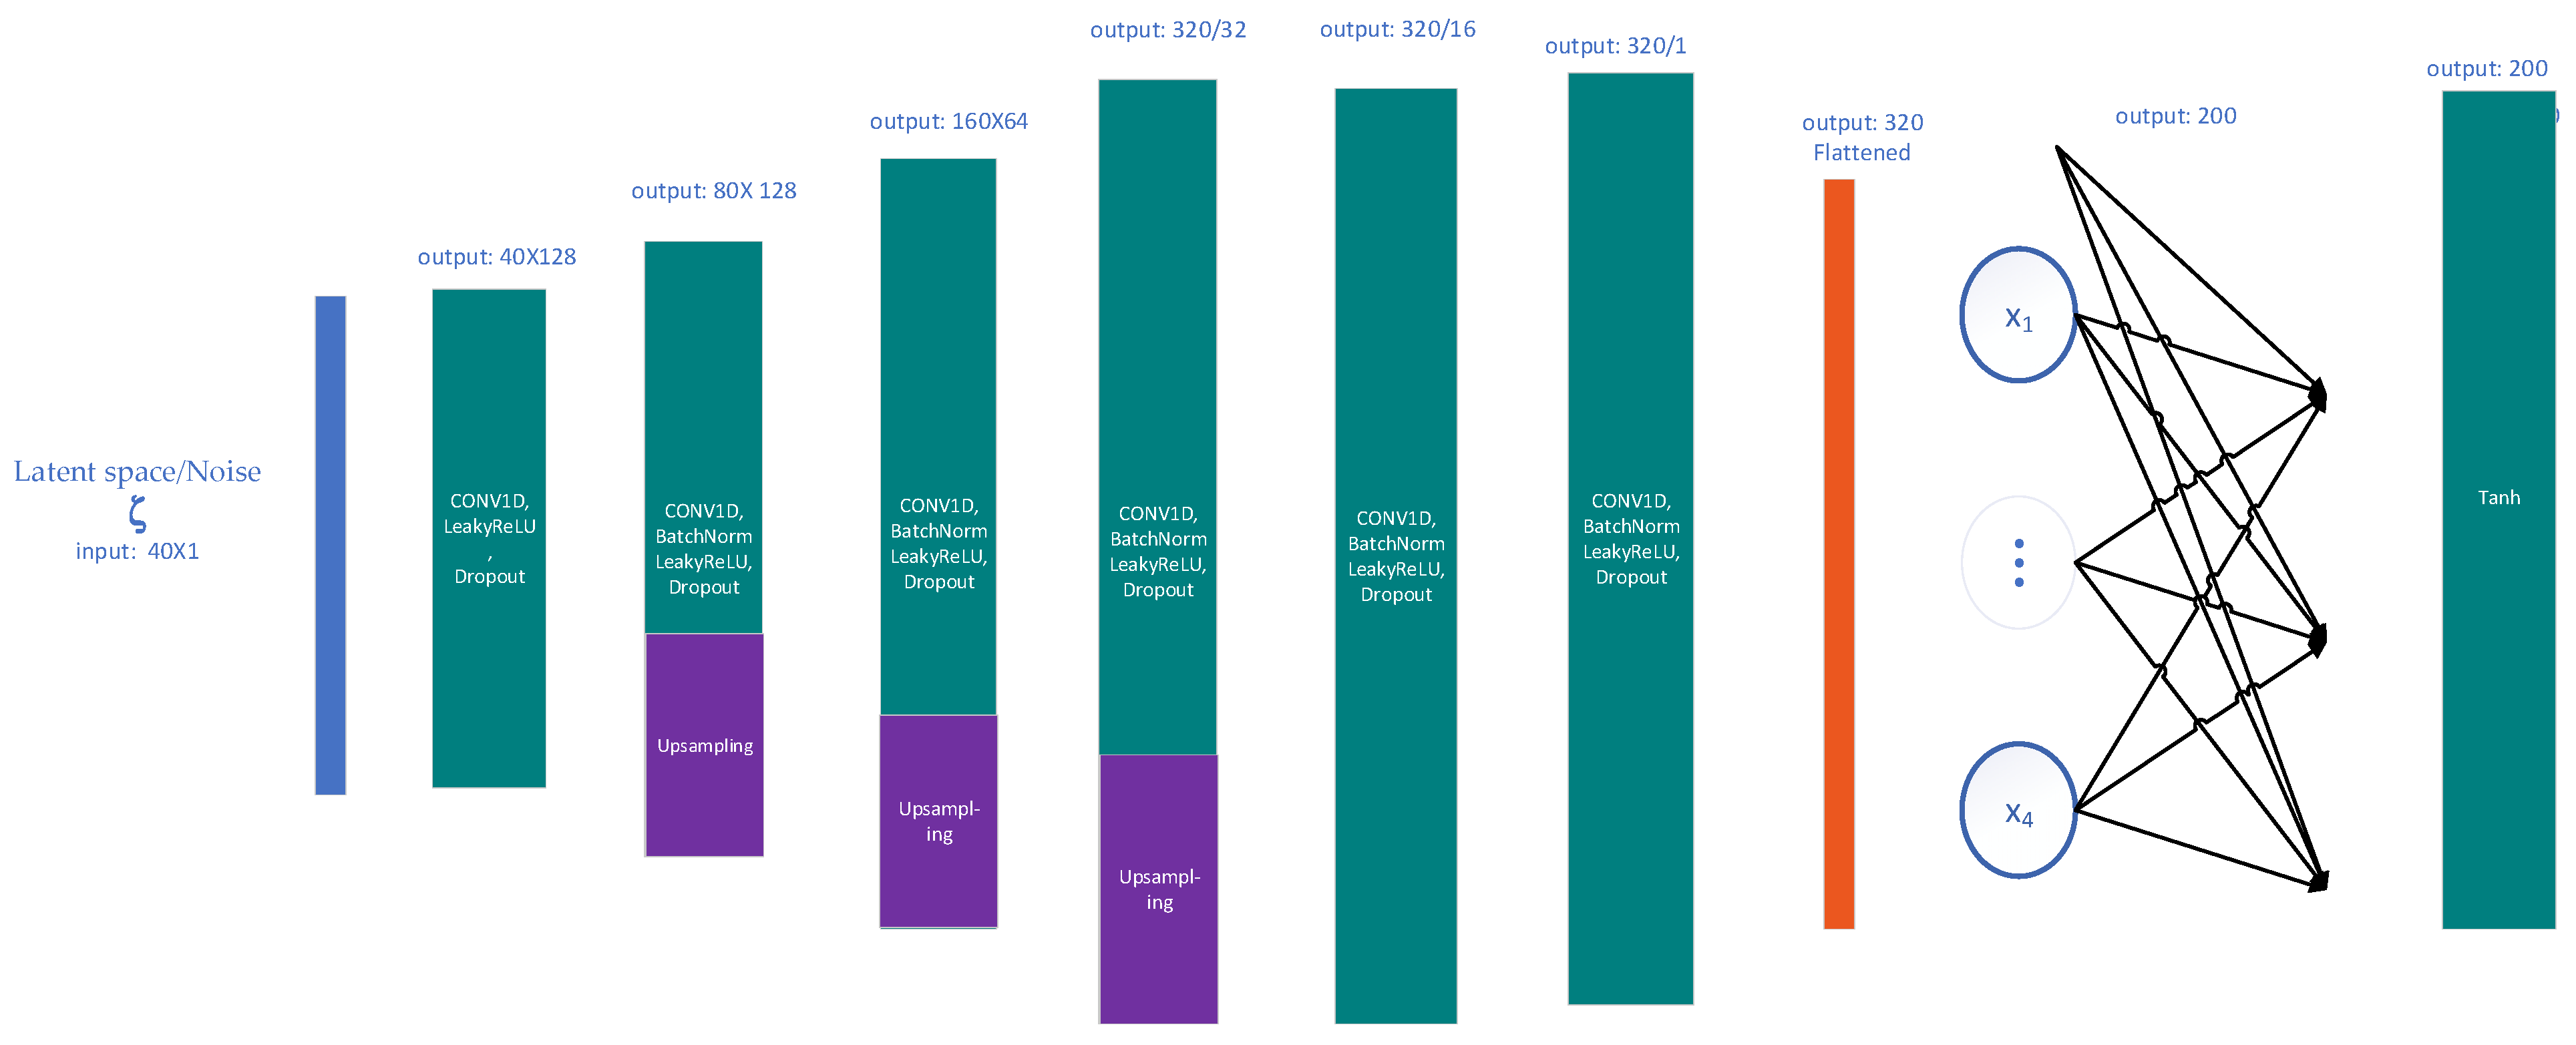
Proposed Architecture
- Generator
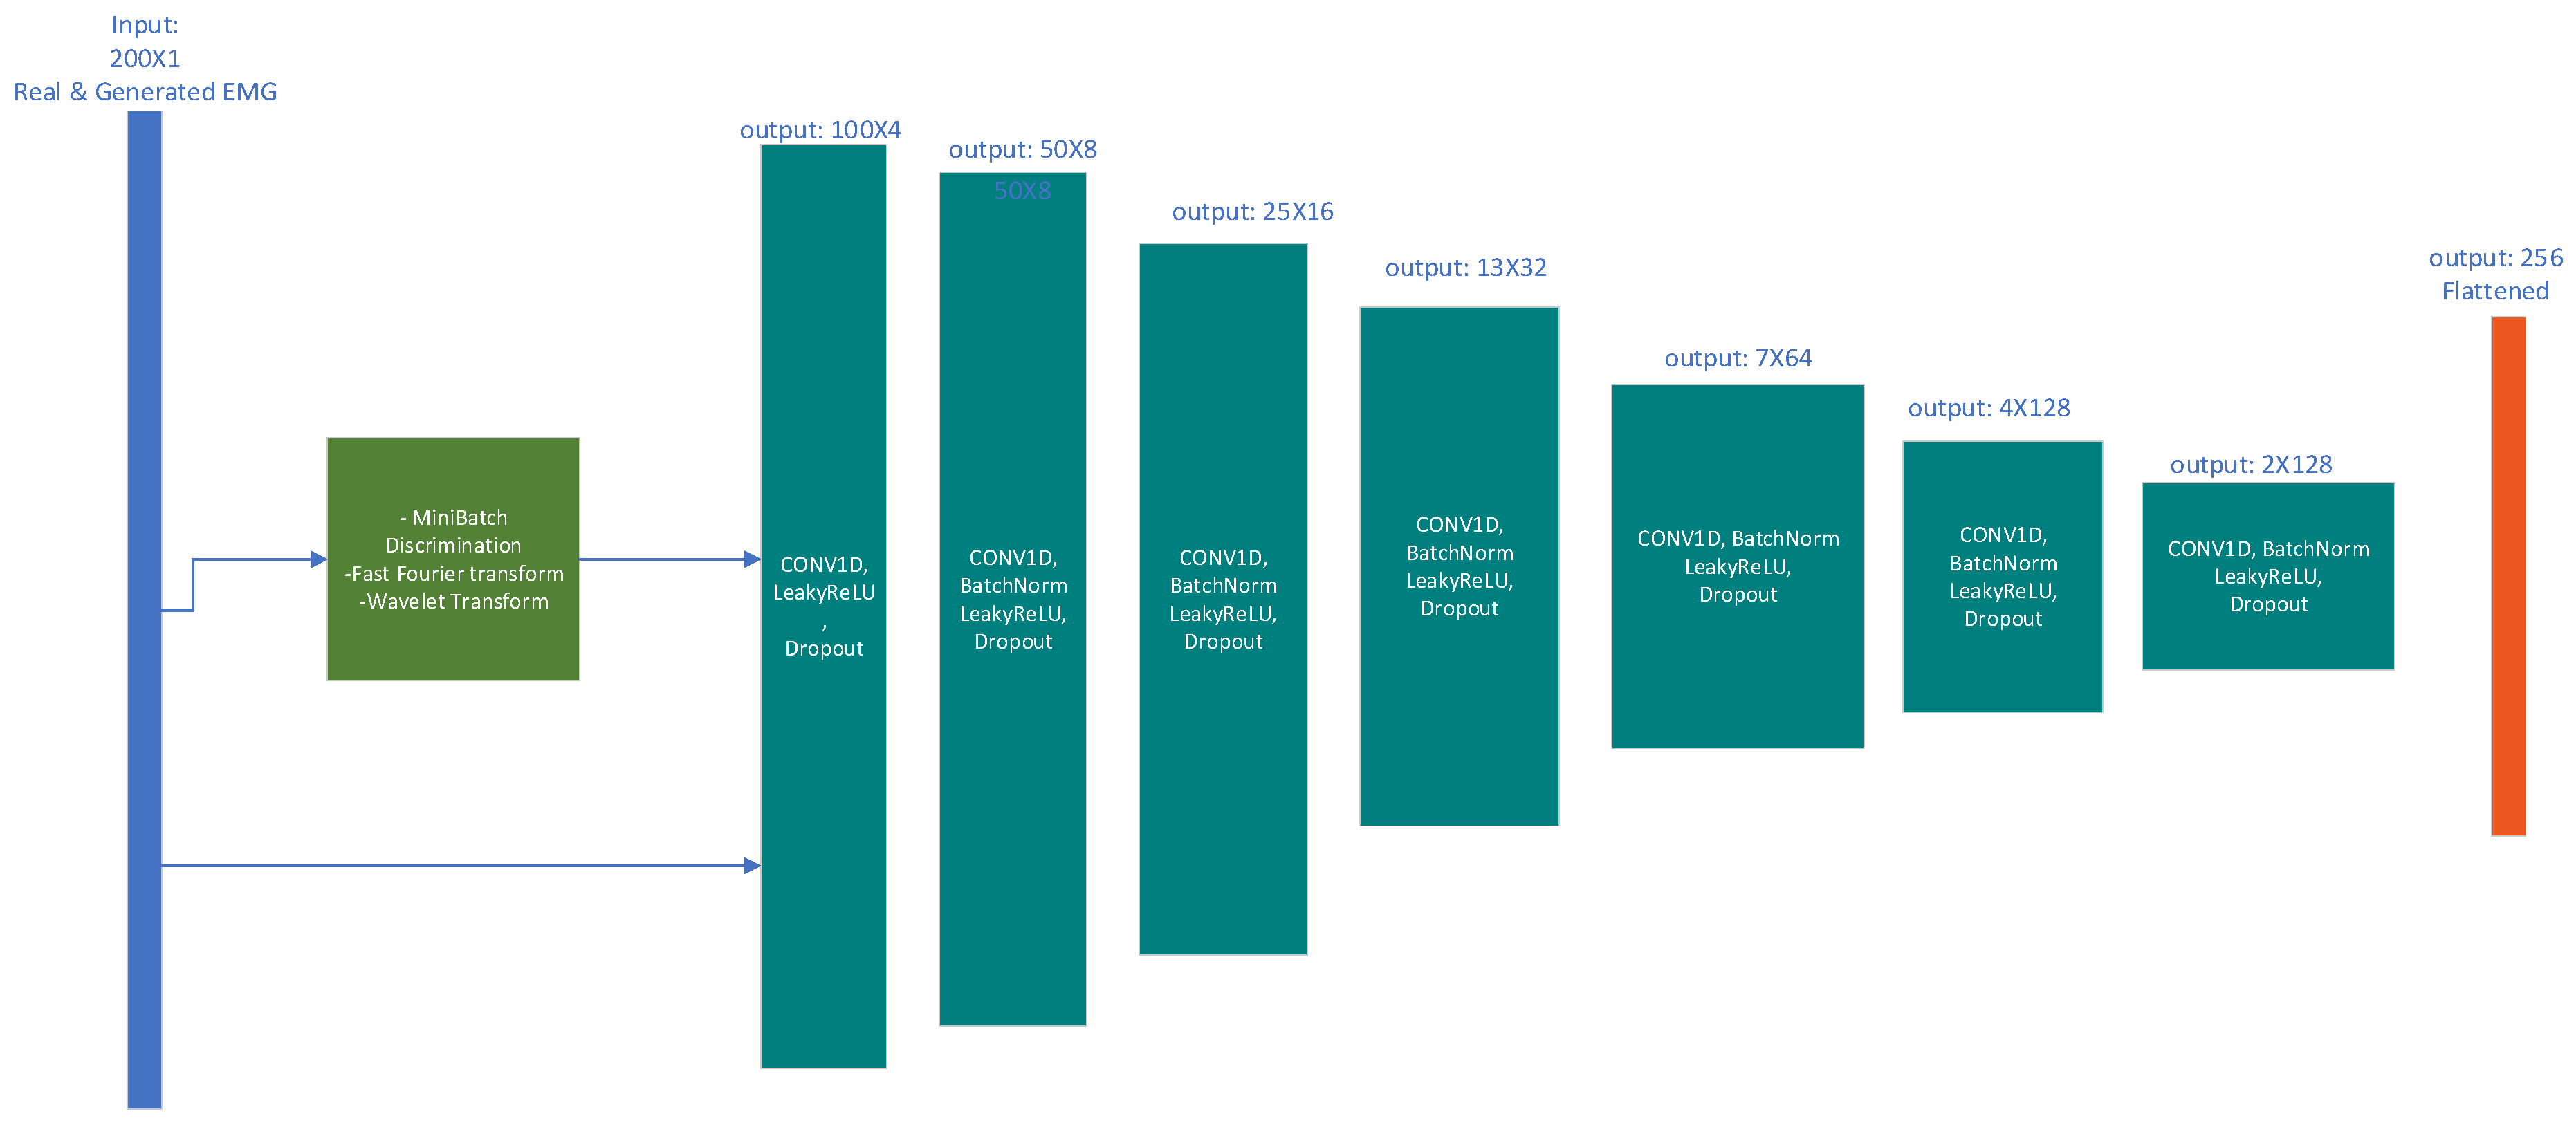
- Discriminator
2.4. Evaluation
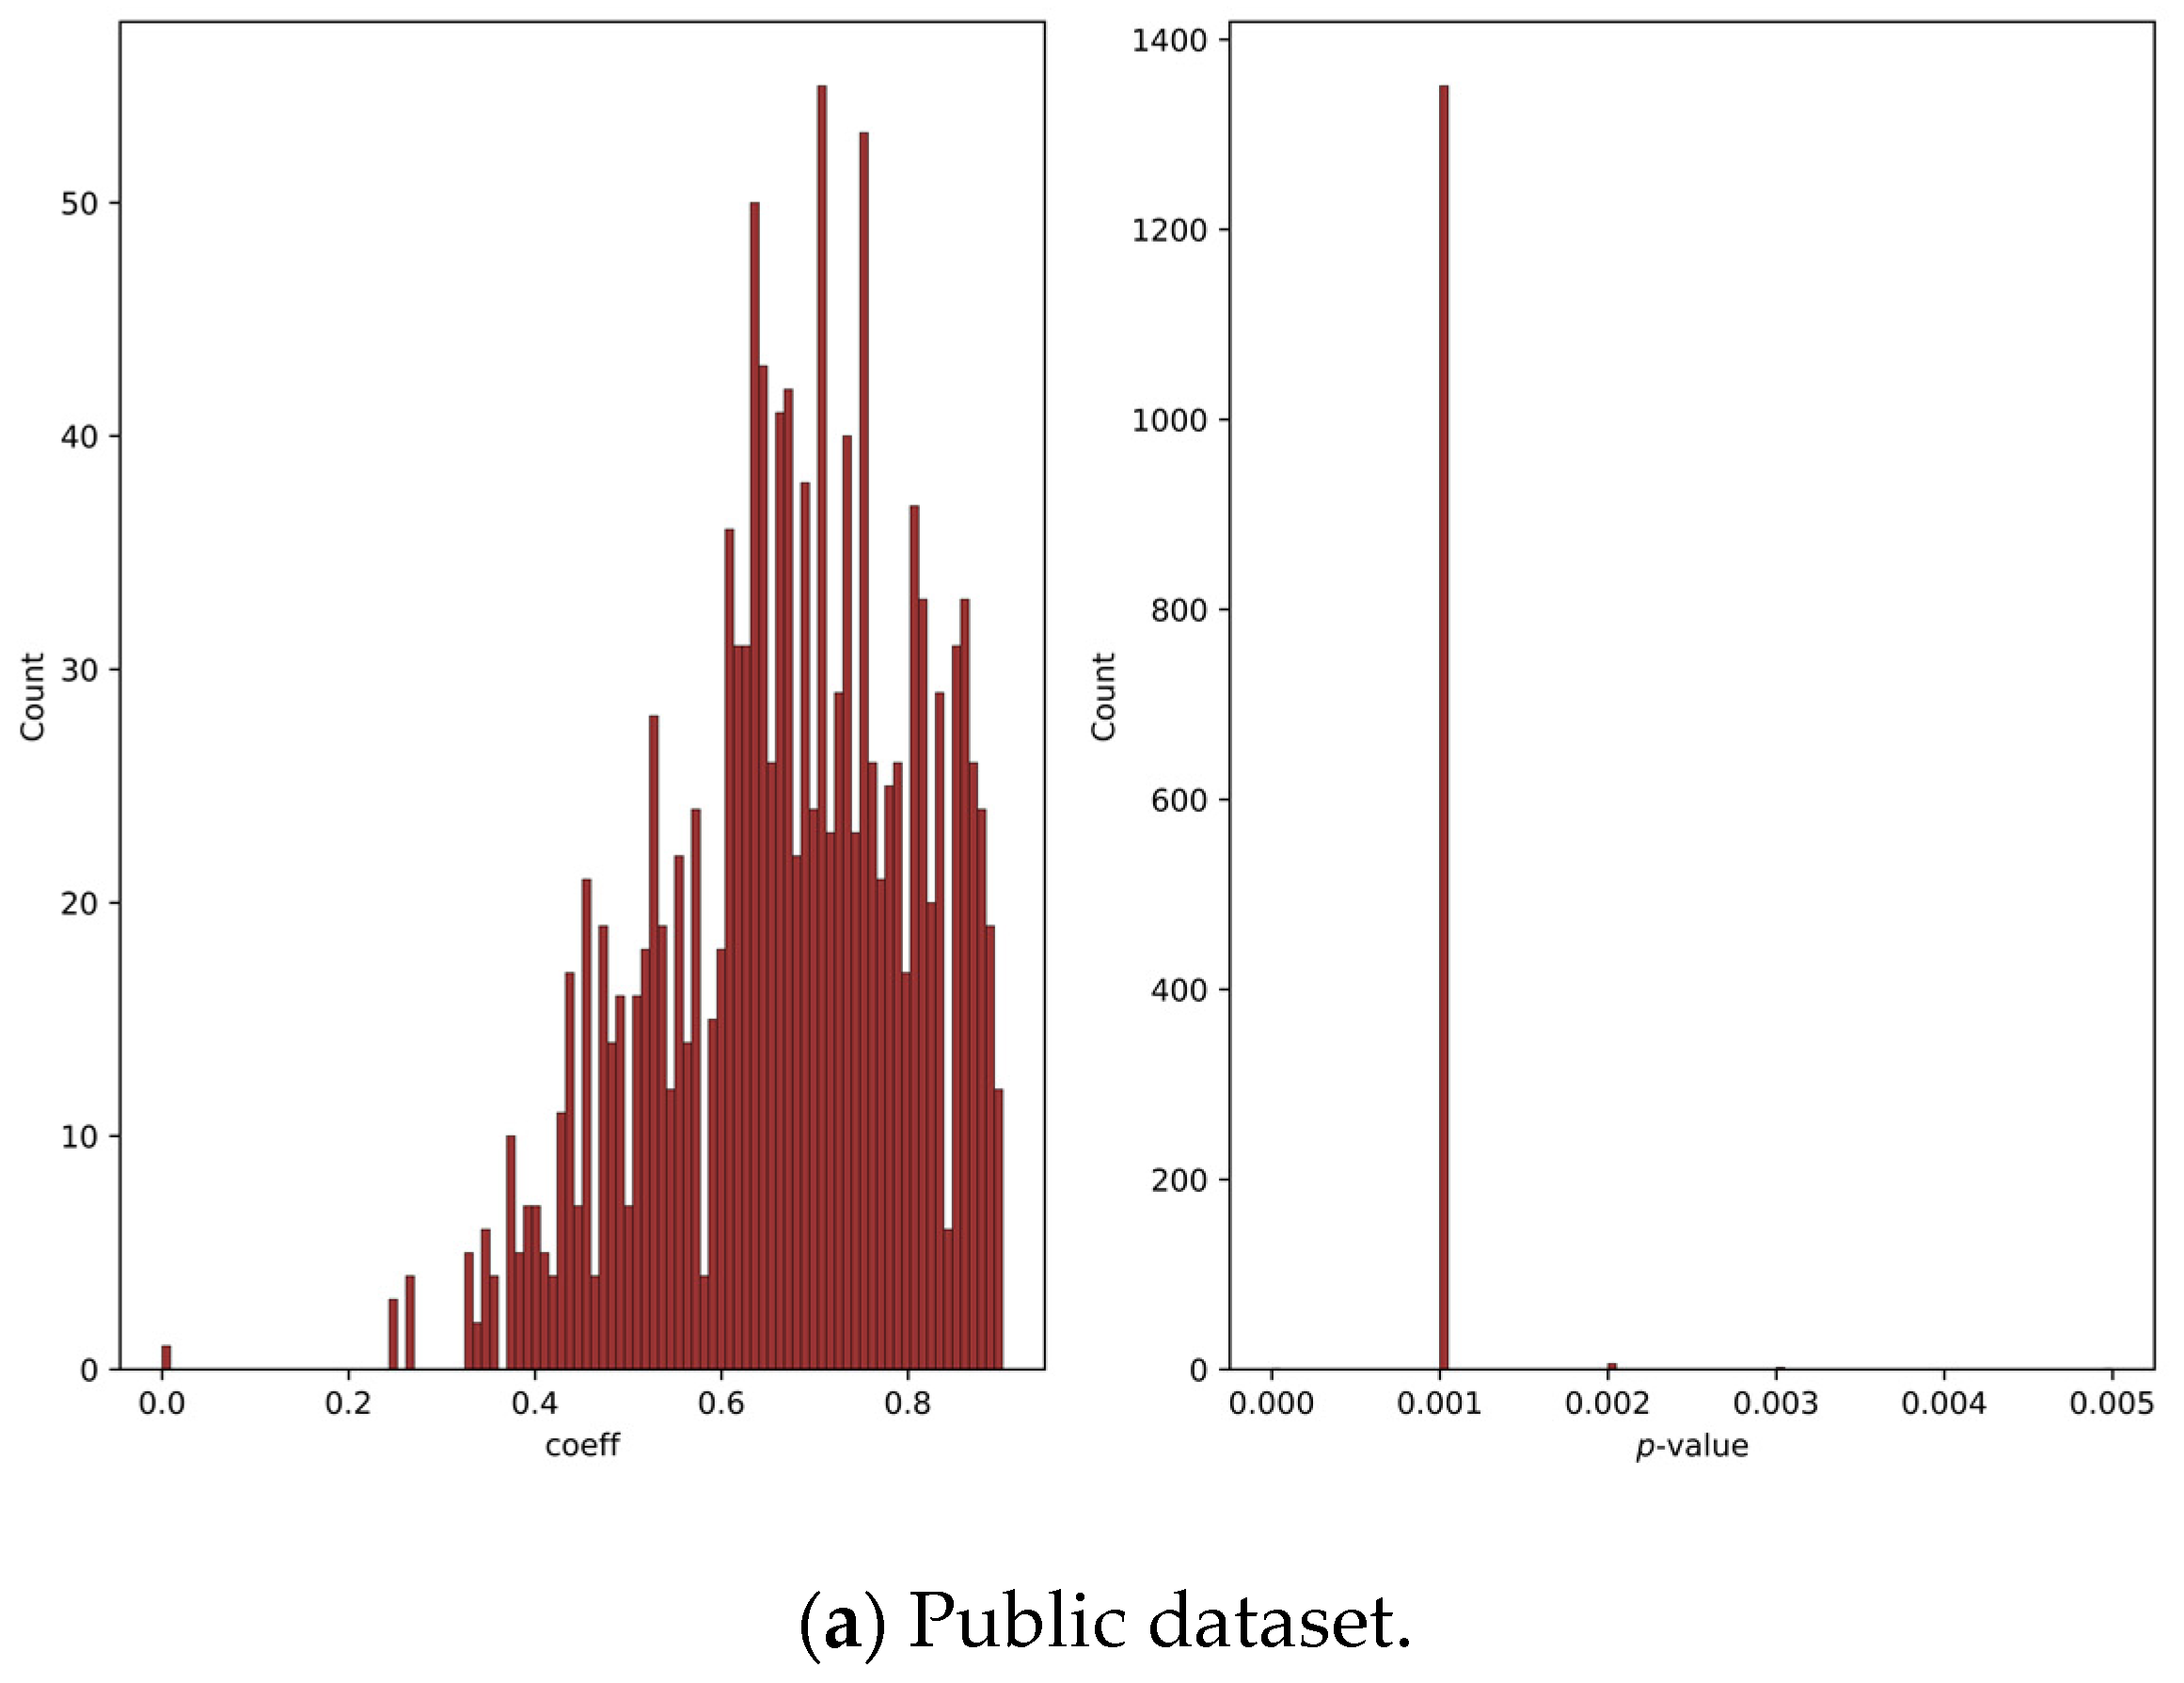
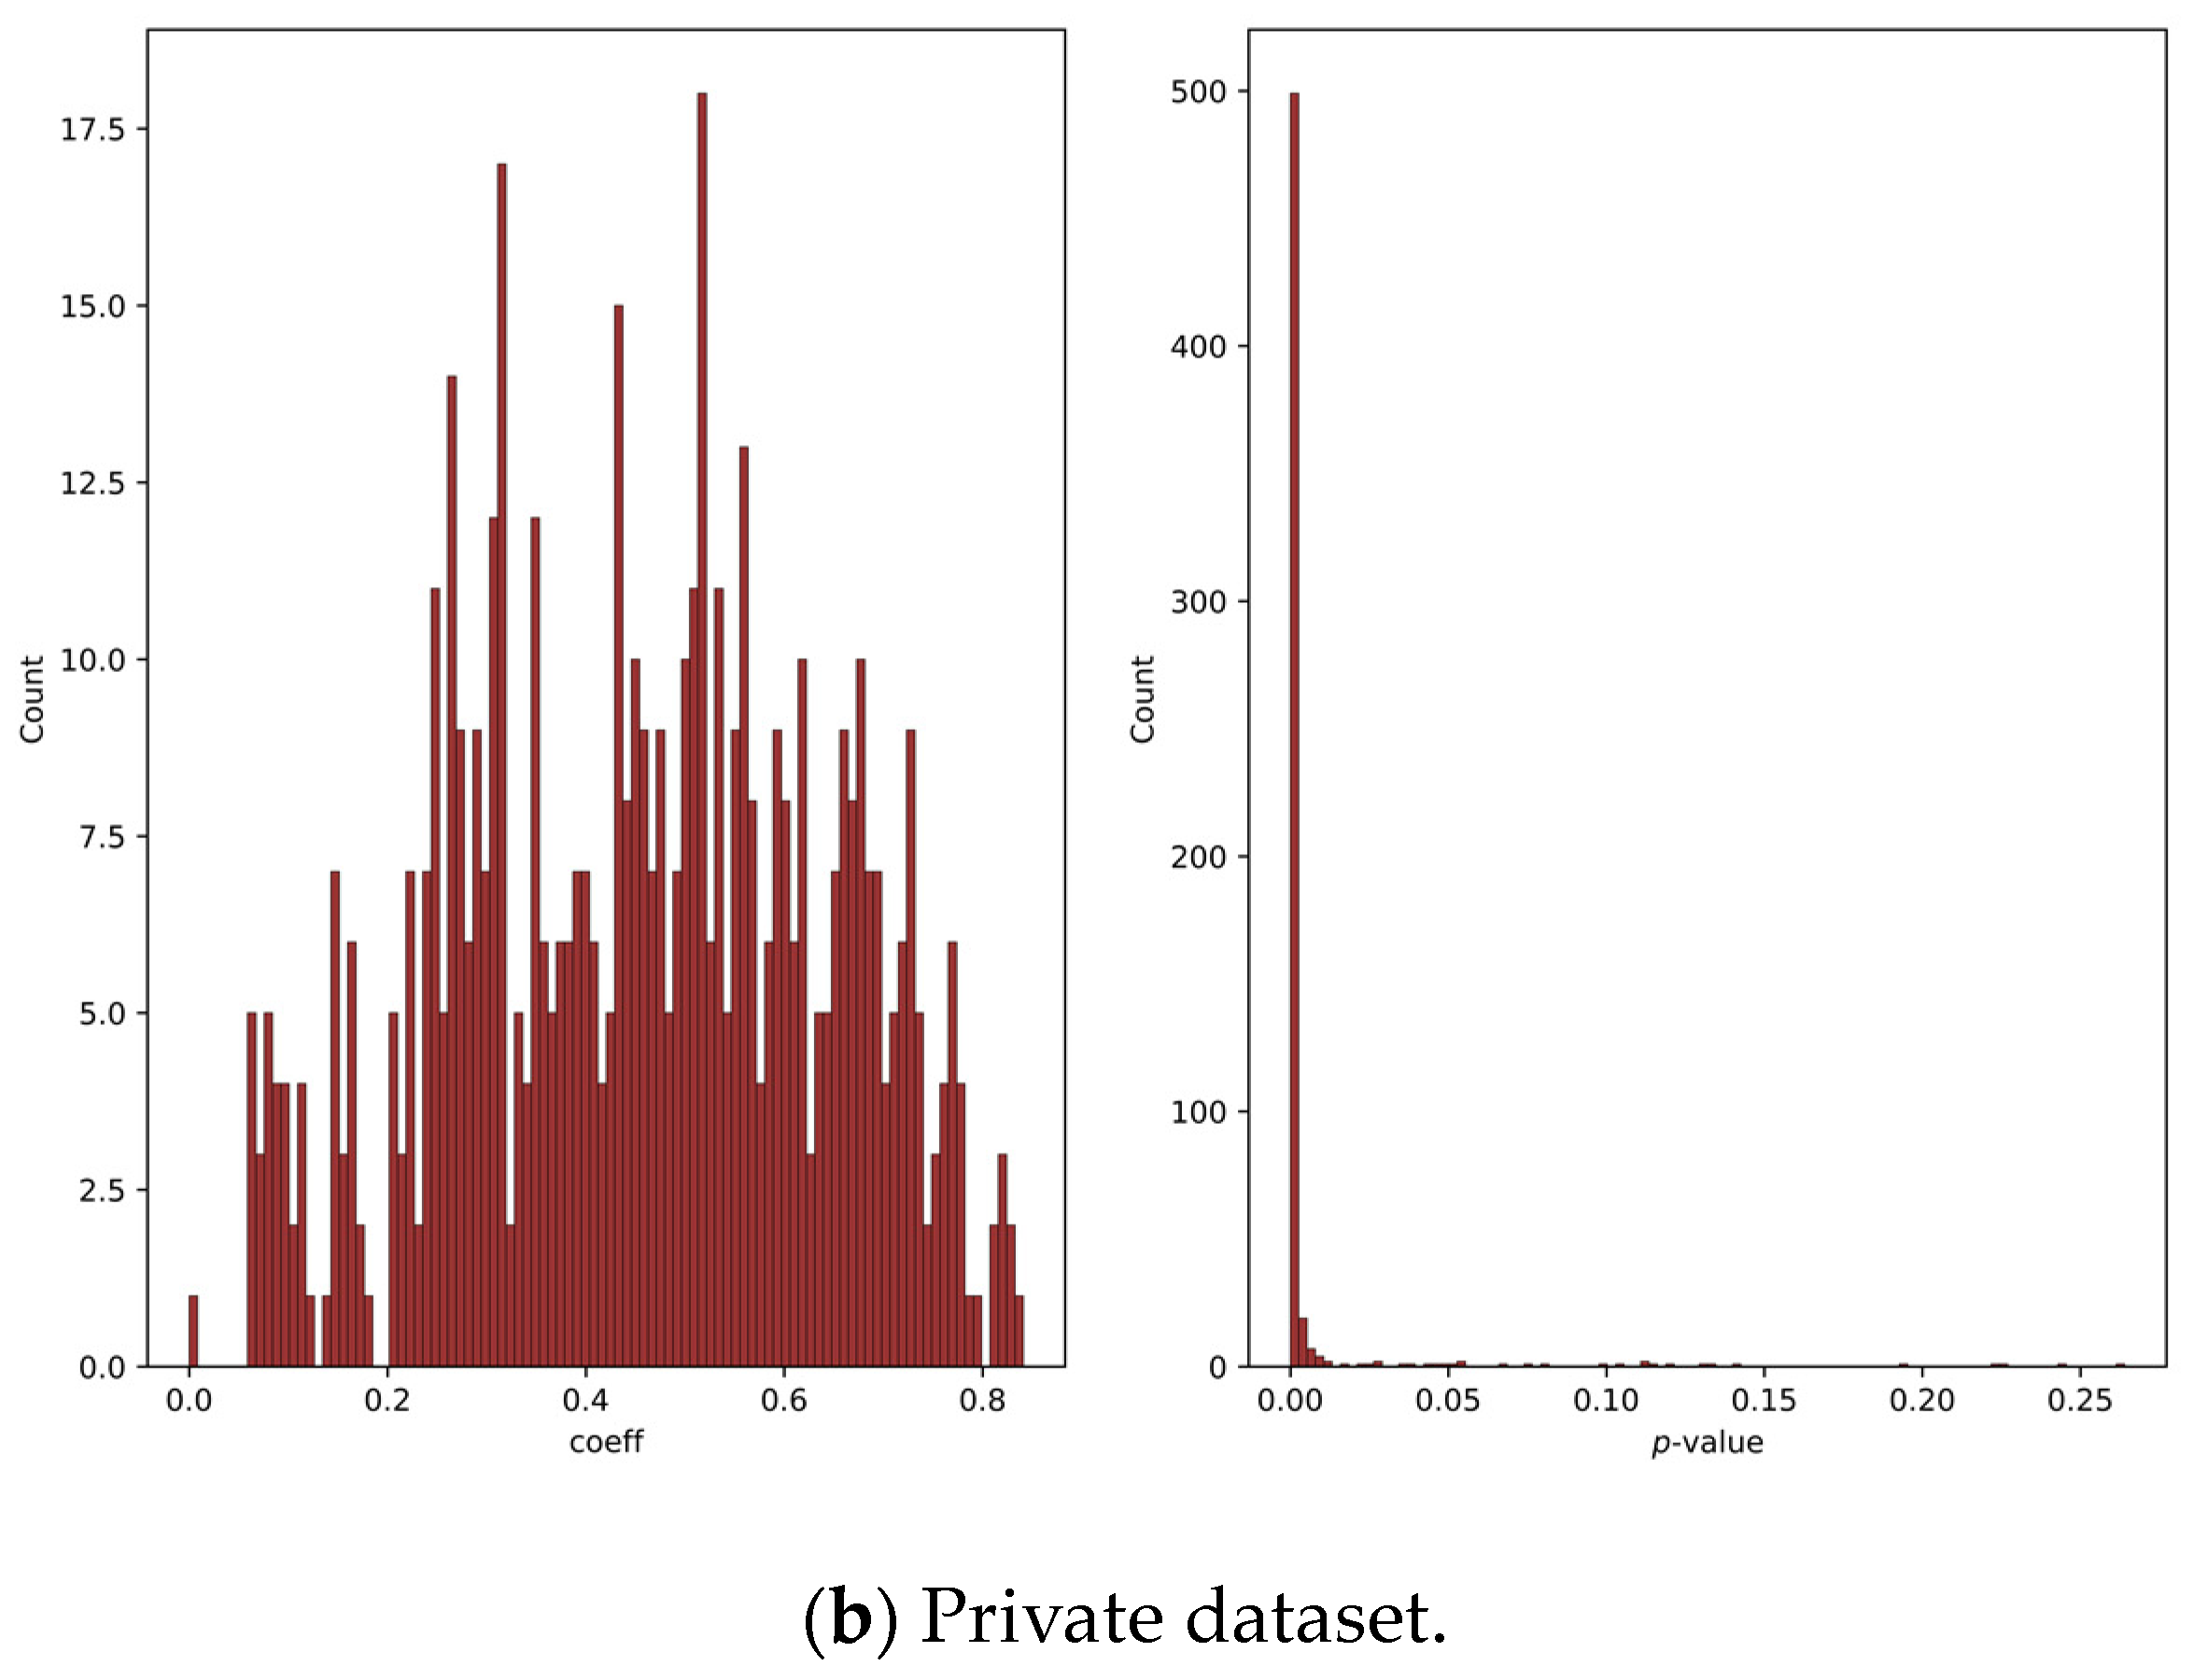
2.4.1. Mantel Test
2.4.2. Classification
2.4.3. Augmentation Classification Improvement
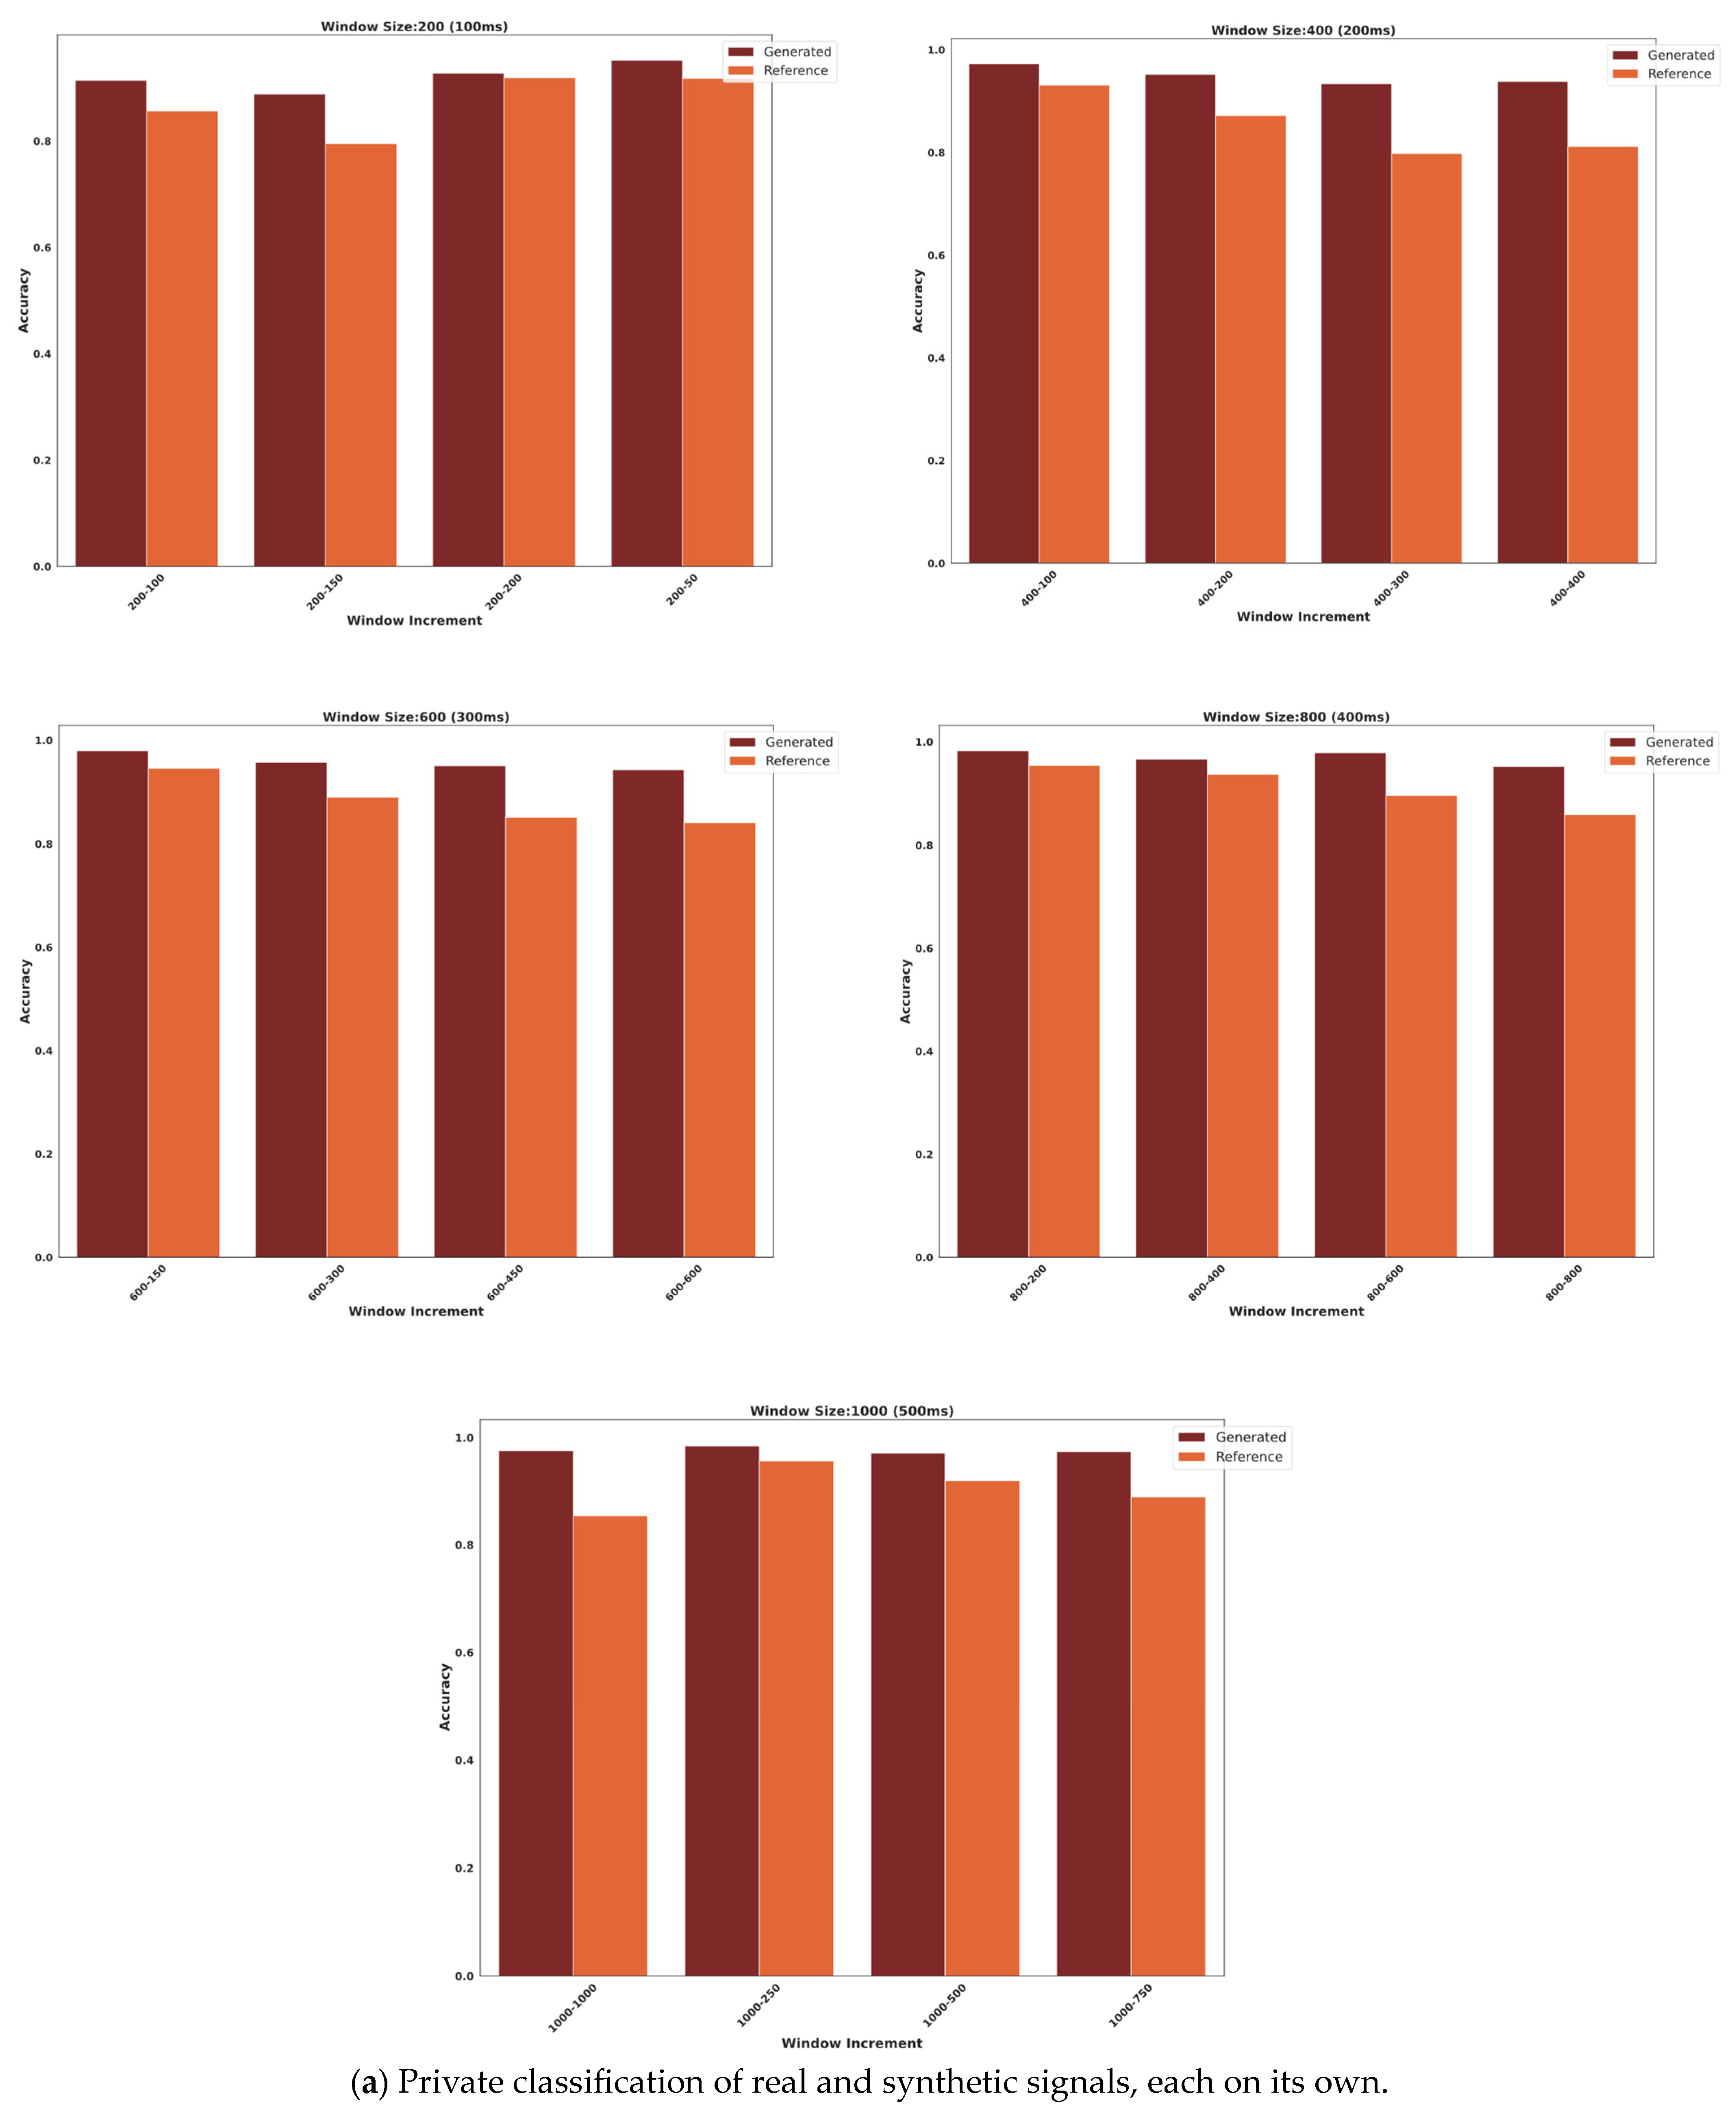
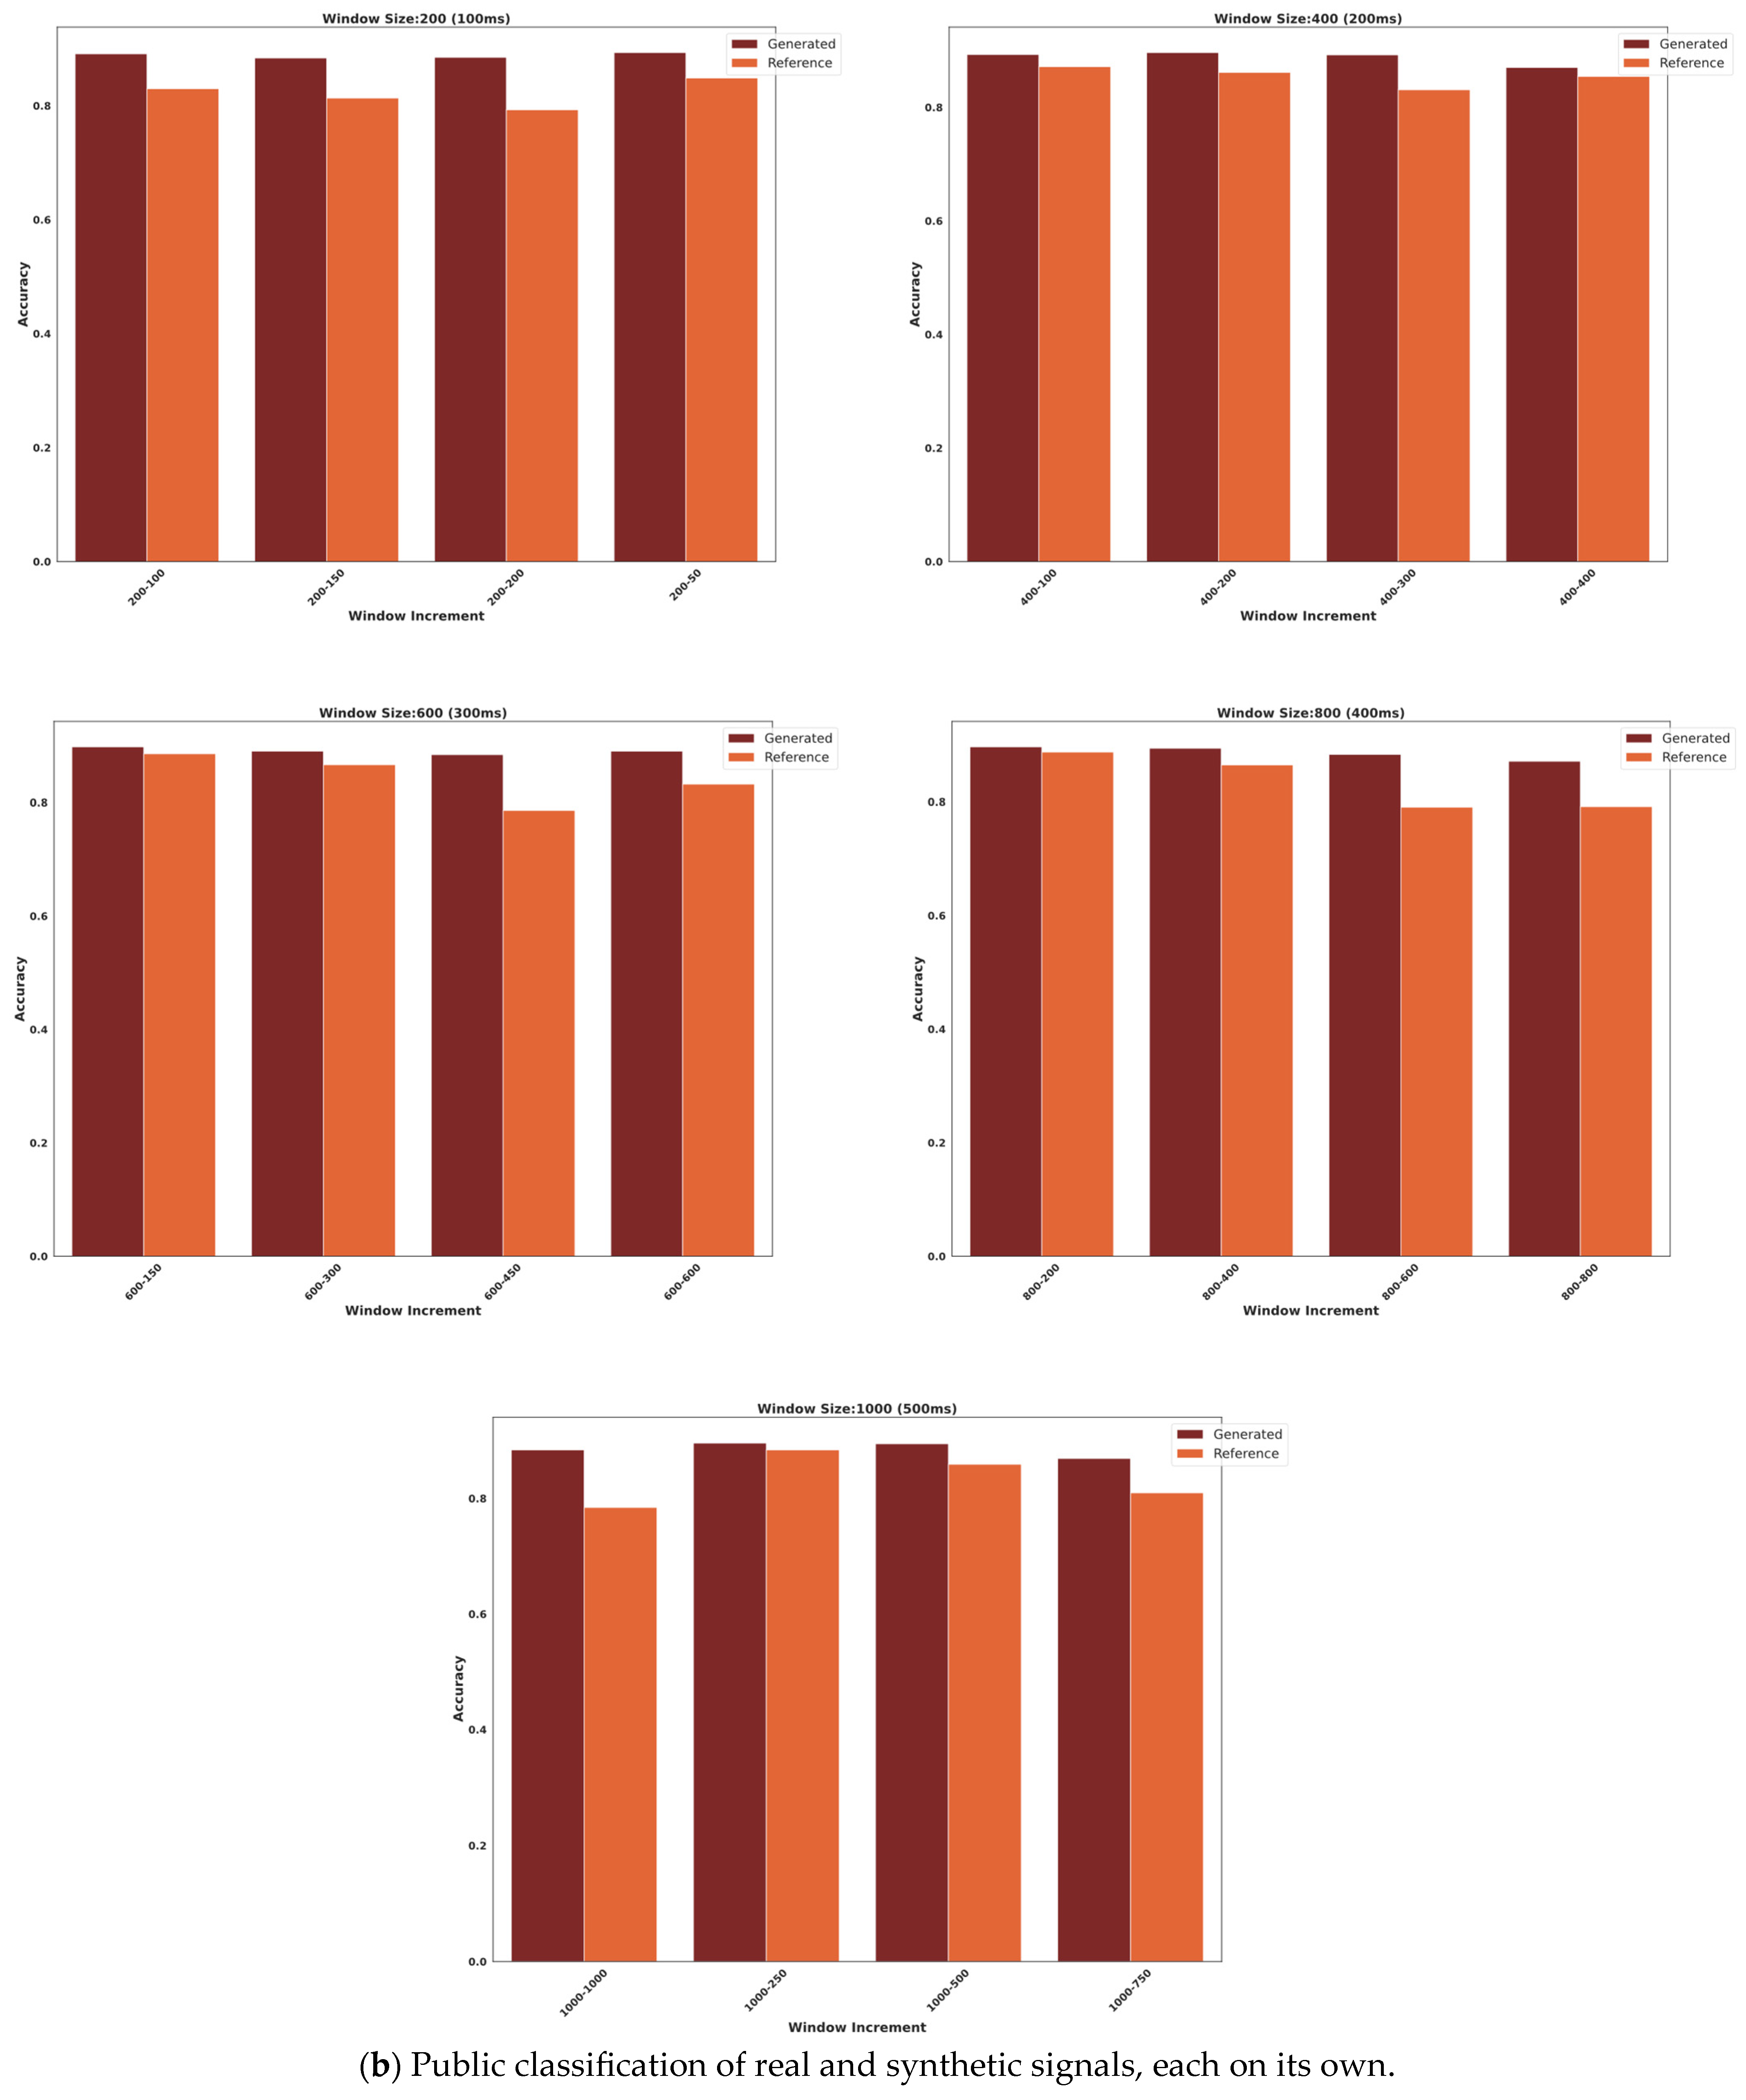
2.4.4. Classifier Two-Sample Test
3. Results
3.1. Mantel Test Analysis
3.2. Classification
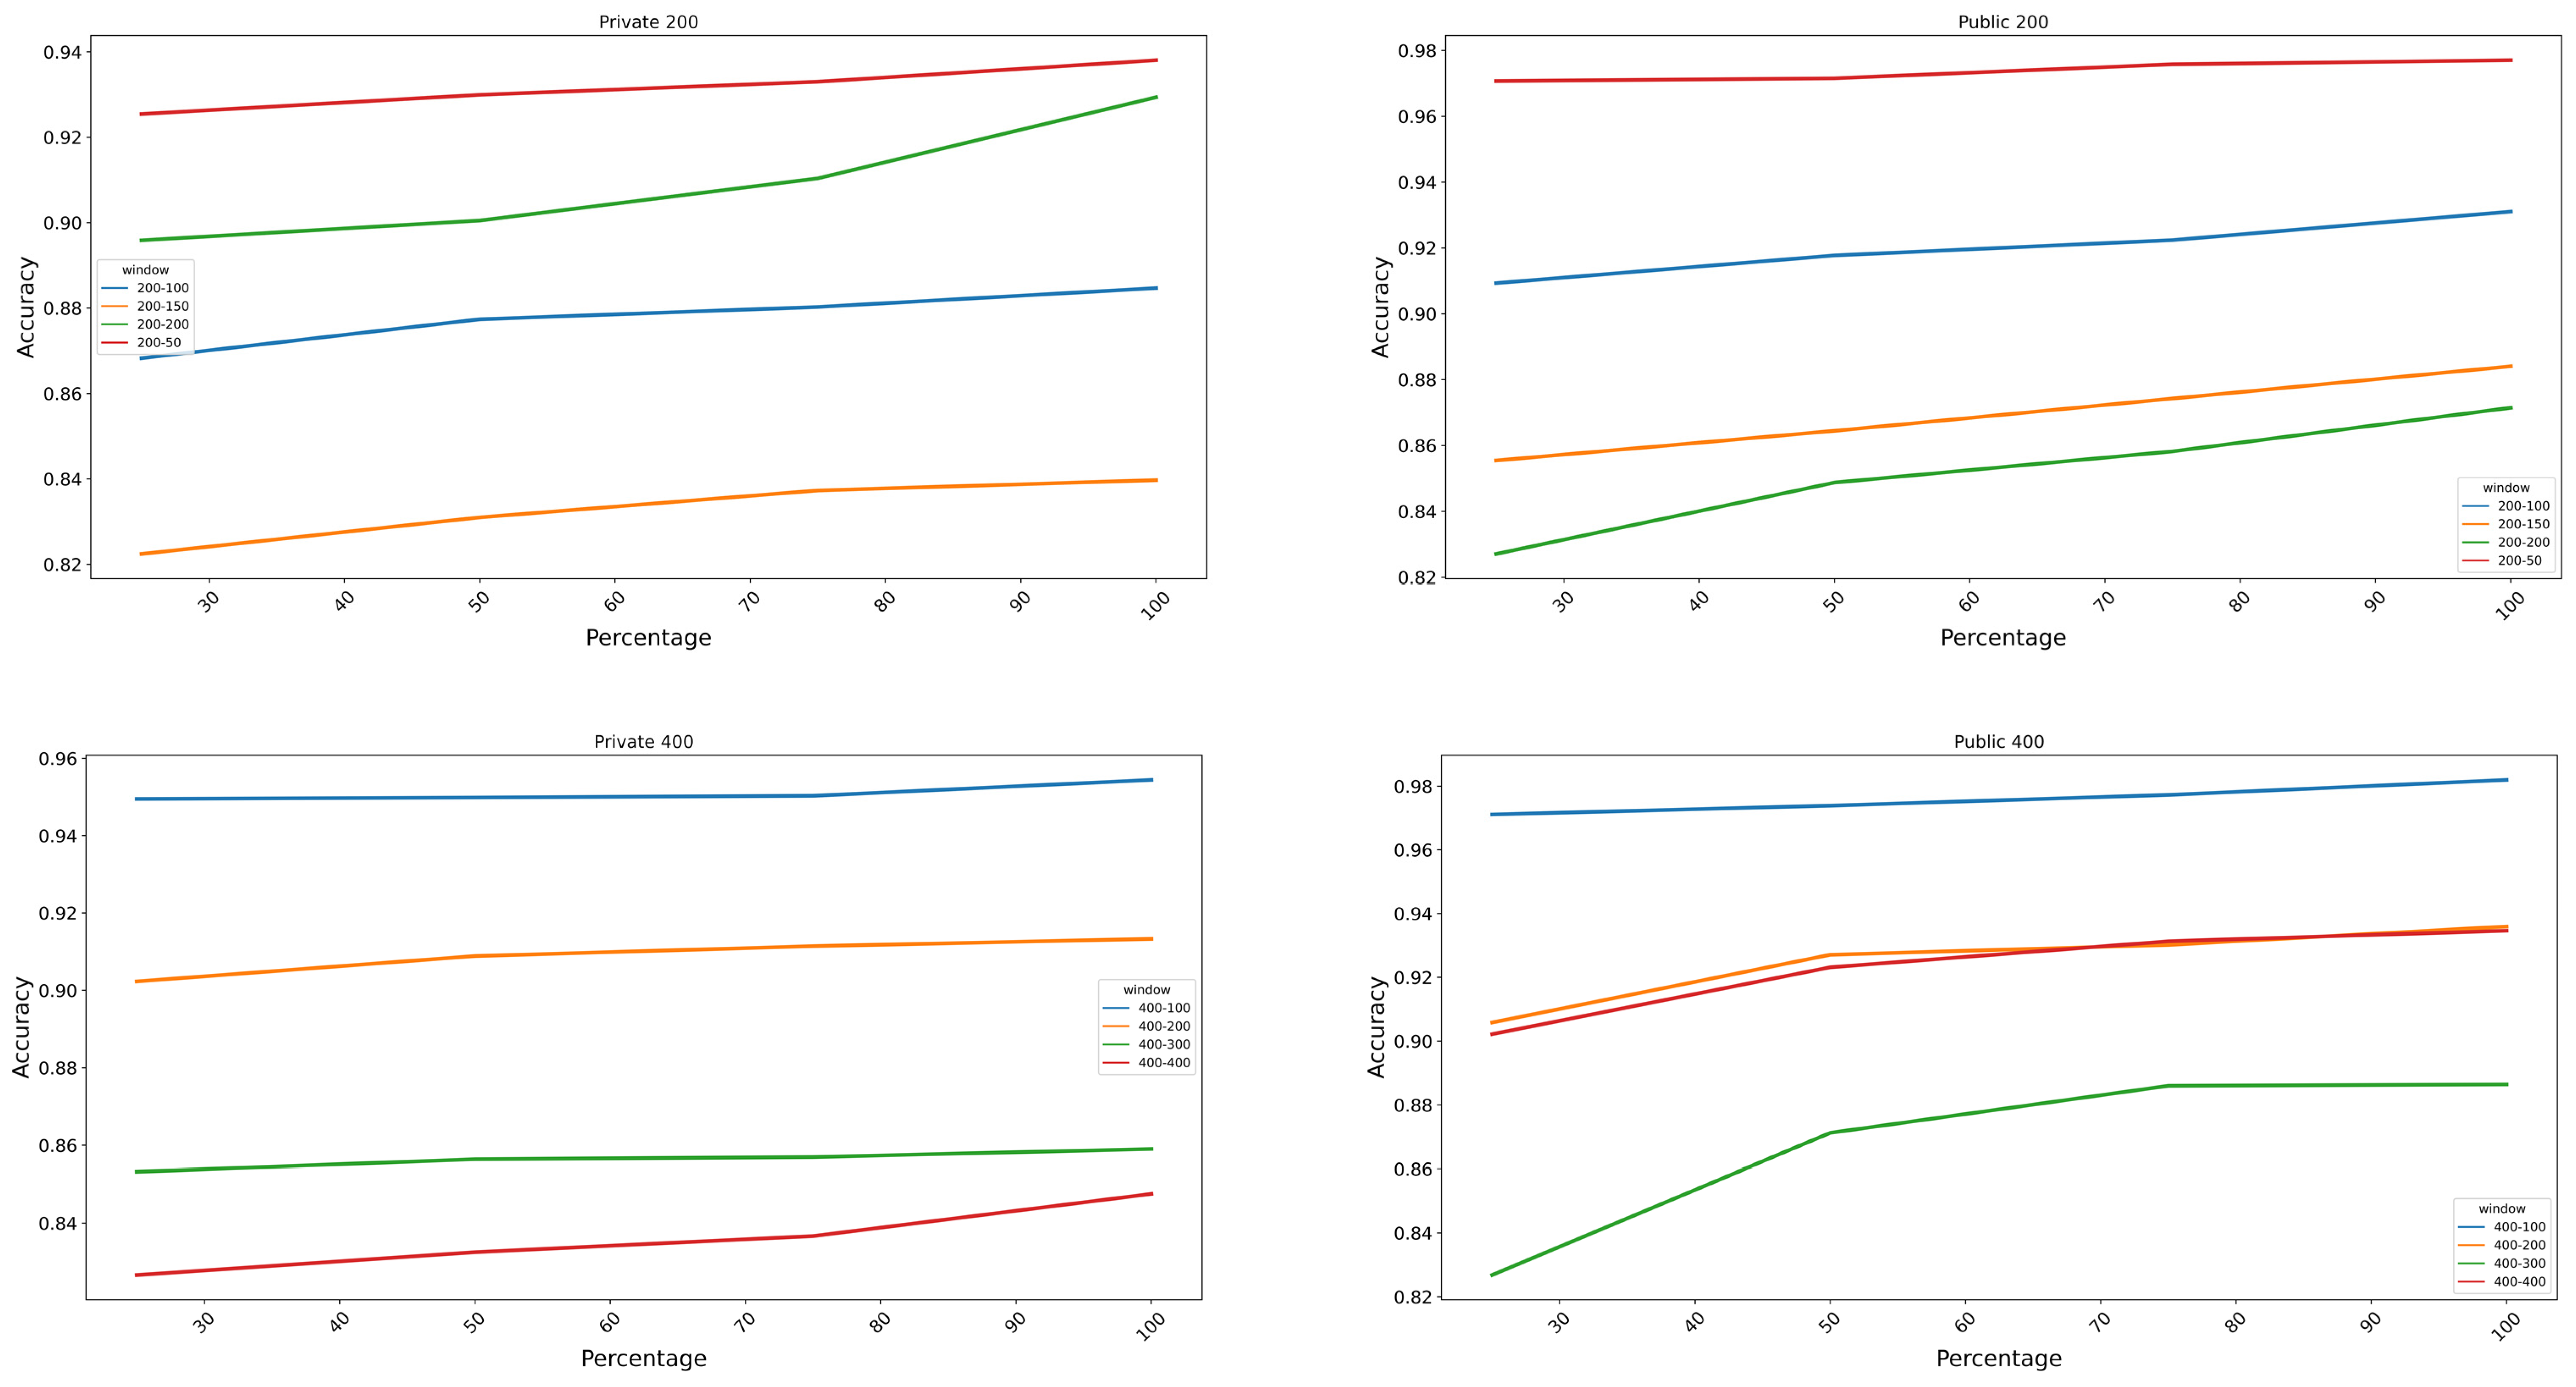
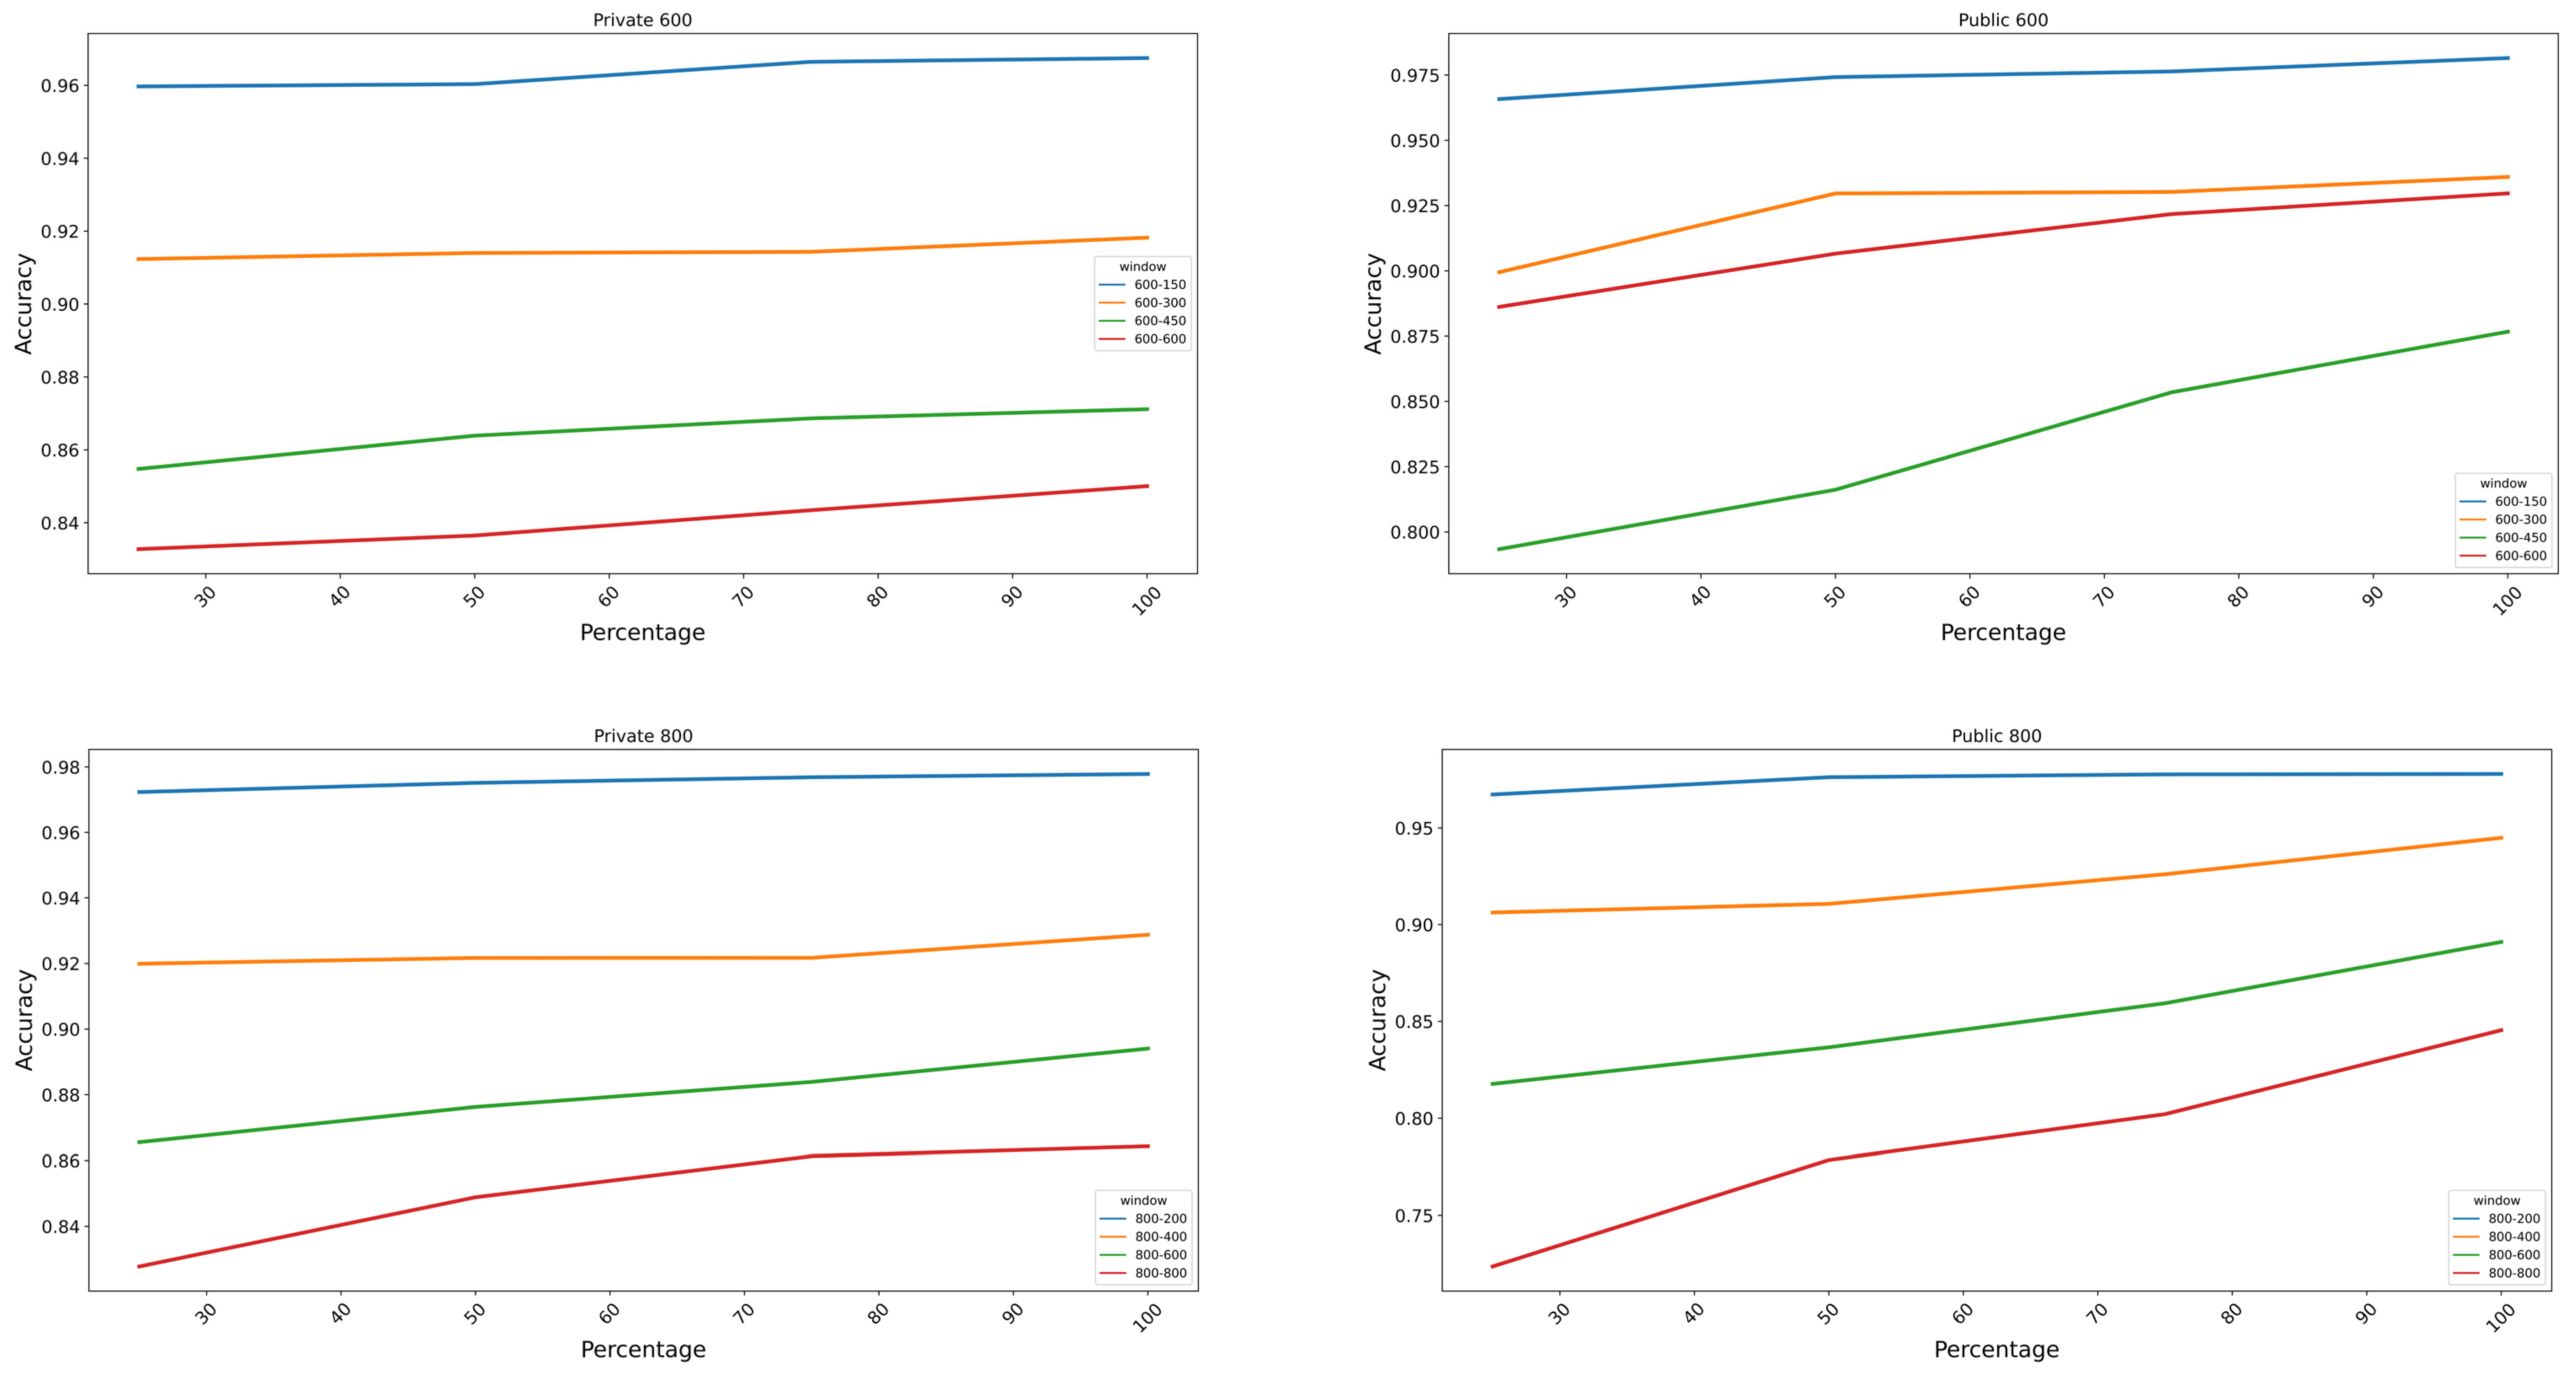
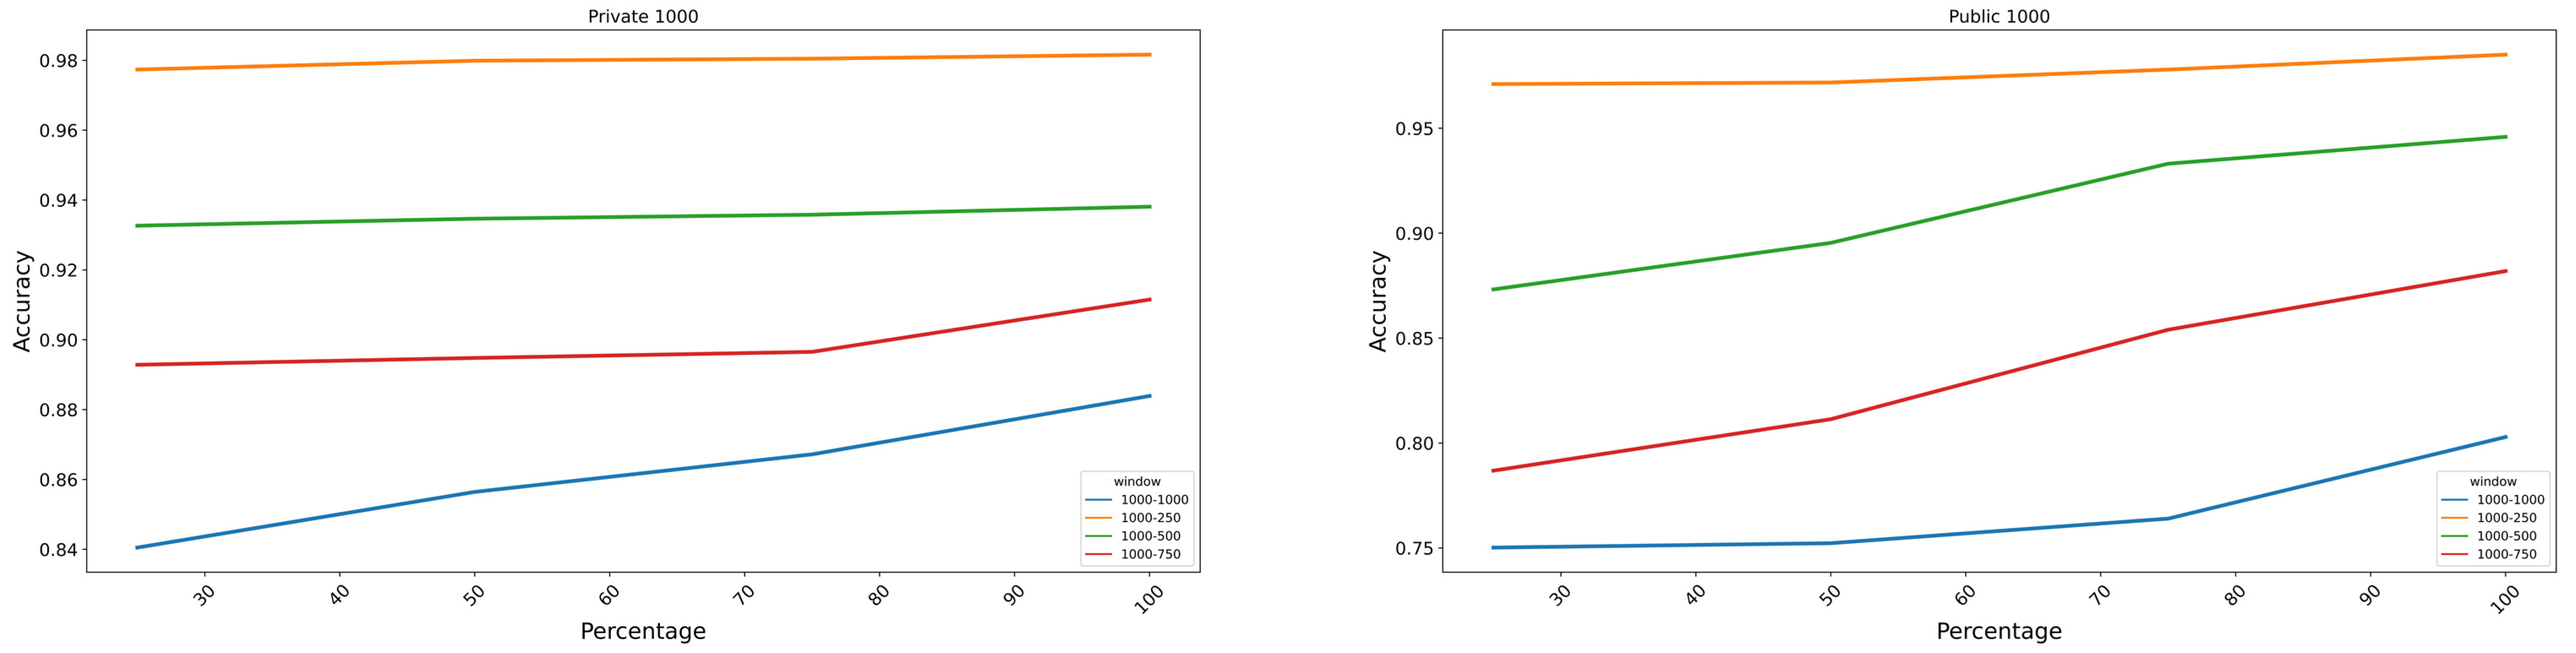
3.3. Augmentation Classification Performance Analysis
3.4. Classifier Two-Sample Test
4. Discussion
5. Conclusions
Author Contributions
Funding
Informed Consent Statement
Data Availability Statement
Conflicts of Interest
References
- Toledo-Pérez, D.C.; Rodríguez-Reséndiz, J.; Gómez-Loenzo, R.A. A Study of Computing Zero Crossing Methods and an Improved Proposal for EMG Signals. IEEE Access 2020, 8, 8783–8790. [Google Scholar] [CrossRef]
- Aviles, M.; Sánchez-Reyes, L.-M.; Fuentes-Aguilar, R.Q.; Toledo-Pérez, D.C.; Rodríguez-Reséndiz, J. A Novel Methodology for Classifying EMG Movements Based on SVM and Genetic Algorithms. Micromachines 2022, 13, 2108. [Google Scholar] [CrossRef] [PubMed]
- Aviles, M.; Rodríguez-Reséndiz, J.; Ibrahimi, D. Optimizing EMG Classification through Metaheuristic Algorithms. Technologies 2023, 11, 87. [Google Scholar] [CrossRef]
- Malešević, N.; Olsson, A.; Sager, P.; Andersson, E.; Cipriani, C.; Controzzi, M.; Björkman, A.; Antfolk, C. A database of high-density surface electromyogram signals comprising 65 isometric hand gestures. Sci. Data 2021, 8, 63. [Google Scholar] [CrossRef] [PubMed]
- Montazerin, M.; Rahimian, E.; Naderkhani, F.; Atashzar, S.F.; Yanushkevich, S.; Mohammadi, A. Transformer-based hand gesture recognition from instantaneous to fused neural decomposition of high-density EMG signals. Sci. Rep. 2023, 13, 11000. [Google Scholar] [CrossRef] [PubMed]
- Brophy, E.; Wang, Z.; She, Q.; Ward, T. Generative Adversarial Networks in Time Series: A Systematic Literature Review. ACM Comput. Surv. 2023, 55, 199. [Google Scholar] [CrossRef]
- Kaczmarek, P.; Mańkowski, T.; Tomczyński, J. putEMG—A Surface Electromyography Hand Gesture Recognition Dataset. Sensors 2019, 19, 3548. [Google Scholar] [CrossRef] [PubMed]
- Zhang, X.; Ma, M. Research on sEMG Feature Generation and Classification Performance Based on EBGAN. Electronics 2023, 12, 1040. [Google Scholar] [CrossRef]
- Korosec, D.; Martinez, C.; Zazula, D. Parametric modelling of EMG signals. In Proceedings of the 18th Annual International Conference of the IEEE Engineering in Medicine and Biology Society, Amsterdam, The Netherlands, 31 October–3 November 1996; Volume 1474, pp. 1470–1471. [Google Scholar]
- Goodfellow, I.J.; Pouget-Abadie, J.; Mirza, M.; Xu, B.; Warde-Farley, D.; Ozair, S.; Courville, A.; Bengio, Y. Generative Adversarial Networks. arXiv 2014, arXiv:1406.2661. [Google Scholar] [CrossRef]
- Kataoka, Y.; Matsubara, T.; Uehara, K. Image generation using generative adversarial networks and attention mechanism. In Proceedings of the 2016 IEEE/ACIS 15th International Conference on Computer and Information Science (ICIS), Okayama, Japan, 26–29 June 2016; pp. 1–6. [Google Scholar]
- De Rosa, G.H.; Papa, J.P. A survey on text generation using generative adversarial networks. Pattern Recognit. 2021, 119, 108098. [Google Scholar] [CrossRef]
- Wali, A.; Alamgir, Z.; Karim, S.; Fawaz, A.; Ali, M.B.; Adan, M.; Mujtaba, M. Generative adversarial networks for speech processing: A review. Comput. Speech Lang. 2022, 72, 101308. [Google Scholar] [CrossRef]
- Esteban, C.; Hyland, S.L.; Rätsch, G. Real-valued (Medical) Time Series Generation with Recurrent Conditional GANs. arXiv 2017, arXiv:1706.02633. [Google Scholar]
- Hazra, D.; Byun, Y.-C. SynSigGAN: Generative Adversarial Networks for Synthetic Biomedical Signal Generation. Biology 2020, 9, 441. [Google Scholar] [CrossRef] [PubMed]
- Beaulieu-Jones, B.K.; Wu, Z.S.; Williams, C.; Lee, R.; Bhavnani, S.P.; Byrd, J.B.; Greene, C.S. Privacy-Preserving Generative Deep Neural Networks Support Clinical Data Sharing. Circ. Cardiovasc. Qual. Outcomes 2019, 12, e005122. [Google Scholar] [CrossRef] [PubMed]
- Anicet Zanini, R.; Luna Colombini, E. Parkinson’s Disease EMG Data Augmentation and Simulation with DCGANs and Style Transfer. Sensors 2020, 20, 2605. [Google Scholar] [CrossRef] [PubMed]
- Campbell, E.; Cameron, J.A.D.; Scheme, E. Feasibility of Data-driven EMG Signal Generation using a1 Deep Generative Model. In Proceedings of the 2020 42nd Annual International Conference of the IEEE Engineering in Medicine & Biology Society (EMBC), Montreal, QC, Canada, 20–24 July 2020; Volume 2020, pp. 3755–3758. [Google Scholar] [CrossRef]
- Khushaba, R.N.; Kodagoda, S.; Takruri, M.; Dissanayake, G. Toward improved control of prosthetic fingers using surface electromyogram (EMG) signals. Expert Syst. Appl. 2012, 39, 10731–10738. [Google Scholar] [CrossRef]
- Kim, N.; Lim, T.; Song, K.; Yang, S.; Lee, J. Stretchable Multichannel Electromyography Sensor Array Covering Large Area for Controlling Home Electronics with Distinguishable Signals from Multiple Muscles. ACS Appl. Mater. Interfaces 2016, 8, 21070–21076. [Google Scholar] [CrossRef]
- Ozdemir, M.A.; Kisa, D.H.; Guren, O.; Akan, A. Dataset for multi-channel surface electromyography (sEMG) signals of hand gestures. Data Brief 2022, 41, 107921. [Google Scholar] [CrossRef]
- Krasoulis, A.; Vijayakumar, S.; Nazarpour, K. Multi-Grip Classification-Based Prosthesis Control with Two EMG-IMU Sensors. IEEE Trans. Neural Syst. Rehabil. Eng. 2020, 28, 508–518. [Google Scholar] [CrossRef]
- Atzori, M.; Müller, H. PaWFE: Fast Signal Feature Extraction Using Parallel Time Windows. Front. Neurorobot. 2019, 13, 74. [Google Scholar] [CrossRef]
- Hudgins, B.; Parker, P.; Scott, R.N. A new strategy for multifunction myoelectric control. IEEE Trans. Biomed. Eng. 1993, 40, 82–94. [Google Scholar] [CrossRef] [PubMed]
- Singla, R.; Chambayil, B.; Khosla, A.; Santosh, J. Comparison of SVM and ANN for classification of eye events in EEG. J. Biomed. Sci. Eng. 2011, 04, 62–69. [Google Scholar] [CrossRef]
- Luca, C.J.D. The Use of Surface Electromyography in Biomechanics. J. Appl. Biomech. 1997, 13, 135–163. [Google Scholar] [CrossRef]
- Salimans, T.; Goodfellow, I.; Zaremba, W.; Cheung, V.; Radford, A.; Chen, X. Improved Techniques for Training GANs. arXiv 2016, arXiv:1606.03498. [Google Scholar]
- Delaney, A.M.; Brophy, E.; Ward, T.E. Synthesis of Realistic ECG using Generative Adversarial Networks. arXiv 2019, arXiv:1909.09150. [Google Scholar]
- Hernandez-Matamoros, A.; Fujita, H.; Meana, H. A novel approach to create synthetic biomedical signals using BiRNN. Inf. Sci. 2020, 541, 218–241. [Google Scholar] [CrossRef]
- Mantel, N. The detection of disease clustering and a generalised regression approach. Cancer Res. 1967, 27, 209–220. [Google Scholar]
- Legendre, P.; Legendre, L. Numerical Ecology; Elsevier Science: Amsterdam, The Netherlands, 2012. [Google Scholar]
- Anysz, H.; Zbiciak, A.; Ibadov, N. The Influence of Input Data Standardization Method on Prediction Accuracy of Artificial Neural Networks. Procedia Eng. 2016, 153, 66–70. [Google Scholar] [CrossRef]
- Schapire, R.E. Explaining adaboost. In Empirical Inference: Festschrift in Honor of Vladimir N. Vapnik; Springer: Berlin/Heidelberg, Germany, 2013; pp. 37–52. [Google Scholar]
- Skurichina, M.; Duin, R.P. Bagging for linear classifiers. Pattern Recognit. 1998, 31, 909–930. [Google Scholar] [CrossRef]
- Oskoei, M.A.; Hu, H. Support vector machine-based classification scheme for myoelectric control applied to upper limb. IEEE Trans. Biomed. Eng. 2008, 55, 1956–1965. [Google Scholar] [CrossRef]
- Lopez-Paz, D.; Oquab, M. Revisiting Classifier Two-Sample Tests. arXiv 2016, arXiv:1610.06545. [Google Scholar]
- Gretton, A.; Borgwardt, K.M.; Rasch, M.J.; Scholkopf, B.; Smola, A. A Kernel Method for the Two-Sample-Problem. In Proceedings of the 30th Conference on Neural Information Processing Systems (NIPS), Barcelona, Spain, 5–10 December 2006. [Google Scholar]
- Osokin, A.; Chessel, A.; Carazo Salas, R.E.; Vaggi, F. GANs for biological image synthesis. In Proceedings of the IEEE International Conference on Computer Vision, Venice, Italy, 22–29 October 2017; pp. 2233–2242. [Google Scholar]
- Liu, Y.; Li, C.-L.; Póczos, B. Classifier Two-Sample Test for Video Anomaly Detections. In Proceedings of the British Machine Vision Conference, Newcastle, UK, 3–6 September 2018. [Google Scholar]
- Pacchiardi, L.; Dutta, R. Likelihood-Free Inference with Generative Neural Networks via Scoring Rule Minimization. arXiv 2022, arXiv:2205.15784. [Google Scholar]


| Number of Data Points | Public Dataset (ms) | Private Dataset (ms) |
|---|---|---|
| 200 | 50 | 100 |
| 400 | 100 | 200 |
| 600 | 150 | 300 |
| 800 | 200 | 400 |
| 1000 | 250 | 500 |
Disclaimer/Publisher’s Note: The statements, opinions and data contained in all publications are solely those of the individual author(s) and contributor(s) and not of MDPI and/or the editor(s). MDPI and/or the editor(s) disclaim responsibility for any injury to people or property resulting from any ideas, methods, instructions or products referred to in the content. |
© 2023 by the authors. Licensee MDPI, Basel, Switzerland. This article is an open access article distributed under the terms and conditions of the Creative Commons Attribution (CC BY) license (https://creativecommons.org/licenses/by/4.0/).
Share and Cite
Gouda, M.A.; Hong, W.; Jiang, D.; Feng, N.; Zhou, B.; Li, Z. Synthesis of sEMG Signals for Hand Gestures Using a 1DDCGAN. Bioengineering 2023, 10, 1353. https://doi.org/10.3390/bioengineering10121353
Gouda MA, Hong W, Jiang D, Feng N, Zhou B, Li Z. Synthesis of sEMG Signals for Hand Gestures Using a 1DDCGAN. Bioengineering. 2023; 10(12):1353. https://doi.org/10.3390/bioengineering10121353
Chicago/Turabian StyleGouda, Mohamed Amin, Wang Hong, Daqi Jiang, Naishi Feng, Bin Zhou, and Ziyang Li. 2023. "Synthesis of sEMG Signals for Hand Gestures Using a 1DDCGAN" Bioengineering 10, no. 12: 1353. https://doi.org/10.3390/bioengineering10121353