
Assessing Autistic Traits in Toddlers Using a Data-Driven Approach with DSM-5 Mapping

Abstract
:
1. Introduction
2. Literature Review
Related Works
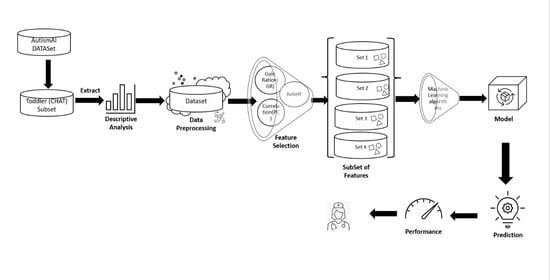
3. Methodology
- N is the number of instances in a dataset with M features.
- xih = the instance of the same class as xi (nearest hit neighbor);
- xim = the instance of a different class (nearest miss neighbor);
- δ(xij, xih) = the difference between the feature j values of xi and its nearest hit neighbor xih; and
- δ(xij, xim) measures the difference between the feature j values of xi and its nearest miss neighbor xim.
4. Experimental Analysis
5. Conclusions, Limitations, and Ethical Implications
Author Contributions
Funding
Institutional Review Board Statement
Informed Consent Statement
Data Availability Statement
Conflicts of Interest
References
- Lord, C.; Elsabbagh, M.; Baird, G.; Veenstra-Vanderweele, J. Autism spectrum disorder. Lancet 2018, 392, 508–520. [Google Scholar] [CrossRef] [PubMed]
- World Health Organization (2023)www.who.int. 2023. Available online: https://www.who.int/news-room/fact-sheets/detail/autism-spectrum-disorders (accessed on 22 March 2023).
- Zeidan, J.; Fombonne, E.; Scorah, J.; Ibrahim, A.; Durkin, M.S.; Saxena, S.; Yusuf, A.; Shih, A.; Elsabbagh, M. Global prevalence of autism: A systematic review update. Autism Res. 2022, 15, 778–790. [Google Scholar] [CrossRef] [PubMed]
- Kosmicki, J.A.; Sochat, V.; Duda, M.; Wall, D.P. Searching for a minimal set of behaviors for autism detection through feature selection-based machine learning. Transl. Psychiatry 2015, 5, e514. [Google Scholar] [CrossRef]
- Hof, M.; Tisseur, C.; van Berckelear-Onnes, I.; van Nieuwenhuyzen, A.; Daniels, A.M.; Deen, M.; Hoek, H.W.; Ester, W.A. Age at autism spectrum disorder diagnosis: A systematic review and meta-analysis from 2012 to 2019. Autism 2020, 25, 862–873. [Google Scholar] [CrossRef]
- Community Report on 2023, CDC Report. 2023. Available online: https://www.cdc.gov/ncbddd/autism/pdf/ADDM-Community-Report-SY2020-h.pdf (accessed on 23 June 2023).
- Hargitai, L.D.; Livingston, L.A.; Waldren, L.H.; Robinson, R.; Jarrold, C.; Shah, P. Attention-deficit hyperactivity disorder traits are a more important predictor of internalising problems than autistic traits. Sci. Rep. 2023, 13, 31. [Google Scholar] [CrossRef] [PubMed]
- Dash, S.; Shakyawar, S.K.; Sharma, M.; Kaushik, S. Big data in healthcare: Management, analysis and future prospects. J. Big Data 2019, 6, 54. [Google Scholar] [CrossRef]
- Ahsan, M.M.; Luna, S.A.; Siddique, Z. Machine-Learning-Based Disease Diagnosis: A Comprehensive Review. Healthcare 2022, 10, 541. [Google Scholar] [CrossRef] [PubMed]
- Zhu, F.L.; Wang, S.H.; Liu, W.B.; Zhu, H.L.; Li, M.; Zou, X.B. A multimodal machine learning system in early screening for toddlers with autism spectrum disorders based on the response to name. Front. Psychiatry 2023, 14, 1039293. [Google Scholar] [CrossRef] [PubMed]
- Chen, Y.H.; Chen, Q.; Kong, L.; Liu, G. Early detection of autism spectrum disorder in young children with machine learning using medical claims data. BMJ Health Care Inf. 2022, 29, e100544. [Google Scholar] [CrossRef]
- Shahamiri, S.R.; Thabtah, F.; Abdelhamid, N. A new classification system for autism based on machine learning of artificial intelligence. Technol. Health Care 2022, 30, 605–622. [Google Scholar] [CrossRef]
- Thabtah, F.; Spencer, R.; Abdelhamid, N.; Kamalov, F.; Wentzel, C.; Ye, Y.; Dayara, T. Autism screening: An unsupervised machine learning approach. Health Inf. Sci. Syst. 2022, 10, 26. [Google Scholar] [CrossRef]
- Scott AJ, W.; Wang, Y.; Abdel-Jaber, H.; Thabtah, F.; Ray, S.K. Improving screening systems of autism using data sampling. Technol. Health Care 2021, 29, 897–909. [Google Scholar] [CrossRef] [PubMed]
- Abdelhamid, N.; Padmavathy, A.; Peebles, D.; Thabtah, F.; Goulder-Horobin, D. Data Imbalance in Autism Pre-Diagnosis Classification Systems: An Experimental Study. J. Inf. Knowl. Manag. 2020, 19, 2040014. [Google Scholar] [CrossRef]
- Erkan, U.; Thanh, D.N. Autism Spectrum Disorder Detection with Machine Learning Methods. Curr. Psychiatry Res. Rev. 2020, 15, 297–308. [Google Scholar] [CrossRef]
- Chan, S.; Thabtah, F.; Abdel-Jaber, H.; Guerrero, F. Autism detection for toddlers from behavioural indicators using classification techniques. Intell. Decis. Technol. 2022, 16, 589–599. [Google Scholar] [CrossRef]
- Rajab, K.D.; Padmavathy, A.; Thabtah, F. Machine Learning Application for Predicting Autistic Traits in Toddlers. Arab. J. Sci. Eng. 2021, 46, 3793–3805. [Google Scholar] [CrossRef]
- American Psychiatric Association. Cautionary statement for forensic use of DSM-5. In Diagnostic and Statistical Manual of Mental Disorders, 5th ed.; American Psychiatric Association: Washington, DC, USA, 2013. [Google Scholar]
- Shahamiri, S.R.; Thabtah, F. Autism AI: A New Autism Screening System Based on Artificial Intelligence. Cogn. Comput. 2020, 12, 766–777. [Google Scholar] [CrossRef]
- Allison, C.; Baron-Cohen, S.; Wheelwright, S.; Charman, T.; Richler, J.; Pasco, G.; Brayne, C. The Q-CHAT (Quantitative CHecklist for Autism in Toddlers): A Normally Distributed Quantitative Measure of Autistic Traits at 18–24 Months of Age: Preliminary Report. J. Autism Dev. Disord. 2008, 38, 1414–1425. [Google Scholar] [CrossRef]
- Thabtah, F.; Hammoud, S.; Kamalov, F.; Gonsalves, A. Data imbalance in classification: Experimental evaluation. Inf. Sci. 2020, 513, 429–441. [Google Scholar] [CrossRef]
- Kazemi, V.; Sullivan, J. One millisecond face alignment with an ensemble of regression trees. In Proceedings of the 2014 IEEE Conference on Computer Vision and Pattern Recognition, Columbus, OH, USA, 23–28 June 2014. [Google Scholar] [CrossRef]
- Anderson, D.K.; Oti, R.S.; Lord, C.; Welch, K. Patterns of Growth in Adaptive Social Abilities Among Children with Autism Spectrum Disorders. J. Abnorm. Child Psychol. 2009, 37, 1019–1034. [Google Scholar] [CrossRef]
- Thabtah, F. ASD Tests. Google.com. 2017. Available online: https://play.google.com/store/407apps/details?id=com.asd.asdquiz&hl=en (accessed on 11 December 2022).
- Thabtah, F.; Kamalov, F.; Rajab, K. A new computational intelligence approach to detect autistic features for autism screening. Int. J. Med. Inform. 2018, 117, 112–124. [Google Scholar] [CrossRef] [PubMed]
- Washington, P.; Paskov, K.M.; Kalantarian, H.; Stockham, N.; Voss, C.; Kline, A.; Patnaik, R.; Chrisman, B.; Varma, M.; Tariq, Q.; et al. Feature Selection and Dimension Reduction of Social Autism Data. Biocomputing 2019, 2020, 707–718. [Google Scholar] [CrossRef]
- Constantino, J.N. Social Responsiveness Scale. Encycl. Autism Spectr. Disord. 2013, 2919–2929. [Google Scholar] [CrossRef]
- Raj, S.; Masood, S. Analysis and Detection of Autism Spectrum Disorder Using Machine Learning Techniques. Procedia Comput. Sci. 2020, 167, 994–1004. [Google Scholar] [CrossRef]
- Rahman, R.; Kodesh, A.; Levine, S.Z.; Sandin, S.; Reichenberg, A.; Schlessinger, A. Identification of newborns at risk for autism using electronic medical records and machine learning. Eur. Psychiatry 2020, 63, e22. [Google Scholar] [CrossRef]
- Molloy, C.A.; Murray, D.S.; Akers, R.; Mitchell, T.; Manning-Courtney, P. Use of the Autism Diagnostic Observation Schedule (ADOS) in a clinical setting. Autism 2011, 15, 143–162. [Google Scholar] [CrossRef]
- Achenie LE, K.; Scarpa, A.; Factor, R.S.; Wang, T.; Robins, D.L.; McCrickard, D.S. A Machine Learning Strategy for Autism Screening in Toddlers. J. Dev. Behav. Pediatr. 2019, 40, 369–376. [Google Scholar] [CrossRef]
- Chlebowski, C.; Robins, D.L.; Barton, M.L.; Fein, D. Large-Scale Use of the Modified Checklist for Autism in Low-Risk Toddlers. Pediatrics 2013, 131, e1121–e1127. [Google Scholar] [CrossRef]
- Schalkoff, R.J. Artificial Neural Networks; McGraw-Hill Science, Engineering & Mathematics: New York, NY, USA, 1997. [Google Scholar]
- Baron-Cohen, S.; Wheelwright, S.; Cox, A.; Baird, G.; Charman, T.; Swettenham, J.; Drew, A.; Doehring, P. Early identification of autism by the CHecklist for Autism in Toddlers (CHAT). J. R. Soc. Med. 2000, 93, 521–525. [Google Scholar] [CrossRef]
- Kira, K.; Rendell, L.A. A Practical Approach to Feature Selection. Mach. Learn. Proc. 1992, 1992, 249–256. [Google Scholar] [CrossRef]
- Priyadarsini, R.P.; Valarmathi, M.L.; Sivakumari, S. Gain Ratio Based Feature Selection Method For Privacy Preservation. ICTACT J. Soft Comput. 2011, 1, 201–205. [Google Scholar]
- Trabelsi, M.; Meddouri, N.; Maddouri, M. A New Feature Selection Method for Nominal Classifier based on Formal Concept Analysis. Procedia Comput. Sci. 2017, 112, 186–194. [Google Scholar] [CrossRef]
- Robnik-Šikonja, M.I. An adaptation of Relief for attribute estimation in regression. In Proceedings of the Machine learning: Proceedings of the fourteenth international conference (ICML’97); Nashville, TN, USA, 8–12 July 1997, Volume 5, pp. 296–304.
- Vishal, V.; Singh, A.K.; Jinila, Y.B.; Shyry, S.P.; Jabez, J. A Comparative Analysis of Prediction of Autism Spectrum Disorder (ASD) using Machine Learning. In Proceedings of the 2022 6th International Conference on Trends in Electronics and Informatics (ICOEI), Tirunelveli, India, 28–30 April 2022; pp. 1355–1358. [Google Scholar]
- Thabtah, F.; Abdelhamid, N.; Peebles, D. A machine learning autism classification based on logistic regression analysis. Health Information Science and Systems 2019, 7, 12. [Google Scholar] [CrossRef]
- Masum, M.N.; Faruk, A.; Shahriar, H. A Comparative Study of Machine Learning-based Autism Spectrum Disorder Detection with Feature Importance Analysis. STI 2022. 2022. Available online: https://www.researchgate.net/publication/359081817_A_Comparative_Study_of_Machine_Learningbased_Autism_Spectrum_Disorder_Detection_with_Feature_Importance_Analysis (accessed on 17 February 2013).
- Hanif, M.K.; Ashraf, N.; Sarwar, M.U.; Adinew, D.M.; Yaqoob, R. Employing Machine Learning-Based Predictive Analytical Approaches to Classify Autism Spectrum Disorder Types. Complexity 2022, 2022, 1–10. [Google Scholar] [CrossRef]
- Smith, T.C.; Frank, E. Introducing Machine Learning Concepts with WEKA. Methods Mol. Biol. 2016, 353–378. [Google Scholar] [CrossRef]
- Parmeggiani, A.; Corinaldesi, A.; Posar, A. Early features of autism spectrum disorder: A cross-sectional study. Ital. J. Pediatr. 2019, 45, 144. [Google Scholar] [CrossRef]


| Methods Used | Data Used | Performance | Reference |
|---|---|---|---|
| DLiB library Deep learning Kaldi toolkit | 125 toddlers | Sensitivity: 80.00% Specificity: 69.80% Accuracy: 74.80%. | [10] |
| LR RF | IBM MarketScan Health Claims database; 38,576 observations | RF:
| [11] |
| CNN | Dataset: collected by ASDTests 6075 observations |
| [12] |
| SOM RF NB | 2000 observations | NB:
| [13] |
| C4.5 RIPPER RF NB | ASDTest dataset; 1054 toddler data observations | No data sampling: NB: Sensitivity: 96.20% C4.5: Sensitivity: 92.30% RIPPER: Sensitivity: 92.40% RF: Sensitivity: 95.30% | [15] |
| Symmetrical uncertainty (SU), IG, fast-correlated-based filter (FCBF), leave one out cross-validation (LOOCV), gini index, and chi-square ID3 ADABoost Knn | ASDTest dataset; 1054 toddler data observations | No data sampling. Sensitivity rates between 93% and 98%, depending on the feature sets used by the classification algorithm. The highest sensitivity rate was achieved by ADABoost. | [18] |
| NB with data sampling: SMOTE RUS | ASDTest dataset; 1118 adult data observations | SMOTE+ NB:
| [22] |
| mRMR and chi-square testing feature selection C4.5 RIPPER RF NB SVM | ASDTest dataset; 1054 toddler data observations | No data sampling. Sensitivity rates between 93% and 97.50%, depending on the feature sets used by the classification algorithm. The highest Sensitivity rate was achieved by the SVM. | [17] |
| NB with data sampling: SMOTE ROS RUS | ASDTest dataset; over 1000 observations | SMOTE + NB:
| [14] |
| kNN, SVM RF | ASD dataset of UCI machine-learning data repository | kNN: Accuracy: 95.70% Sensitivity: 95.15% F-measure: 94.64% AUC: 96.00% SVM: Accuracy: 99.90% Sensitivity: 99.90% F-measure: 99.90% AUC: 100% RF: Accuracy: 99.90% Sensitivity: 99.90% F-measure: 99.90% AUC: 99.90% | [16] |
| Multilayer perceptron (MLP) classifier | Social responsiveness scale (SRS) [28] - child/adolescent questionnaire; 16,527 children/adolescents | AUC: 92.00% | [27] |
| SVM CNN ANN | An integrated data from the UCI machine-learning data repository, consisting of three datasets with 20 common attributes | CNN algorithm.
| [29] |
| Multivariate LR MLP RF | EMR data from a single Israeli health maintenance organization; 96,138 EMR children information | Multivariate LR:
| [30] |
| Question Number | Question Details | Corresponding DSM-5 |
|---|---|---|
| Q1 | Does your child look at you when you call his/her name? | Deficits in social communication and interaction (problem with social initiation and response) |
| Q2 | How easy is it for you to have eye contact with your child? | Deficits in social communication and interaction (non-verbal communication problem) |
| Q3 | Does your child point to indicate that s/he wants something (e.g., a toy that is out of reach)? | Deficits in joint attention and social communication and interaction (non-verbal communication problem) |
| Q4 | Does your child point to share interest with you (e.g., pointing at an interesting sight)? | Deficits in joint attention and social communication and interaction (non-verbal-communication problems) |
| Q5 | Does your child pretend (e.g., care for dolls, talk on a toy phone)? | Deficits in social communication and interaction related to pretend play |
| Q6 | Does your child follow where you are looking? | Deficits in joint attention and social communication and interaction (non-verbal communication problems) |
| Q7 | If you or someone else in the family is visibly upset, does your child show signs of wanting to comfort them (e.g., stroking their hair, hugging them)? | Deficits in social communication and interaction (problems with social initiation and response) |
| Q8 | Would you describe your child’s first words as (Very typical, Quite typical, Slightly unusual, Very unusual, My child doesn’t speak) | Deficits in social communication and interaction related to language development. Stereotyped/repetitive speech |
| Q9 | Does your child use simple gestures (e.g., wave goodbye)? | Deficits in social communication and interaction (non-verbal communication problem) |
| Q10 | Does your child stare at nothing with no apparent purpose? | Shows restricted and repetitive patterns of behavior, interests, or activities (stereotyped behaviors) |
| Attribute Rank | Gain Ratio Score | Attribute Rank | Pearson Correlation Score | Attribute Rank | Relief Score |
|---|---|---|---|---|---|
| Q6 | 0.281297 | Q6 | 0.5978 | Q6 | 0.30551 |
| Q9 | 0.263325 | Q9 | 0.5653 | Q5 | 0.30501 |
| Q5 | 0.240884 | Q5 | 0.5492 | Q8 | 0.28446 |
| Q4 | 0.222894 | Q4 | 0.5229 | Q9 | 0.28521 |
| Q3 | 0.222216 | Q8 | 0.5163 | Q4 | 0.24612 |
| Q8 | 0.20949 | Q7 | 0.4805 | Q3 | 0.20902 |
| Q7 | 0.182863 | Q3 | 0.4783 | Q2 | 0.19799 |
| Q2 | 0.163217 | Q2 | 0.461 | Q7 | 0.19098 |
| Q1 | 0.146544 | Q1 | 0.4181 | Q1 | 0.17945 |
| FamilyASDHistory | 0.013727 | FamilyASDHistory | 0.1316 | Q10 | 0.05514 |
| Ethnicity | 0.006148 | Age | 0.1201 | Ethnicity | 0.02957 |
| Jaundice | 0.006557 | Jaundice | 0.0903 | FamilyASDHistory | 0.02331 |
| User | 0.005728 | User | 0.0802 | User | 0.01805 |
| Q10 | 0.000547 | Q10 | 0.0272 | Age | 0.00827 |
| Sex | 0.000169 | Ethnicity | 0.0252 | Jaundice | 0.001 |
| Age | 0 | Sex | 0.0137 | Sex | -0.00802 |
| Set 1: No Feature Selection | Set 2: Q1 to Q9 | Set 3: Highest Scoring attributes | Set 4: Secondary/Lowest Scoring Attributes |
|---|---|---|---|
| Q1 (Communication) | Q1 | Q6 | FamilyASDHistory |
| Q2 (Social interaction) | Q2 | Q9 | Age |
| Q3 (Communication) | Q3 | Q5 | Q10 |
| Q4 (Social interaction) | Q4 | Q8 | User |
| Q5 (Social interaction) | Q5 | Q4 | Jaundice |
| Q6 (Social interaction) | Q6 | Ethnicity | |
| Q7 (Social interaction) | Q7 | Sex | |
| Q8 (Communication) | Q8 | ||
| Q9 (Social interaction) | Q9 | ||
| Q10(Repetitive patterns) | |||
| Age | |||
| Sex | |||
| Ethnicity | |||
| Jaundice | |||
| Family ASD history | |||
| User |
Disclaimer/Publisher’s Note: The statements, opinions and data contained in all publications are solely those of the individual author(s) and contributor(s) and not of MDPI and/or the editor(s). MDPI and/or the editor(s) disclaim responsibility for any injury to people or property resulting from any ideas, methods, instructions or products referred to in the content. |
© 2023 by the authors. Licensee MDPI, Basel, Switzerland. This article is an open access article distributed under the terms and conditions of the Creative Commons Attribution (CC BY) license (https://creativecommons.org/licenses/by/4.0/).
Share and Cite
Abdelhamid, N.; Thind, R.; Mohammad, H.; Thabtah, F. Assessing Autistic Traits in Toddlers Using a Data-Driven Approach with DSM-5 Mapping. Bioengineering 2023, 10, 1131. https://doi.org/10.3390/bioengineering10101131
Abdelhamid N, Thind R, Mohammad H, Thabtah F. Assessing Autistic Traits in Toddlers Using a Data-Driven Approach with DSM-5 Mapping. Bioengineering. 2023; 10(10):1131. https://doi.org/10.3390/bioengineering10101131
Chicago/Turabian StyleAbdelhamid, Neda, Rajdeep Thind, Heba Mohammad, and Fadi Thabtah. 2023. "Assessing Autistic Traits in Toddlers Using a Data-Driven Approach with DSM-5 Mapping" Bioengineering 10, no. 10: 1131. https://doi.org/10.3390/bioengineering10101131