
Optical Coherence Tomography Is a Promising Tool for Zebrafish-Based Research—A Review


Abstract
:
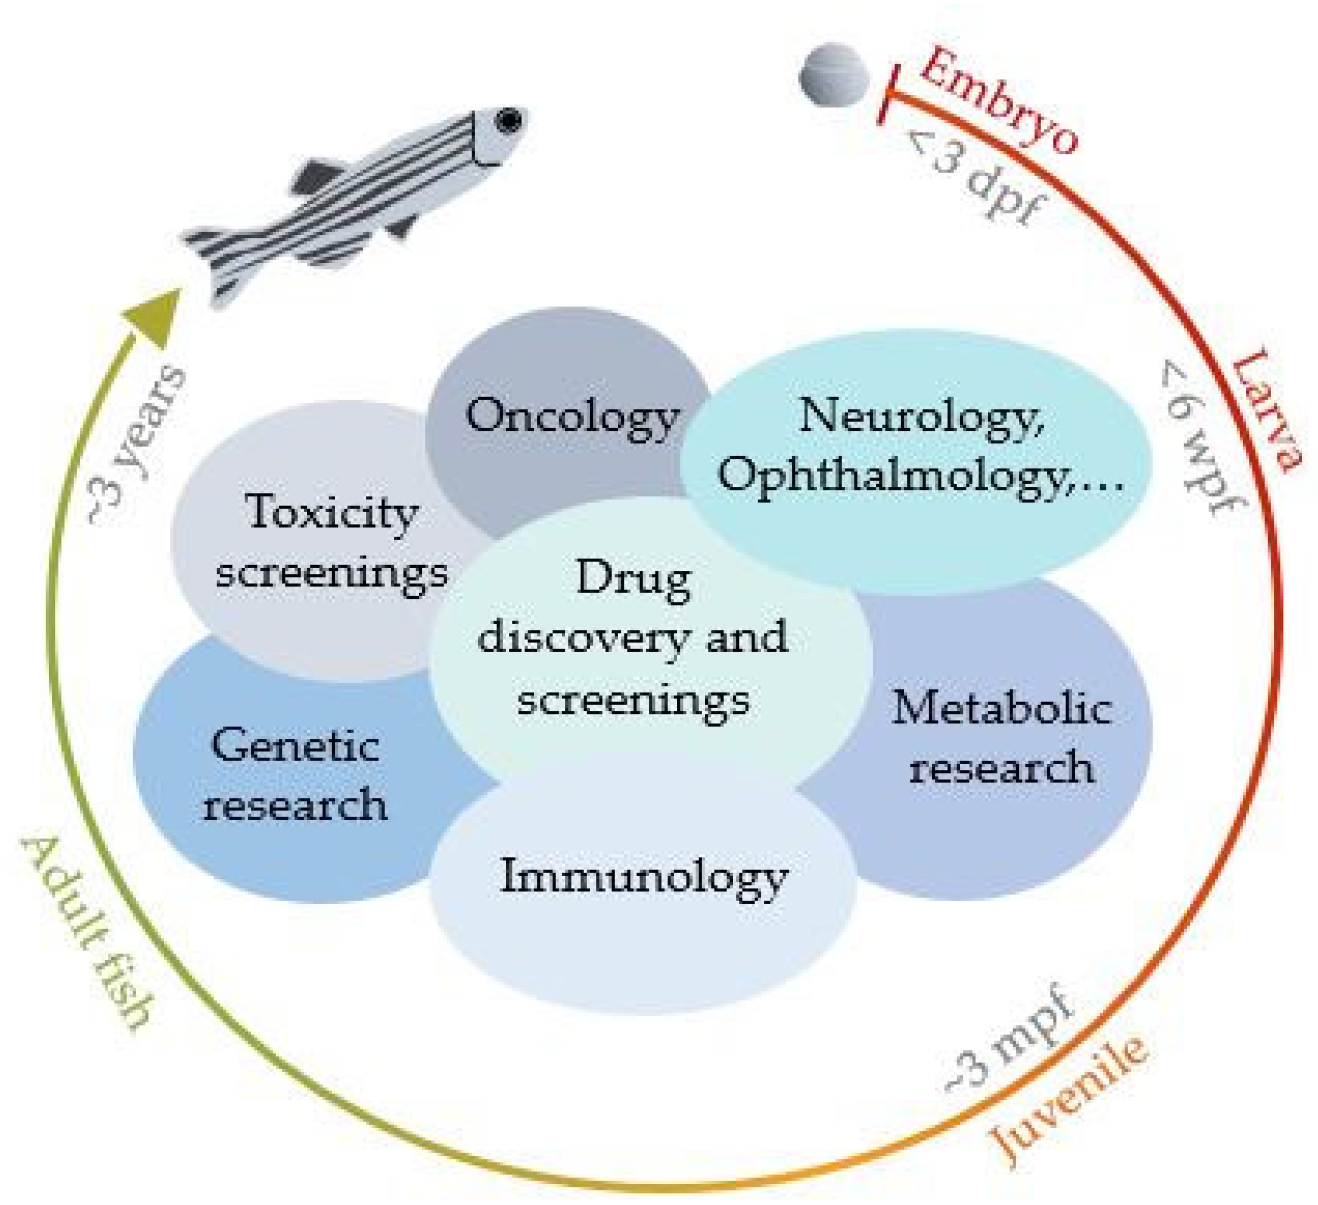
1. Introduction
2. Literature Review
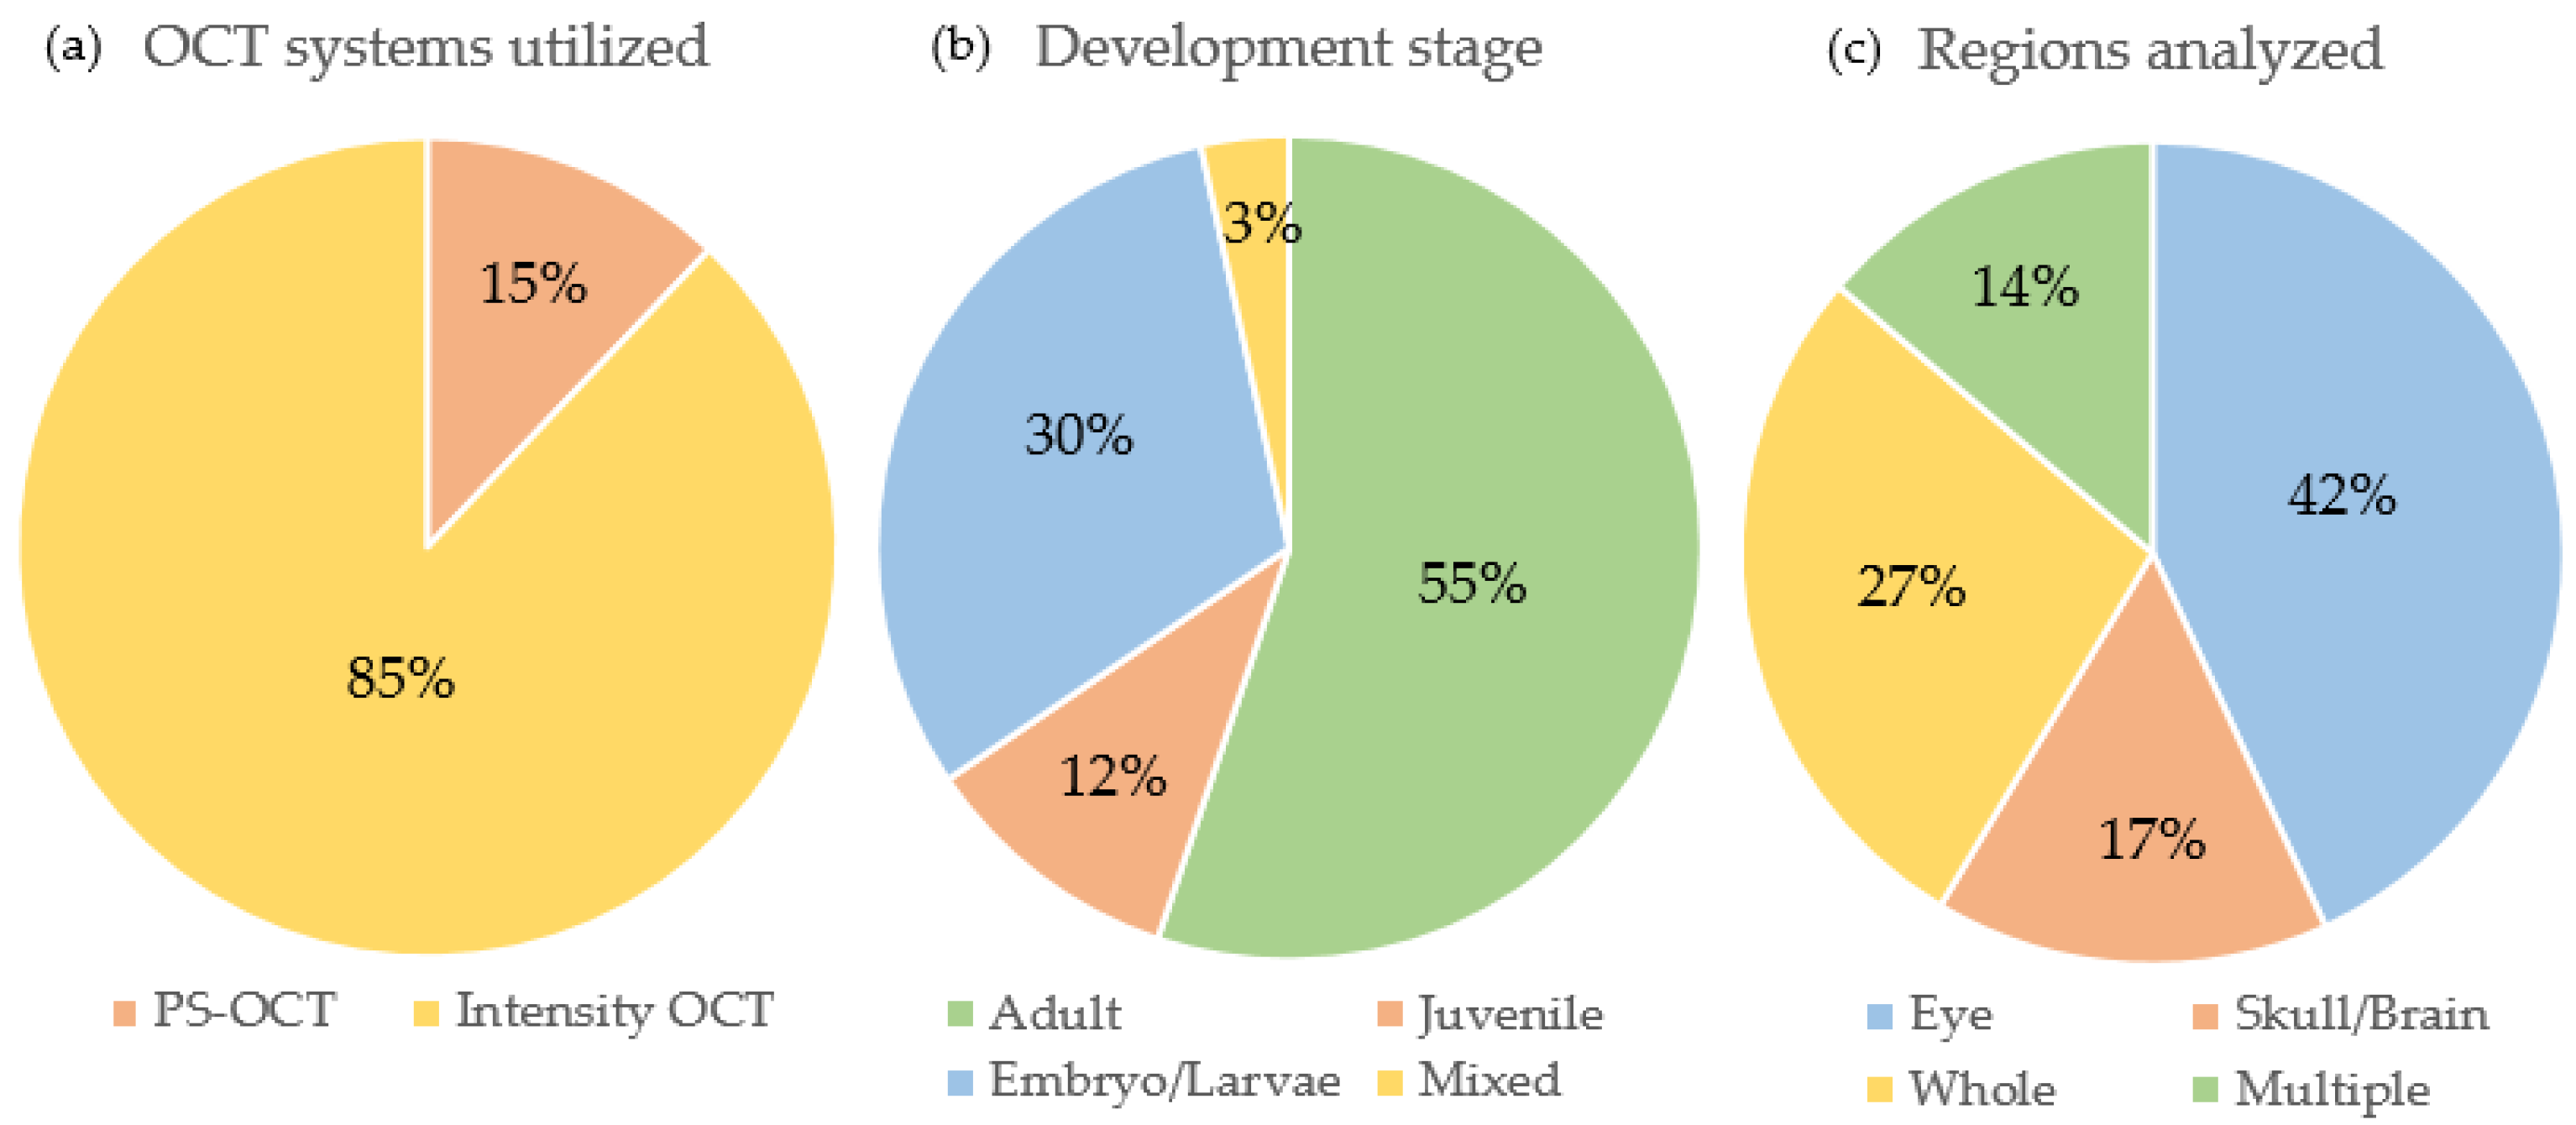
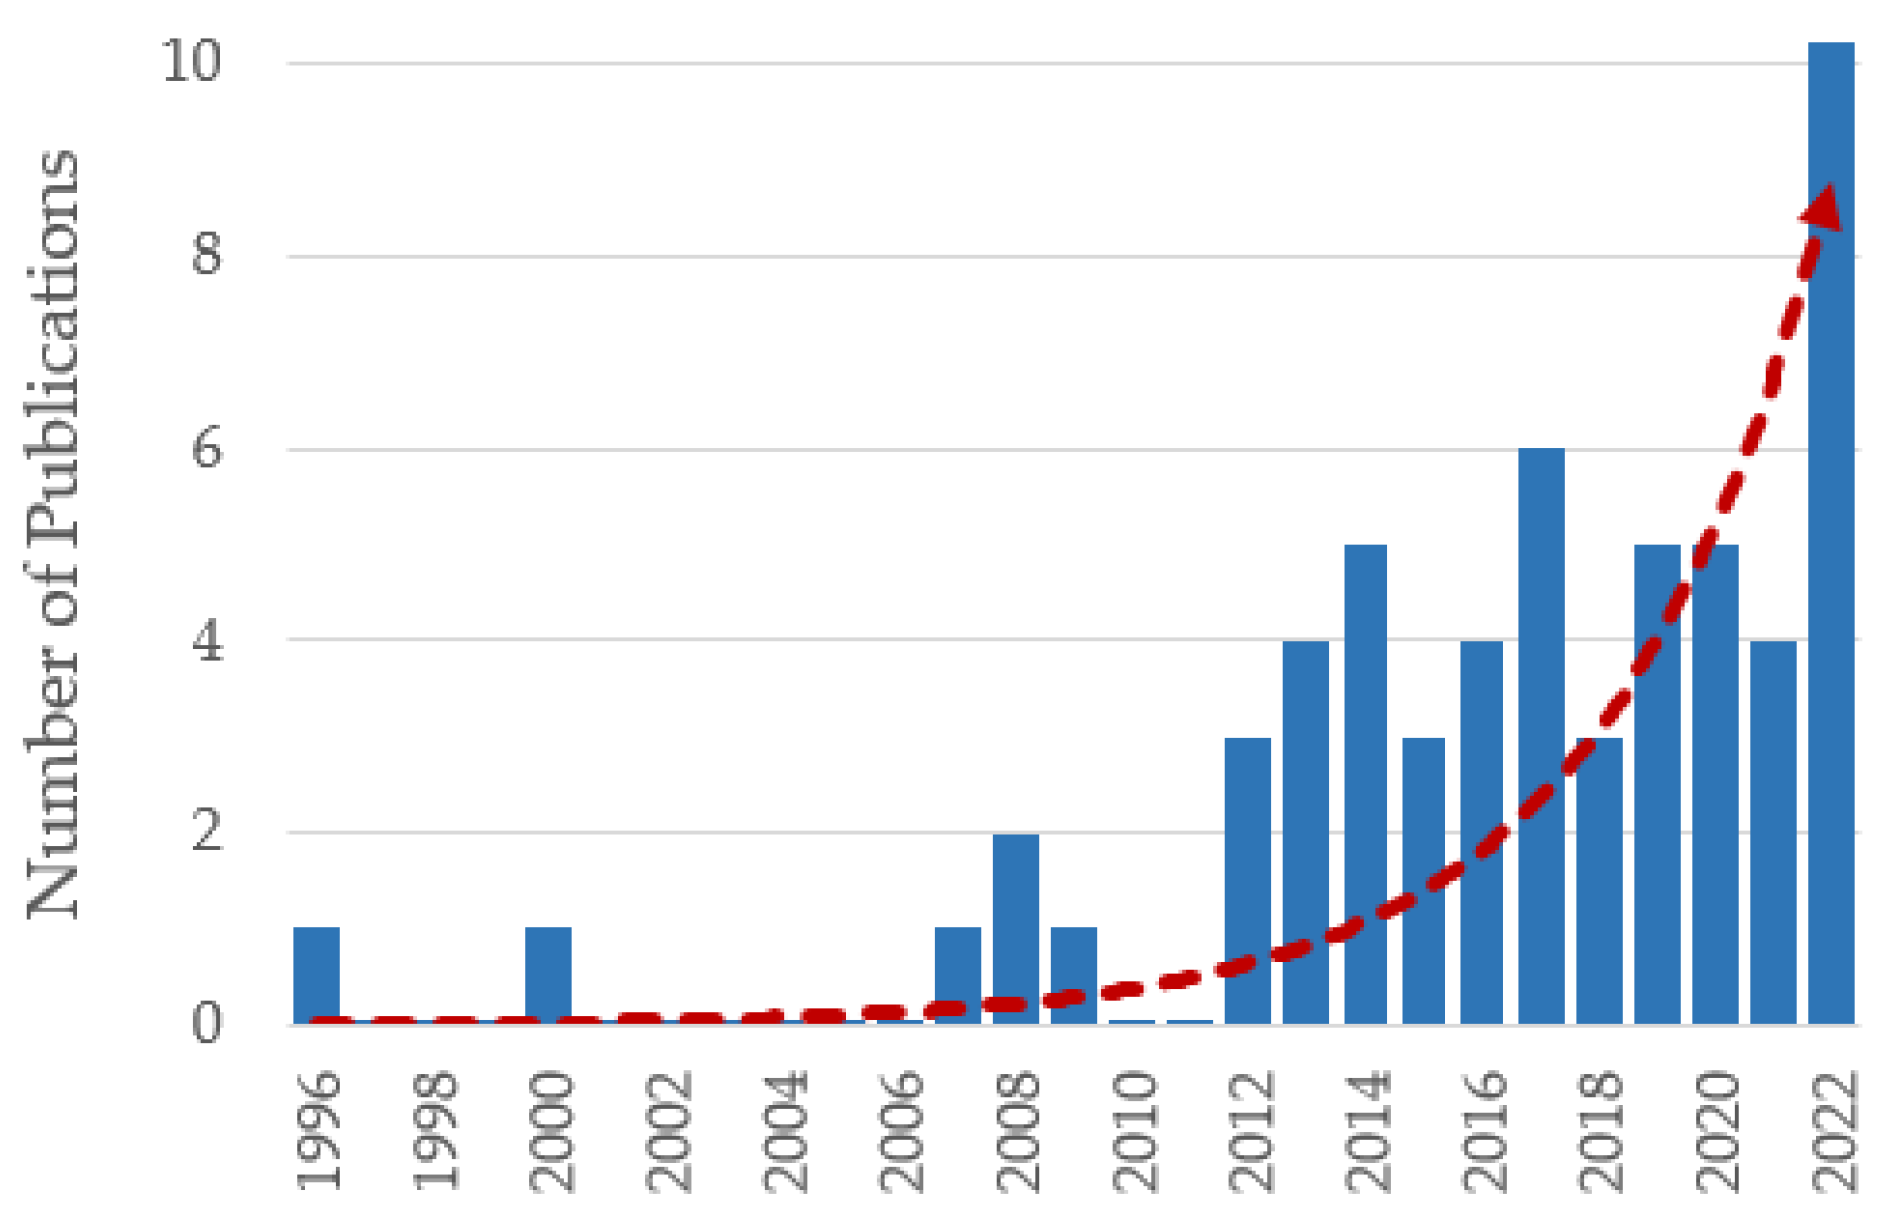
2.1. Categorical Literature Analysis
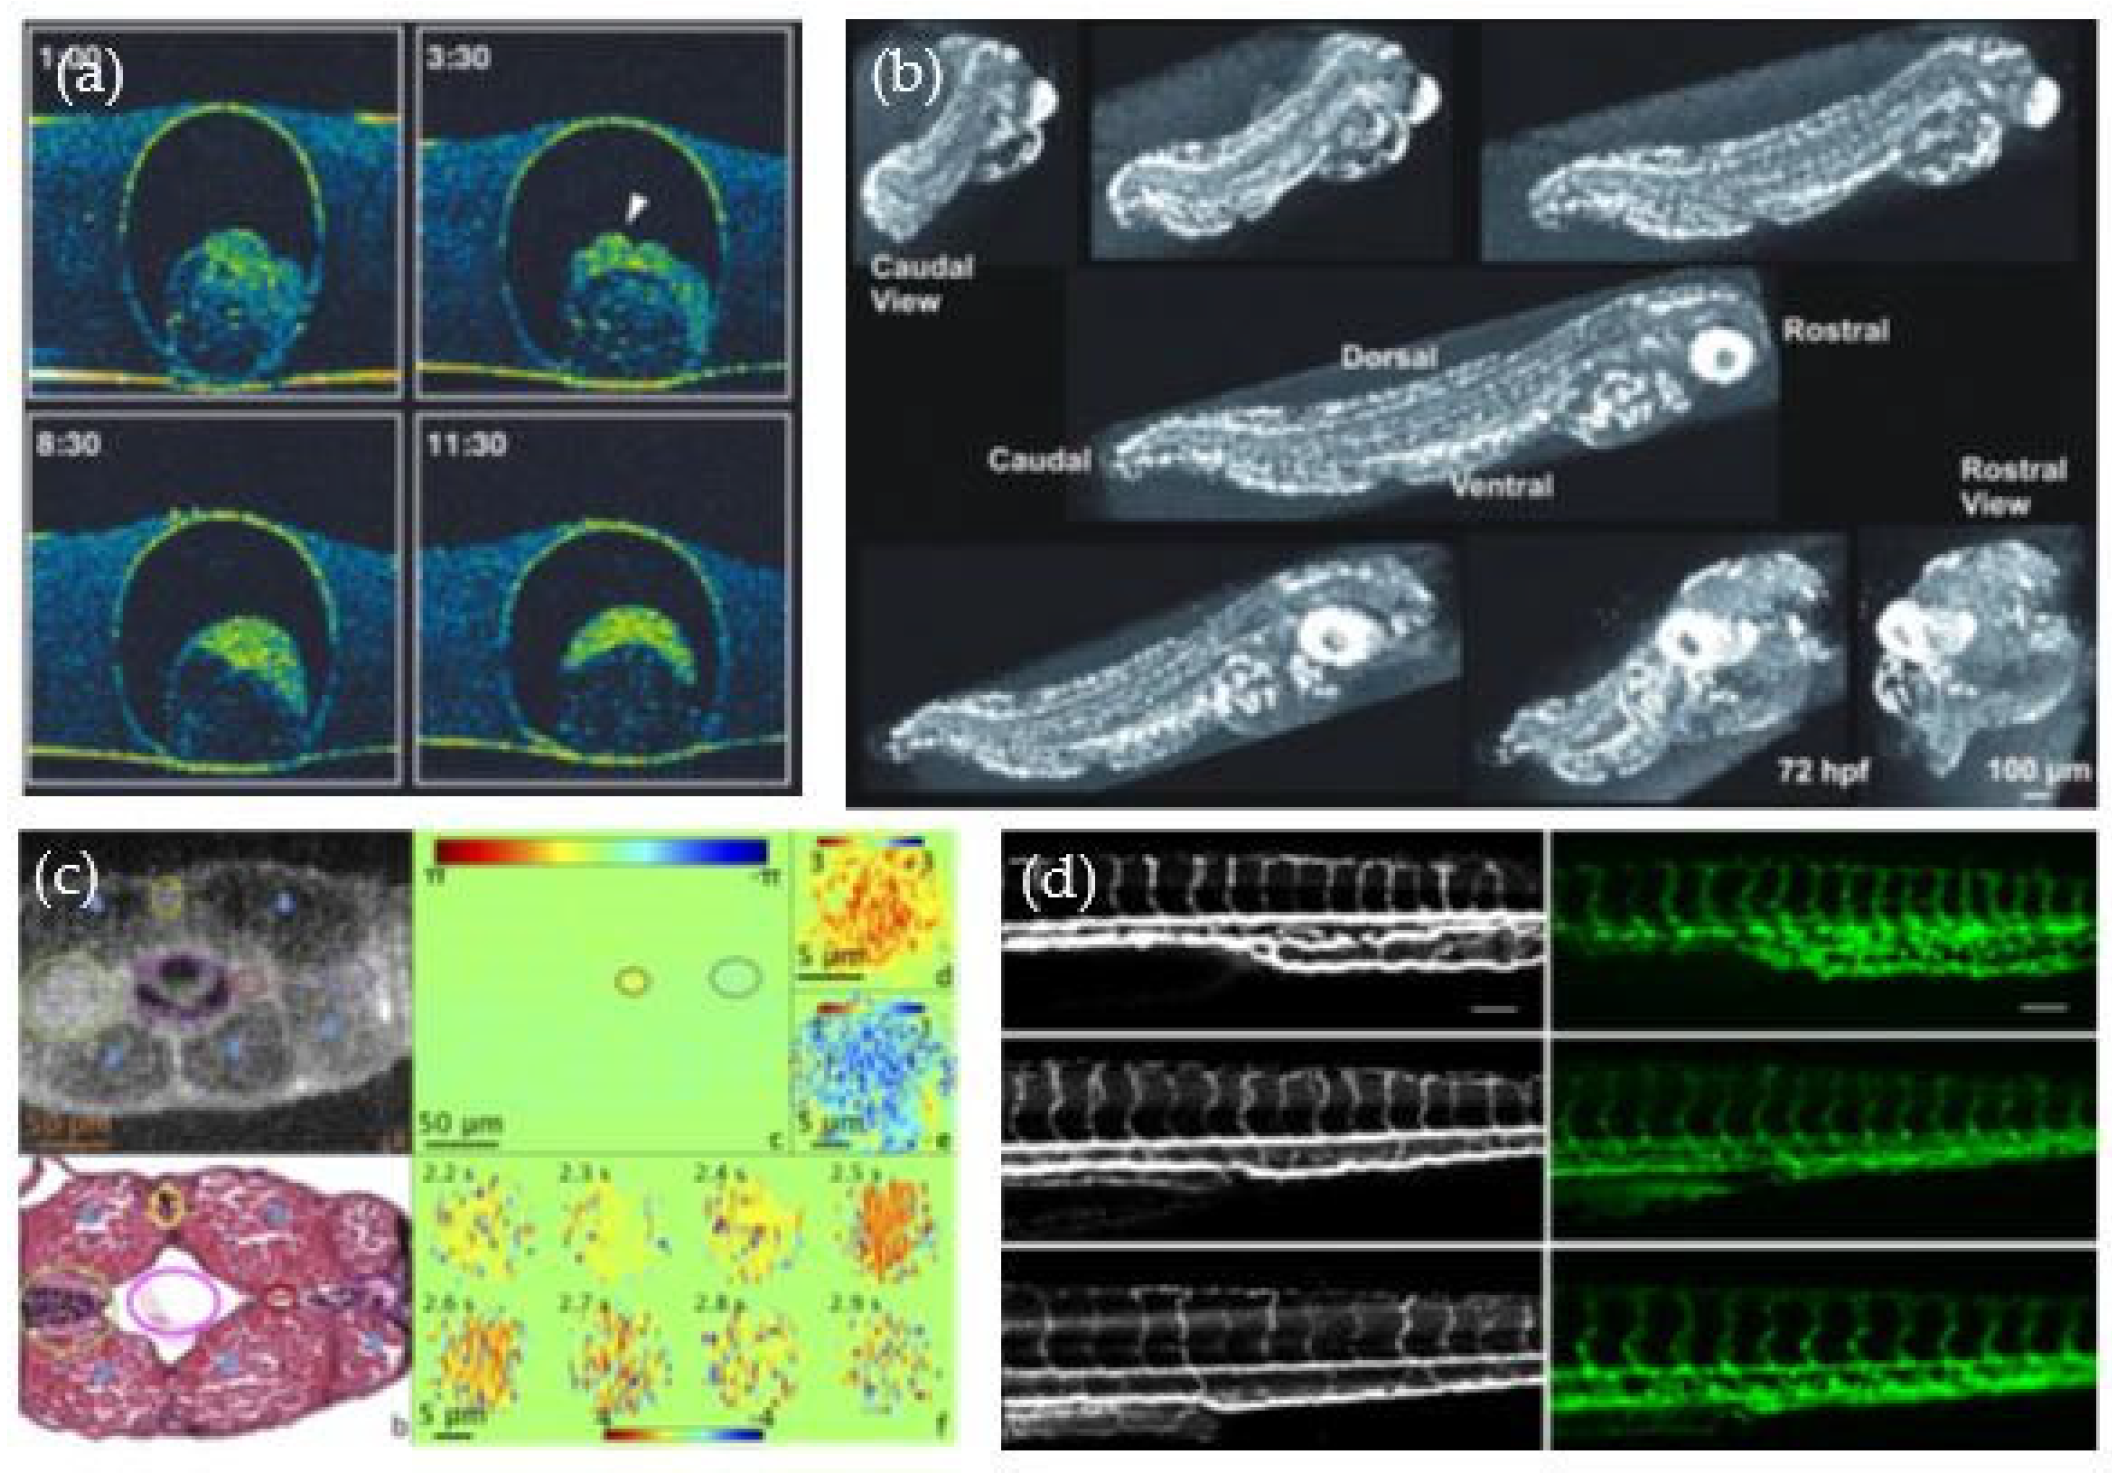
2.2. Investigating Zebrafish Embryos and Larvae
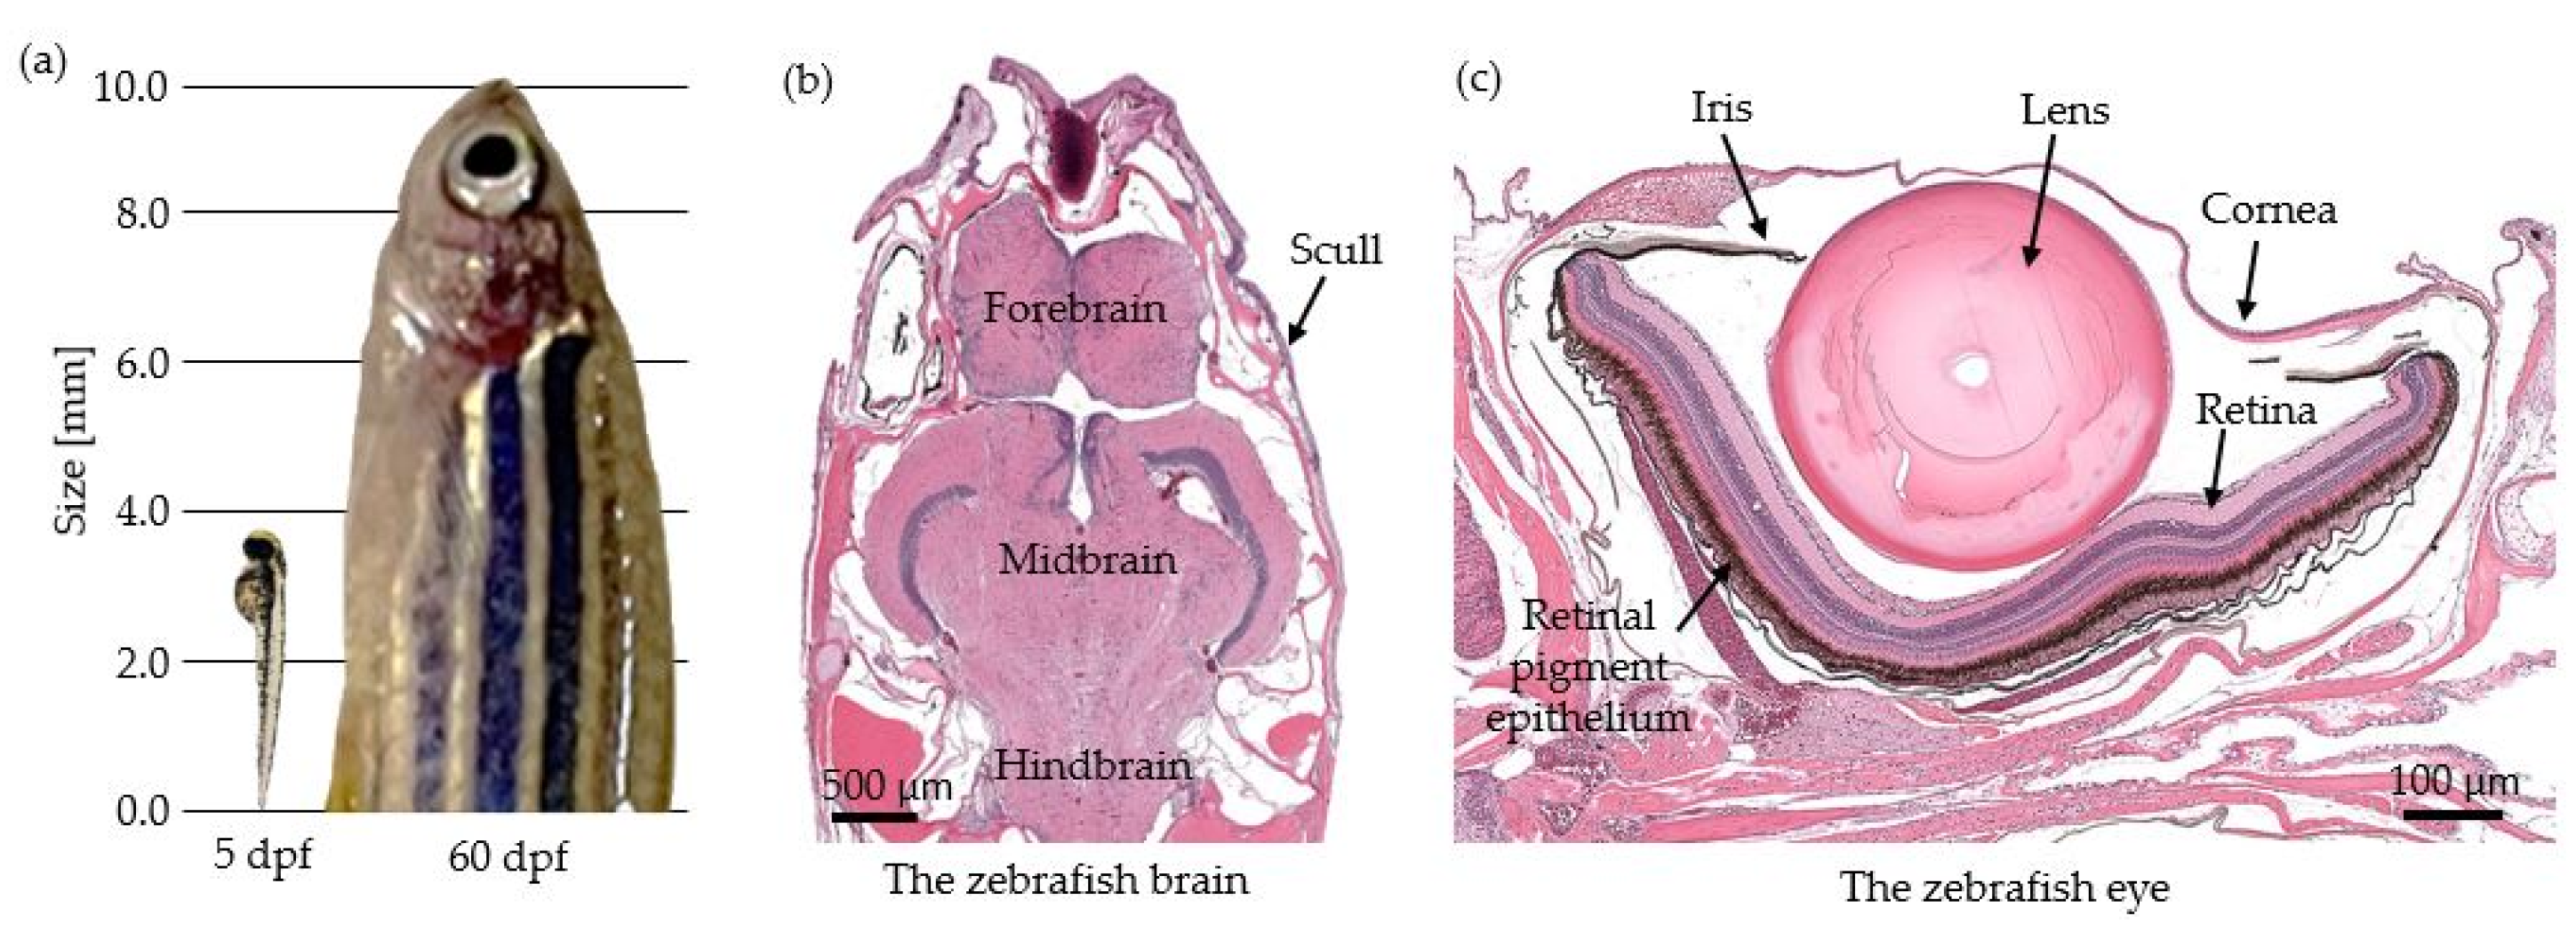
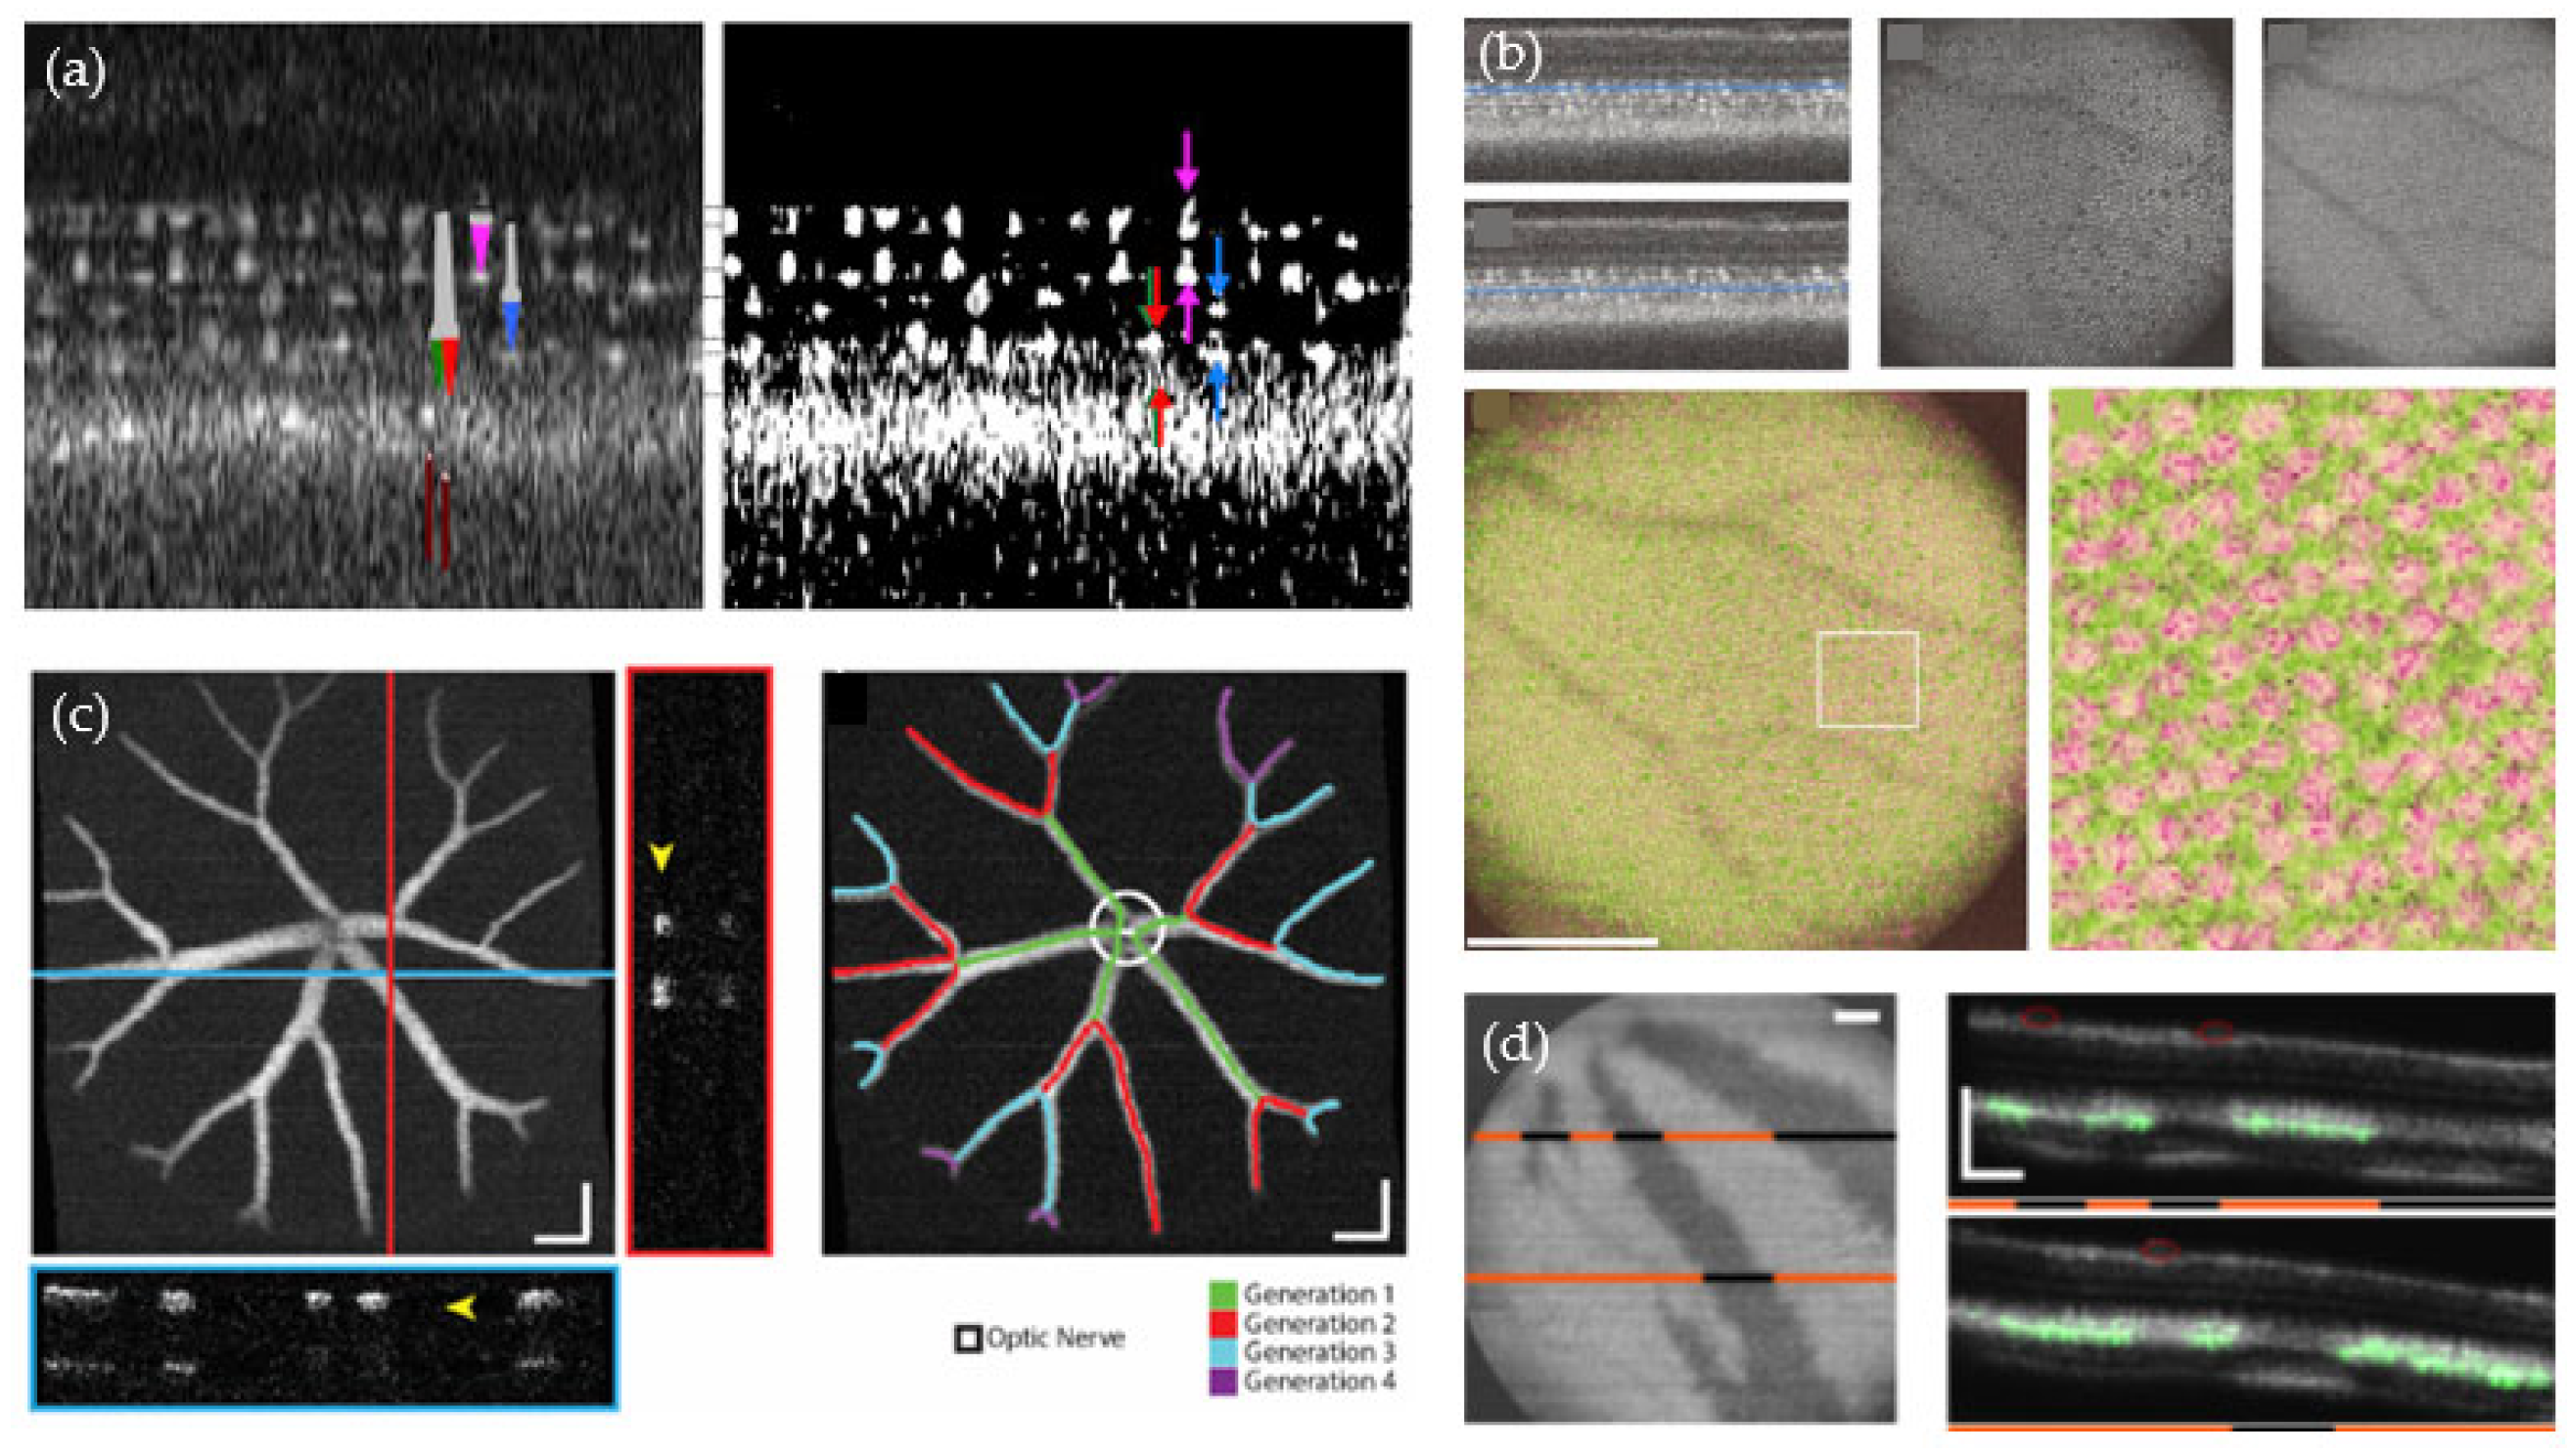
2.3. Studies Performed in the Zebrafish Eye
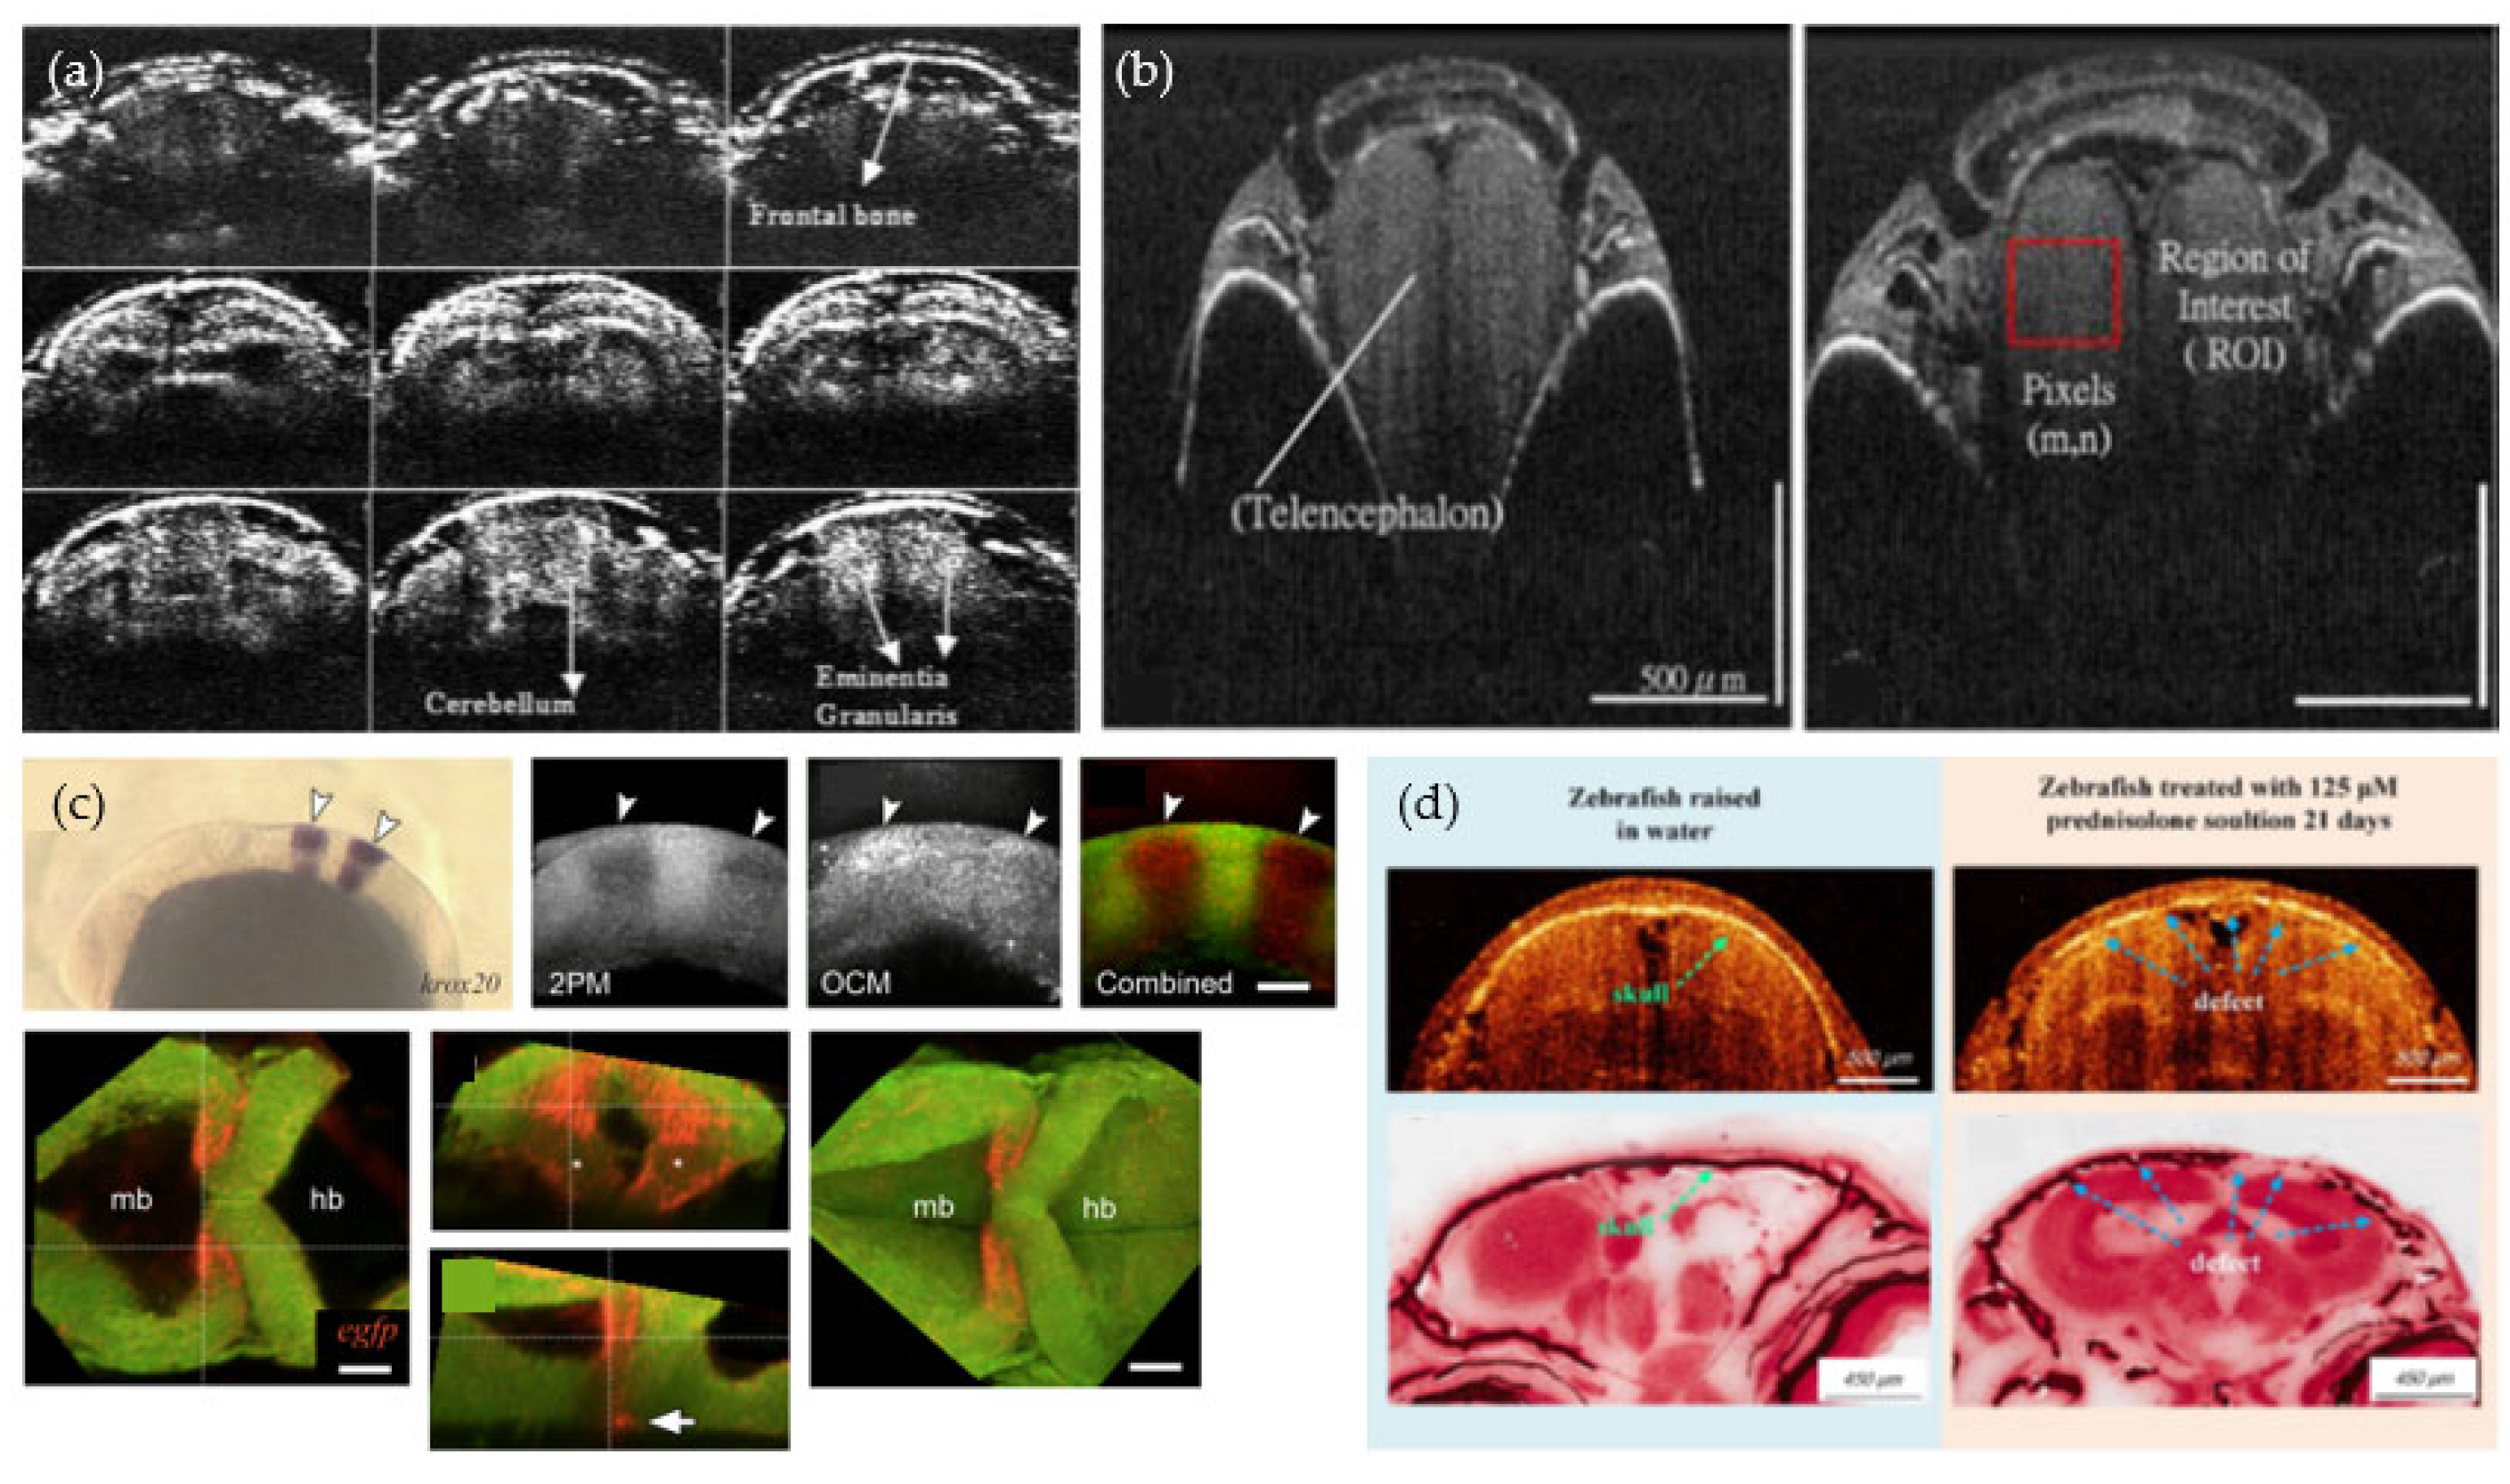
2.4. Studies Performed in the Zebrafish Skull and Brain
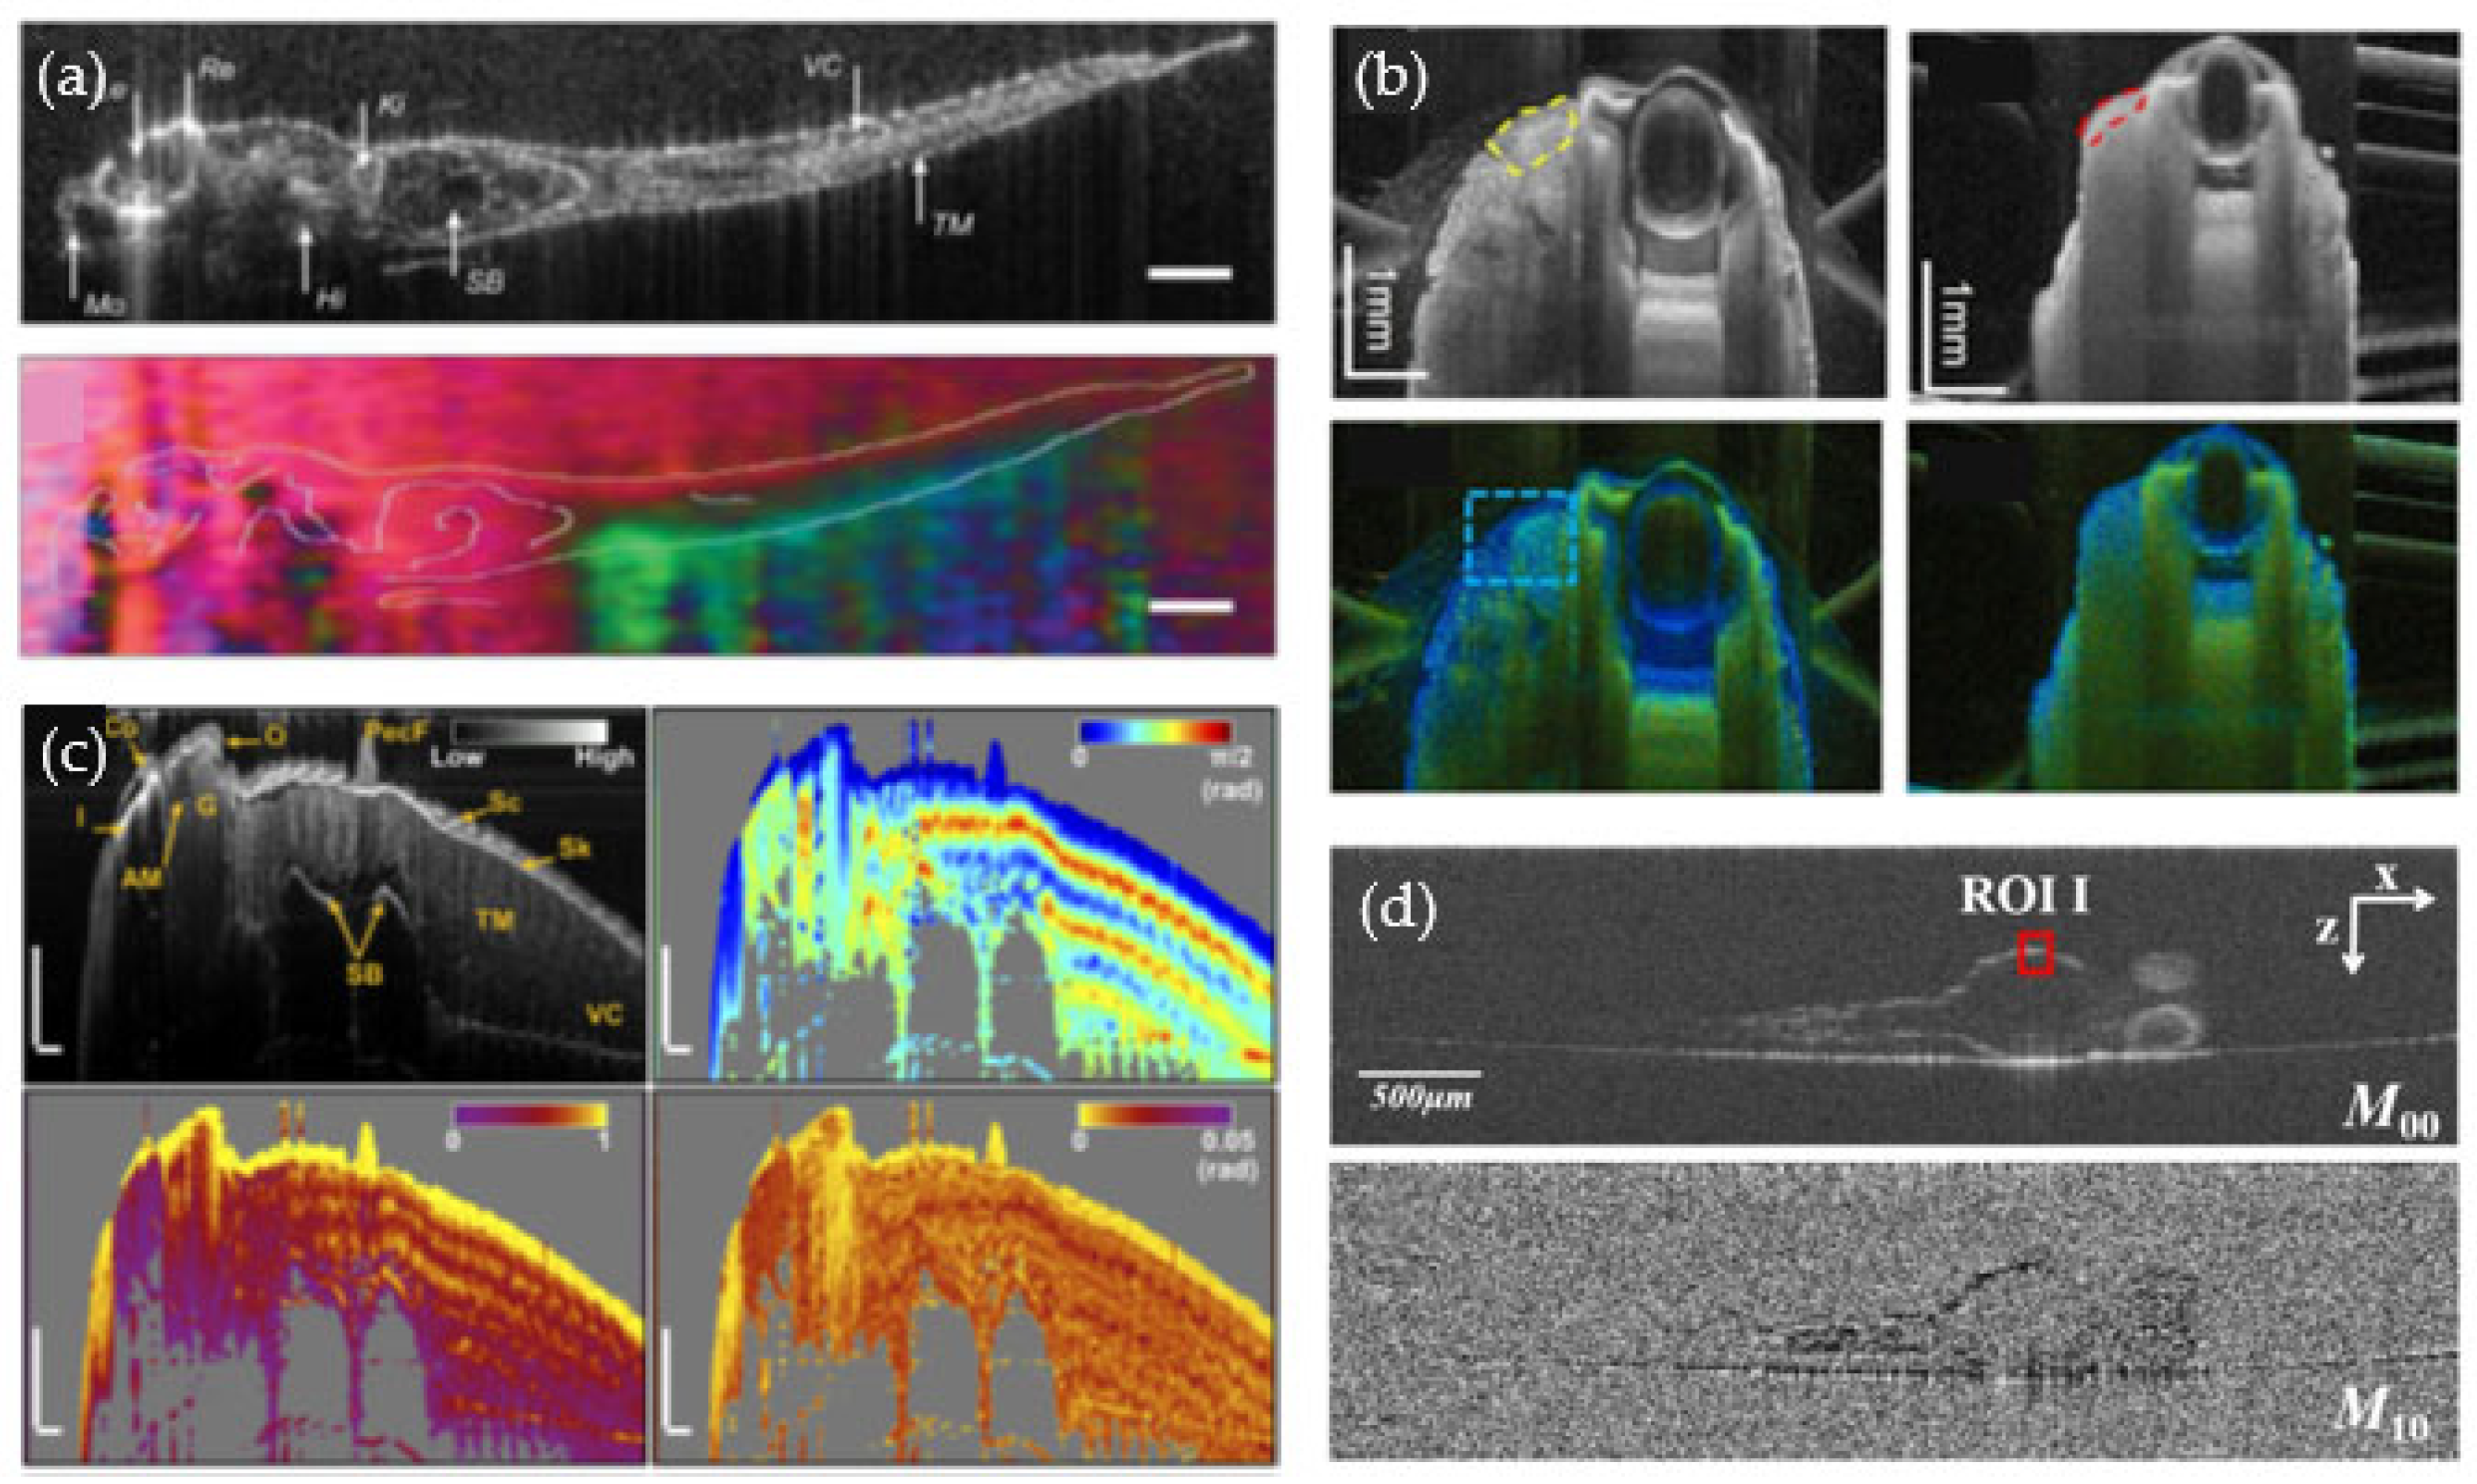
2.5. Novel Contrast Mechanisms
3. Discussion
Supplementary Materials
Author Contributions
Funding
Data Availability Statement
Acknowledgments
Conflicts of Interest
References
- Lieschke, G.J.; Currie, P.D. Animal models of human disease: Zebrafish swim into view. Nat. Rev. Genet. 2007, 8, 353–367. [Google Scholar] [CrossRef] [PubMed]
- Streisinger, G.; Walker, C.; Dower, N.; Knauber, D.; Singer, F. Production of clones of homozygous diploid zebra fish (Brachydanio rerio). Nature 1981, 291, 293–296. [Google Scholar] [CrossRef] [PubMed]
- Berghmans, S.; Jette, C.; Langenau, D.; Hsu, K.; Stewart, R.; Look, T.; Kanki, J.P. Making waves in cancer research: New models in the zebrafish. BioTechniques 2005, 39, 227–237. [Google Scholar] [CrossRef] [PubMed]
- Baxendale, S.; van Eeden, F.; Wilkinson, R. The Power of Zebrafish in personalised medicine. In Advances in Experimental Medicine and Biology; Springer: New York, NY, USA, 2017; Volume 1007, pp. 179–197. [Google Scholar]
- Dai, Y.-J.; Jia, Y.-F.; Chen, N.; Bian, W.-P.; Li, Q.-K.; Ma, Y.-B.; Chen, Y.-L.; Pei, D.-S. Zebrafish as a model system to study toxicology. Environ. Toxicol. Chem. 2014, 33, 11–17. [Google Scholar] [CrossRef] [PubMed]
- Singleman, C.; Holtzman, N.G. Growth and maturation in the zebrafish, Danio Rerio: A staging tool for teaching and research. Zebrafish 2014, 11, 396–406. [Google Scholar] [CrossRef] [PubMed] [Green Version]
- Choi, T.-Y.; Choi, T.-I.; Lee, Y.-R.; Choe, S.-K.; Kim, C.-H. Zebrafish as an animal model for biomedical research. Exp. Mol. Med. 2021, 53, 310–317. [Google Scholar] [CrossRef] [PubMed]
- Kirchberger, S.; Sturtzel, C.; Pascoal, S.; Distel, M. Quo natas, Danio?—Recent Progress in Modeling Cancer in Zebrafish. Front. Oncol. 2017, 7, 186. [Google Scholar] [CrossRef]
- RL, C.; LI, Z.; RM, W. Modeling Cancer with Flies and Fish. Dev. Cell 2019, 49, 317–324. [Google Scholar]
- Letrado, P.; de Miguel, I.; Lamberto, I.; Díez-Martínez, R.; Oyarzabal, J. Zebrafish: Speeding Up the Cancer Drug Discovery Process. Cancer Res. 2018, 78, 6048–6058. [Google Scholar] [CrossRef] [Green Version]
- Lam, S.; Chua, H.; Gong, Z.; Lam, T.; Sin, Y. Development and maturation of the immune system in zebrafish, Danio rerio: A gene expression profiling, in situ hybridization and immunological study. Dev. Comp. Immunol. 2004, 28, 9–28. [Google Scholar] [CrossRef]
- Bio-Atlas—Bio-Atlas. Available online: https://bio-atlas.psu.edu/about.php (accessed on 1 October 2022).
- Wan, Y.; Keller, P.J.; Höckendorf, B. Live Imaging of Zebrafish. In Imaging from Cells to Animals In Vivo; CRC Press: Boca Raton, FL, USA, 2020; pp. 307–324. [Google Scholar]
- Ahrens, M.B.; Orger, M.B.; Robson, D.N.; Li, J.M.; Keller, P.J. Whole-brain functional imaging at cellular resolution using light-sheet microscopy. Nat. Methods 2013, 10, 413–420. [Google Scholar] [CrossRef]
- Chatterjee, K.; Pratiwi, F.W.; Wu, F.C.M.; Chen, P.; Chen, B.-C. Recent Progress in Light Sheet Microscopy for Biological Applications. Appl. Spectrosc. 2018, 72, 1137–1169. [Google Scholar] [CrossRef] [Green Version]
- Santi, P.A. Light Sheet Fluorescence Microscopy: A Review. J. Histochem. Cytochem. 2011, 59, 129. [Google Scholar] [CrossRef] [Green Version]
- Cook, Z.T.; Brockway, N.L.; Weissman, T.A. Visualizing the Developing Brain in Living Zebrafish using Brainbow and Time-lapse Confocal Imaging. J. Vis. Exp. 2020, e60593. [Google Scholar] [CrossRef]
- Malone, M.H.; Sciaky, N.; Stalheim, L.; Hahn, K.M.; Linney, E.; Johnson, G.L. Laser-scanning velocimetry: A confocal microscopy method for quantitative measurement of cardiovascular performance in zebrafish embryos and larvae. BMC Biotechnol. 2007, 7, 1–11. [Google Scholar] [CrossRef] [Green Version]
- Yalcin, H.C.; Amindari, A.; Butcher, J.T.; Althani, A.; Yacoub, M. Heart function and hemodynamic analysis for zebrafish embryos. Dev. Dyn. 2017, 246, 868–880. [Google Scholar] [CrossRef] [Green Version]
- Le Gratiet, A.; d’Amora, M.; Duocastella, M.; Marongiu, R.; Bendandi, A.; Giordani, S.; Bianchini, P.; Diaspro, A. Zebrafish structural development in Mueller-matrix scanning microscopy. Sci. Rep. 2019, 9, 1–10. [Google Scholar] [CrossRef] [Green Version]
- Machikhin, A.; Huang, C.; Khokhlov, D.; Galanova, V.; Burlakov, A. Single-shot Mueller-matrix imaging of zebrafish tissues: In vivo analysis of developmental and pathological features. J. Biophotonics 2022, 15, e202200088. [Google Scholar] [CrossRef]
- Gamble, J.; Elson, D.; Greenwood, J.; Tanguay, R.; Kolluri, S. The Zebrafish Xenograft Models for Investigating Cancer and Cancer Therapeutics. Biology 2021, 10, 252. [Google Scholar] [CrossRef]
- White, R.M.; Sessa, A.; Burke, C.; Bowman, T.; LeBlanc, J.; Ceol, C.; Bourque, C.; Dovey, M.; Goessling, W.; Burns, C.E.; et al. Transparent Adult Zebrafish as a Tool for In Vivo Transplantation Analysis. Cell Stem Cell 2008, 2, 183–189. [Google Scholar] [CrossRef] [Green Version]
- Antinucci, P.; Hindges, R. A crystal-clear zebrafish for in vivo imaging. Sci. Rep. 2016, 6, 29490. [Google Scholar] [CrossRef] [PubMed]
- Merrifield, G.D.; Mullin, J.; Gallagher, L.; Tucker, C.; Jansen, M.A.; Denvir, M.; Holmes, W.M. Rapid and recoverable in vivo magnetic resonance imaging of the adult zebrafish at 7T. Magn. Reson. Imaging 2017, 37, 9–15. [Google Scholar] [CrossRef] [PubMed]
- Ding, Y.; Vanselow, D.J.; Yakovlev, M.A.; Katz, S.R.; Lin, A.Y.; Clark, D.P.; Vargas, P.; Xin, X.; Copper, J.E.; Canfield, V.A.; et al. Computational 3D histological phenotyping of whole zebrafish by X-ray histotomography. eLife 2019, 8, e44898. [Google Scholar] [CrossRef] [PubMed]
- Huang, N.; Guo, H.; Qi, W.; Zhang, Z.; Rong, J.; Yuan, Z.; Ge, W.; Jiang, H.; Xi, L. Whole-body multispetral photoacoustic imaging of adult zebrafish. Biomed. Opt. Express 2016, 7, 3543–3550. [Google Scholar] [CrossRef] [PubMed] [Green Version]
- Donnarumma, D.; Brodoline, A.; Alexandre, D.; Gross, M. 4D holographic microscopy of zebrafish larvae microcirculation. Opt. Express 2016, 24, 26887–26900. [Google Scholar] [CrossRef] [PubMed] [Green Version]
- Drexler, W.; Fujimoto, J.G. Optical Coherence Tomography Technology and Applications; Springer Science Business Media: Berlin/Heidelberg, Germany, 2015. [Google Scholar]
- Olsen, J.; Holmes, J.; Jemec, G.B.E. Advances in optical coherence tomography in dermatology—A review. J. Biomed. Opt. 2018, 23, 040901. [Google Scholar] [CrossRef] [Green Version]
- Tsai, T.-H.; Leggett, C.L.; Trindade, A.J.; Sethi, A.; Swager, A.-F.; Joshi, V.; Bergman, J.J.; Mashimo, H.; Nishioka, N.S.; Namati, E. Optical coherence tomography in gastroenterology: A review and future outlook. J. Biomed. Opt. 2017, 22, 121716. [Google Scholar] [CrossRef] [Green Version]
- Men, J.; Huang, Y.; Solanki, J.; Zeng, X.; Alex, A.; Jerwick, J.; Zhang, Z.; Tanzi, R.E.; Li, A.; Zhou, C. Optical Coherence Tomography for Brain Imaging and Developmental Biology. IEEE J. Sel. Top. Quantum Electron. 2015, 22, 1–13. [Google Scholar] [CrossRef] [Green Version]
- El-Sadek, I.A.; Miyazawa, A.; Shen, L.T.-W.; Makita, S.; Mukherjee, P.; Lichtenegger, A.; Matsusaka, S.; Yasuno, Y. Three-dimensional dynamics optical coherence tomography for tumor spheroid evaluation. Biomed. Opt. Express 2021, 12, 6844. [Google Scholar] [CrossRef]
- Lichtenegger, A.; Muck, M.; Eugui, P.; Harper, D.J.; Augustin, M.; Leskovar, K.; Hitzenberger, C.K.; Woehrer, A.; Baumann, B. Assessment of pathological features in Alzheimer’s disease brain tissue with a large field-of-view visible-light optical coherence microscope. Neurophotonics 2018, 5, 035002. [Google Scholar] [CrossRef]
- Lichtenegger, A.; Mukherjee, P.; Tamaoki, J.; Bian, L.; Zhu, L.; El-Sadek, I.G.A.; Makita, S.; Leskovar, K.; Kobayashi, M.; Baumann, B.; et al. Multicontrast investigation of in vivo wildtype zebrafish in three development stages using polarization-sensitive optical coherence tomography. J. Biomed. Opt. 2022, 27, 016001. [Google Scholar] [CrossRef]
- Povazay, B.; Bizheva, K.; Unterhuber, A.; Hermann, B.; Sattmann, H.; Fercher, A.F.; Drexler, W.; Apolonski, A.; Wadsworth, W.J.; Knight, J.C.; et al. Submicrometer axial resolution optical coherence tomography. Opt. Lett. 2002, 27, 1800–1802. [Google Scholar] [CrossRef]
- Shu, X.; Beckmann, L.; Zhang, H.F. Visible-light optical coherence tomography: A review. J. Biomed. Opt. 2017, 22, 1–14. [Google Scholar] [CrossRef]
- Leitgeb, R.; Villiger, M.; Bachmann, A.H.; Steinmann, L.; Lasser, T. Extended focus depth for Fourier domain optical coherence microscopy. Opt. Lett. 2006, 31, 2450–2452. [Google Scholar] [CrossRef] [Green Version]
- de Boer, J.; Hitzenberger, C.K.; Yasuno, Y. Polarization sensitive optical coherence tomography—A review [Invited]. Biomed. Opt. Express 2017, 8, 1838–1873. [Google Scholar] [CrossRef] [Green Version]
- Baumann, B. Polarization Sensitive Optical Coherence Tomography: A Review of Technology and Applications. Appl. Sci. 2017, 7, 474. [Google Scholar] [CrossRef] [Green Version]
- Makita, S.; Yamanari, M.; Yasuno, Y. Generalized Jones matrix optical coherence tomography: Performance and local birefringence imaging. Opt. Express 2010, 18, 854–876. [Google Scholar] [CrossRef] [Green Version]
- Hitzenberger, C.; Goetzinger, E.; Sticker, M.; Pircher, M.; Fercher, A.F. Measurement and imaging of birefringence and optic axis orientation by phase resolved polarization sensitive optical coherence tomography. Opt. Express 2001, 9, 780–790. [Google Scholar] [CrossRef]
- Götzinger, E.; Pircher, M.; Geitzenauer, W.; Ahlers, C.; Baumann, B.; Michels, S.; Schmidt-Erfurth, U.; Hitzenberger, C.K. Retinal pigment epithelium segmentation by polarization sensitive optical coherence tomography. Opt. Express 2008, 16, 16410–16422. [Google Scholar] [CrossRef] [PubMed] [Green Version]
- Lippok, N.; Villiger, M.; Bouma, B.E. Degree of polarization (uniformity) and depolarization index: Unambiguous depolarization contrast for optical coherence tomography. Opt. Lett. 2015, 40, 3954–3957. [Google Scholar] [CrossRef] [Green Version]
- Yamanari, M.; Tsuda, S.; Kokubun, T.; Shiga, Y.; Omodaka, K.; Aizawa, N.; Yokoyama, Y.; Himori, N.; Kunimatsu-Sanuki, S.; Maruyama, K.; et al. Estimation of Jones matrix, birefringence and entropy using Cloude-Pottier decomposition in polarization-sensitive optical coherence tomography. Biomed. Opt. Express 2016, 7, 3551–3573. [Google Scholar] [CrossRef] [PubMed]
- Pircher, M.; Hitzenberger, C.K.; Schmidt-Erfurth, U. Polarization sensitive optical coherence tomography in the human eye. Prog. Retin. Eye Res. 2011, 30, 431–451. [Google Scholar] [CrossRef] [PubMed] [Green Version]
- Marjanovic, E.J.; Sharma, V.; Smith, L.; Pinder, C.; Moore, T.L.; Manning, J.B.; Dinsdale, G.; Berks, M.; Newton, V.L.; Wilkinson, S.; et al. Polarisation-sensitive optical coherence tomography measurement of retardance in fibrosis, a non-invasive biomarker in patients with systemic sclerosis. Sci. Rep. 2022, 12, 1–12. [Google Scholar] [CrossRef] [PubMed]
- Golde, J.; Tetschke, F.; Walther, J.; Rosenauer, T.; Hempel, F.; Hannig, C.; Koch, E. Detection of carious lesions utilizing depolarization imaging by polarization sensitive optical coherence tomography. J. Biomed. Opt. 2018, 23, 1. [Google Scholar] [CrossRef] [PubMed] [Green Version]
- Makita, S.; Hong, Y.; Yamanari, M.; Yatagai, T.; Yasuno, Y. Optical coherence angiography. Opt. Express 2006, 14, 7821–7840. [Google Scholar] [CrossRef] [Green Version]
- de Carlo, T.E.; Romano, A.; Waheed, N.K.; Duker, J.S. A review of optical coherence tomography angiography (OCTA). Int. J. Retin. Vitr. 2015, 1, 1–15. [Google Scholar] [CrossRef] [Green Version]
- Baran, U.; Wang, R. Review of optical coherence tomography based angiography in neuroscience. Neurophotonics 2016, 3, 010902. [Google Scholar] [CrossRef] [Green Version]
- Boppart, S.; Brezinski, M.E.; Bouma, B.E.; Tearney, G.J.; Fujimoto, J.G. Investigation of Developing Embryonic Morphology Using Optical Coherence Tomography. Dev. Biol. 1996, 177, 54–63. [Google Scholar] [CrossRef] [Green Version]
- Boppart, S.A.; Brezinski, M.E.; Fujimoto, J.G. Optical Coherence Tomography Imaging in Developmental Biology. Methods Mol. Biol. 2000, 135, 217–233. [Google Scholar] [CrossRef] [Green Version]
- Kagemann, L.; Ishikawa, H.; Zou, J.; Charukamnoetkanok, P.; Wollstein, G.; Townsend, K.A.; Gabriele, M.L.; Bahary, N.; Wei, X.; Fujimoto, J.G.; et al. Repeated, noninvasive, high resolution spectral domain optical coherence tomography imaging of zebrafish embryos. Mol. Vis. 2008, 14, 2157–2170. [Google Scholar]
- Cui, D.; Liu, X.; Zhang, J.; Yu, X.; Ding, S.; Luo, Y.; Gu, J.; Shum, P.; Liu, L. Dual spectrometer system with spectral compounding for 1-μm optical coherence tomography in vivo. Opt. Lett. 2014, 39, 6727–6730. [Google Scholar] [CrossRef]
- Chen, Y.; Trinh, L.A.; Fingler, J.; Fraser, S.E. 3D in vivo imaging with extended-focus optical coherence microscopy. J. Biophotonics 2017, 10, 1411–1420. [Google Scholar] [CrossRef]
- Zhou, K.C.; McNabb, R.P.; Qian, R.; Degan, S.; Dhalla, A.-H.; Farsiu, S.; Izatt, J.A. Computational 3D microscopy with optical coherence refraction tomography. Optica 2022, 9, 593. [Google Scholar] [CrossRef]
- Rao, K.D.; Upadhyaya, P.; Sharma, M.; Gupta, P.K. Noninvasive imaging of ethanol-induced developmental defects in zebrafish embryos using optical coherence tomography. Birth Defects Res. Part B: Dev. Reprod. Toxicol. 2011, 95, 7–11. [Google Scholar] [CrossRef]
- Haindl, R.; Deloria, A.J.; Sturtzel, C.; Sattmann, H.; Rohringer, W.; Fischer, B.; Andreana, M.; Unterhuber, A.; Schwerte, T.; Distel, M.; et al. Functional optical coherence tomography and photoacoustic microscopy imaging for zebrafish larvae. Biomed. Opt. Express 2020, 11, 2137–2151. [Google Scholar] [CrossRef]
- Chen, Y.; Trinh, L.A.; Fingler, J.; Fraser, S.E. Phase variance optical coherence microscopy for label-free imaging of the developing vasculature in zebrafish embryos. J. Biomed. Opt. 2016, 21, 126022. [Google Scholar] [CrossRef] [Green Version]
- Stoletov, K.; Montel, V.; Lester, R.D.; Gonias, S.L.; Klemke, R. High-resolution imaging of the dynamic tumor cell–vascular interface in transparent zebrafish. Proc. Natl. Acad. Sci. USA 2007, 104, 17406–17411. [Google Scholar] [CrossRef] [Green Version]
- Fingler, J.; Schwartz, D.; Yang, C.; Fraser, S.E. Mobility and transverse flow visualization using phase variance contrast with spectral domain optical coherence tomography. Opt. Express 2007, 15, 12636–12653. [Google Scholar] [CrossRef] [Green Version]
- Iftimia, N.V.; Hammer, D.X.; Ferguson, R.D.; Mujat, M.; Vu, D.; Ferrante, A.A. Dual-beam Fourier domain optical Doppler tomography of zebrafish. Opt. Express 2008, 16, 13624–13636. [Google Scholar] [CrossRef] [Green Version]
- Alam, Z.; Poddar, R. An in-vivo depth-resolved imaging of developing zebrafish microstructure and microvasculature using swept-source optical coherence tomography angiography. Opt. Lasers Eng. 2022, 156. [Google Scholar] [CrossRef]
- Menke, A.L.; Spitsbergen, J.M.; Wolterbeek, A.P.M.; Woutersen, R.A. Normal Anatomy and Histology of the Adult Zebrafish. Toxicol. Pathol. 2011, 39, 759–775. [Google Scholar] [CrossRef] [PubMed]
- Bailey, T.J.; Davis, D.H.; Vance, J.E.; Hyde, D.R. Spectral-Domain Optical Coherence Tomography as a Noninvasive Method to Assess Damaged and Regenerating Adult Zebrafish Retinas. Investig. Opthalmology Vis. Sci. 2012, 53, 3126–3138. [Google Scholar] [CrossRef] [PubMed]
- Weber, A.; Hochmann, S.; Cimalla, P.; Gärtner, M.; Kuscha, V.; Hans, S.; Geffarth, M.; Kaslin, J.; Koch, E.; Brand, M. Characterization of Light Lesion Paradigms and Optical Coherence Tomography as Tools to Study Adult Retina Regeneration in Zebrafish. PLoS ONE 2013, 8, e80483. [Google Scholar] [CrossRef] [PubMed] [Green Version]
- Huckenpahler, A.L.; Lookfong, N.A.; Warr, E.; Heffernan, E.; Carroll, J.; Collery, R.F. Noninvasive Imaging of Cone Ablation and Regeneration in Zebrafish. Transl. Vis. Sci. Technol. 2020, 9, 18. [Google Scholar] [CrossRef] [PubMed]
- Noel, N.C.L.; Nadolski, N.J.; Hocking, J.C.; Macdonald, I.M.; Allison, W.T. Progressive Photoreceptor Dysfunction and Age-Related Macular Degeneration-Like Features in rp1l1 Mutant Zebrafish. Cells 2020, 9, 2214. [Google Scholar] [CrossRef]
- Wilk, M.A.; Huckenpahler, A.L.; Collery, R.F.; Link, B.A.; Carroll, J. The Effect of Retinal Melanin on Optical Coherence Tomography Images. Transl. Vis. Sci. Technol. 2017, 6, 8. [Google Scholar] [CrossRef] [Green Version]
- Lapierre-Landry, M.; Huckenpahler, A.L.; Link, B.A.; Collery, R.F.; Carroll, J.; Skala, M.C. Imaging Melanin Distribution in the Zebrafish Retina Using Photothermal Optical Coherence Tomography. Transl. Vis. Sci. Technol. 2018, 7, 4. [Google Scholar] [CrossRef] [Green Version]
- Toms, M.; Burgoyne, T.; Tracey-White, D.; Richardson, R.; Dubis, A.M.; Webster, A.R.; Futter, C.; Moosajee, M. Phagosomal and mitochondrial alterations in RPE may contribute to KCNJ13 retinopathy. Sci. Rep. 2019, 9, 1–15. [Google Scholar] [CrossRef] [Green Version]
- Bozic, I.; Li, X.; Tao, Y. Quantitative biometry of zebrafish retinal vasculature using optical coherence tomographic angiography. Biomed. Opt. Express 2018, 9, 1244–1255. [Google Scholar] [CrossRef] [Green Version]
- Lin, Y.; Xiang, X.; Chen, T.; Mao, G.; Deng, L.; Zeng, L.; Zhang, J. In vivo monitoring the dynamic process of acute retinal hemorrhage and repair in zebrafish with spectral-domain optical coherence tomography. J. Biophotonics 2019, 12, e201900235. [Google Scholar] [CrossRef]
- Toms, M.; Dubis, A.M.; Lim, W.S.; Webster, A.R.; Gorin, M.B.; Moosajee, M. Missense variants in the conserved transmembrane M2 protein domain of KCNJ13 associated with retinovascular changes in humans and zebrafish. Exp. Eye Res. 2019, 189, 107852. [Google Scholar] [CrossRef]
- Hu, D.; Cui, C.; Li, H.; Larson, K.E.; Tao, Y.K.; Oguz, I. LIFE: A Generalizable Autodidactic Pipeline for 3D OCT-A Vessel Segmentation. In International Conference on Medical Image Computing and Computer-Assisted Intervention; Springer: Cham, Switzerland, 2021; pp. 514–524. [Google Scholar] [CrossRef]
- Collery, R.F.; Volberding, P.J.; Bostrom, J.R.; Link, B.A.; Besharse, J.C. Loss of zebrafish Mfrp causes nanophthalmia, hyperopia, and accumulation of subretinal macrophages. Investig. Ophthalmol. Vis. Sci. 2016, 57, 6805–6814. [Google Scholar] [CrossRef]
- DiCicco, R.M.; Bell, B.A.; Kaul, C.; Hollyfield, J.G.; Anand-Apte, B.; Perkins, B.D.; Tao, Y.K.; Yuan, A. Retinal Regeneration Following OCT-Guided Laser Injury in Zebrafish. Investig. Opthalmology Vis. Sci. 2014, 55, 6281–6288. [Google Scholar] [CrossRef] [Green Version]
- Brandt, Z.J.; Collery, R.F.; Besharse, J.C.; Link, B.A. Ablation of mpeg+ Macrophages Exacerbates mfrp-Related Hyperopia. Investig. Opthalmology Vis. Sci. 2021, 62, 13. [Google Scholar] [CrossRef]
- Quint, W.H.; Tadema, K.C.D.; Crins, J.H.C.; Kokke, N.C.C.J.; Meester-Smoor, M.A.; Willemsen, R.; Klaver, C.C.W.; Iglesias, A.I. Zebrafish: An In Vivo Screening Model to Study Ocular Phenotypes. Transl. Vis. Sci. Technol. 2022, 11, 17. [Google Scholar] [CrossRef]
- Conedera, F.M.; Arendt, P.; Trepp, C.; Tschopp, M.; Enzmann, V. Müller Glia Cell Activation in a Laser-induced Retinal Degeneration and Regeneration Model in Zebrafish. J. Vis. Exp. 2017, e56249. [Google Scholar] [CrossRef]
- Conedera, F.M.; Pousa, A.M.Q.; Mercader, N.; Tschopp, M.; Enzmann, V. Retinal microglia signaling affects Müller cell behavior in the zebrafish following laser injury induction. Glia 2019, 67, 1150–1166. [Google Scholar] [CrossRef]
- Hammer, J.; Röppenack, P.; Yousuf, S.; Schnabel, C.; Weber, A.; Zöller, D.; Koch, E.; Hans, S.; Brand, M. Visual Function is Gradually Restored During Retina Regeneration in Adult Zebrafish. Front. Cell Dev. Biol. 2022, 9, 831322. [Google Scholar] [CrossRef]
- Toms, M.; Tracey-White, D.; Muhundhakumar, D.; Sprogyte, L.; Dubis, A.M.; Moosajee, M. Spectral Domain Optical Coherence Tomography: An In Vivo Imaging Protocol for Assessing Retinal Morphology in Adult Zebrafish. Zebrafish 2017, 14, 118–125. [Google Scholar] [CrossRef]
- Bell, B.A.; Yuan, A.; Dicicco, R.M.; Fogerty, J.; Lessieur, E.M.; Perkins, B.D. The adult zebrafish retina: In vivo optical sectioning with Confocal Scanning Laser Ophthalmoscopy and Spectral-Domain Optical Coherence Tomography. Exp. Eye Res. 2016, 153, 65–78. [Google Scholar] [CrossRef] [Green Version]
- Huckenpahler, A.L.; Wilk, M.A.; Cooper, R.F.; Moehring, F.; Link, B.A.; Carroll, J.; Collery, R.F. Imaging the adult zebrafish cone mosaic using optical coherence tomography. Vis. Neurosci. 2016, 33, E011. [Google Scholar] [CrossRef] [PubMed]
- Huckenpahler, A.; Wilk, M.; Link, B.; Carroll, J.; Collery, R. Repeatability and Reproducibility of In Vivo Cone Density Measurements in the Adult Zebrafish Retina. In Advances in Experimental Medicine and Biology; Springer: New York, NY, USA, 2018; Volume 1074, pp. 151–156. [Google Scholar] [CrossRef]
- Heur, M.; Jiao, S.; Schindler, S.; Crump, J.G. Regenerative potential of the zebrafish corneal endothelium. Exp. Eye Res. 2012, 106, 1–4. [Google Scholar] [CrossRef] [PubMed] [Green Version]
- Collery, R.F.; Veth, K.N.; Dubis, A.M.; Carroll, J.; Link, B.A. Rapid, Accurate, and Non-Invasive Measurement of Zebrafish Axial Length and Other Eye Dimensions Using SD-OCT Allows Longitudinal Analysis of Myopia and Emmetropization. PLoS ONE 2014, 9, e110699. [Google Scholar] [CrossRef] [PubMed] [Green Version]
- Bashirzade, A.A.; Zabegalov, K.N.; Volgin, A.D.; Belova, A.S.; Demin, K.A.; de Abreu, M.S.; Babchenko, V.Y.; Bashirzade, K.A.; Yenkoyan, K.B.; Tikhonova, M.A.; et al. Modeling neurodegenerative disorders in zebrafish. Neurosci. Biobehav. Rev. 2022, 138. [Google Scholar] [CrossRef] [PubMed]
- Wang, H.; Magnain, C.; Sakadžić, S.; Fischl, B.; Boas, D.A. Characterizing the optical properties of human brain tissue with high numerical aperture optical coherence tomography. Biomed. Opt. Express 2017, 8, 5617–5636. [Google Scholar] [CrossRef] [Green Version]
- Rao, K.D.; Alex, A.; Verma, Y.; Thampi, S.; Gupta, P.K. Real-time in vivo imaging of adult Zebrafish brain using optical coherence tomography. J. Biophotonics 2009, 2, 288–291. [Google Scholar] [CrossRef]
- Zhang, J.; Ge, W.; Yuan, Z. In vivo three-dimensional characterization of the adult zebrafish brain using a 1325 nm spectral-domain optical coherence tomography system with the 27 frame/s video rate. Biomed. Opt. Express 2015, 6, 3932–3940. [Google Scholar] [CrossRef] [Green Version]
- Lin, Y.; Chen, T.; Mao, G.; Qiu, T.; Lan, Y.; Xiang, X.; Huang, J.; Huang, J.; Lu, T.; Gan, S.; et al. Long-term and in vivo assessment of Aβ protein-induced brain atrophy in a zebrafish model by optical coherence tomography. J. Biophotonics 2020, 13, e202000067. [Google Scholar] [CrossRef]
- Lin, Y.-S.; Chu, C.-C.; Tsui, P.-H.; Chang, C.-C. Evaluation of zebrafish brain development using optical coherence tomography. J. Biophotonics 2012, 6, 668–678. [Google Scholar] [CrossRef]
- Gibbs, H.C.; Bai, Y.; Lekven, A.C.; Yeh, A.T. Imaging embryonic development with ultrashort pulse microscopy. Opt. Eng. 2013, 53, 051506. [Google Scholar] [CrossRef]
- Lin, Y.; Xiang, X.; Chen, T.; Gao, C.; Fu, H.; Wang, L.; Deng, L.; Zeng, L.; Zhang, J. In vivo monitoring and high-resolution characterizing of the prednisolone-induced osteoporotic process on adult zebrafish by optical coherence tomography. Biomed. Opt. Express 2019, 10, 1184–1195. [Google Scholar] [CrossRef]
- Xiang, X.; Gao, W.; Xu, Y.; Zhang, Y.; Lu, T.; Gan, S.; Huang, J.; Li, Z.; Huang, L.; Liao, Y.; et al. Study on promoting regeneration of zebrafish skull by phycocyanin characterized by in vivo optical coherence tomography. J. Biophotonics 2022, 15, e202100333. [Google Scholar] [CrossRef]
- Gibbs, H.C.; Dodson, C.R.; Bai, Y.; Lekven, A.C.; Yeh, A.T. Combined lineage mapping and gene expression profiling of embryonic brain patterning using ultrashort pulse microscopy and image registration. J. Biomed. Opt. 2014, 19, 126016. [Google Scholar] [CrossRef]
- Rossignoli, P.; Santagiustina, M.; Tiso, N.; Grisan, E.; Autizi, E.; Palmieri, L. Polarization Sensitive Optical Coherence Tomography for Zebrafish Imaging. In IET Conference Publications; Institution of Engineering and Technology: London, UK, 2015; Volume 2015. [Google Scholar] [CrossRef]
- Yang, D.; Hu, M.; Zhang, M.; Liang, Y. High-resolution polarization-sensitive optical coherence tomography for zebrafish muscle imaging. Biomed. Opt. Express 2020, 11, 5618–5632. [Google Scholar] [CrossRef]
- Yang, D.; Yuan, Z.; Yang, Z.; Hu, M.; Liang, Y. High-resolution polarization-sensitive optical coherence tomography and optical coherence tomography angiography for zebrafish skin imaging. J. Innov. Opt. Heal. Sci. 2021, 14, 1–14. [Google Scholar] [CrossRef]
- Yang, D.; Yuan, Z.; Hu, M.; Liang, Y. Zebrafish brain and skull imaging based on polarization-sensitive optical coherence tomography. J. Biophotonics 2022, 2022, e202200112. [Google Scholar] [CrossRef]
- Lichtenegger, A.; Mukherjee, P.; Zhu, L.; Morishita, R.; Tomita, K.; Oida, D.; Leskovar, K.; El-Sadek, I.A.; Makita, S.; Kirchberger, S.; et al. Non-destructive characterization of adult zebrafish models using Jones matrix optical coherence tomography. Biomed. Opt. Express 2022, 13, 2202. [Google Scholar] [CrossRef]
- Lichtenegger, A.; Tamaoki, J.; Licandro, R.; Mori, T.; Mukherjee, P.; Bian, L.; Greutter, L.; Makita, S.; Wöhrer, A.; Matsusaka, S.; et al. Longitudinal investigation of a xenograft tumor zebrafish model using polarization-sensitive optical coherence tomography. Sci. Rep. 2022, 12, 1–13. [Google Scholar] [CrossRef]
- Zhu, L.; Makita, S.; Oida, D.; Miyazawa, A.; Oikawa, K.; Mukherjee, P.; Lichtenegger, A.; Distel, M.; Yasuno, Y. Computational refocusing of Jones matrix polarization-sensitive optical coherence tomography and investigation of defocus-induced polarization artifacts. Biomed. Opt. Express 2022, 13, 2975. [Google Scholar] [CrossRef]
- Li, K.; Wang, Y.; Liu, Y.; Li, W.; Weng, Z.; Li, H.; He, Y.; Li, Z. Morphological characteristics of zebrafish’s yolk sac for malformation based on orthogonal-polarization-gating optical coherence tomography. J. Biophotonics 2022, 15, e202200098. [Google Scholar] [CrossRef]
- Liu, M.; Schmitner, N.; Sandrian, M.G.; Zabihian, B.; Hermann, B.; Salvenmoser, W.; Meyer, D.; Drexler, W. In vivo three dimensional dual wavelength photoacoustic tomography imaging of the far red fluorescent protein E2-Crimson expressed in adult zebrafish. Biomed. Opt. Express 2013, 4, 1846–1855. [Google Scholar] [CrossRef] [PubMed] [Green Version]
- Haindl, R.; Preisser, S.; Andreana, M.; Rohringer, W.; Sturtzel, C.; Distel, M.; Chen, Z.; Rank, E.; Fischer, B.; Drexler, W.; et al. Dual modality reflection mode optical coherence and photoacoustic microscopy using an akinetic sensor. Opt. Lett. 2017, 42, 4319–4322. [Google Scholar] [CrossRef] [PubMed]
- Deng, S.; Haindl, R.; Zhang, E.; Beard, P.; Scheuringer, E.; Sturtzel, C.; Li, Q.; Deloria, A.J.; Sattmann, H.; Leitgeb, R.A.; et al. An optical coherence photoacoustic microscopy system using a fiber optic sensor. APL Photonics 2021, 6, 096103. [Google Scholar] [CrossRef]
- Kim, W.; Applegate, B.E. In vivo molecular contrast OCT imaging of methylene blue. Opt. Lett. 2015, 40, 1426–1429. [Google Scholar] [CrossRef] [PubMed]
- Zhang, J.; Liu, J.; Wang, L.-M.; Li, Z.-Y.; Yuan, Z. Retroreflective-type Janus microspheres as a novel contrast agent for enhanced optical coherence tomography. J. Biophotonics 2016, 10, 878–886. [Google Scholar] [CrossRef] [PubMed]
- Ma, Z.; Liu, X.; Yin, B.; Zhao, Y.; Liu, J.; Yu, Y.; Wang, Y. Common-path-based device for magnetomotive OCT noise reduction. Appl. Opt. 2020, 59, 1431–1437. [Google Scholar] [CrossRef]
- Tan, W.; Oldenburg, A.L.; Norman, J.J.; Desai, T.A.; Boppart, S.A. Optical coherence tomography of cell dynamics in three-dimensional tissue models. Opt. Express 2006, 14, 7159–7171. [Google Scholar] [CrossRef]
- Jeong, K.; Turek, J.J.; Nolte, D.D. Volumetric motility-contrast imaging of tissue response to cytoskeletal anti-cancer drugs. Opt. Express 2007, 15, 14057–14064. [Google Scholar] [CrossRef]
- Scholler, J.; Groux, K.; Goureau, O.; Sahel, J.-A.; Fink, M.; Reichman, S.; Boccara, C.; Grieve, K. Dynamic full-field optical coherence tomography: 3D live-imaging of retinal organoids. Light. Sci. Appl. 2020, 9, 1–9. [Google Scholar] [CrossRef]
- Thouvenin, O.; Apelian, C.; Nahas, A.; Fink, M.; Boccara, C. Full-Field Optical Coherence Tomography as a Diagnosis Tool: Recent Progress with Multimodal Imaging. Appl. Sci. 2017, 7, 236. [Google Scholar] [CrossRef]
- Münter, M.; Pieper, M.; Kohlfaerber, T.; Bodebstorfer, E.; Ahrens, M.; Winter, C.; Huber, R.; König, P.; Hüttmann, G.; Schulz-Hildebrandt, H.; et al. Microscopic optical coherence tomography (mOCT) at 600 kHz for 4D volumetric imaging and dynamic contrast. Biomed. Opt. Express 2021, 12, 6024–6039. [Google Scholar] [CrossRef]
- Fujimoto, J.G.; Schmitt, J.; Swanson, E.; Aguirre, A.D.; Jang, I.-K. The Development of Optical Coherence Tomography. In Cardiovascular OCT Imaging; Springer International Publishing: Cham, Switzerland, 2020; pp. 1–23. [Google Scholar]
- Larin, K.V.; Sampson, D.D. Optical coherence elastography—OCT at work in tissue biomechanics [Invited]. Biomed. Opt. Express 2017, 8, 1172–1202. [Google Scholar] [CrossRef] [Green Version]
- Tsai, C.-Y.; Shih, C.-H.; Chu, H.-S.; Hsieh, Y.-T.; Huang, S.-L.; Chen, W.-L. Submicron spatial resolution optical coherence tomography for visualising the 3D structures of cells cultivated in complex culture systems. Sci. Rep. 2021, 11, 1–12. [Google Scholar] [CrossRef]
- Cassar, S.; Adatto, I.; Freeman, J.L.; Gamse, J.T.; Iturria, I.; Lawrence, C.; Muriana, A.; Peterson, R.T.; Van Cruchten, S.; Zon, L.I. Use of Zebrafish in Drug Discovery Toxicology. Chem. Res. Toxicol. 2020, 33, 95–118. [Google Scholar] [CrossRef] [PubMed] [Green Version]
- Patton, E.E.; Zon, L.I.; Langenau, D.M. Zebrafish disease models in drug discovery: From preclinical modelling to clinical trials. Nat. Rev. Drug Discov. 2021, 20, 611–628. [Google Scholar] [CrossRef]
- Fazio, M.; Ablain, J.; Chuan, Y.; Langenau, D.M.; Zon, L.I. Zebrafish patient avatars in cancer biology and precision cancer therapy. Nat. Rev. Cancer 2020, 20, 263–273. [Google Scholar] [CrossRef]
- Huang, D.; Swanson, E.A.; Lin, C.P.; Schuman, J.S.; Stinson, W.G.; Chang, W.; Hee, M.R.; Flotte, T.; Gregory, K.; Puliafito, C.A.; et al. Optical coherence tomography. Science 1991, 254, 1178–1181. [Google Scholar] [CrossRef] [Green Version]
- Leitgeb, R.; Hitzenberger, C.; Fercher, A. Performance of fourier domain vs time domain optical coherence tomography. Opt. Express 2003, 11, 889. [Google Scholar] [CrossRef]
- Popescu, D.P.; Choo-Smith, L.P.; Flueraru, C.; Mao, Y.; Chang, S.; Disano, J.; Sherif, S.; Sowa, M.G. Optical coherence tomography: Fundamental principles, instrumental designs and biomedical applications. Biophys. Rev. 2011, 3, 155–169. [Google Scholar] [CrossRef]
- Klein, T.; Neubauer, A.; Huber, R.; Wieser, W.; Reznicek, L.; Kampik, A. Multi-MHz retinal OCT. Biomed. Opt. Express 2013, 4, 1890–1908. [Google Scholar] [CrossRef]


| Imaging Technique | Resolution | Depth Range | Contrast | Label-Free | Costs |
|---|---|---|---|---|---|
| Positron emission tomography | mm-range | Whole adult fish | Radiation | No | High |
| Magnetic resonance imaging | μm/mm-range | Whole adult fish | Magnetic field | Yes | High |
| Computed tomography | μm/mm-range | Whole adult fish | Radiation | Yes | High |
| Photoacoustic imaging | 10–100 μm | mm-range | Light/photoacoustic waves | Yes | High/Moderate low |
| Optical coherence tomography | 1–10 μm | mm-range | Light | Yes | Moderate low |
| Fluorescence microscopy techniques | >200 nm | Hundreds of μm in unprocessed samples | Light | No | Low/ Moderate low |
| White-light microscopy | >200 nm | Surface imaging | Light | No | Low |
Disclaimer/Publisher’s Note: The statements, opinions and data contained in all publications are solely those of the individual author(s) and contributor(s) and not of MDPI and/or the editor(s). MDPI and/or the editor(s) disclaim responsibility for any injury to people or property resulting from any ideas, methods, instructions or products referred to in the content. |
© 2022 by the authors. Licensee MDPI, Basel, Switzerland. This article is an open access article distributed under the terms and conditions of the Creative Commons Attribution (CC BY) license (https://creativecommons.org/licenses/by/4.0/).
Share and Cite
Lichtenegger, A.; Baumann, B.; Yasuno, Y. Optical Coherence Tomography Is a Promising Tool for Zebrafish-Based Research—A Review. Bioengineering 2023, 10, 5. https://doi.org/10.3390/bioengineering10010005
Lichtenegger A, Baumann B, Yasuno Y. Optical Coherence Tomography Is a Promising Tool for Zebrafish-Based Research—A Review. Bioengineering. 2023; 10(1):5. https://doi.org/10.3390/bioengineering10010005
Chicago/Turabian StyleLichtenegger, Antonia, Bernhard Baumann, and Yoshiaki Yasuno. 2023. "Optical Coherence Tomography Is a Promising Tool for Zebrafish-Based Research—A Review" Bioengineering 10, no. 1: 5. https://doi.org/10.3390/bioengineering10010005