Article

Flood Exposure of Residential Areas and Infrastructure in Greece

by
Stefanos Stefanidis
1,*,
Vasileios Alexandridis
2 and
Theodora Theodoridou
3
1
Laboratory of Mountainous Water Management and Control, School of Forestry and Natural Environment, Aristotle University of Thessaloniki, 54124 Thessaloniki, Greece
2
Independent Researcher, 54621 Thessaloniki, Greece
3
School of Spatial Planning and Development, Faculty of Engineering, Aristotle University of Thessaloniki, 54124 Thessaloniki, Greece
*
Author to whom correspondence should be addressed.
Hydrology 2022, 9(8), 145; https://doi.org/10.3390/hydrology9080145
Submission received: 21 July 2022 / Revised: 11 August 2022 / Accepted: 12 August 2022 / Published: 13 August 2022
(This article belongs to the Special Issue Modern Developments in Flood Modelling)

Abstract

:
Worldwide, floods are the most common and widespread type of disaster during the 21st century. These phenomena have caused human fatalities, destruction of infrastructures and properties, and other significant impacts associated with human socioeconomic activities. In this study, the exposure of infrastructure (social, industrial and commercial, transportation) and residential areas to floods in Greek territory was considered. To accomplish the goal of the current study, freely available data from OpenStreetMap and Corine 2018 databases were collected and analyzed, as well as the flood extent zones derived under the implementation of the European Union’s (EU) Floods Directive. The results will be useful for policy-making and prioritization of prone areas based not only on the extent of flood cover but also on the possible affected infrastructure types. Moreover, the aforementioned analysis could be the first step toward an integrated national-wide flood risk assessment.

1. Introduction

Floods are the most common type of natural disaster with devastating effects on local communities and infrastructure [1,2,3,4]. They can induce fatalities [5], major economic damage [6], and considerable effects on socioeconomic activities [7,8]. Thus, reliable flood risk assessment and resilience design of cities is a key priority for sustainable development. Despite the improvements in flood mitigation measures and technological advancements, floods continue to endanger human lives [9]. This is mainly due to the increasing human settlements and economic assets in floodplains, land-use change, and climate crisis [10,11].
The Sixth Assessment Report of the Intergovernmental Panel on Climate Change (IPCC) highlighted that extreme precipitation events will become more frequent in the near-future period over Europe [12]. Additionally, the natural water retention by land use is expected to decrease according to the forecasts of future urban land expansion [13]. Therefore, an increase in the likelihood and negative impacts of flood events is foreseen.
Floods are natural phenomena that cannot be prevented. Nevertheless, it is feasible and desirable to reduce their adverse outcomes, especially near residential areas and critical infrastructure. The costly floods that occurred at the beginning of the 21st century across Europe prompted the European Parliament to establish a Directive (2007/60/EC) on flood risk management. In the framework of this directive, the European Union (EU) Member States conducted flood risk management plans focused on the protection, prevention, and preparedness against flooding. Therefore, national-scale flood hazard maps were created, for different return period scenarios, by coupling hydrological and hydraulic modeling. Such maps provide crucial spatial information for flood risk assessment [14].
Several studies have been conducted on various aspects of floods. The majority of scholars look into post-flash flood analysis in terms of hydrological modeling and inundation mapping [15,16,17,18,19]. Nowadays, the use of Unmanned Aerial Vehicle (UAV) has been widely used as an alternative for post-flood surveys and data collection [20,21]. Moreover, the advantages of numerical weather prediction (NWP) models and rainfall radar were exploited, and flood forecasting and nowcasting approaches were developed [22,23,24]. Furthermore, numerous researchers have applied multi-criteria analysis (MCA) and machine learning (ML) techniques to provide flood susceptibility maps [25,26,27,28].
To the best of the author’s knowledge, flood exposure analysis has garnered much global attention. However, flood exposure assessments of infrastructures are rare and focused on specific regions [29]. Large-scale approaches have been performed mainly in the United States [4,30], whereas, in Europe, the majority of the studies are focused on transportation networks. [3,31,32].
This study investigates the flood exposure of residential areas and infrastructure in Greece by combining open-access data with geospatial analysis. The proposed approach has the benefits of using easily accessible data, as well as simple and timeless GIS analysis for flood exposure assessment. Despite growing interest from academics and government agencies, this is the first quantitative nationwide assessment in the country. The outcomes provide insights for identifying areas where flood risk reduction should be prioritized. The methodology developed herein is easily transferable to other EU member states and can be scaled to a pan-European level.

2. Materials and Methods
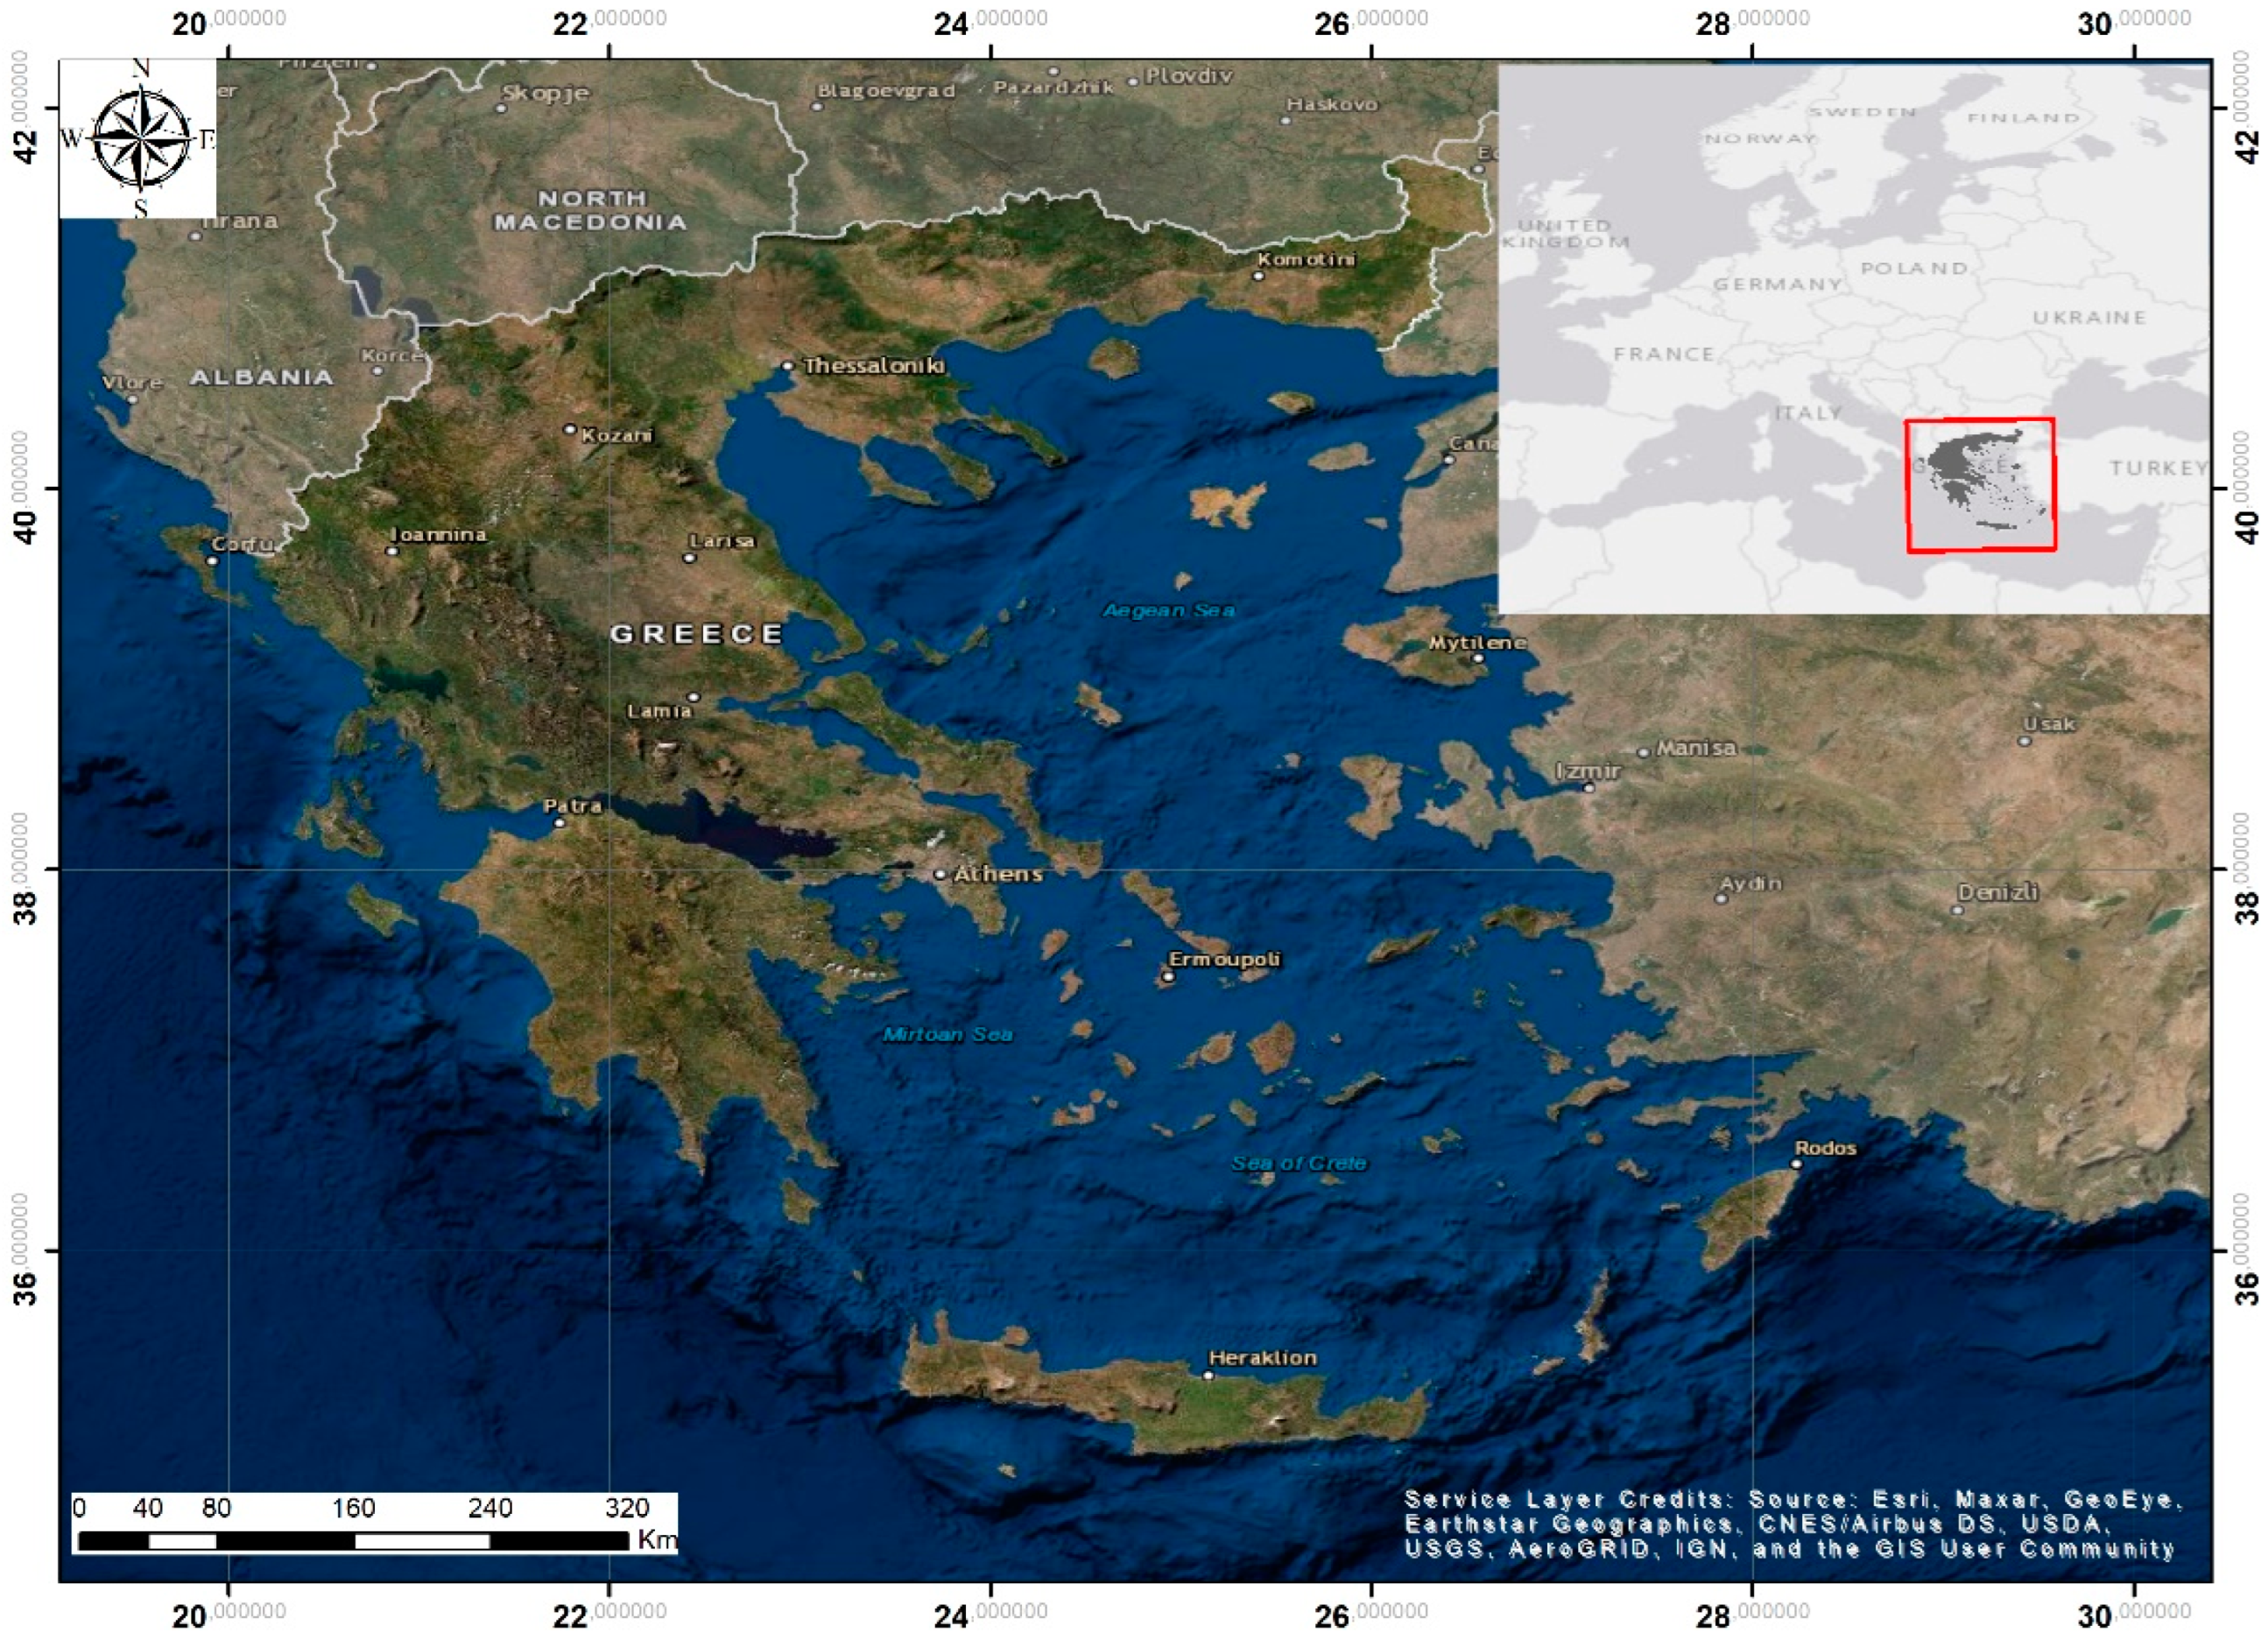
2.1. Study Area

Greece is one of the EU’s 27 member countries. It is located at the southern edge of the Balkan Peninsula (Southeast Europe), at the crossroads of Europe, Asia, and Africa, and shares borders with Albania to the northwest, Northern Macedonia, and Bulgaria to the north, and Turkey to the northeast. The Aegean Sea lies to the east of the mainland, the Ionian Sea to the west, and the Sea of Crete and the Mediterranean Sea to the south (Figure 1).
The country covers an area of approximately 132,000 km2 and has a population of almost 10.7 million. It has a complex terrain, a highly diverse landscape, and the longest coastline in the Mediterranean (13,676 km), featuring numerous islands. According to the Köppen–Geiger climate classification, the climate is predominantly the temperate Mediterranean, with large areas of northern Greece classified as semi-arid and fewer regions, mostly at higher elevations, classified as humid continental [33]. However, due to the country’s orography and climate type, precipitation over Greece presents great spatial and temporal variability. The precipitation pattern has significant seasonality, with the rainy season occurring in the fall, winter, and early spring and the dry season occurring throughout the summer months [34,35]. The Pindus Mountain range, which runs from northwest to southwest of the country, mainly affects the spatial variability of precipitation, and two distinct precipitation zones are determined. These are the wet zone to the west and the dry zone to the east [36]. Despite the fact that in the western part of Greece the highest amount of rainfall is recorded, most floods occur in the eastern part due to the proximity of urbanized areas to ephemeral torrential streams [37]. Also, the monthly distribution of flood events showed that November is the month with the richest flood records, followed by October [37].

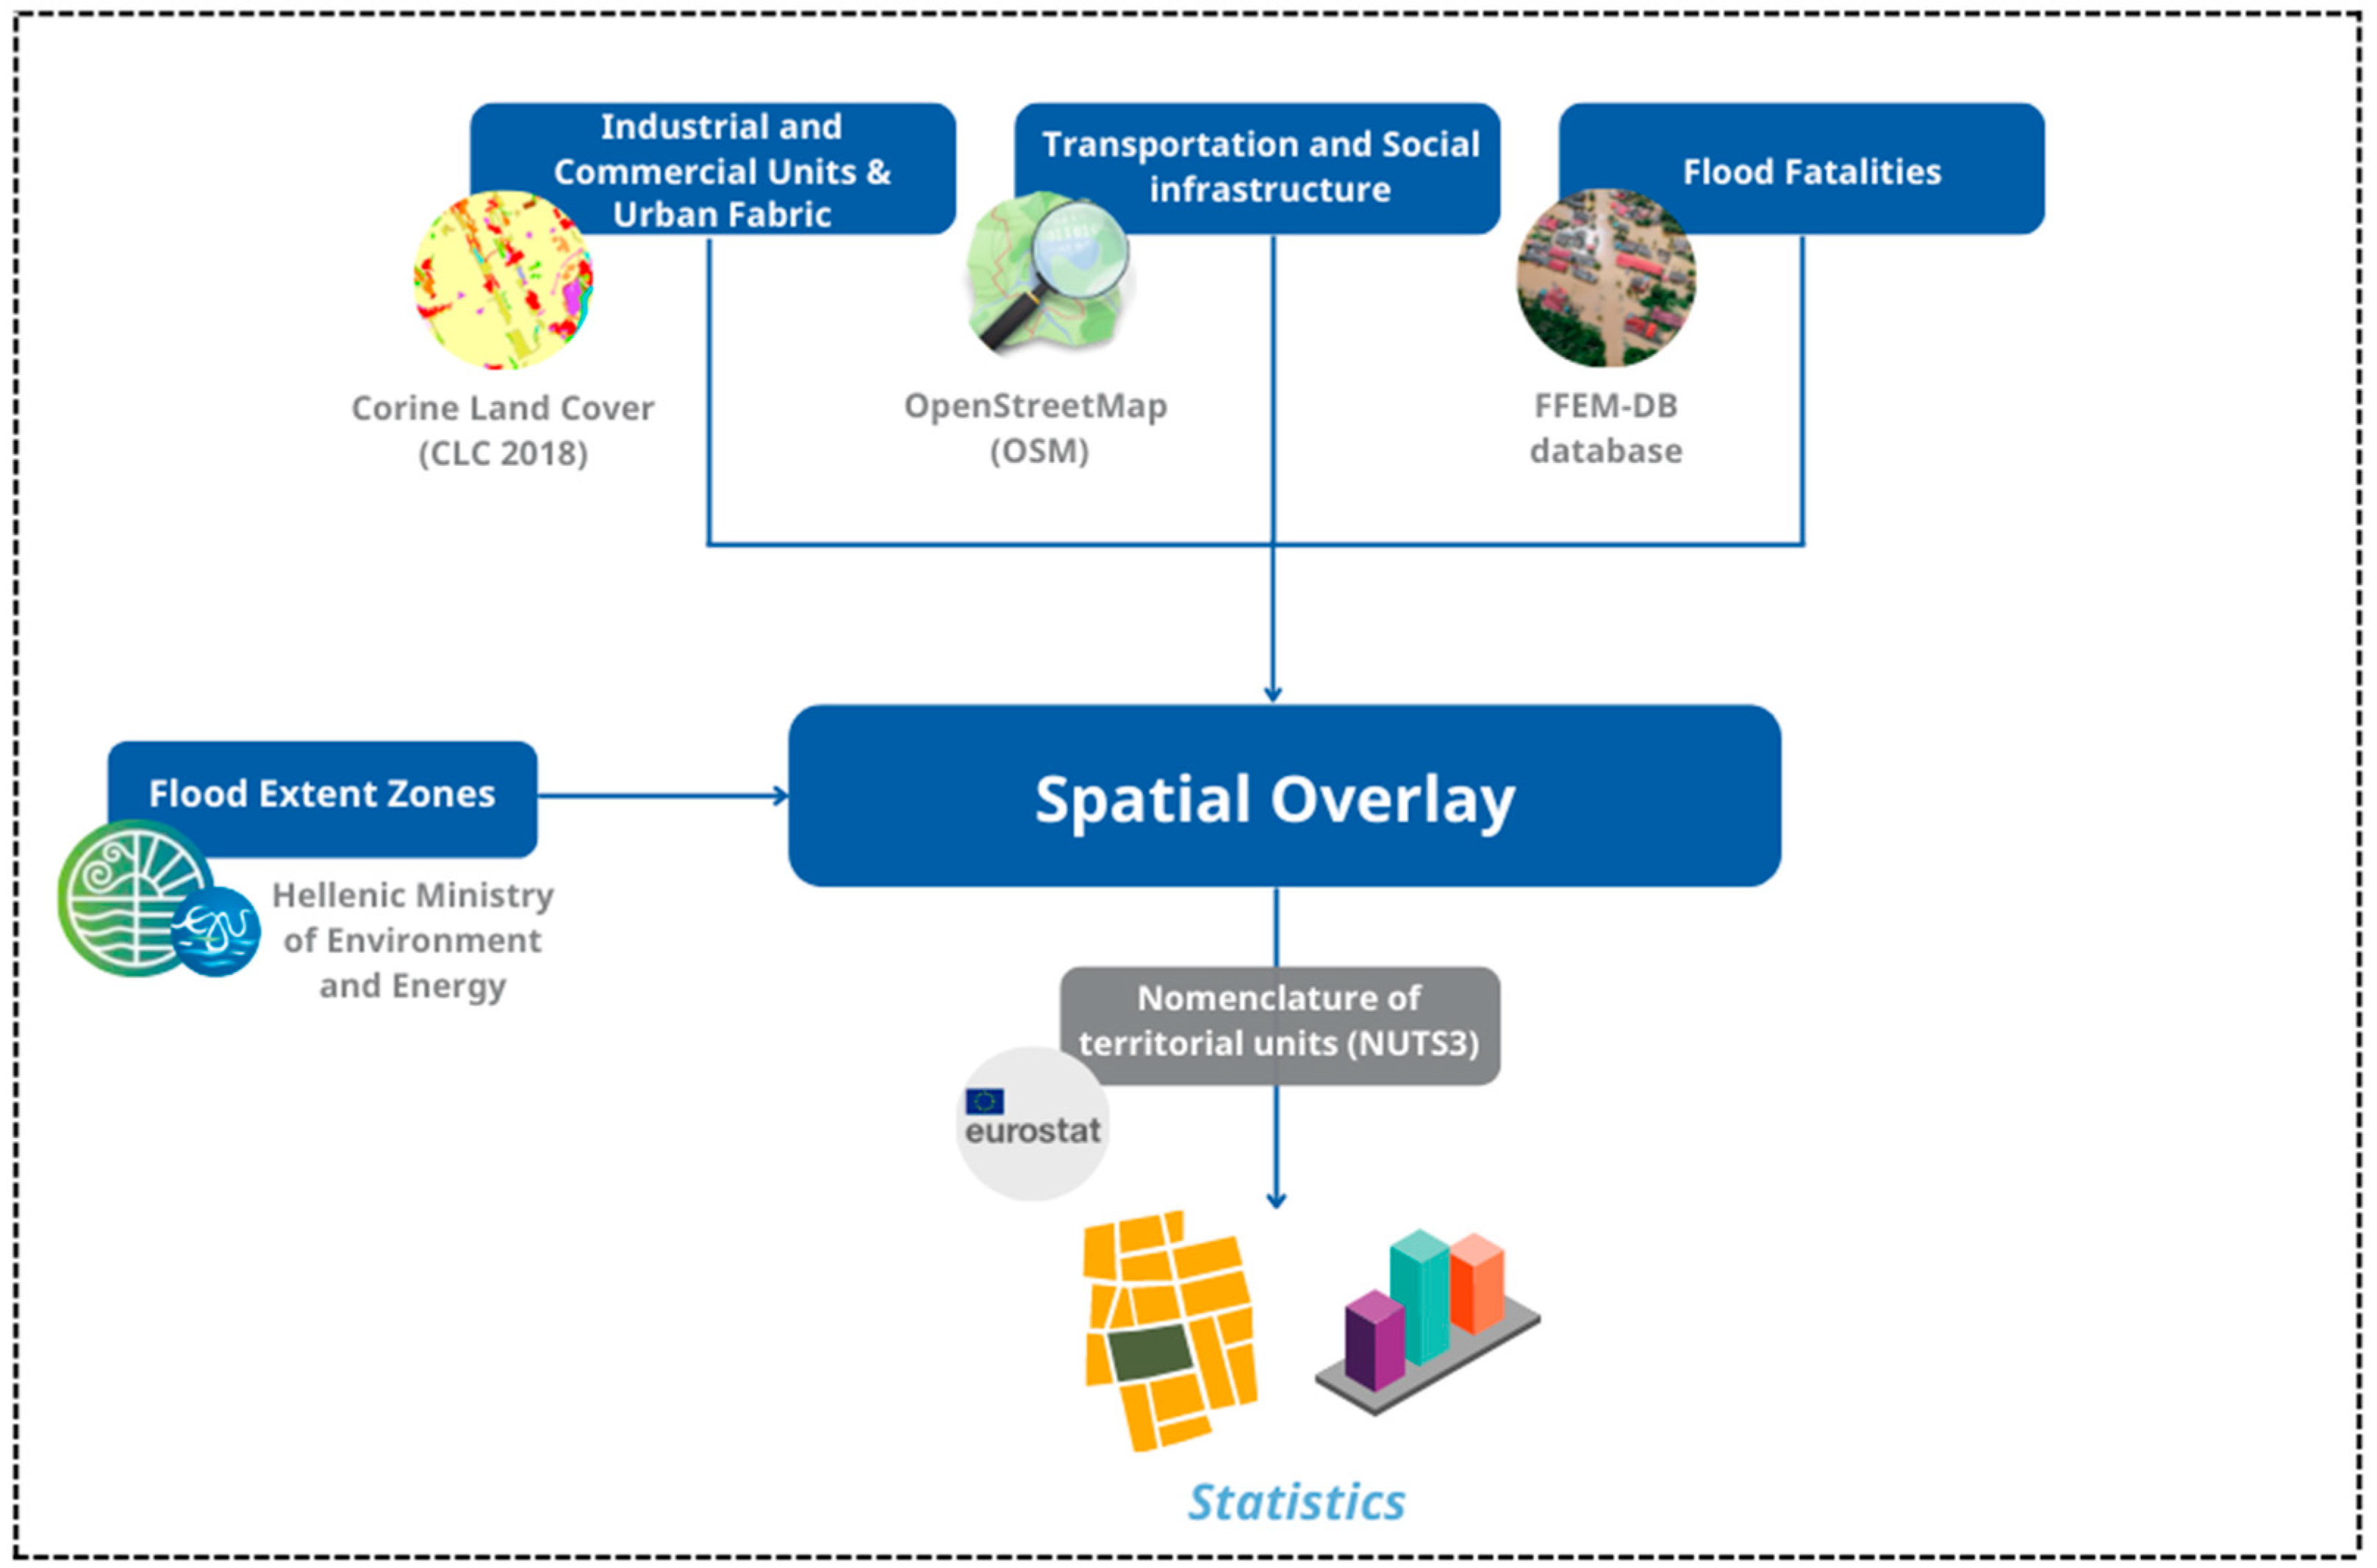
2.2. Geospatial Analysis and Datasets

Flood exposure refers to valuable societal elements (such as people, infrastructure, etc.) located in floodplains [38]. The most common method is the spatial overlay between the flood hazard zones and assets. Spatial analysis of flood exposure presupposes the availability of geospatial data for assets and well-established flood hazard zones. This challenge is particularly addressed for national exposure analysis.
For the study’s needs, various datasets were collected and processed. These datasets included residential areas, infrastructure, records of flood fatalities, and flood inundation maps. All the above datasets were organized in GIS thematic layers using the ArcGIS (v.10.7) software package. The outline of the methodology is presented in the following figure (Figure 2).
Based on the Corine Land Cover (CLC 2018) dataset, the urban fabric (CLC codes: 1.1.1. & 1.1.2) and industrial and commercial units (CLC code: 1.2.1) were determined. The transportation infrastructure was extracted from the OpenStreetMap (OSM) dataset considering the major road types (motorway, trunk, primary and secondary roads) as well as the railway network. These features are nearly complete in OSM, since most European countries have more than 95% of their roads and railways mapped [39]. Additionally, OSM crowdsourced data is used to identify social infrastructure such as physical facilities and spaces where the community can access social services. These include health-care services, education and training, social housing programs, police, courts, and other systems for justice and public safety, as well as arts, cultural, and recreational facilities. To that end, the following vector data were exported and grouped: schools, universities, colleges, kindergartens, hospitals and clinics, nursing homes, community centers, sports centers, stadiums, campsites, archeological sites, monuments, art centers, theaters, museums, police and fire stations, court houses, airports and ports, and wastewater plants. Flood fatalities are analyzed by taking into account a recently developed dataset (FFEM-DB) for the Euro-Mediterranean region, covering the 1980–2020 period [40]. The flood hazard is represented by flood extent zones created as part of the implementation of the EU flood directive (2007/60/ EC) and the associate flood risk management plans. These maps are accessible through the Hellenic Ministry of Environment and Energy (Special Secretary for Water). The dataset includes three inundation depth maps corresponding to flood return periods of 50, 100, and 1000 years. In this analysis, the flood extent zones related to the probability of flood occurrence once 1 in 100 years were selected, as it is compatible with the national guidance on the design return period of flood defenses. Afterward, the Nomenclature of Territorial Units for Statistics Level 3 (NUTS 3) established by Eurostat was used for the comparative analysis of the results. A summary of the aforementioned datasets and their sources are presented in the following table (Table 1).
Analyzing flood exposure, the ratio of residential areas and infrastructure located in flood zones was estimated, considering the area of the urban fabric and industrial and commercial units, the length of transportation infrastructure, and the amount of social infrastructure.

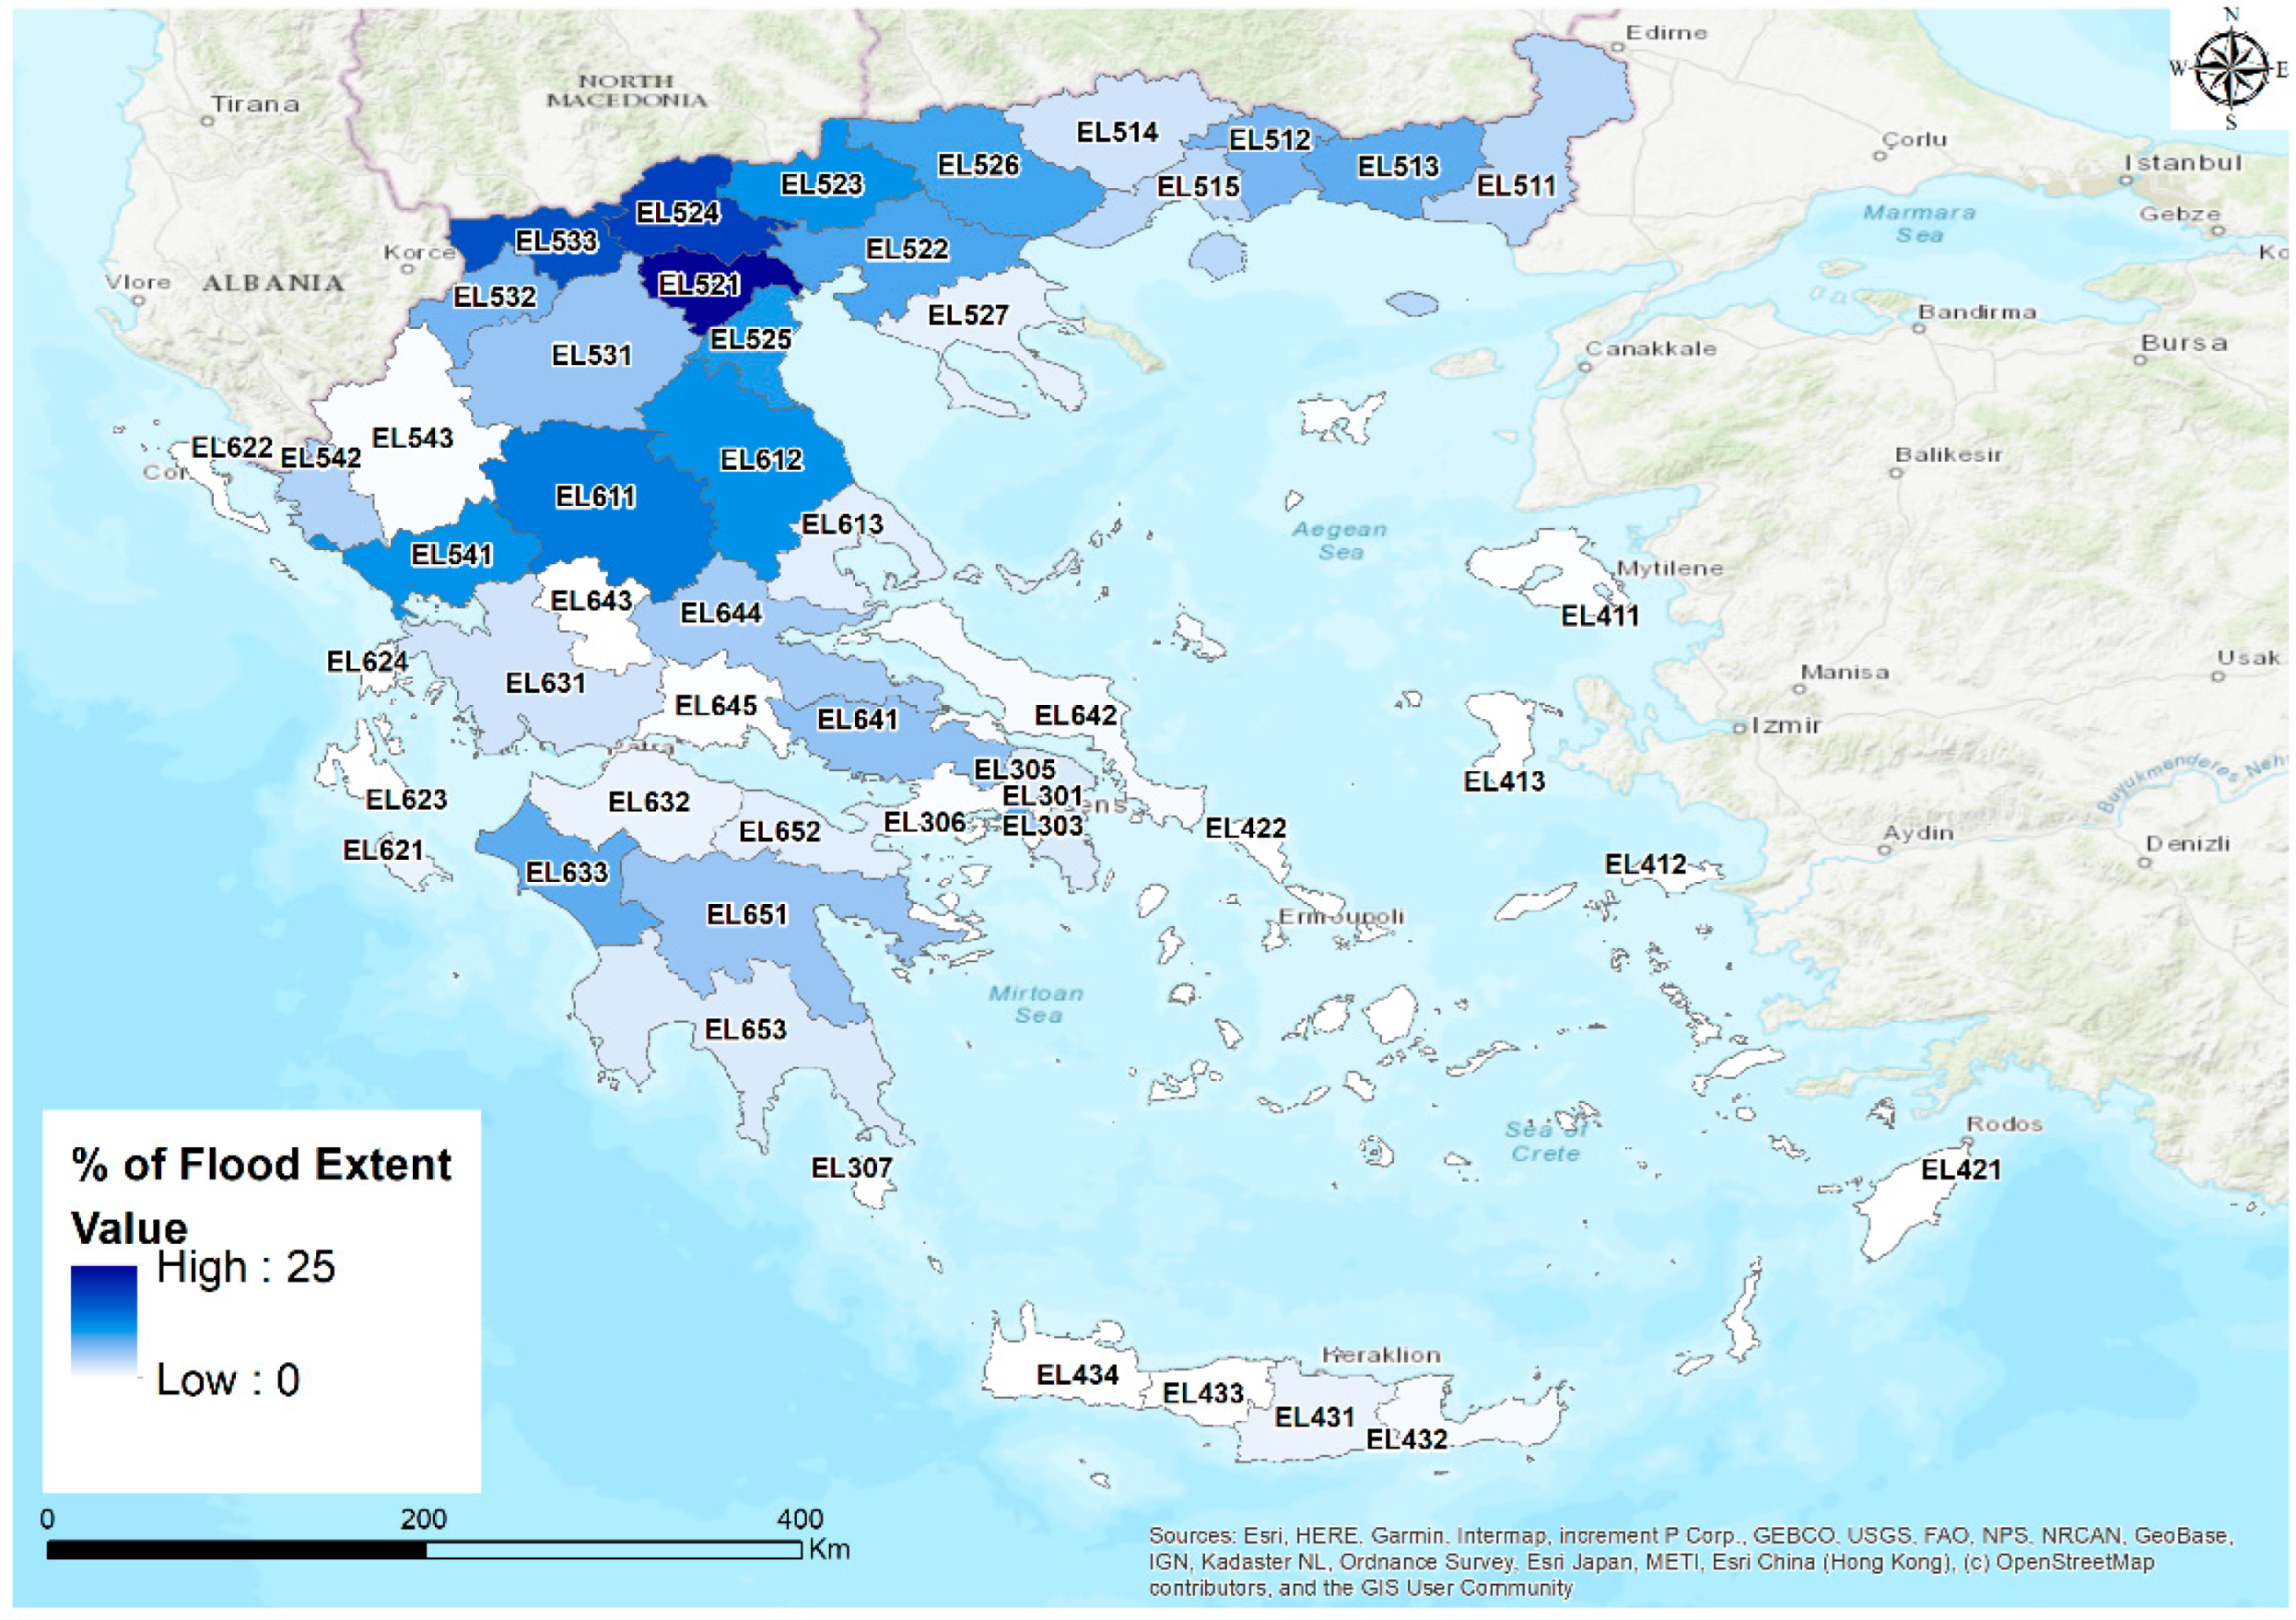
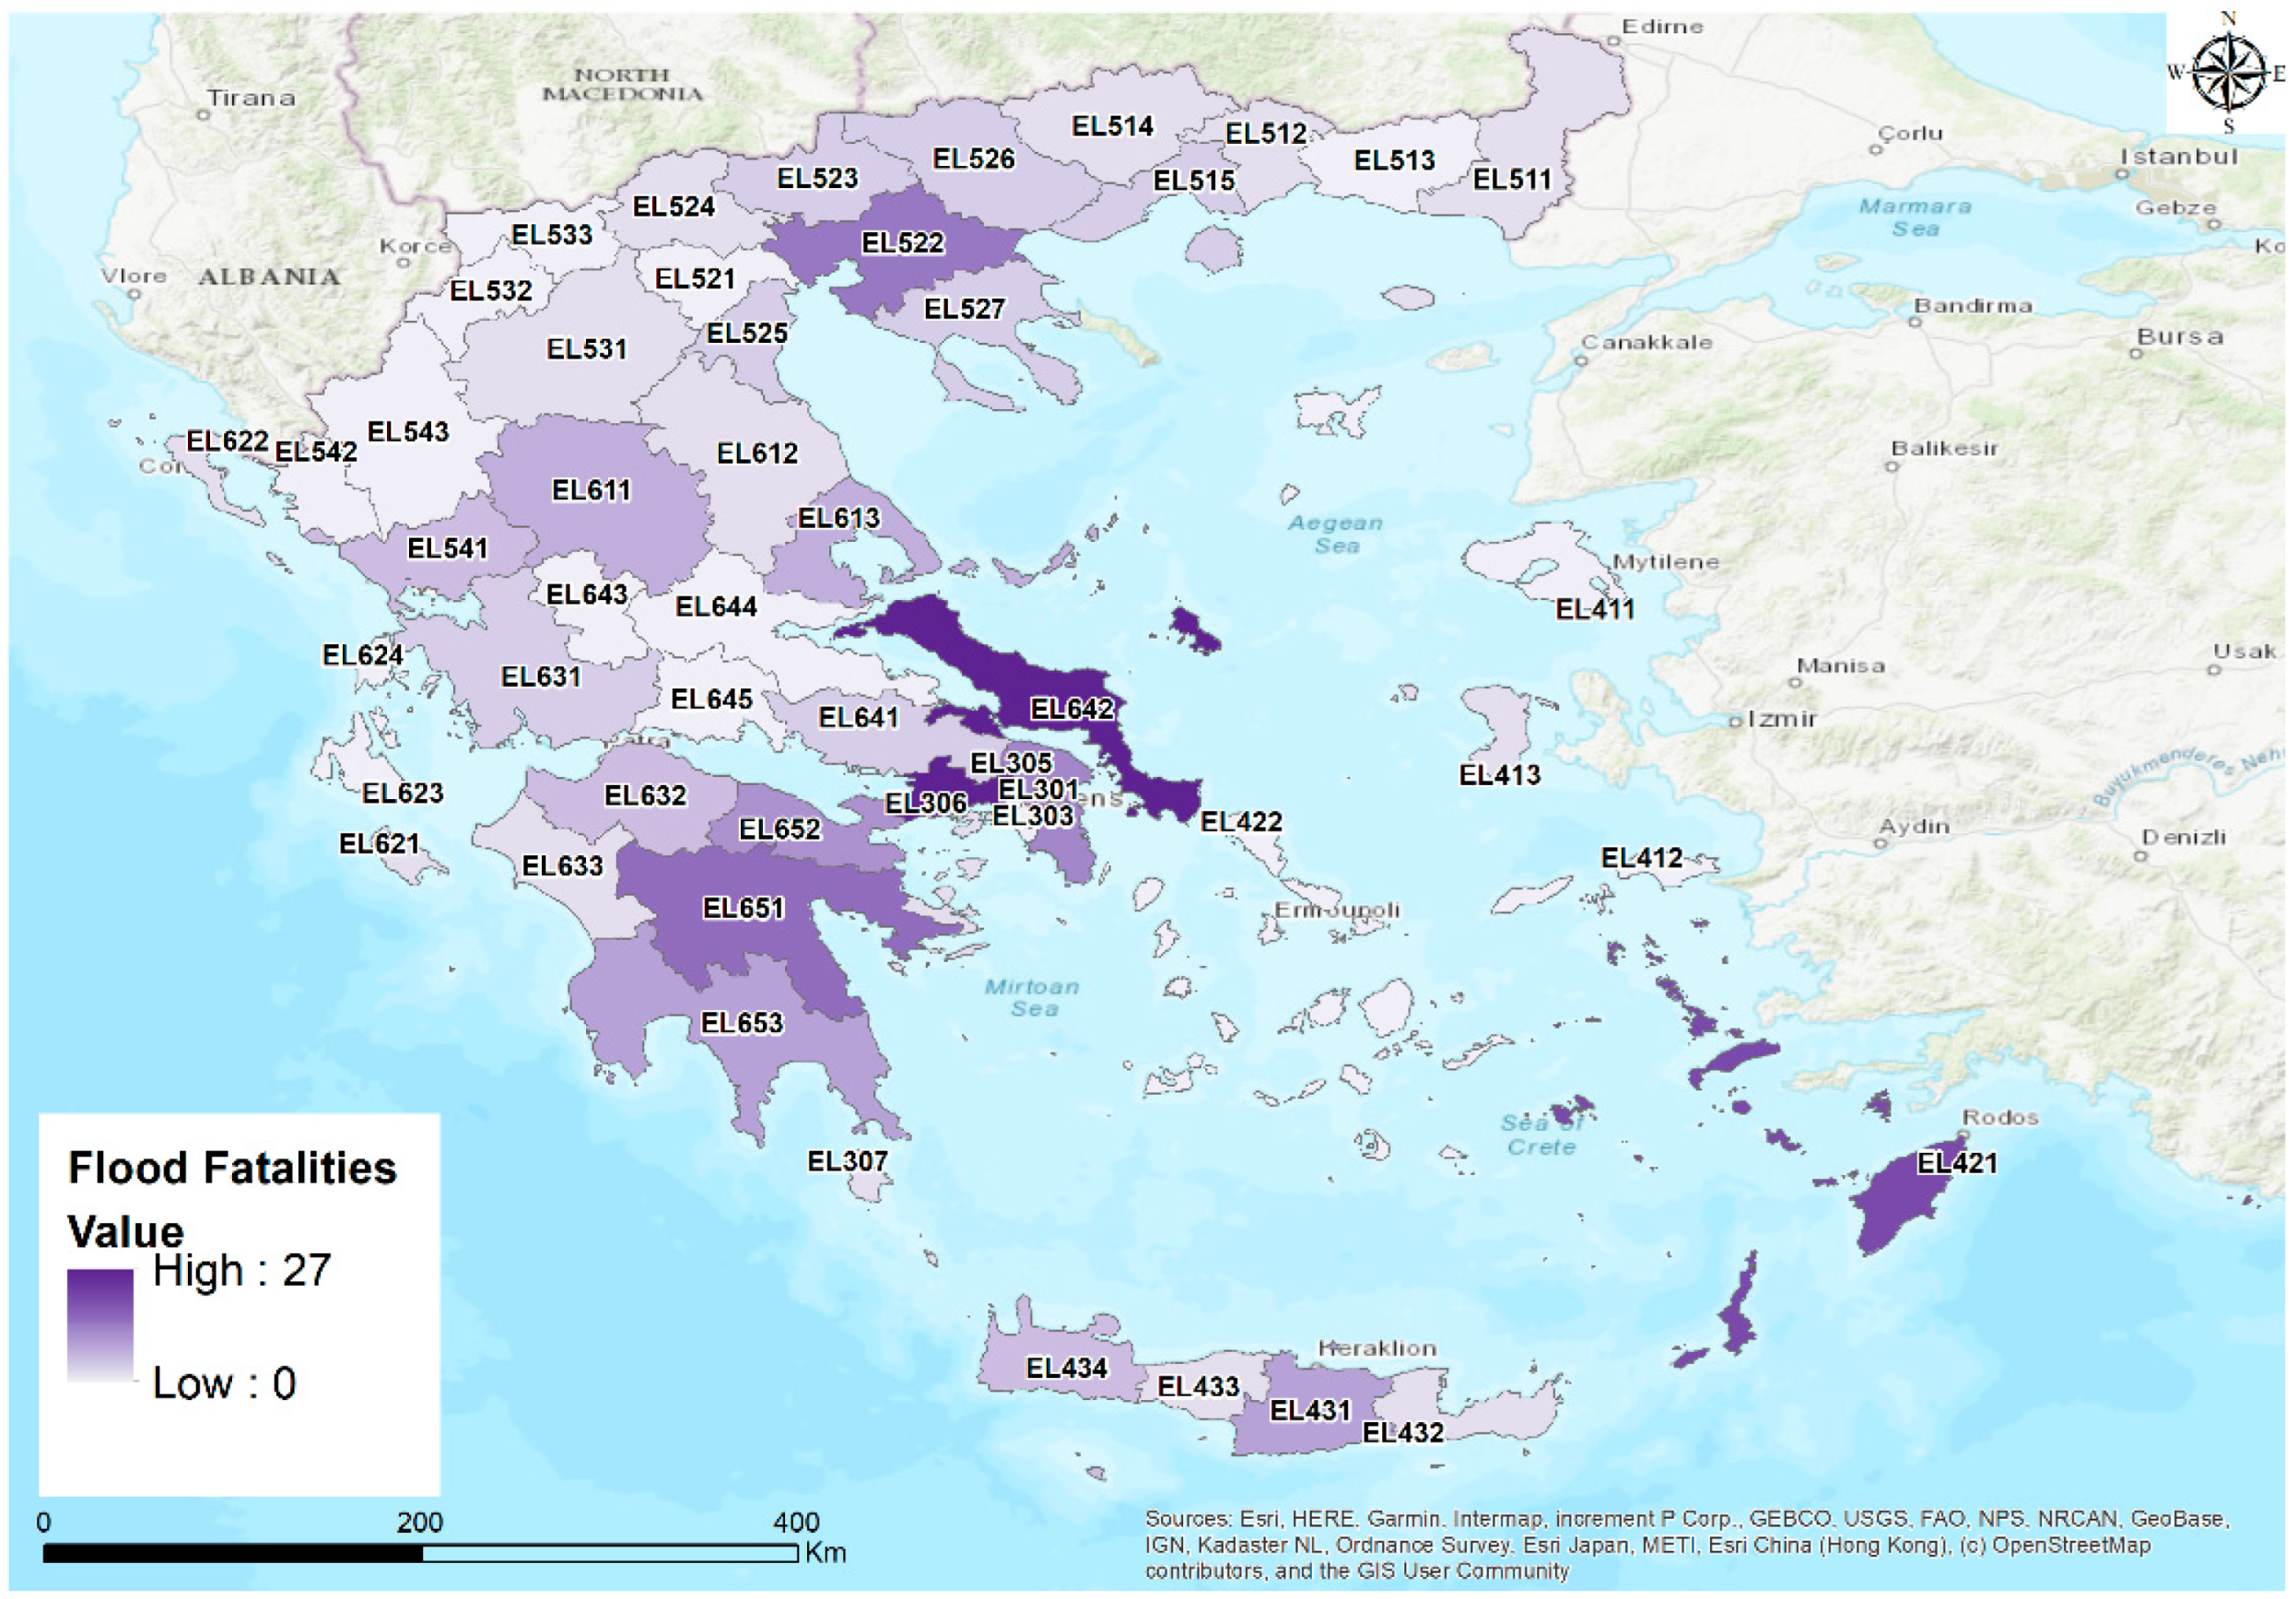
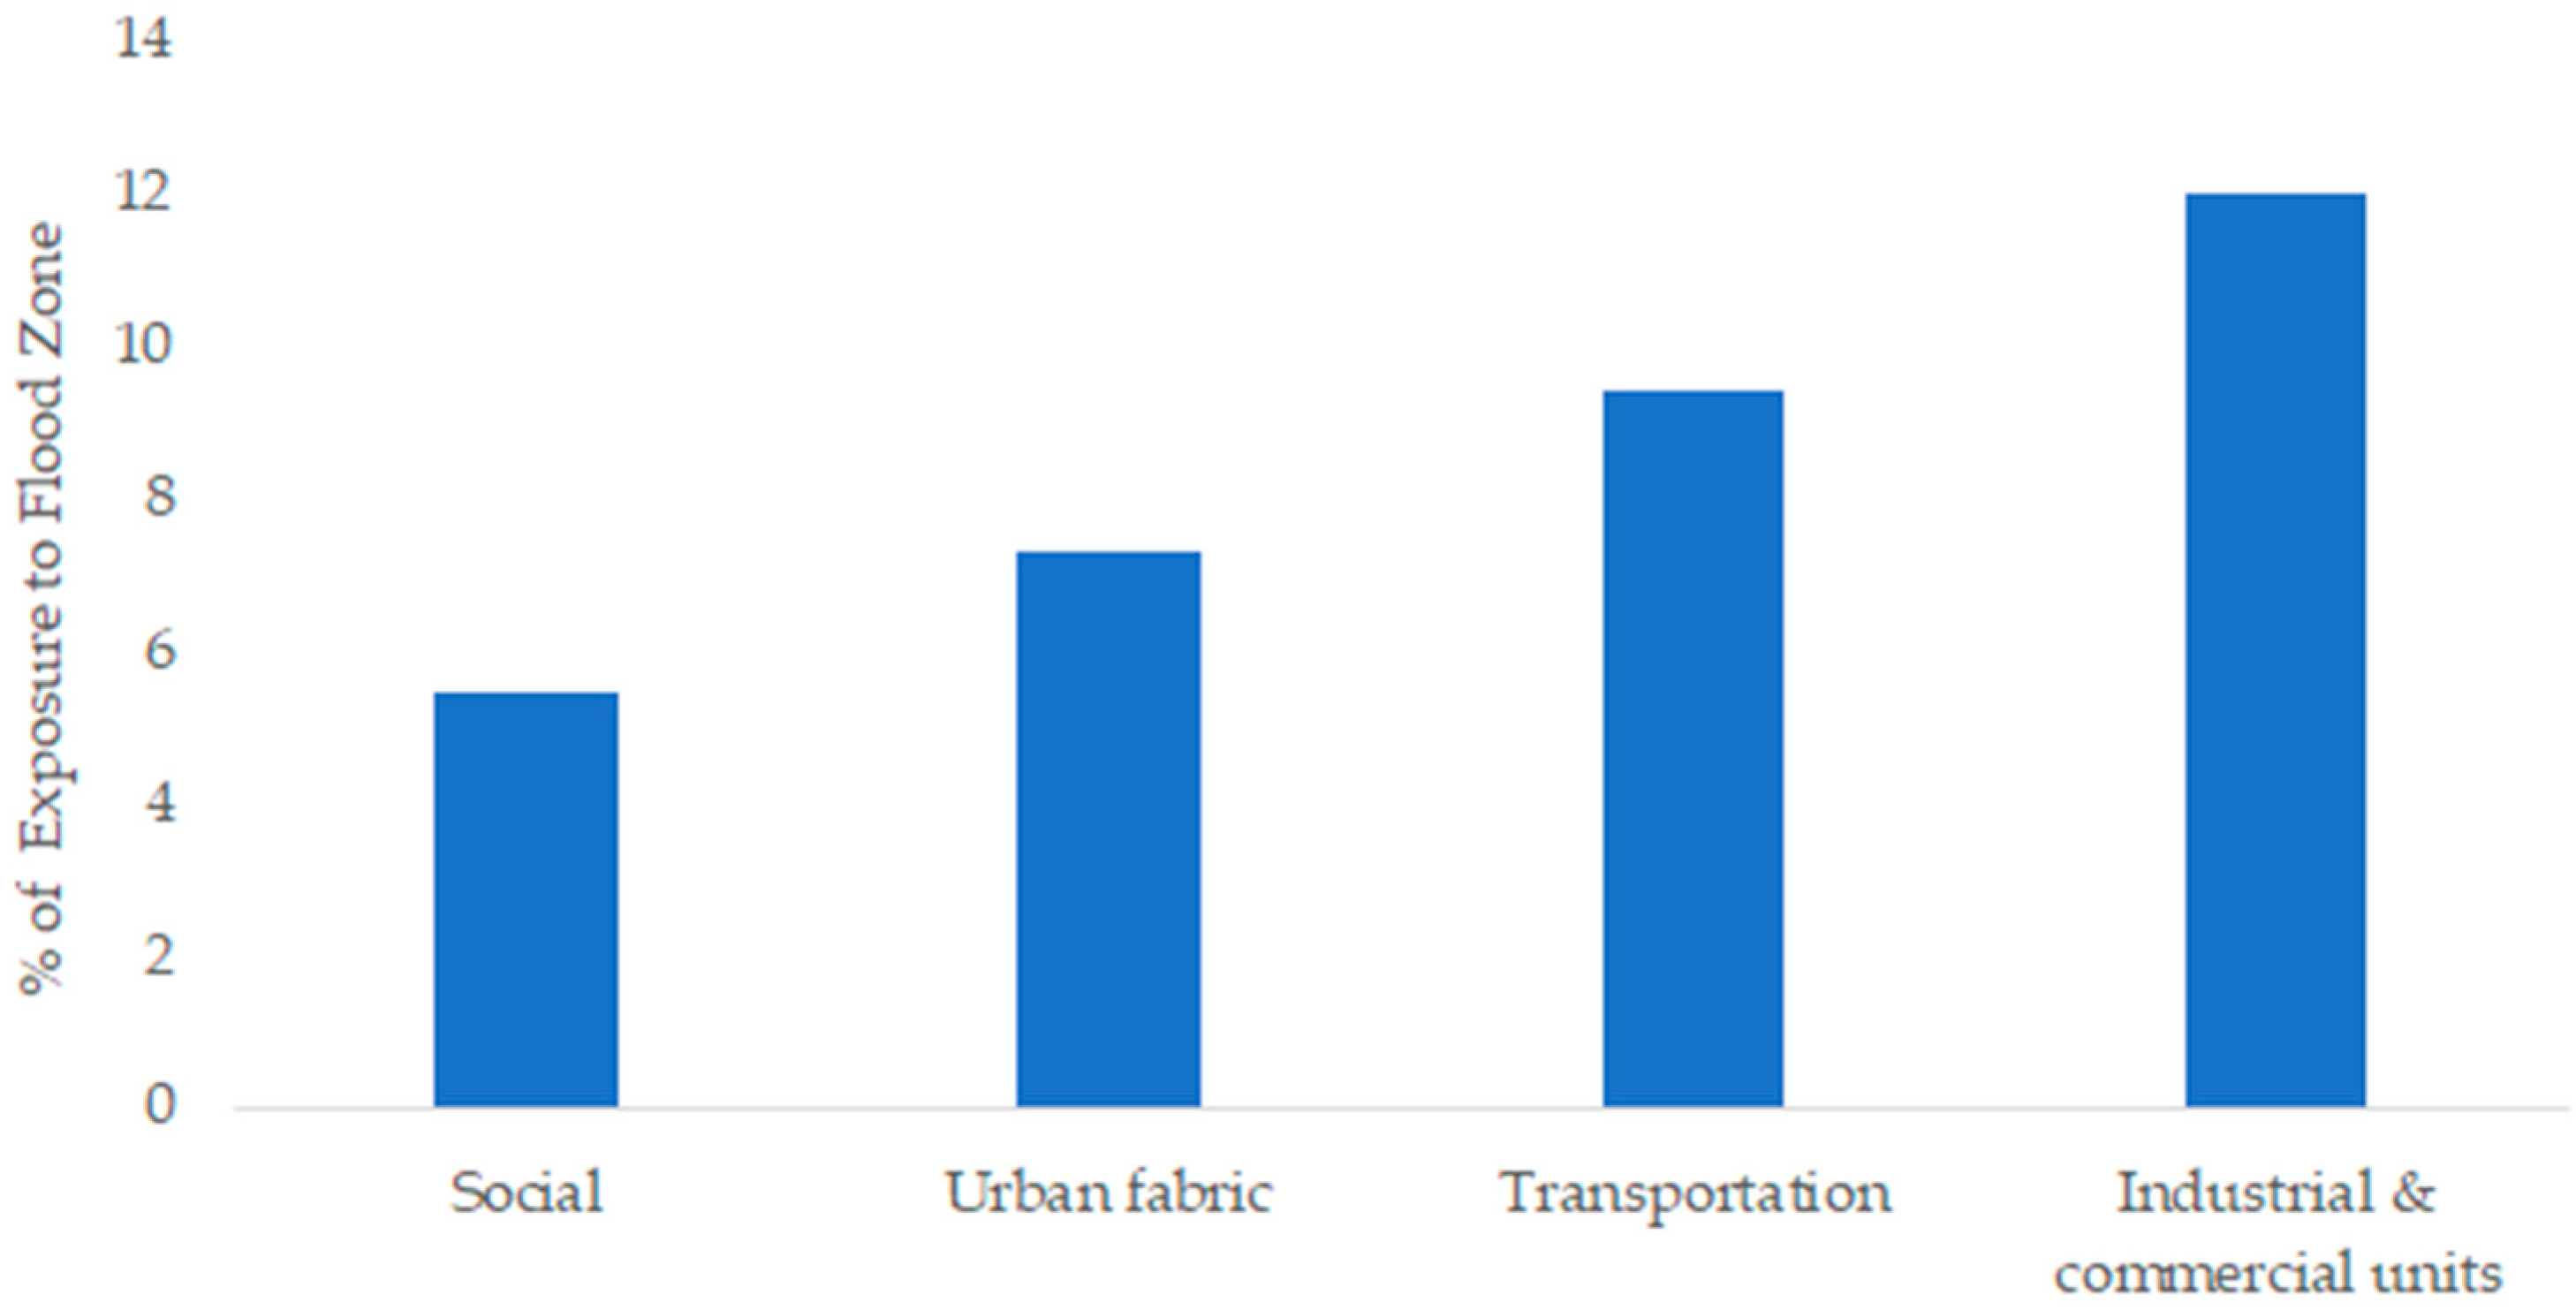
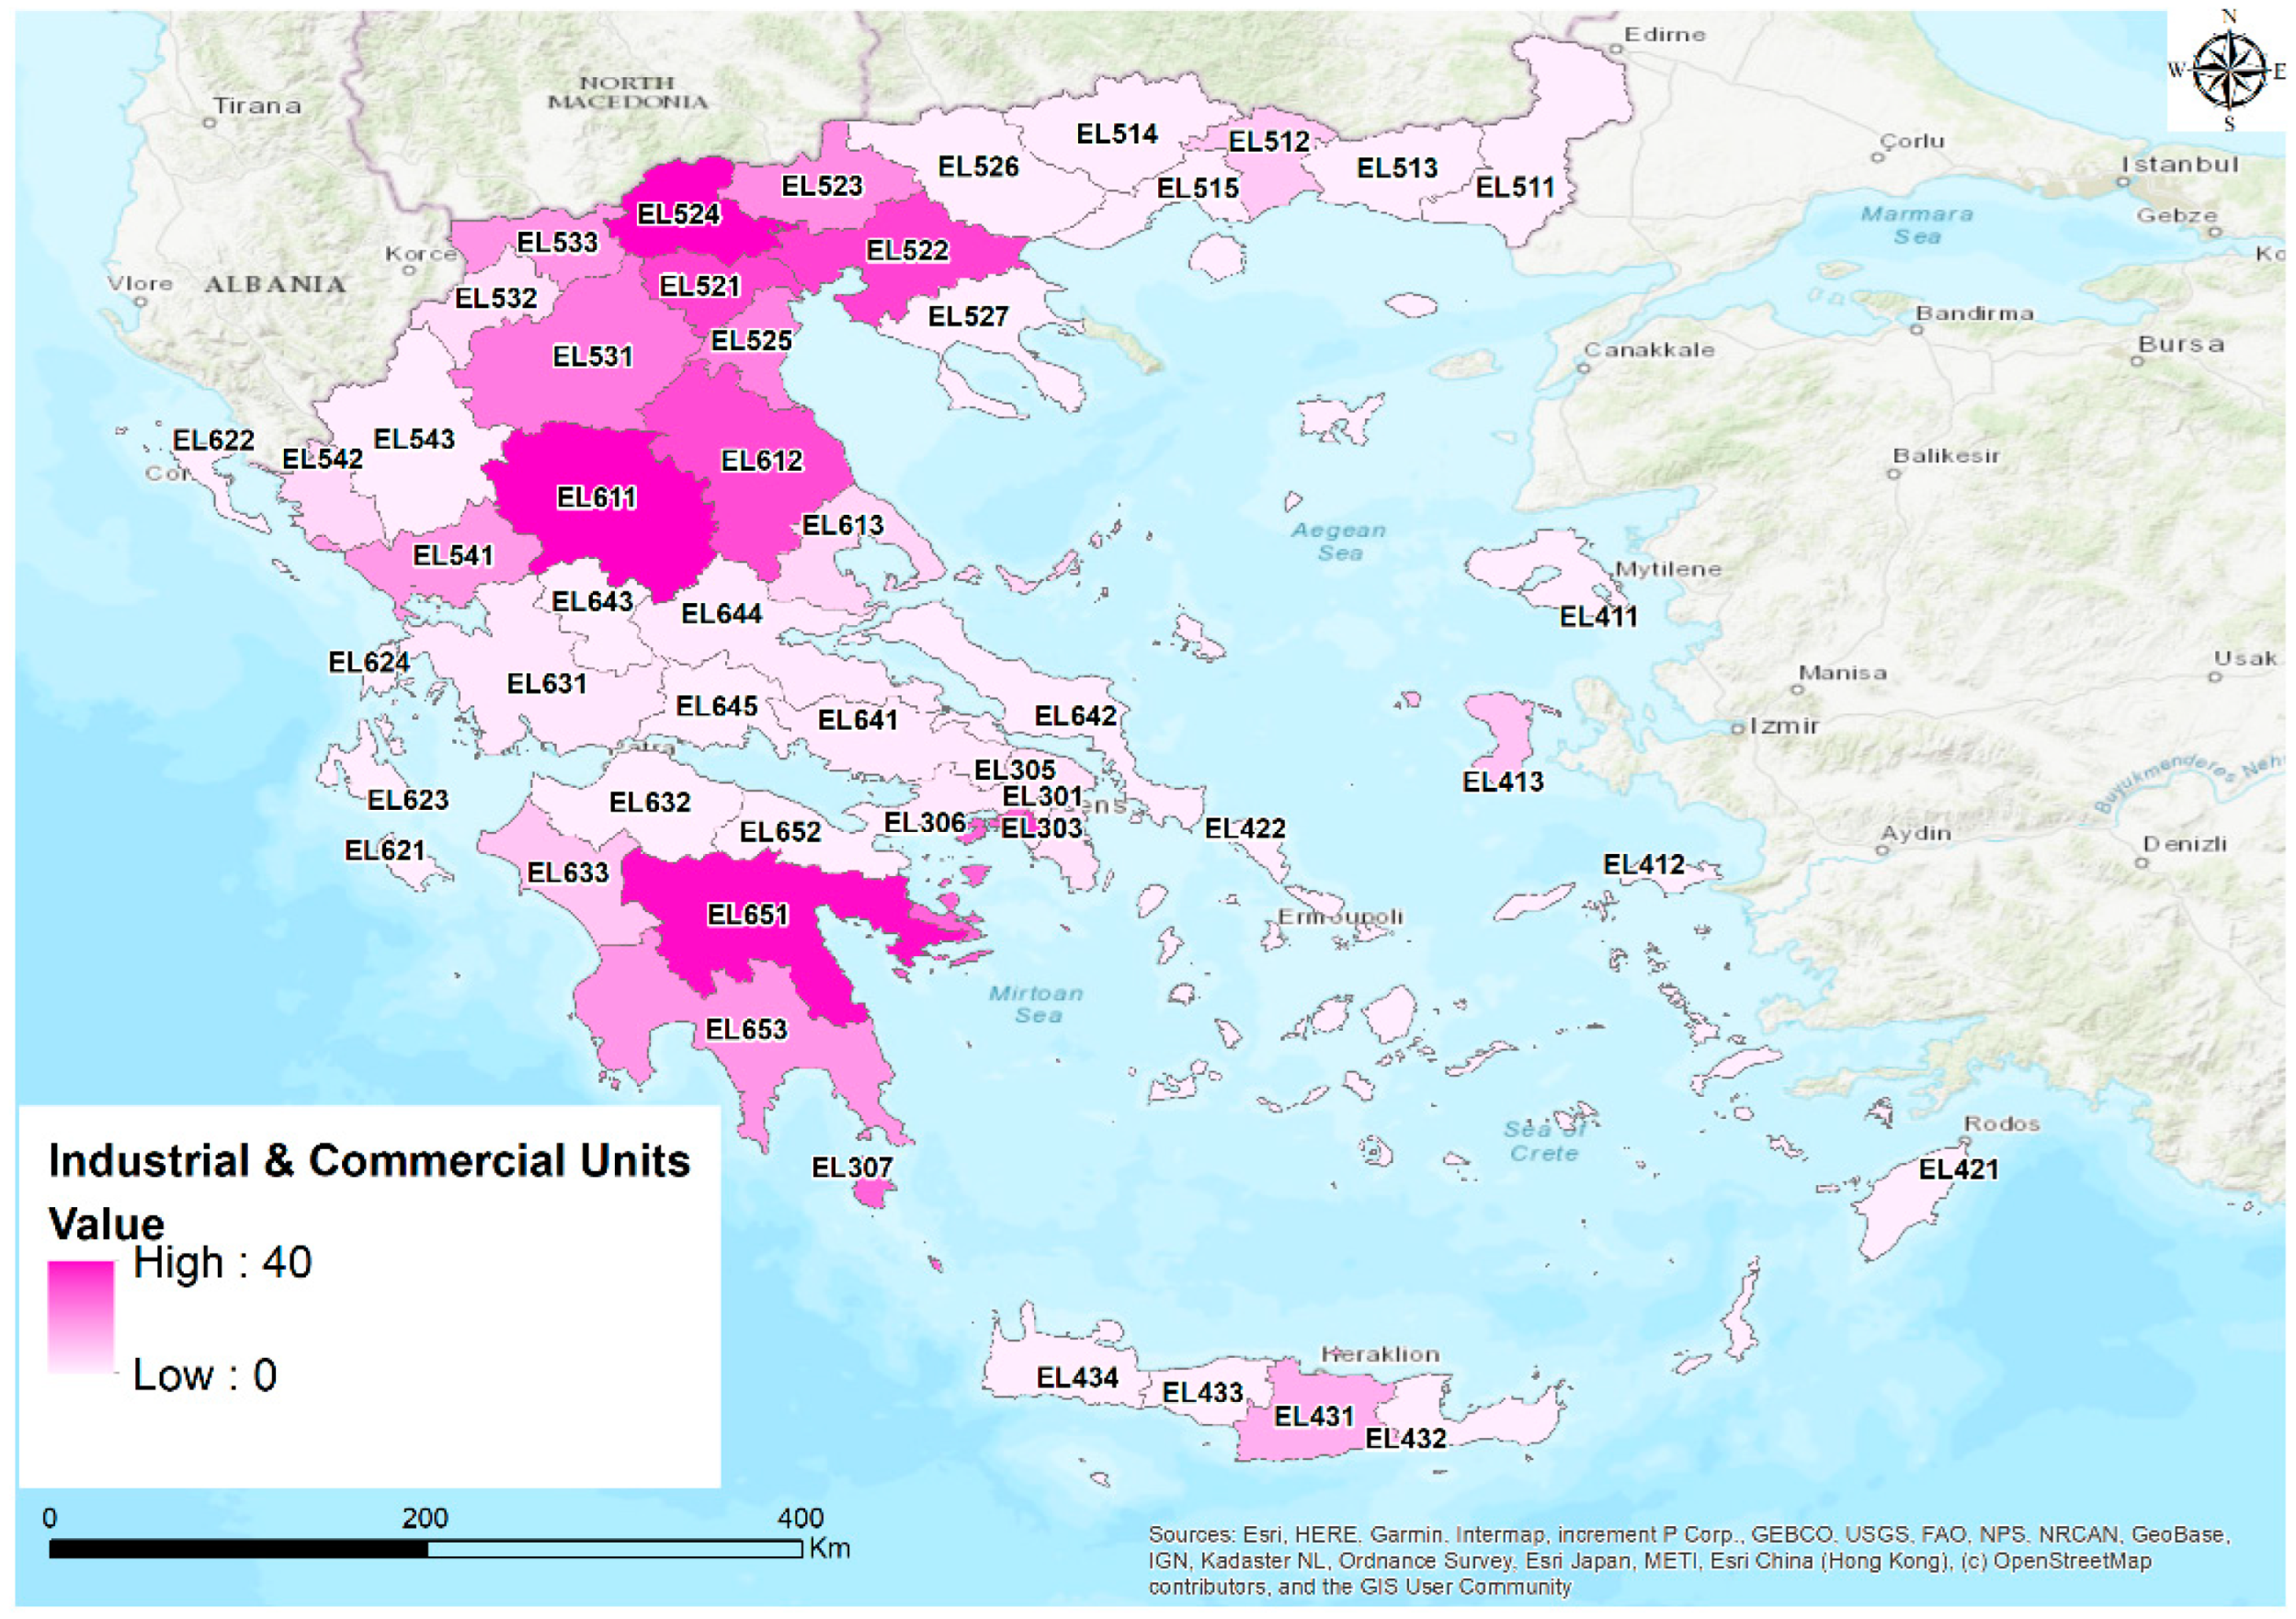
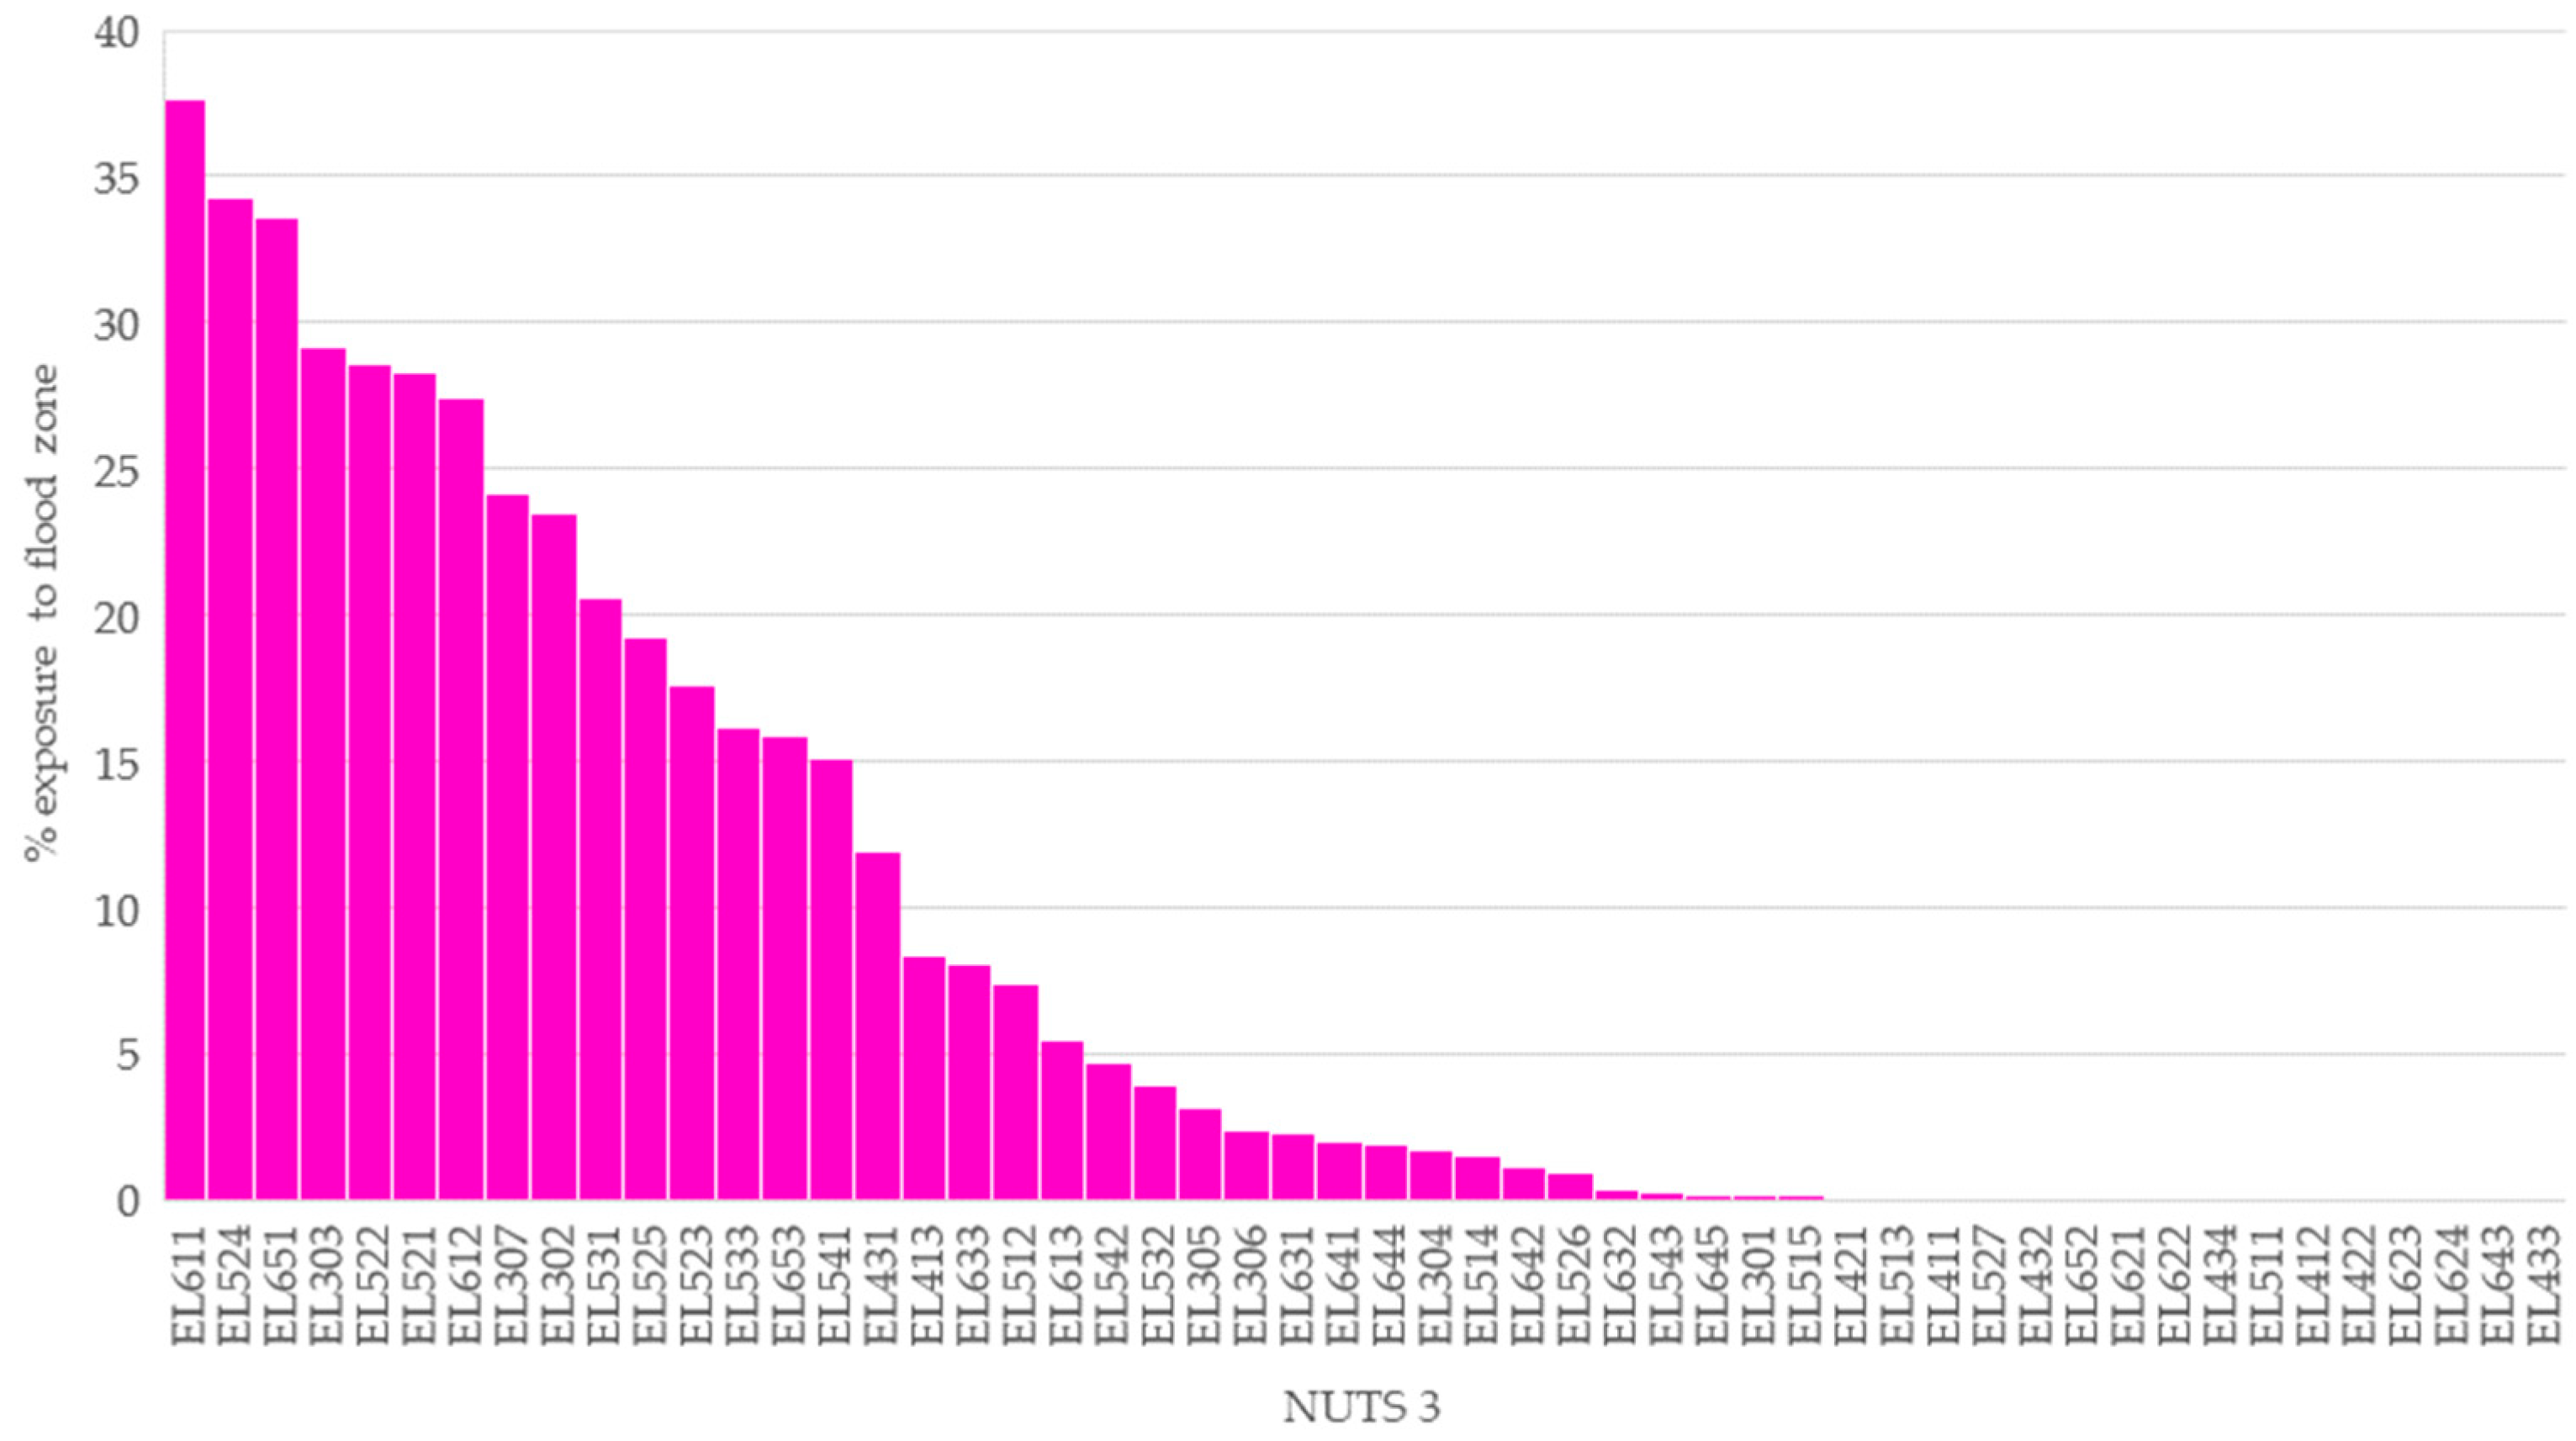
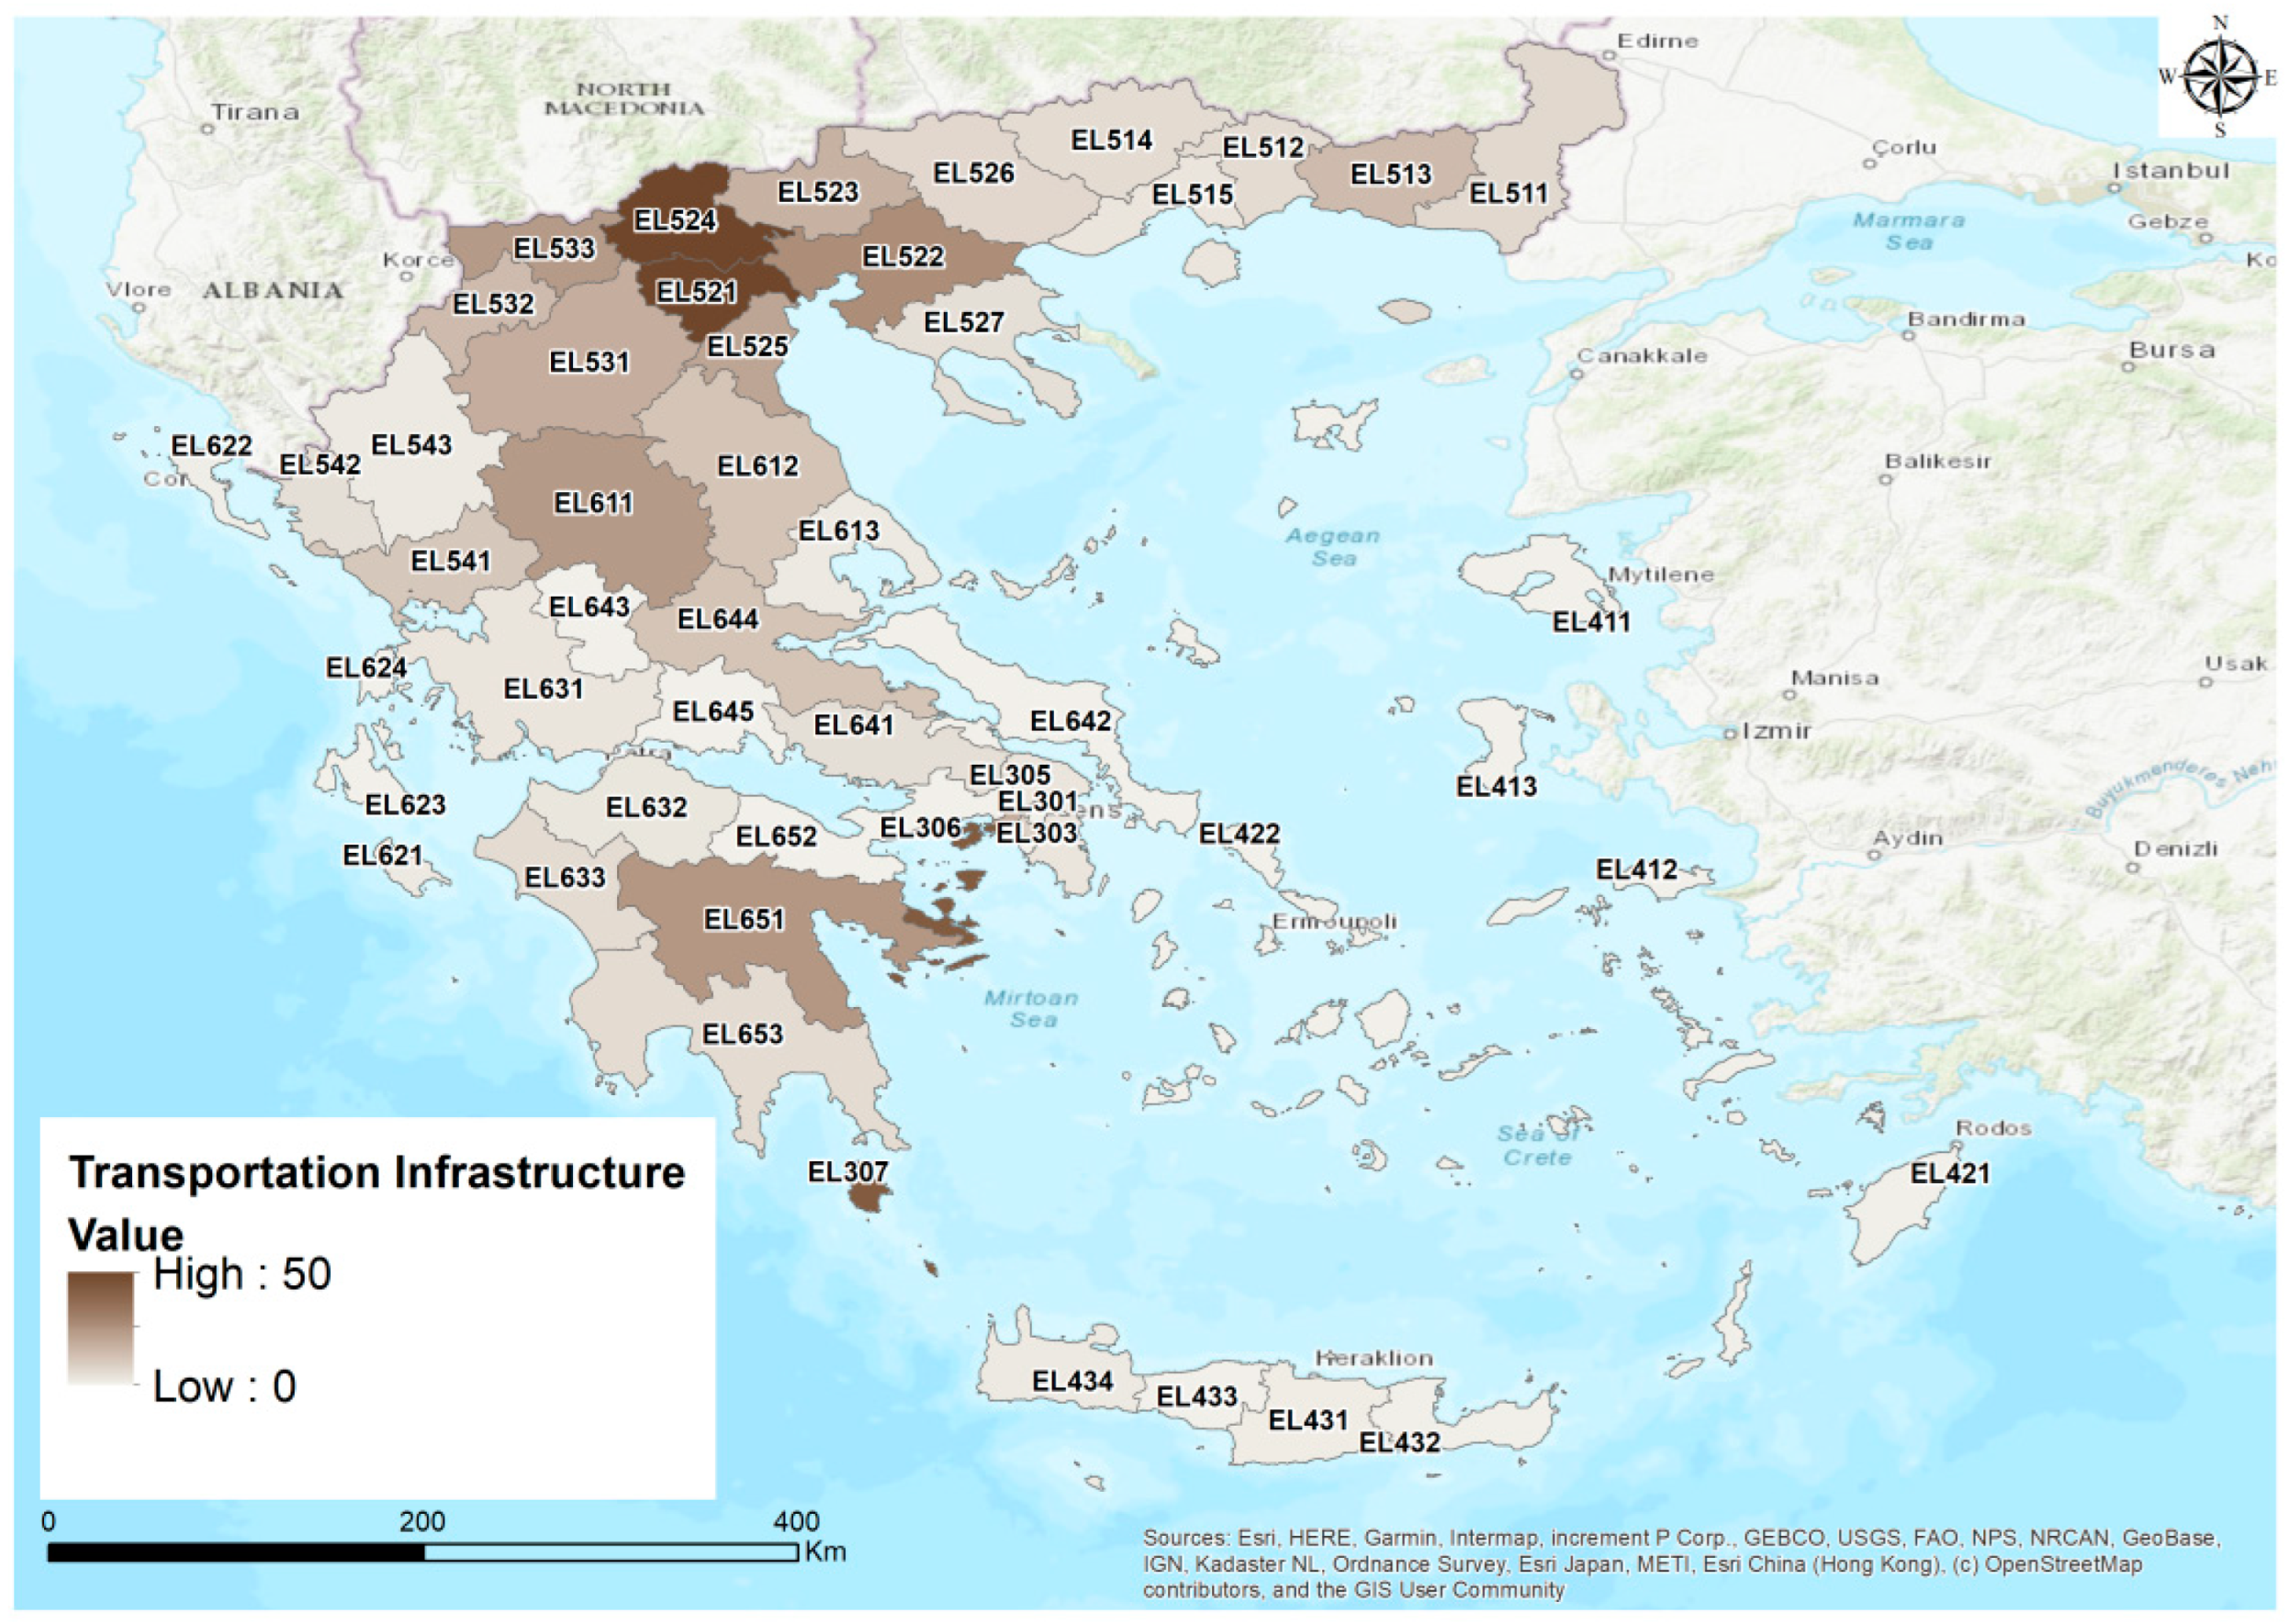
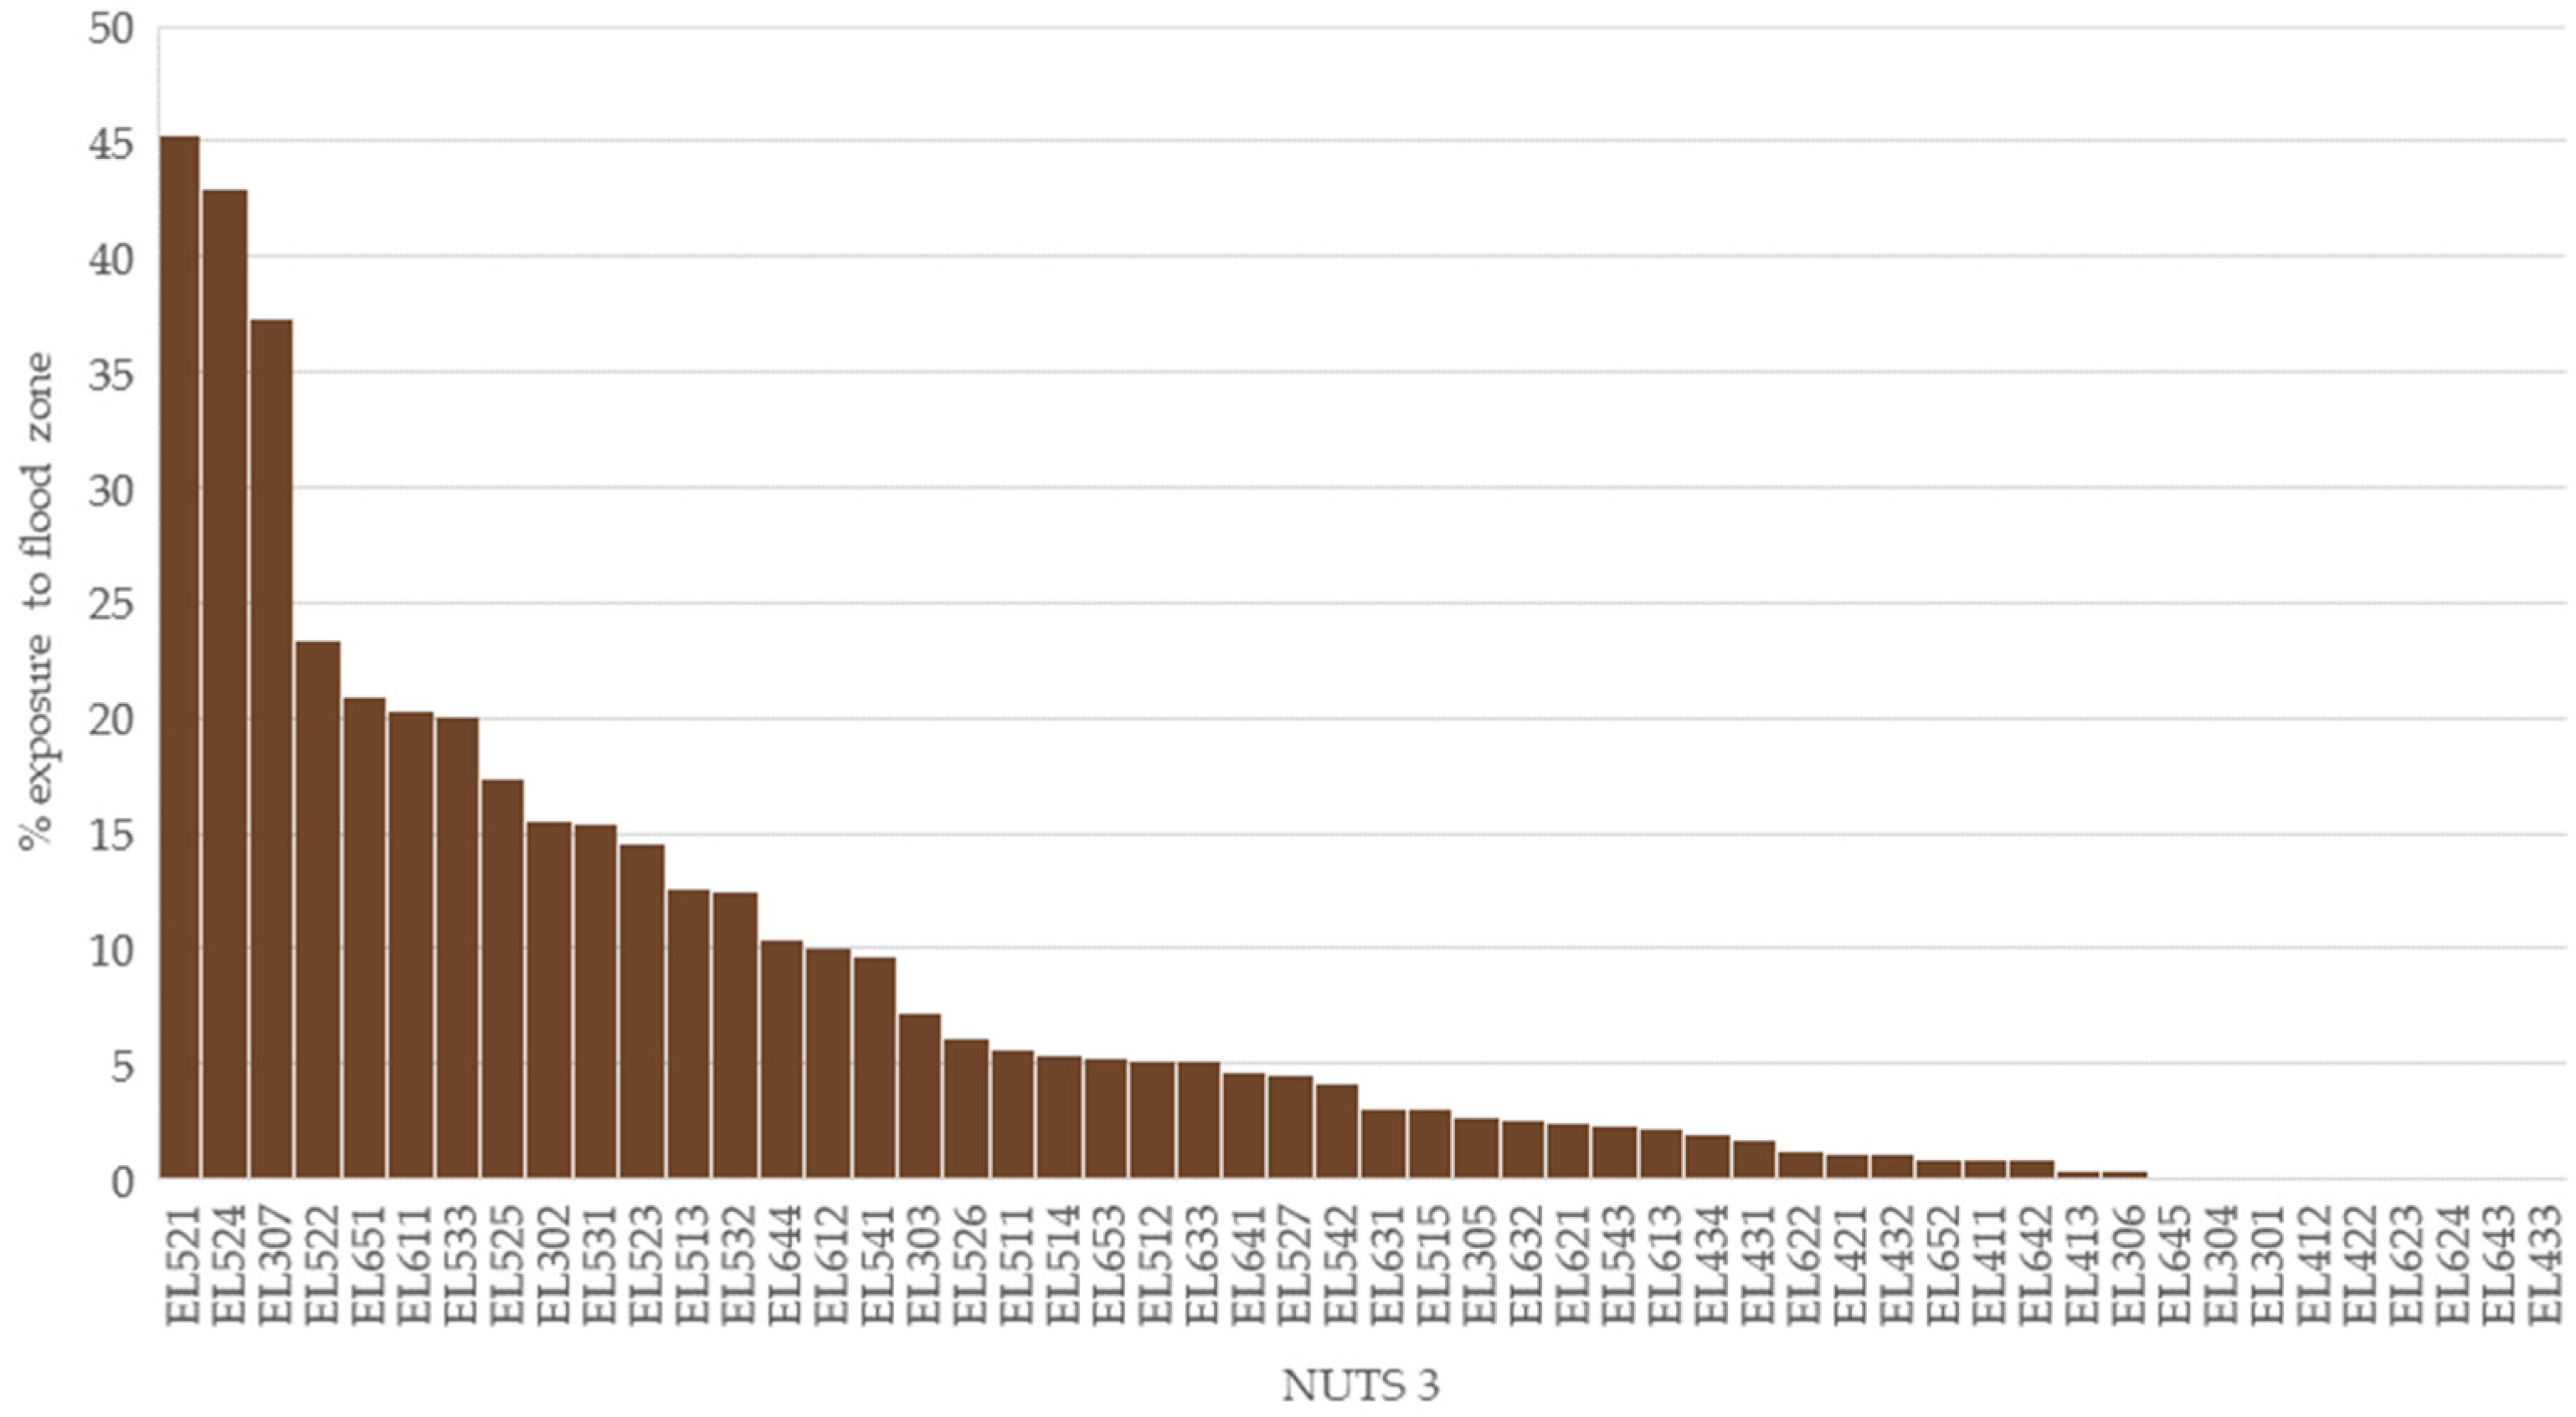
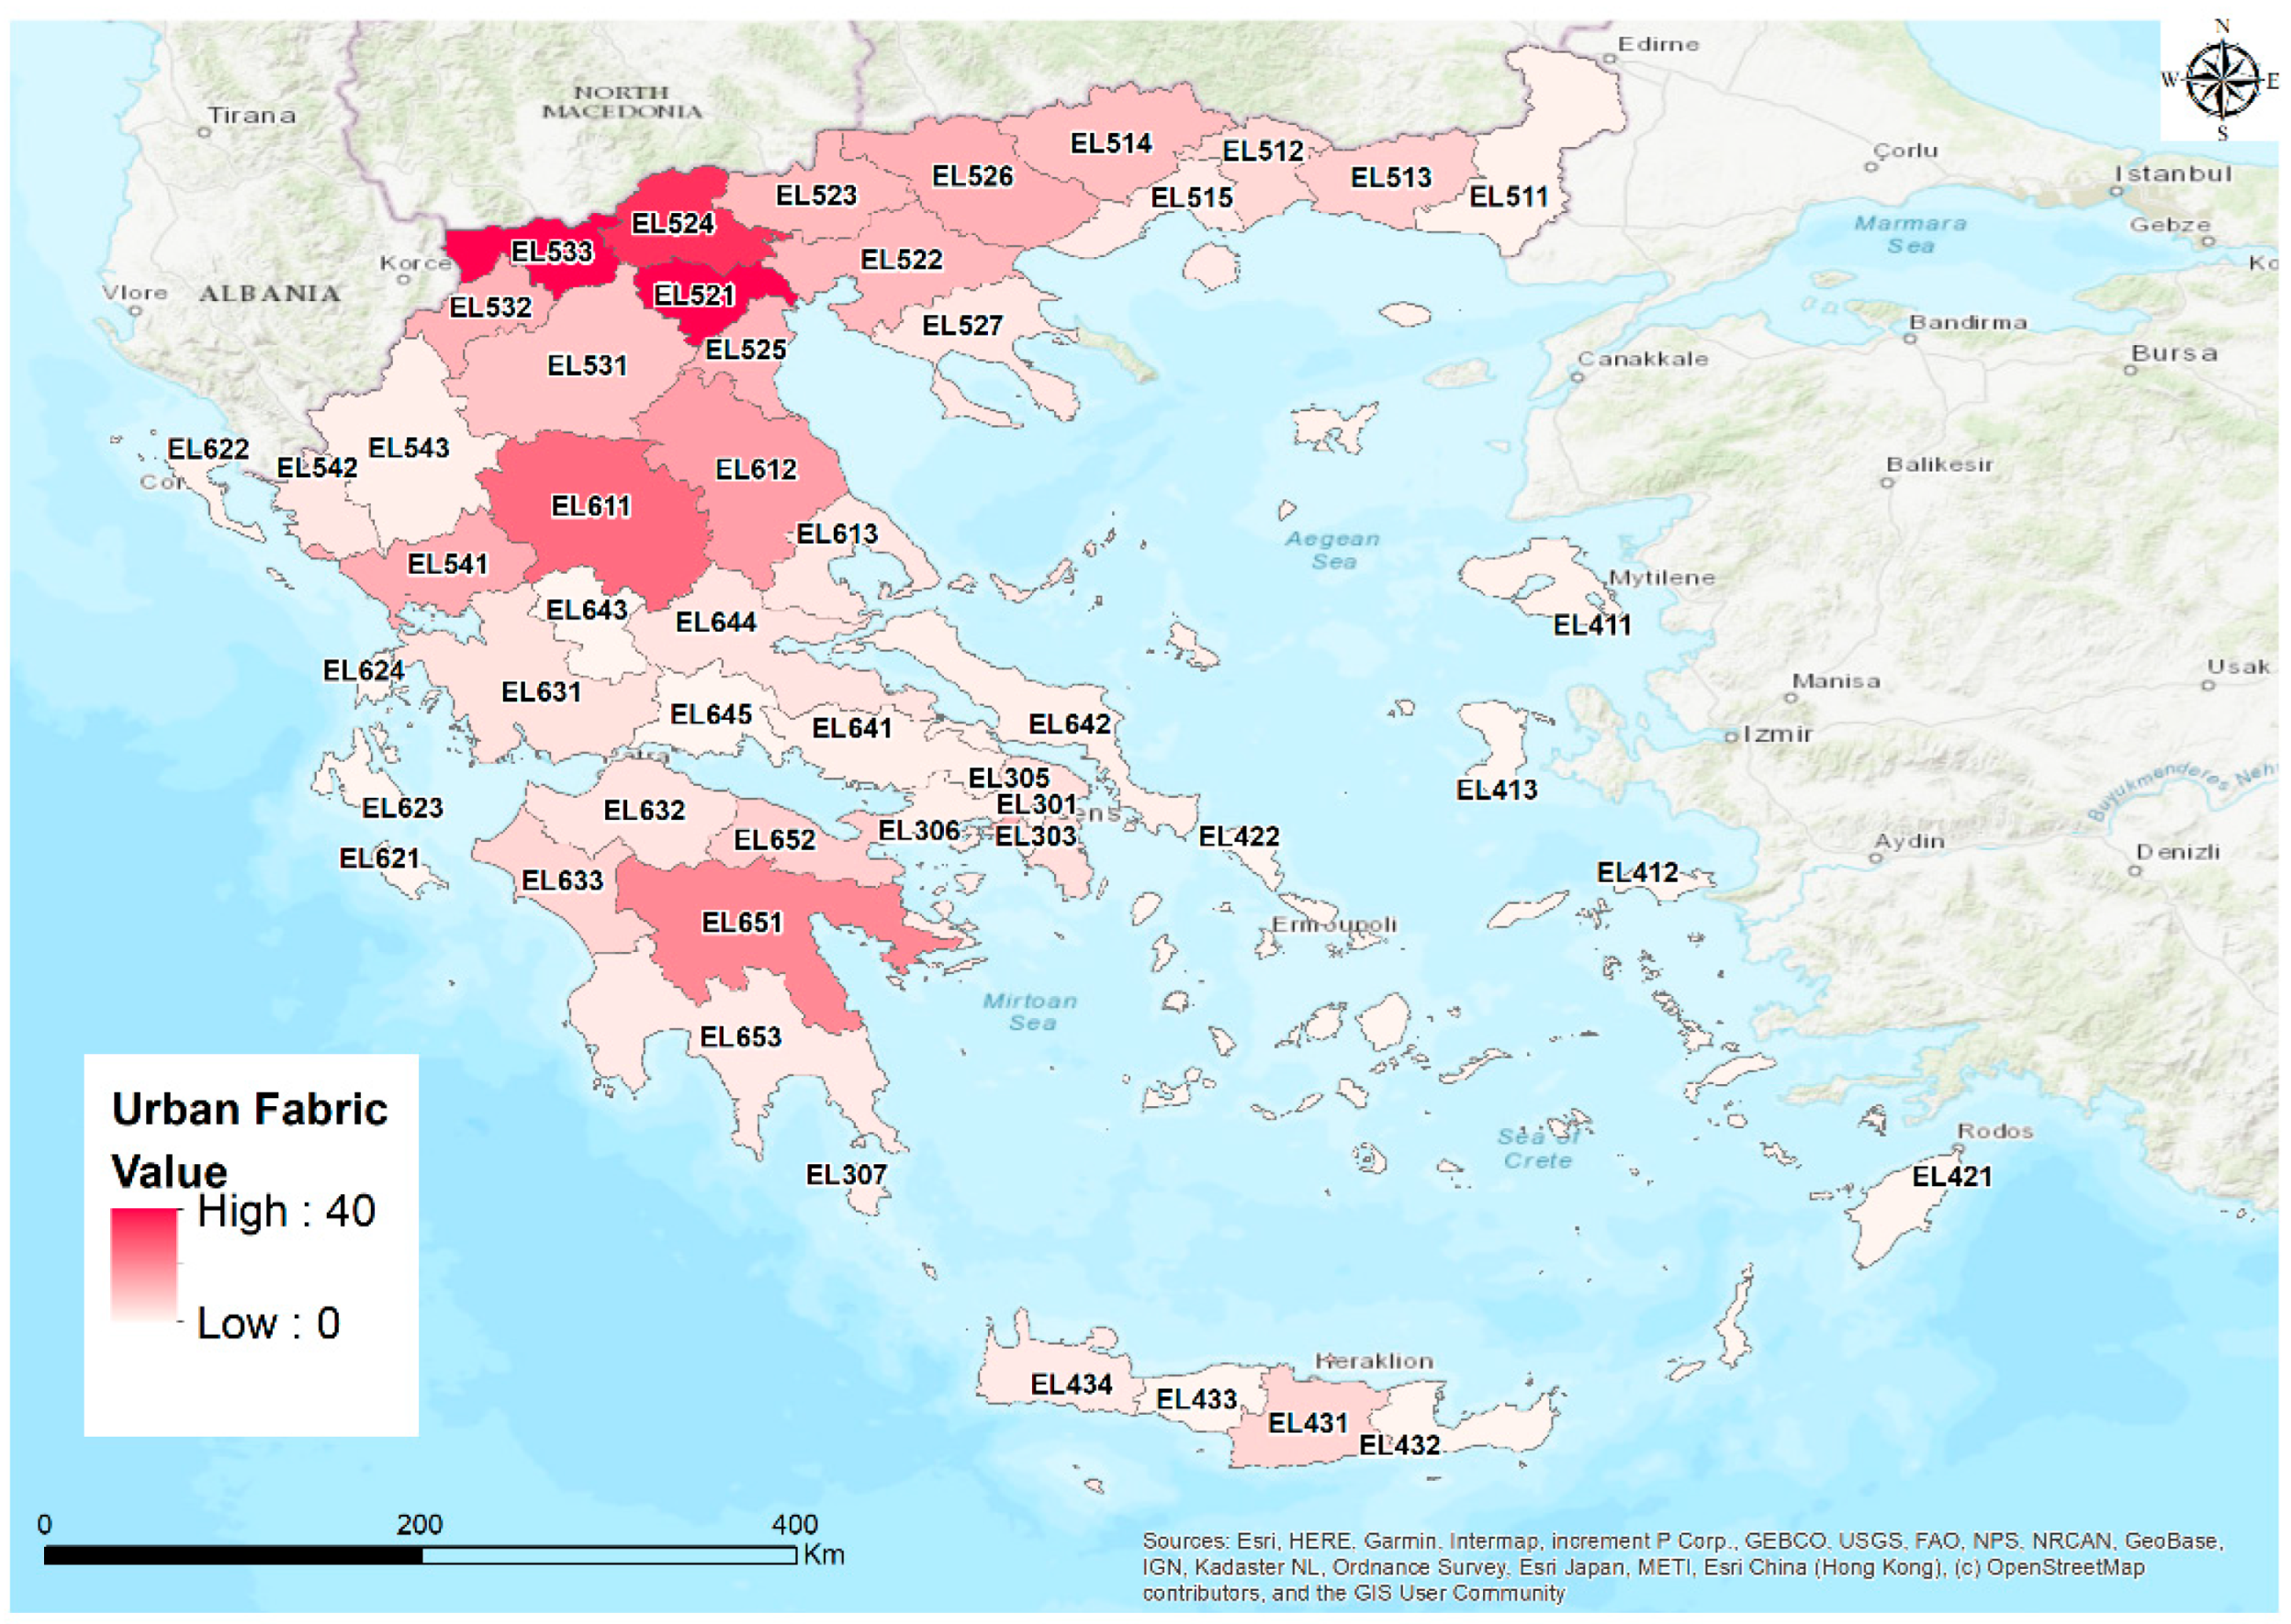
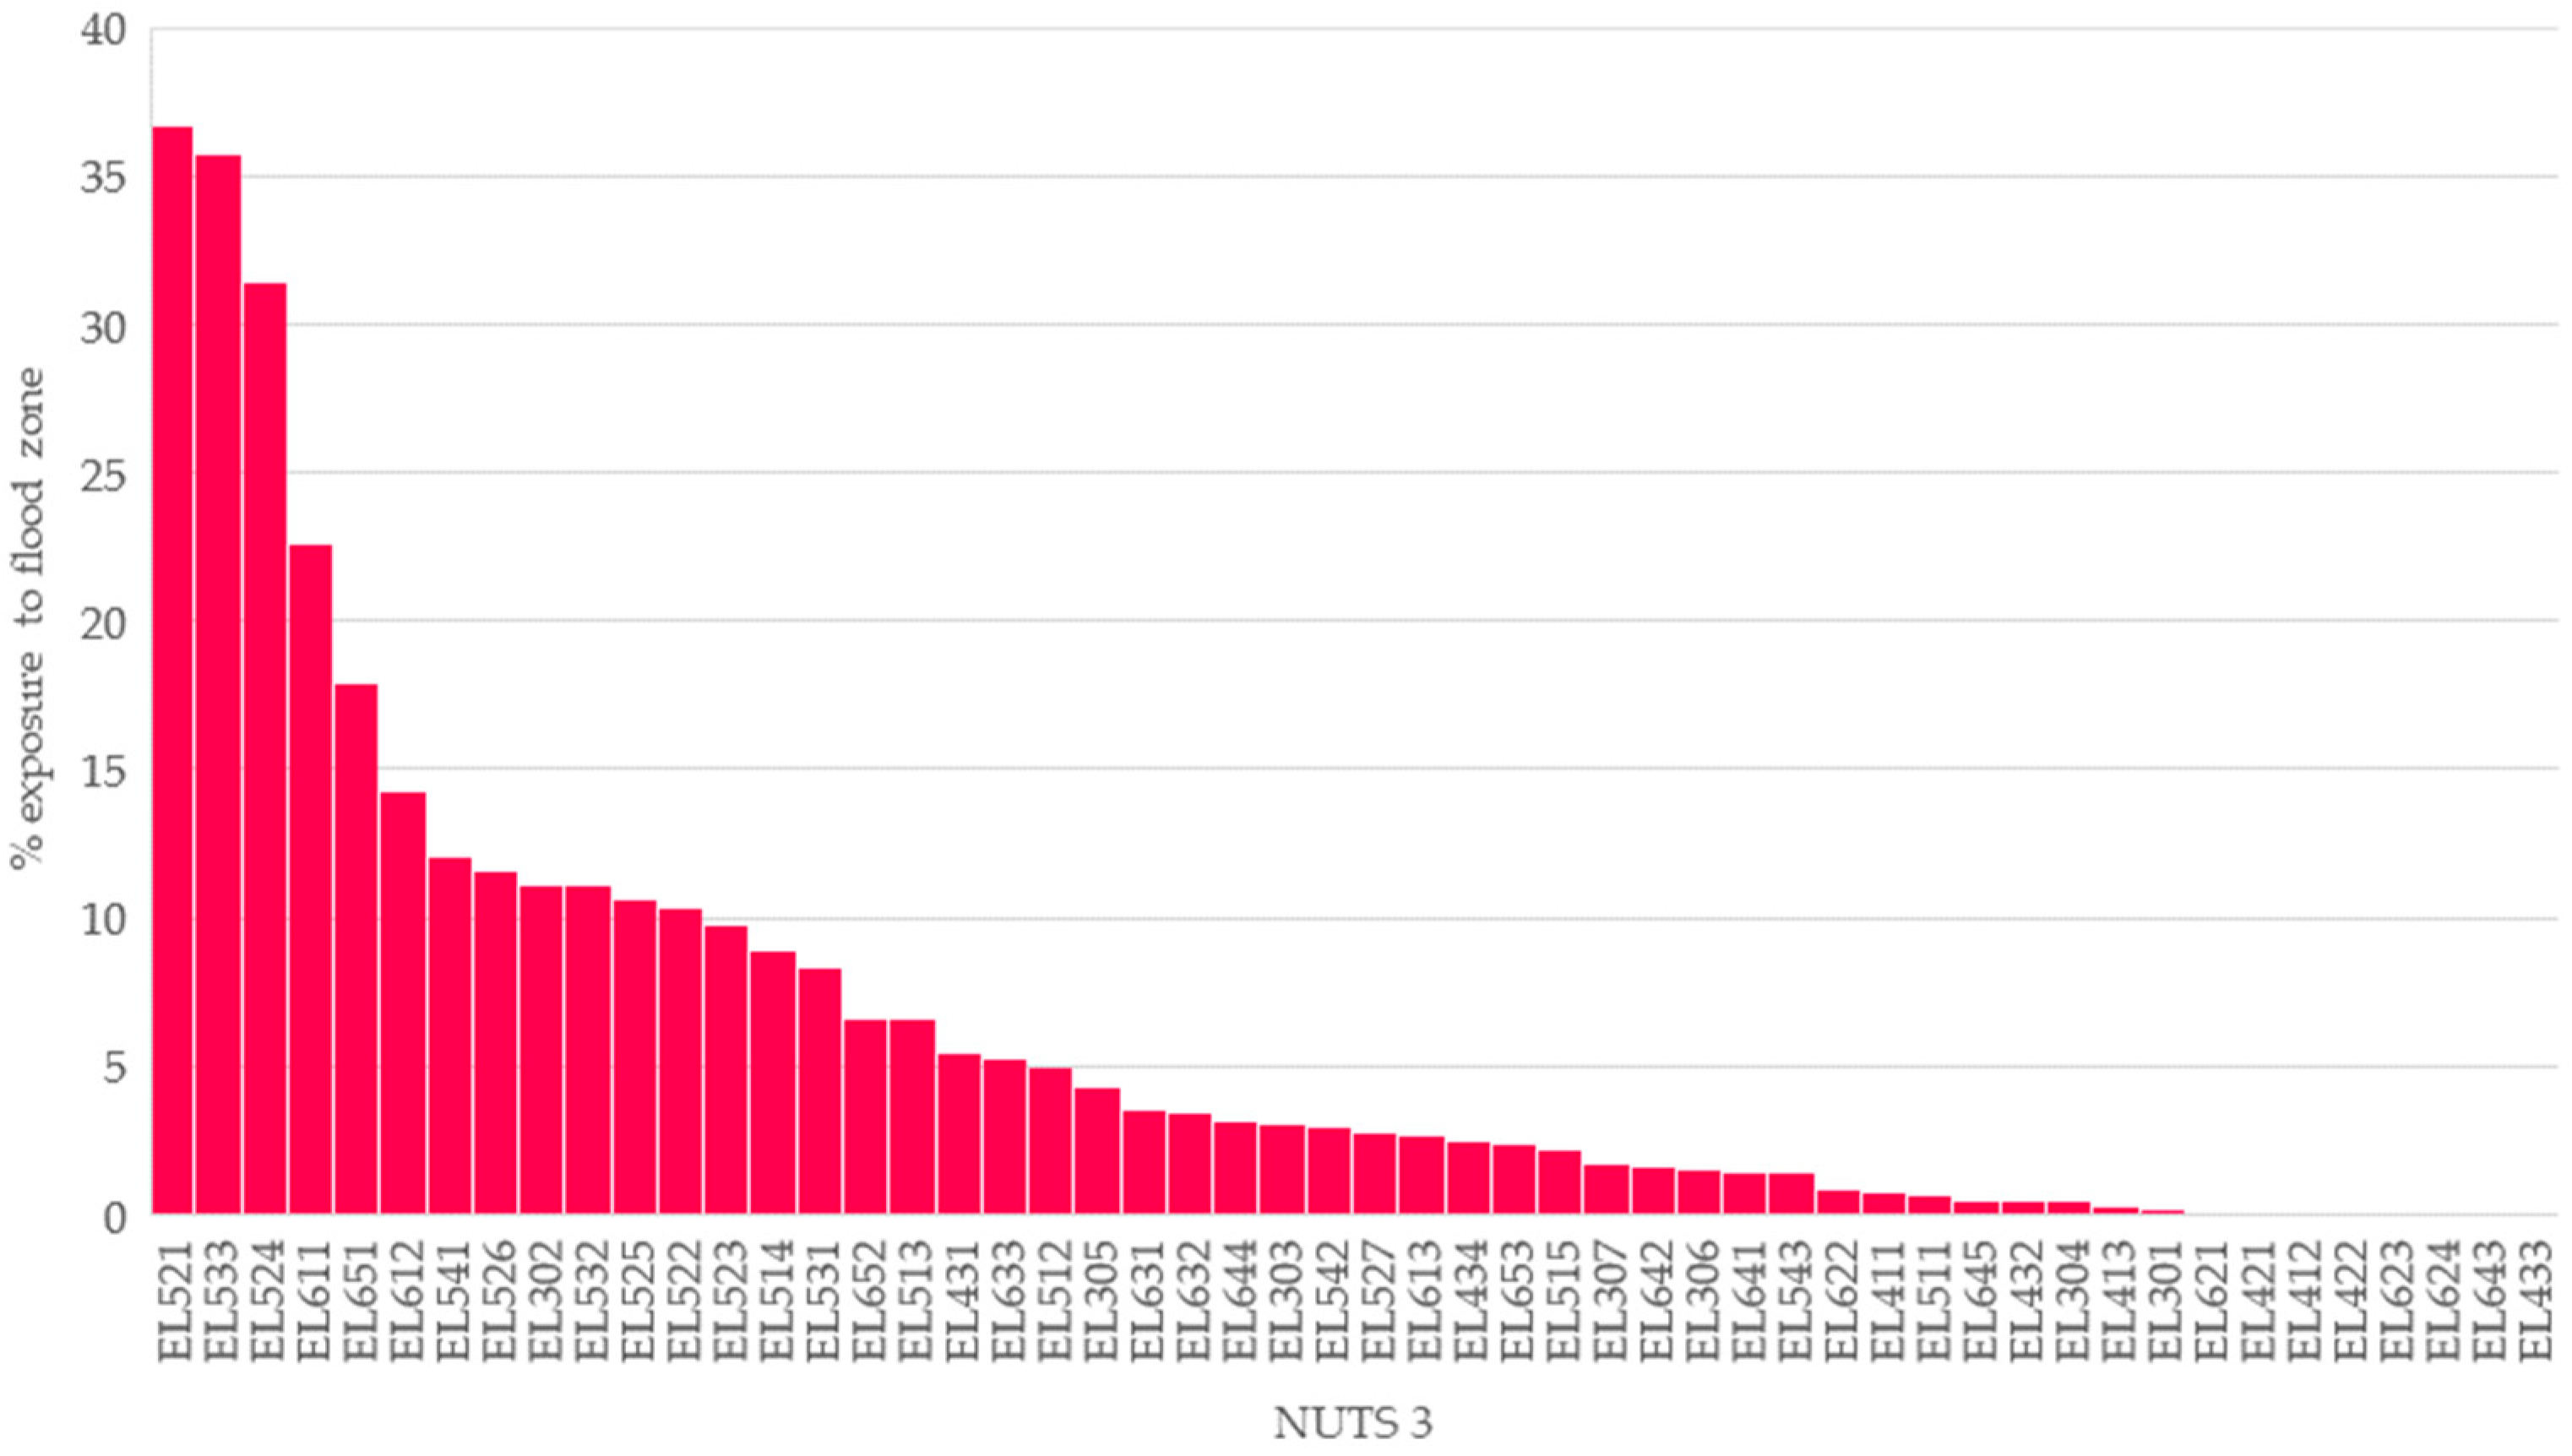
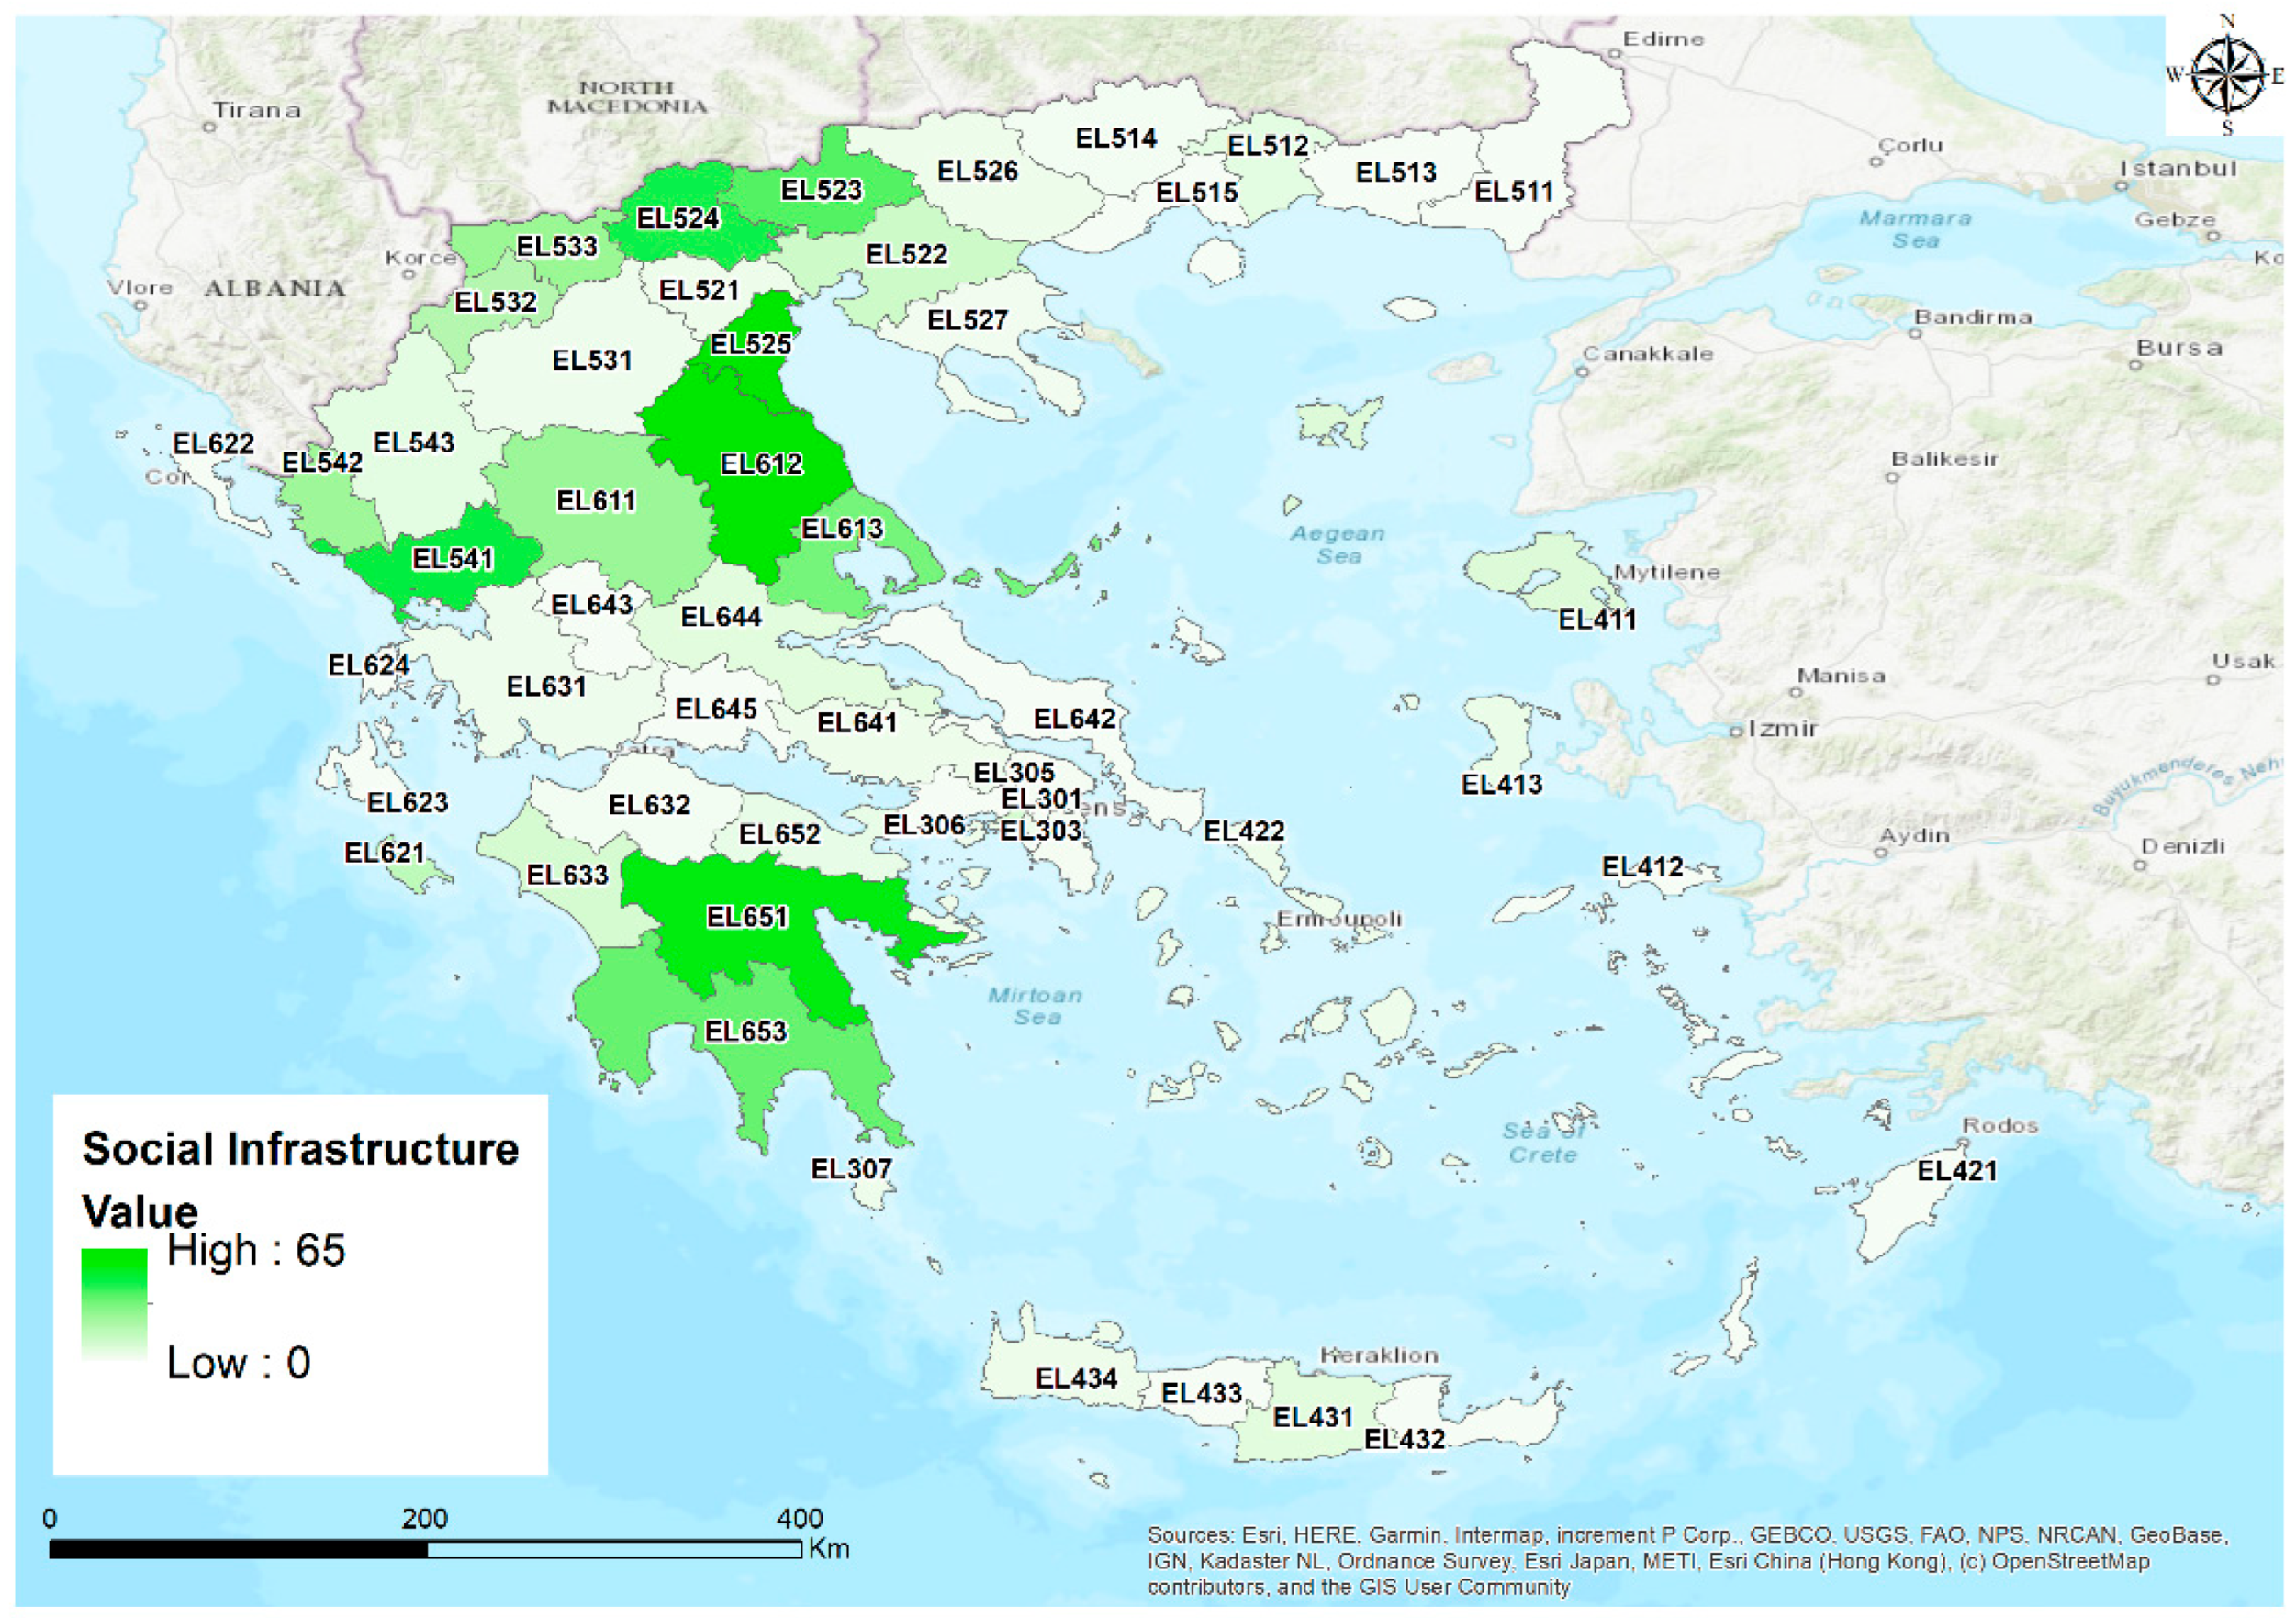
3. Results and Discussion

The percentage coverage of flood extent zones per NUTS 3 provides an overview of the distribution of flood-prone areas over Greece, while historical records of flood fatalities give insights into areas where the surrounding environment may result in human losses during flood occurrences.
The highest coverage by flood extent zone is observed in Imathia (EL521) with a percentage equal to 24.3%, followed by Pella (EL524) and Florina (EL533) with percentages of 18.4% and 17.1%, all located in Northern Greece. Particularly high values (>10%) are also found in Karditsa and Trikala (EL611), Larissa (EL612), Kilkis (EL523), and Arta and Preveza (EL541) (Figure 3). The results are justified by the fact that these areas are drained by large rivers and have correspondingly large floodplain areas.
On the contrary, the majority of flood fatalities were reported due to flash floods in ephemeral torrential streams [41]. Twenty-seven (27) deaths occurred in West Attika (EL306) mostly (21/27) as a consequence of the on 15 November 2017 (21/27) and twenty-one (21) deaths in Evia (EL642) as a result of two severe occurrences on 23 August 1990 (9/21) and 9 August 2020 (8/21). Furthermore, there were more than five deaths in the following areas: Cyclades Island (EL421), Argolida and Arkadia (EL651), Thessaloniki (EL522), Northern Athens (EL301), East Attica (EL305), and Corinthia (EL652). The distribution of findings shows that the deadliest floods occur in metropolitan centers and tourist areas (Figure 4). Economic development and population growth in these areas drive the expansion of built-up areas and human interventions within streambeds, intensifying flooding. Flood hazard assessment in such environments revealed that anthropogenic factors are the driving agents of flood genesis rather than natural factors [42]. Worth bearing in mind that most of these areas are typical wildland-urban interface (WUI) areas, as housing expands in and near forests [43]. Therefore, the probability of fire occurrence is higher. Despite the ecological disaster of a wildfire, flash floods follow due to the complete or partial loss of vegetation [44,45].
At a national level, the exposure ratio of residential areas and infrastructure located in flood zones are illustrated in the next figure (Figure 5) in ascending order. Only 5.5% of social infrastructures are located in flood zones at the lower end, compared to 12% of industrial and commercial units at the highest end. The ratio of urban fabric and transportation was found equal to 9.4% and 7.3%, respectively.
The spatial analyses show that the exposure ratios of the urban areas and infrastructures vary between NUTS 3. In general, northern and central Greece have the highest ratio in most of the examined categories, while particularly high values are also present in the Peloponnese (southern Greece).
The areas of an industrial and commercial unit are occupied by manufacturing, commerce, financial operations, and services. The existence of this infrastructure in floodplains affects various sectors of the economy, with cascading effects on the local community. As a result, methodologies for estimating commercial damage in flood risk assessments and developing probabilistic models suitable for pan-European applications using openly available data have been developed [46]. The flood exposure analysis of these areas revealed that the higher exposure ratio (37.6%) was found in Karditsa and Trikala (EL611), followed by 34.3% in Pella (EL524) and 33.6% in Argolida and Arkadia (EL651). Also, the two most populated metropolitan areas in Greece, the Central Athens sector (EL303) and Thessaloniki (EL522), have a large proportion of industrial and commercial units located in flood zones (29.2% and 28.5%, respectively). The spatial distribution and the analytical graphical representation of the results can be seen in Figure 6 and Figure 7 respectively.
Another crucial element, regarding flood risk, is the transportation infrastructure. The direct effects include material damage to infrastructure, disturbances in the traffic management systems, difficulties in evacuation and rescue operations, and last but not least, fatalities. Indirect effects may include passenger and cargo delay costs [47]. The accessibility of the road network during flood events is fundamental for evacuations and avoiding casualties [48]. Vehicle-related incidents account for an important part of flood fatalities both internationally [49,50] and in Greece [51]. It has also been acknowledged that individuals ignore warning signs or even drive into flooded waterways [52]. To that end, flood risk assessment of the transportation infrastructure is a necessity and integrated approaches have been applied [3]. Recently, national scale studies examined the resilience assessment of transport assets in a multi-hazard environment [53,54]. Our analysis emerged that 45.3% of transportation network length is located in the flood extent zone in Imathia (EL521) and 43.0% in Pella, followed by Peiraeus Nisoi (EL307) (37.4%) and Thessaloniki (EL522) (23.4%). Rather high percentages (>20%) were also found in Argolida and Arkadia (EL651), Karditsa and Trikala (EL611), and Florina (EL533). The spatial distribution of the ratio transportation infrastructure located in the floodplain can be seen in Figure 8 and the graphical analysis of the results in descending order in Figure 9.
The identification of residential areas located in floodplain zones is very important as it is directly related to economic damage to individuals’ properties and is more likely to have adverse effects on local communities. Moreover, it can affect real estate values and be a tool in the housing market [55]. Currently, most homeowners are uninsured against flood damage, while the obligation for flood insurance is enforced when a purchase is completed through the establishment of a new bank loan. Insurance against floods should be a requirement for houses nearby ephemeral streams or rivers. The ratio and the spatial distribution of the urban fabric in flood zones could be the first step for the determination of the insurance fees [56]. The end-user, insurance companies, in this case, could use these data as services (DaaS). Regarding the Greek territory, the highest ratio of the urban fabric in flood zones (36.7%) was found in Imathia (EL521), followed by Florina (EL533) and Pella (EL524) with ratios equal to 35.8% and 31.4% respectively. Noteworthy that these were the regions with the largest flood extent zones. Also, high ratios, approximately 20.0% were recorded in Karditsa and Trikala (EL611) and Argolida and Arkadia (EL651) (Figure 10 and Figure 11).
Social infrastructures are related to national well-being and security. Due to their significance, reducing flood risk to these infrastructures has raised the concern of the scientific community [30]. The exposure of social infrastructure to flood endangers vulnerable groups of the population. In such places, the evacuation and rescue are more complex. Moreover, the damage to certain social infrastructure during flood events makes the coordination and operational function of local authorities more difficult. The geospatial analysis emerged that the highest ratio of social infrastructure in flood zones appeared in Larisa (EL612) (61.8%) followed by Pieria (EL525) (52.8%) and Argolida and Arkadia (EL651) (43.6%). Notably, seven other NUTS 3 units, namely Arta and Preveza (EL541), Pella (EL524), Kilkis (EL523) Laconia and Messenia (EL653), Magnisia (EL613), Florina (EL533) and Karditsa and Trikala (EL611), have more than 20% of their social infrastructure in floodplains. The spatial and graphical representation of the results are given in the following figures (Figure 12 and Figure 13).
Summarizing the results, it was found that Karditsa and Trikala (EL611), as well as Pella (EL525), had more than a 20% flood exposure ratio for all the examined types of infrastructures and urban fabric.
The analysis highlights critical infrastructure exposure to floods and identifies the areas with the highest ratios in the Greek territory. This research can be the first step toward an integrated physical and social vulnerability assessment [57]. Furthermore, it provides useful insights to stakeholders and policymakers for spatial planning and scheduling of flood prevention projects. Besides the classical structural measures, natural-based solutions must be considered, such as the management of forest ecosystems not only for wood production but also to enhance their protective role. Therefore, the protection of forests from abiotic and biotic disturbances in prone areas should be a priority to avoid vegetation damage in the mountainous watersheds, which subsequently increases flooding in the lowland areas. The findings of such studies should not be restricted to the scientific community but should be communicated to the general public in order to raise awareness about human interventions in streambeds and the protection of the environment as a flood prevention measure.
The spatial overlay of assets and infrastructure with floodplains is particularly important as it has cascading effects on local communities. These results could be a toolkit for local authorities, which are in charge of operational functions, obligations, and civil protection tasks for the protection of life, property, and the local economy. The knowledge of elements at risk facilitates procedures in prevention, preparedness, and response as well as enhances resilience at a local scale.
This knowledge sets the way for the introduction of nature-based solutions as local mitigation efforts move forward. The term “Nature-Based Solutions” (NBS) refers to a recent approach shift for flood risk management (FRM) towards solutions that employ elements, procedures, and management techniques that arise from nature to enhance water retention and reduce flooding [58]. They benefit low-level floods in smaller, more often flooded watersheds and help communities become more resilient to the effects of climate change, such as flooding. They also slow the passage of rain through the terrain into streams and rivers, preventing coastal flooding from tidal seas. Using nature-based solutions offer other benefits in addition to reducing flooding. For instance, they can reduce soil erosion in rivers and streams, increase species diversity in rivers and streams, and help fight global warming by storing carbon. Although nature-based solutions can lower the danger of flooding, they are not a component of traditional risk management [59]. More people must embrace nature-based solutions as the go-to infrastructure for combating climate change. These solutions should be viewed as important infrastructure to reduce climate change and safeguard our communities in order to build resilience to its effects.
Our approach is efficient on a national scale, although some limitations exist. The flood extent zones used in this study are derived from the Hellenic Flood Risk Management Plans (FRMP) conducted in the frame of the 2007/60/EC directive implementation. According to the project technical specifications, hydraulic modeling was not performed in streams with small watersheds (10 km2), and floodplain areas of less than 25 km2 were not further investigated unless significant historical flood records were reported. To that end, some streams were excluded from the analysis and are not considered herein. A detailed mapping of flood extent zones has to be conducted at a local scale and will be the basis for a holistic flood exposure analysis. A target of future research could be the expansion of the analysis to a pan-European scale and also evaluate the effect of flood exposure on land prices.

4. Conclusions

This study introduces the first nationwide spatial assessment of flood exposure in residential areas and infrastructures in Greece. Spatial analysis and open access data were coupled to illustrate the variation of flood exposure at the national and NUTS 3 levels. Specifically, the ratio of the urban fabric, transportation, social, industrial, and commercial infrastructures in 100-year flood zones was evaluated as well as the spatial pattern of the exposure. These categories were selected due to their devastating effects on local communities.
The flood exposure ratio of the aforementioned assets and facilities ranges from 5.5% to 12% at a national level. Nevertheless, some NUTS 3 level regions show particularly high ratios in certain categories. The results indicate that northern and central Greece generally have a high flood exposure ratio. Moreover, the outputs of this study detect places where further actions should be prioritized to evaluate and reduce flood risk.
The developed methodology could act as a roadmap for integrated flood risk assessment. The spatial results can be easily overlaid with other spatial data for further analysis, while the methodology is highly transferable as it is based on open-access geospatial data.

Author Contributions

Conceptualization, S.S.; methodology, S.S.; software, S.S.; formal analysis, S.S.; investigation, S.S.; data curation, S.S.; writing—original draft preparation, S.S.; writing—review and editing, S.S., V.A. and T.T. visualization, S.S., V.A. and T.T. All authors have read and agreed to the published version of the manuscript.

Funding

This research received no external funding.

Data Availability Statement

Not applicable.

Conflicts of Interest

The authors declare no conflict of interest.

References

  1. Centre for Research on the Epidemiology of Disasters (CRED). CRED Crunch 66-Disasters Year in Review 2021. Available online: https://cred.be/sites/default/files/CREDCrunch66N.pdf (accessed on 10 May 2022).
  2. Papilloud, T.; Röthlisberger, V.; Loreti, S.; Keiler, M. Flood exposure analysis of road infrastructure—Comparison of different methods at national level. Int. J. Disaster Risk Reduct. 2020, 47, 101548. [Google Scholar] [CrossRef]
  3. Van Ginkel, K.C.; Dottori, F.; Alfieri, L.; Feyen, L.; Koks, E.E. Flood risk assessment of the European road network. Nat. Hazards Earth Syst. Sci. 2021, 21, 1011–1027. [Google Scholar] [CrossRef]
  4. Porter, J.R.; Shu, E.; Amodeo, M.; Hsieh, H.; Chu, Z.; Freeman, N. Community Flood Impacts and Infrastructure: Examining National Flood Impacts Using a High Precision Assessment Tool in the United States. Water 2021, 13, 3125. [Google Scholar] [CrossRef]
  5. Petrucci, O.; Aceto, L.; Bianchi, C.; Bigot, V.; Brazdil, R.; Pereira, S.; Kahraman, A.; Kikiç, O.; Kotroni, V.; Llasat, M.C.; et al. Flood Fatalities in Europe, 1980–2018: Variability, Features, and Lessons to Learn. Water 2019, 11, 1682. [Google Scholar] [CrossRef]
  6. Merz, B.; Kreibich, H.; Schwarze, R.; Thieken, A. Review article “Assessment of economic flood damage”. Nat. Hazards Earth Syst. Sci. 2010, 10, 1697–1724. [Google Scholar] [CrossRef]
  7. Allaire, M. Socio-economic impacts of flooding: A review of the empirical literature. Water Secur. 2018, 3, 18–26. [Google Scholar] [CrossRef]
  8. Giannaros, C.; Kotroni, V.; Lagouvardos, K.; Oikonomou, C.; Haralambous, H.; Papagiannaki, K. Hydrometeorological and socio-economic impact assessment of stream flooding in southeast mediterranean: The case of Rafina catchment (Attica, Greece). Water 2020, 12, 2426. [Google Scholar] [CrossRef]
  9. Cornwall, W. Europe’s deadly floods leave scientists stunned. Science 2021, 373, 372–373. [Google Scholar] [CrossRef] [PubMed]
  10. Sassi, M.; Nicotina, L.; Pall, P.; Stone, D.; Hilberts, A.; Wehner, M.; Jewson, S. Impact of climate change on European winter and summer flood losses. Adv. Water Resour. 2019, 129, 165–177. [Google Scholar] [CrossRef]
  11. Faccini, F.; Luino, F.; Paliaga, G.; Roccati, A.; Turconi, L. Flash Flood Events along the West Mediterranean Coasts: Inundations of Urbanized Areas Conditioned by Anthropic Impacts. Land 2021, 10, 620. [Google Scholar] [CrossRef]
  12. IPCC. Climate Change 2021: The physical science basis. In Contribution of Working Group, I to the Sixth Assessment Report of the Intergovernmental Panel on Climate Change; Cambridge University Press: Cambridge, UK, 2021. [Google Scholar]
  13. Myronidis, D.; Ioannou, K. Forecasting the urban expansion effects on the design storm hydrograph and sediment yield using artificial neural networks. Water 2018, 11, 31. [Google Scholar] [CrossRef]
  14. Zhang, K.; Shalehy, M.H.; Ezaz, G.T.; Chakraborty, A.; Mohib, K.M.; Liu, L. An integrated flood risk assessment approach based on coupled hydrological-hydraulic modeling and bottom-up hazard vulnerability analysis. Environ. Model. Softw. 2022, 148, 105279. [Google Scholar] [CrossRef]
  15. Myronidis, D.; Stathis, D.; Sapountzis, M. Post-Evaluation of flood hazards induced by former artificial interventions along a coastal Mediterranean settlement. J. Hydrol. Eng. 2016, 21, 05016022. [Google Scholar] [CrossRef]
  16. Hdeib, R.; Abdallah, C.; Colin, F.; Brocca, L.; Moussa, R. Constraining coupled hydrological-hydraulic flood model by past storm events and post-event measurements in data-sparse regions. J. Hydrol. 2018, 565, 160–176. [Google Scholar] [CrossRef]
  17. Senatore, A.; Davolio, S.; Furnari, L.; Mendicino, G. Reconstructing flood events in Mediterranean coastal areas using different reanalyses and high-resolution meteorological models. J. Hydrometeorol. 2020, 21, 1865–1887. [Google Scholar] [CrossRef]
  18. Petrović, A.M.; Novković, I.; Kostadinov, S. Hydrological analysis of the September 2014 torrential floods of the Danube tributaries in the Eastern Serbia. Nat. Hazards 2021, 108, 1373–1387. [Google Scholar] [CrossRef]
  19. Tegos, A.; Ziogas, A.; Bellos, V.; Tzimas, A. Forensic Hydrology: A Complete Reconstruction of an Extreme Flood Event in Data-Scarce Area. Hydrology 2022, 9, 93. [Google Scholar] [CrossRef]
  20. Andreadakis, E.; Diakakis, M.; Vassilakis, E.; Deligiannakis, G.; Antoniadis, A.; Andriopoulos, P.; Spyrou, N.I.; Nikolopoulos, E.I. Unmanned aerial systems-aided post-flood peak discharge estimation in ephemeral streams. Remote Sens. 2020, 12, 4183. [Google Scholar] [CrossRef]
  21. Vélez-Nicolás, M.; García-López, S.; Barbero, L.; Ruiz-Ortiz, V.; Sánchez-Bellón, Á. Applications of Unmanned Aerial Systems (UASs) in hydrology: A review. Remote Sens. 2021, 13, 1359. [Google Scholar] [CrossRef]
  22. Furnari, L.; Mendicino, G.; Senatore, A. Hydrometeorological ensemble forecast of a highly localized convective event in the Mediterranean. Water 2020, 12, 1545. [Google Scholar] [CrossRef]
  23. Spyrou, C.; Varlas, G.; Pappa, A.; Mentzafou, A.; Katsafados, P.; Papadopoulos, A.; Anagnostou, M.N.; Kalogiros, J. Implementation of a nowcasting hydrometeorological system for studying flash flood events: The case of Mandra, Greece. Remote Sens. 2020, 12, 2784. [Google Scholar] [CrossRef]
  24. Bournas, A.; Baltas, E. Investigation of the Gridded Flash Flood Guidance in a Peri-Urban Basin in Greater Athens area, Greece. J. Hydrol. 2022, 610, 127820. [Google Scholar] [CrossRef]
  25. Nachappa, T.G.; Piralilou, S.T.; Gholamnia, K.; Ghorbanzadeh, O.; Rahmati, O.; Blaschke, T. Flood susceptibility mapping with machine learning, multi-criteria decision analysis and ensemble using Dempster Shafer Theory. J. Hydrol. 2020, 590, 125275. [Google Scholar] [CrossRef]
  26. Costache, R.; Pham, Q.B.; Sharifi, E.; Linh, N.T.T.; Abba, S.I.; Vojtek, M.; Vojteková, J.; Nhi, P.T.T.; Khoi, D.N. Flash-flood susceptibility assessment using multi-criteria decision making and machine learning supported by remote sensing and GIS techniques. Remote Sens. 2020, 12, 106. [Google Scholar] [CrossRef]
  27. Pourghasemi, H.R.; Kariminejad, N.; Amiri, M.; Edalat, M.; Zarafshar, M.; Blaschke, T.; Cerda, A. Assessing and mapping multi-hazard risk susceptibility using a machine learning technique. Sci. Rep. 2020, 10, 3203. [Google Scholar] [CrossRef] [PubMed]
  28. Abedi, R.; Costache, R.; Shafizadeh-Moghadam, H.; Pham, Q.B. Flash-flood susceptibility mapping based on XGBoost, random forest and boosted regression trees. Geocarto Int. 2021, 1–18. [Google Scholar] [CrossRef]
  29. Pant, R.; Thacker, S.; Hall, J.W.; Alderson, D.; Barr, S. Critical infrastructure impact assessment due to flood exposure. J. Flood Risk Manag. 2018, 11, 22–33. [Google Scholar] [CrossRef]
  30. Qiang, Y. Flood exposure of critical infrastructures in the United States. Int. J. Disaster Risk Reduct. 2019, 39, 101240. [Google Scholar] [CrossRef]
  31. Argyroudis, S.A.; Mitoulis, S.A.; Winter, M.G.; Kaynia, A.M. Fragility of transport assets exposed to multiple hazards: State-of-the-art review toward infrastructural resilience. Reliab. Eng. Syst. Saf. 2019, 191, 106567. [Google Scholar] [CrossRef]
  32. Papilloud, T.; Keiler, M. Vulnerability patterns of road network to extreme floods based on accessibility measures. Transp. Res. Part D Transp. Environ. 2021, 100, 103045. [Google Scholar] [CrossRef]
  33. Beck, H.E.; Zimmermann, N.E.; McVicar, T.R.; Vergopolan, N.; Berg, A.; Wood, E.F. Present and future Köppen-Geiger climate classification maps at 1-km resolution. Sci. Data 2018, 5, 180214. [Google Scholar] [CrossRef] [PubMed]
  34. Livada, I.; Charalambous, G.; Assimakopoulos, M.N. Spatial and temporal study of precipitation characteristics over Greece. Theor. Appl. Climatol. 2008, 93, 45–55. [Google Scholar] [CrossRef]
  35. Markonis, Y.; Batelis, S.C.; Dimakos, Y.; Moschou, E.; Koutsoyiannis, D. Temporal and spatial variability of rainfall over Greece. Theor. Appl. Climatol. 2017, 130, 217–232. [Google Scholar] [CrossRef]
  36. Nastos, P.T.; Politi, N.; Kapsomenakis, J. Spatial and temporal variability of the Aridity Index in Greece. Atmos. Res. 2013, 119, 140–152. [Google Scholar] [CrossRef]
  37. Diakakis, M.; Mavroulis, S.; Deligiannakis, G. Floods in Greece, a statistical and spatial approach. Nat. Hazards 2012, 62, 485–500. [Google Scholar] [CrossRef]
  38. Koks, E.E.; Jongman, B.; Husby, T.G.; Botzen, W.J. Combining hazard, exposure and social vulnerability to provide lessons for flood risk management. Environ. Sci. Policy 2015, 47, 42–52. [Google Scholar] [CrossRef]
  39. Barrington-Leigh, C.; Millard-Ball, A. The world’s user-generated road map is more than 80% complete. PLoS ONE 2017, 12, e0180698. [Google Scholar] [CrossRef]
  40. Papagiannaki, K.; Petrucci, O.; Diakakis, M.; Kotroni, V.; Aceto, L.; Bianchi, C.; Brázdil, R.; Gelabert, M.G.; Inbar, M.; Kahraman, A.; et al. Developing a large-scale dataset of flood fatalities for territories in the Euro-Mediterranean region, FFEM-DB. Sci. Data 2022, 9, 166. [Google Scholar] [CrossRef]
  41. Diakakis, M. Characteristics of Infrastructure and Surrounding Geo-Environmental Circumstances Involved in Fatal Incidents Caused by Flash Flooding: Evidence from Greece. Water 2022, 14, 746. [Google Scholar] [CrossRef]
  42. Stefanidis, S.; Stathis, D. Assessment of flood hazard based on natural and anthropogenic factors using analytic hierarchy process (AHP). Nat. Hazards 2013, 68, 569–585. [Google Scholar] [CrossRef]
  43. Mitsopoulos, I.; Mallinis, G.; Dimitrakopoulos, A.; Xanthopoulos, G.; Eftychidis, G.; Goldammer, J.G. Vulnerability of peri-urban and residential areas to landscape fires in Greece: Evidence by wildland-urban interface data. Data Brief 2020, 31, 106025. [Google Scholar] [CrossRef] [PubMed]
  44. Mitsopoulos, I.; Eftychidis, G.; Papathanasiou, C.; Makropoulos, C.; Mimikou, M. Assessing post fire flood risk potential in a typical Mediterranean Wildland-Urban Interface of Greece. In Proceedings of the International Conference on Changing Cities II Spatial, Design, Landscape & Socio-Economic Dimensions, Porto Heli, Peloponnese, Greece, 22–26 June 2015; pp. 1127–1135. [Google Scholar]
  45. Karkani, A.; Evelpidou, N.; Tzouxanioti, M.; Petropoulos, A.; Santangelo, N.; Maroukian, H.; Spyrou, E.; Lakidi, L. Flash Flood Susceptibility Evaluation in Human-Affected Areas Using Geomorphological Methods—The Case of 9 August 2020, Euboea, Greece. A GIS-Based Approach. GeoHazards 2021, 2, 366–382. [Google Scholar] [CrossRef]
  46. Wu, Z.; Lv, H.; Meng, Y.; Guan, X.; Zang, Y. The determination of flood damage curve in areas lacking disaster data based on the optimization principle of variation coefficient and beta distribution. Sci. Total Environ. 2021, 750, 142277. [Google Scholar] [CrossRef]
  47. Pregnolato, M. Bridge safety is not for granted–A novel approach to bridge management. Eng. Struct. 2019, 196, 109193. [Google Scholar] [CrossRef]
  48. Sohn, J. Evaluating the significance of highway network links under the flood damage: An accessibility approach. Transp. Res. Part A Policy Pract. 2006, 40, 491–506. [Google Scholar] [CrossRef]
  49. Ahmed, M.A.; Haynes, K.; Taylor, M. Vehicle-related flood fatalities in Australia, 2001–2017. J. Flood Risk Manag. 2020, 13, e12616. [Google Scholar] [CrossRef]
  50. Petrucci, O. Factors leading to the occurrence of flood fatalities: A systematic review of research papers published between 2010 and 2020. Nat. Hazards Earth Syst. Sci. 2022, 22, 71–83. [Google Scholar] [CrossRef]
  51. Diakakis, M.; Deligiannakis, G. Vehicle-related flood fatalities in Greece. Environ. Hazards 2013, 12, 278–290. [Google Scholar] [CrossRef]
  52. Hamilton, K.; Peden, A.E.; Pearson, M.; Hagger, M.S. Stop there’s water on the road! Identifying key beliefs guiding people’s willingness to drive through flooded waterways. Saf. Sci. 2016, 89, 308–314. [Google Scholar] [CrossRef]
  53. Argyroudis, S.A.; Mitoulis, S.A.; Hofer, L.; Zanini, M.A.; Tubaldi, E.; Frangopol, D.M. Resilience assessment framework for critical infrastructure in a multi-hazard environment: Case study on transport assets. Sci. Total Environ. 2020, 714, 136854. [Google Scholar] [CrossRef]
  54. Karatzetzou, A.; Stefanidis, S.; Stefanidou, S.; Tsinidis, G.; Pitilakis, D. Unified hazard models for risk assessment of transportation networks in a multi-hazard environment. Int. J. Disaster Risk Reduct. 2022, 75, 102960. [Google Scholar] [CrossRef]
  55. Kousky, C.; Kunreuther, H.; LaCour-Little, M.; Wachter, S. Flood risk and the US housing market. J. Hous. Res. 2020, 29 (Suppl. S1), S3–S24. [Google Scholar] [CrossRef]
  56. Luke, A.; Sanders, B.F.; Goodrich, K.A.; Feldman, D.L.; Boudreau, D.; Eguiarte, A.; Serrano, K.; Reyes, A.; Schubert, J.E.; AghaKouchak, A.; et al. Going beyond the flood insurance rate map: Insights from flood hazard map co-production. Nat. Hazards Earth Syst. Sci. 2018, 18, 1097–1120. [Google Scholar] [CrossRef]
  57. Rehman, S.; Sahana, M.; Hong, H.; Sajjad, H.; Ahmed, B.B. A systematic review on approaches and methods used for flood vulnerability assessment: Framework for future research. Nat. Hazards 2019, 96, 975–998. [Google Scholar] [CrossRef]
  58. Raška, P.; Bezak, N.; Ferreira, C.S.S.; Kalantari, Z.; Banasik, K.; Bertola, M.; Bourke, M.; Cerdà, A.; Davids, P.; de Brito, M.M.; et al. Identifying barriers for nature-based solutions in flood risk management: An interdisciplinary overview using expert community approach. J. Environ. Manag. 2022, 310, 114725. [Google Scholar] [CrossRef]
  59. Lallemant, D.; Hamel, P.; Balbi, M.; Lim, T.N.; Schmitt, R.; Win, S. Nature-based solutions for flood risk reduction: A probabilistic modeling framework. One Earth 2021, 4, 1310–1321. [Google Scholar] [CrossRef]
Figure 1. Location map of the study.
Hydrology 09 00145 g001
Figure 2. The overall workflow of the methodology.
Hydrology 09 00145 g002
Figure 3. Spatial distribution of flood extent zones coverage per NUTS 3 in Greece.
Hydrology 09 00145 g003
Figure 4. Spatial destitution of flood fatalities at the NUTS 3 level over Greece.
Hydrology 09 00145 g004
Figure 5. The ratios of residential areas and infrastructure located in flood zones in Greece.
Hydrology 09 00145 g005
Figure 6. Spatial distribution of the ratio of industrial and commercial units in flood zones per NUTS 3.
Hydrology 09 00145 g006
Figure 7. Graphical representation of the ratio of industrial and commercial units in flood zones per NUTS 3 in descending order.
Hydrology 09 00145 g007
Figure 8. Spatial distribution of the ratio of transportation infrastructure in flood zones per NUTS 3.
Hydrology 09 00145 g008
Figure 9. Graphical representation of the ratio of transportation infrastructure in flood zones per NUTS 3 in descending order.
Hydrology 09 00145 g009
Figure 10. Spatial distribution of the ratio of the urban fabric in flood zones per NUTS 3.
Hydrology 09 00145 g010
Figure 11. Graphical representation of the ratio of the urban fabric in flood zones per NUTS 3 in descending order.
Hydrology 09 00145 g011
Figure 12. Spatial distribution of the ratio of social infrastructure in flood zones per NUTS 3.
Hydrology 09 00145 g012
Figure 13. Graphical representation of the ratio of social infrastructure in flood zones per NUTS 3 in descending order.
Hydrology 09 00145 g013
Table 1. Summary of the input datasets and sources used in this study.
DataDatasetData SourceData AccessibilityFormat
Urban FabricCorine Land Cover (CLC 2018)Copernicus Land Monitoring Servicehttps://land.copernicus.eu/pan-european/corine-land-cover/clc2018?tab=download
(accessed on 10 October 2021)
vector
Industrial and Commercial Unitsvector
Transportation InfrastructureOpenStreetMap
(OSM)
Geofabrik Download Serverhttps://download.geofabrik.de/europe/greece.html
(accessed on 1 April 2022)
vector
Social
Infrastructure
vector
Flood Fatalities Historical RecordsFlood Fatalities of the Euro-Mediterranean region Database (FFEM-DB)4TU Centre for Research Datahttps://data.4tu.nl/articles/dataset/EUFF_2_0_European_Flood_Fatalities_database_/14754999/2
(accessed on 1 April 2022)
csv
Flood Extent ZonesFlood Risk Management Plans
(2007/60/EC)
Hellenic Ministry of Environment and Energy (Special Secretary for Water)http://floods.ypeka.gr:8080/geoserver/frmc2018100/wfs?
(accessed on 15 November 2020)
vector
Nomenclature of Territorial Units for Statistics—level 3 (NUTS 3)EurostatGeographic Information System of the Commission
(GISCO)
https://ec.europa.eu/eurostat/web/gisco/geodata/reference-data/administrative-units-statistical-units/nuts
(accessed on 1 April 2022)
vector
Publisher’s Note: MDPI stays neutral with regard to jurisdictional claims in published maps and institutional affiliations.

