
Flood Risk in Urban Areas: Modelling, Management and Adaptation to Climate Change. A Review


Abstract
:1. Introduction
2. Modelling and Evaluation of Flood Risk
2.1. Modelling Flood Hazard
2.2. Evaluation of River-Flood Risk in Urban Areas
2.3. Evaluation of Pluvial-Flood Risk in Urban Areas
2.4. Estimation and Quantification of Vulnerability
3. Flood-Risk Management
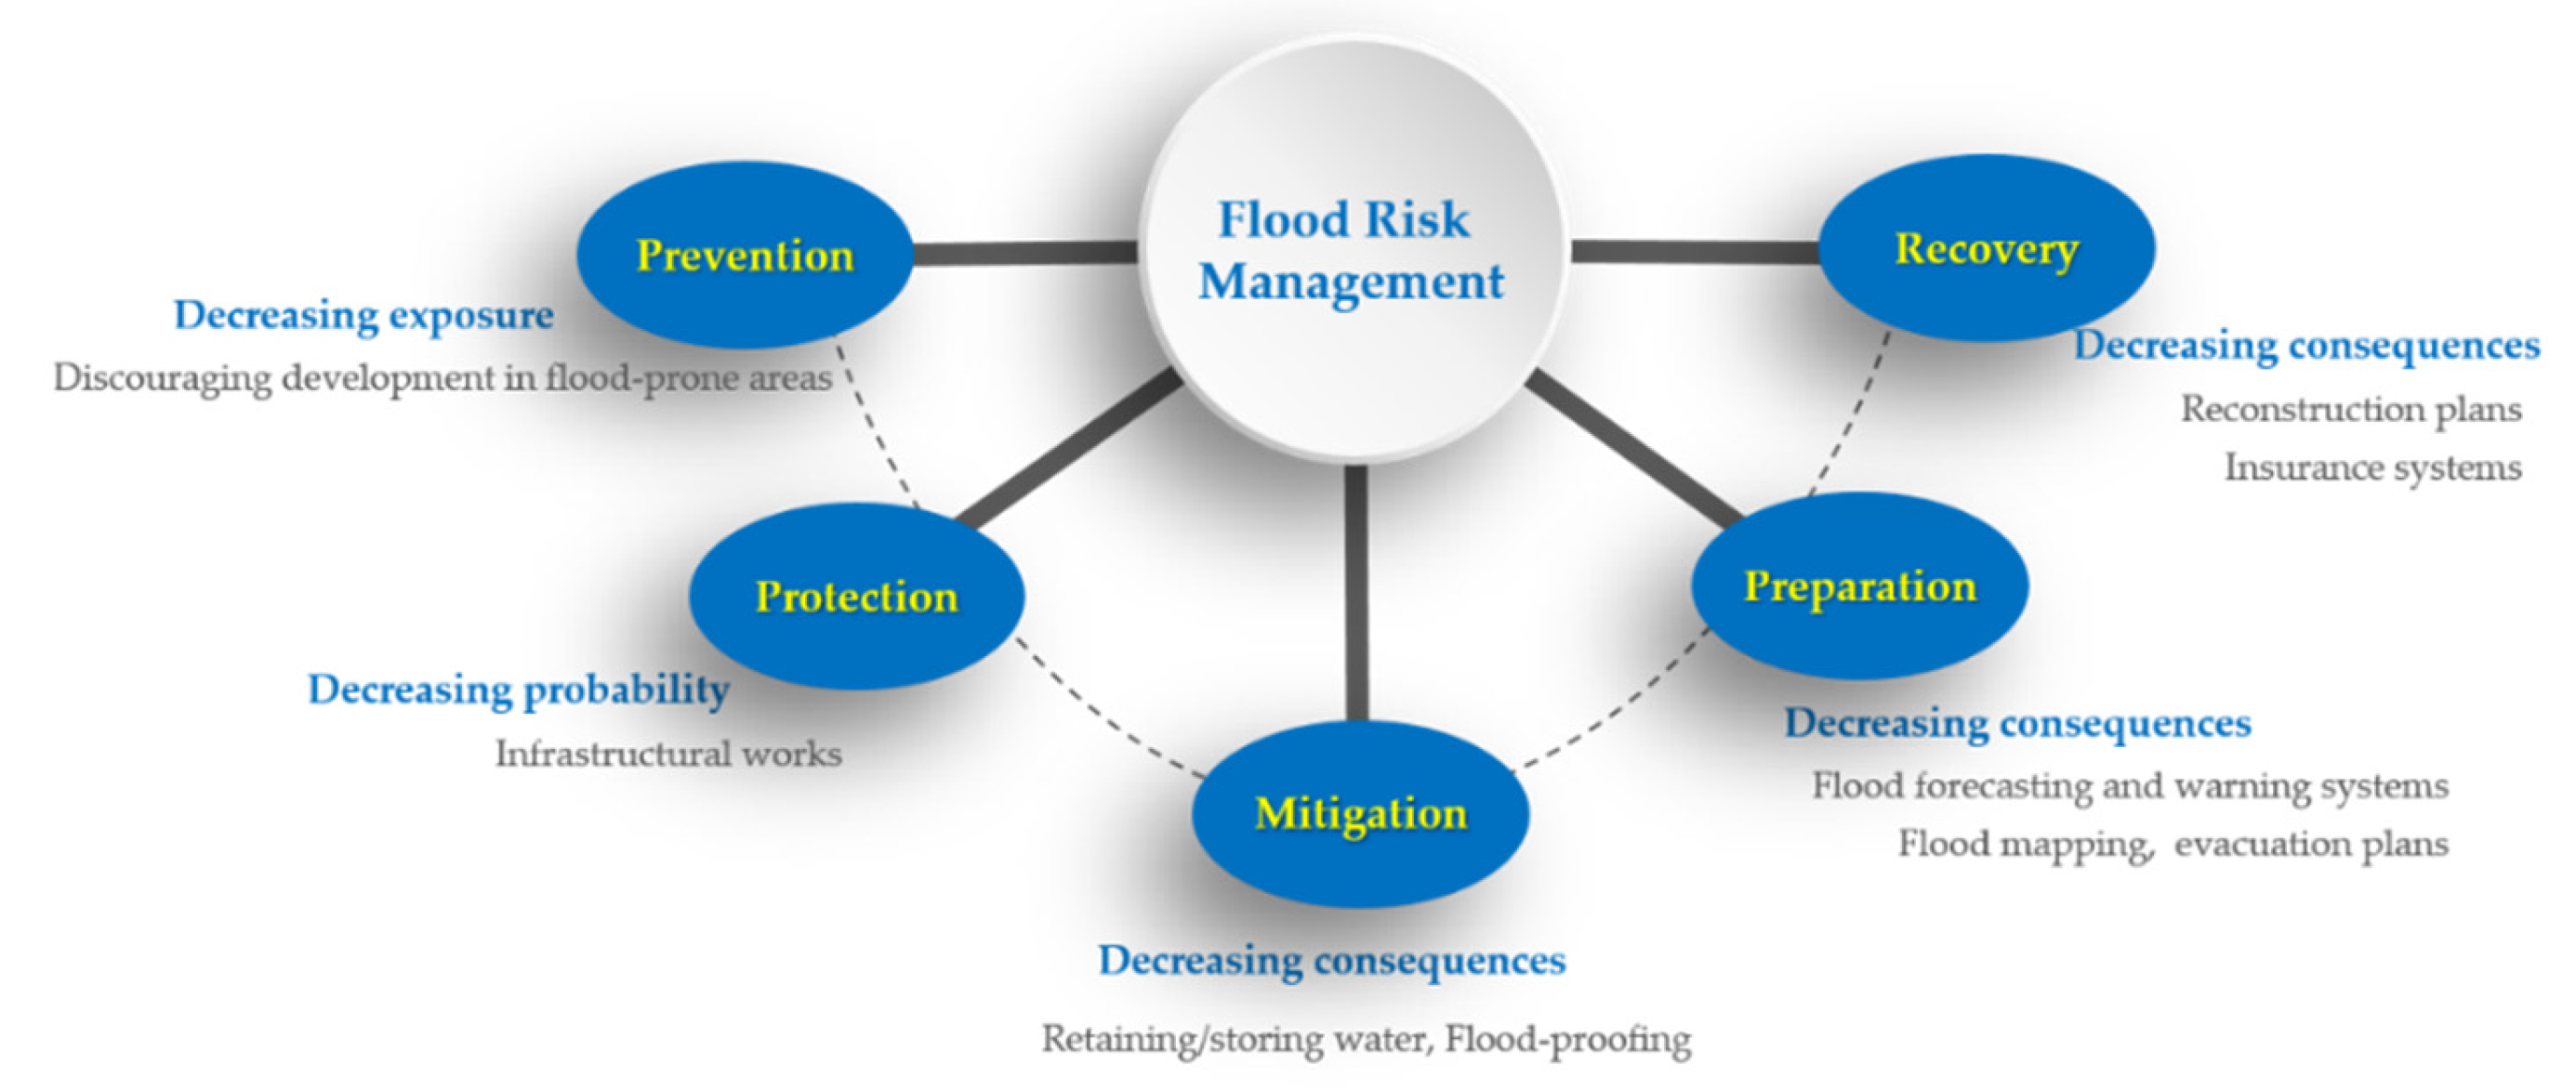
3.1. Moving from Resistance-Based towards Risk-Based Approaches
- (1)
- Flood-risk prevention is based on measures aimed at decreasing the exposure of people/property by methods that prohibit or discourage development in areas that are at risk of flooding (e.g., spatial planning, re-allotment, expropriations, etc.). The main focus is on “keeping people away from water” by only building outside flood-prone areas. This is a proactive strategy that focuses both on probability reduction and on the consequences of flooding.
- (2)
- Flood protection aims to decrease the probability of flooding areas through engineering works, mostly referred to as flood-control measures. This view is based on “keeping water away from people”.
- (3)
- Flood-risk mitigation focuses on decreasing the consequences of floods through measures within the vulnerable area. Consequences can be moderated by a smart design of the flood-prone area. Flood-risk mitigation includes all measures to flood-proof the built environment as well as measures to retain or store water.
- (4)
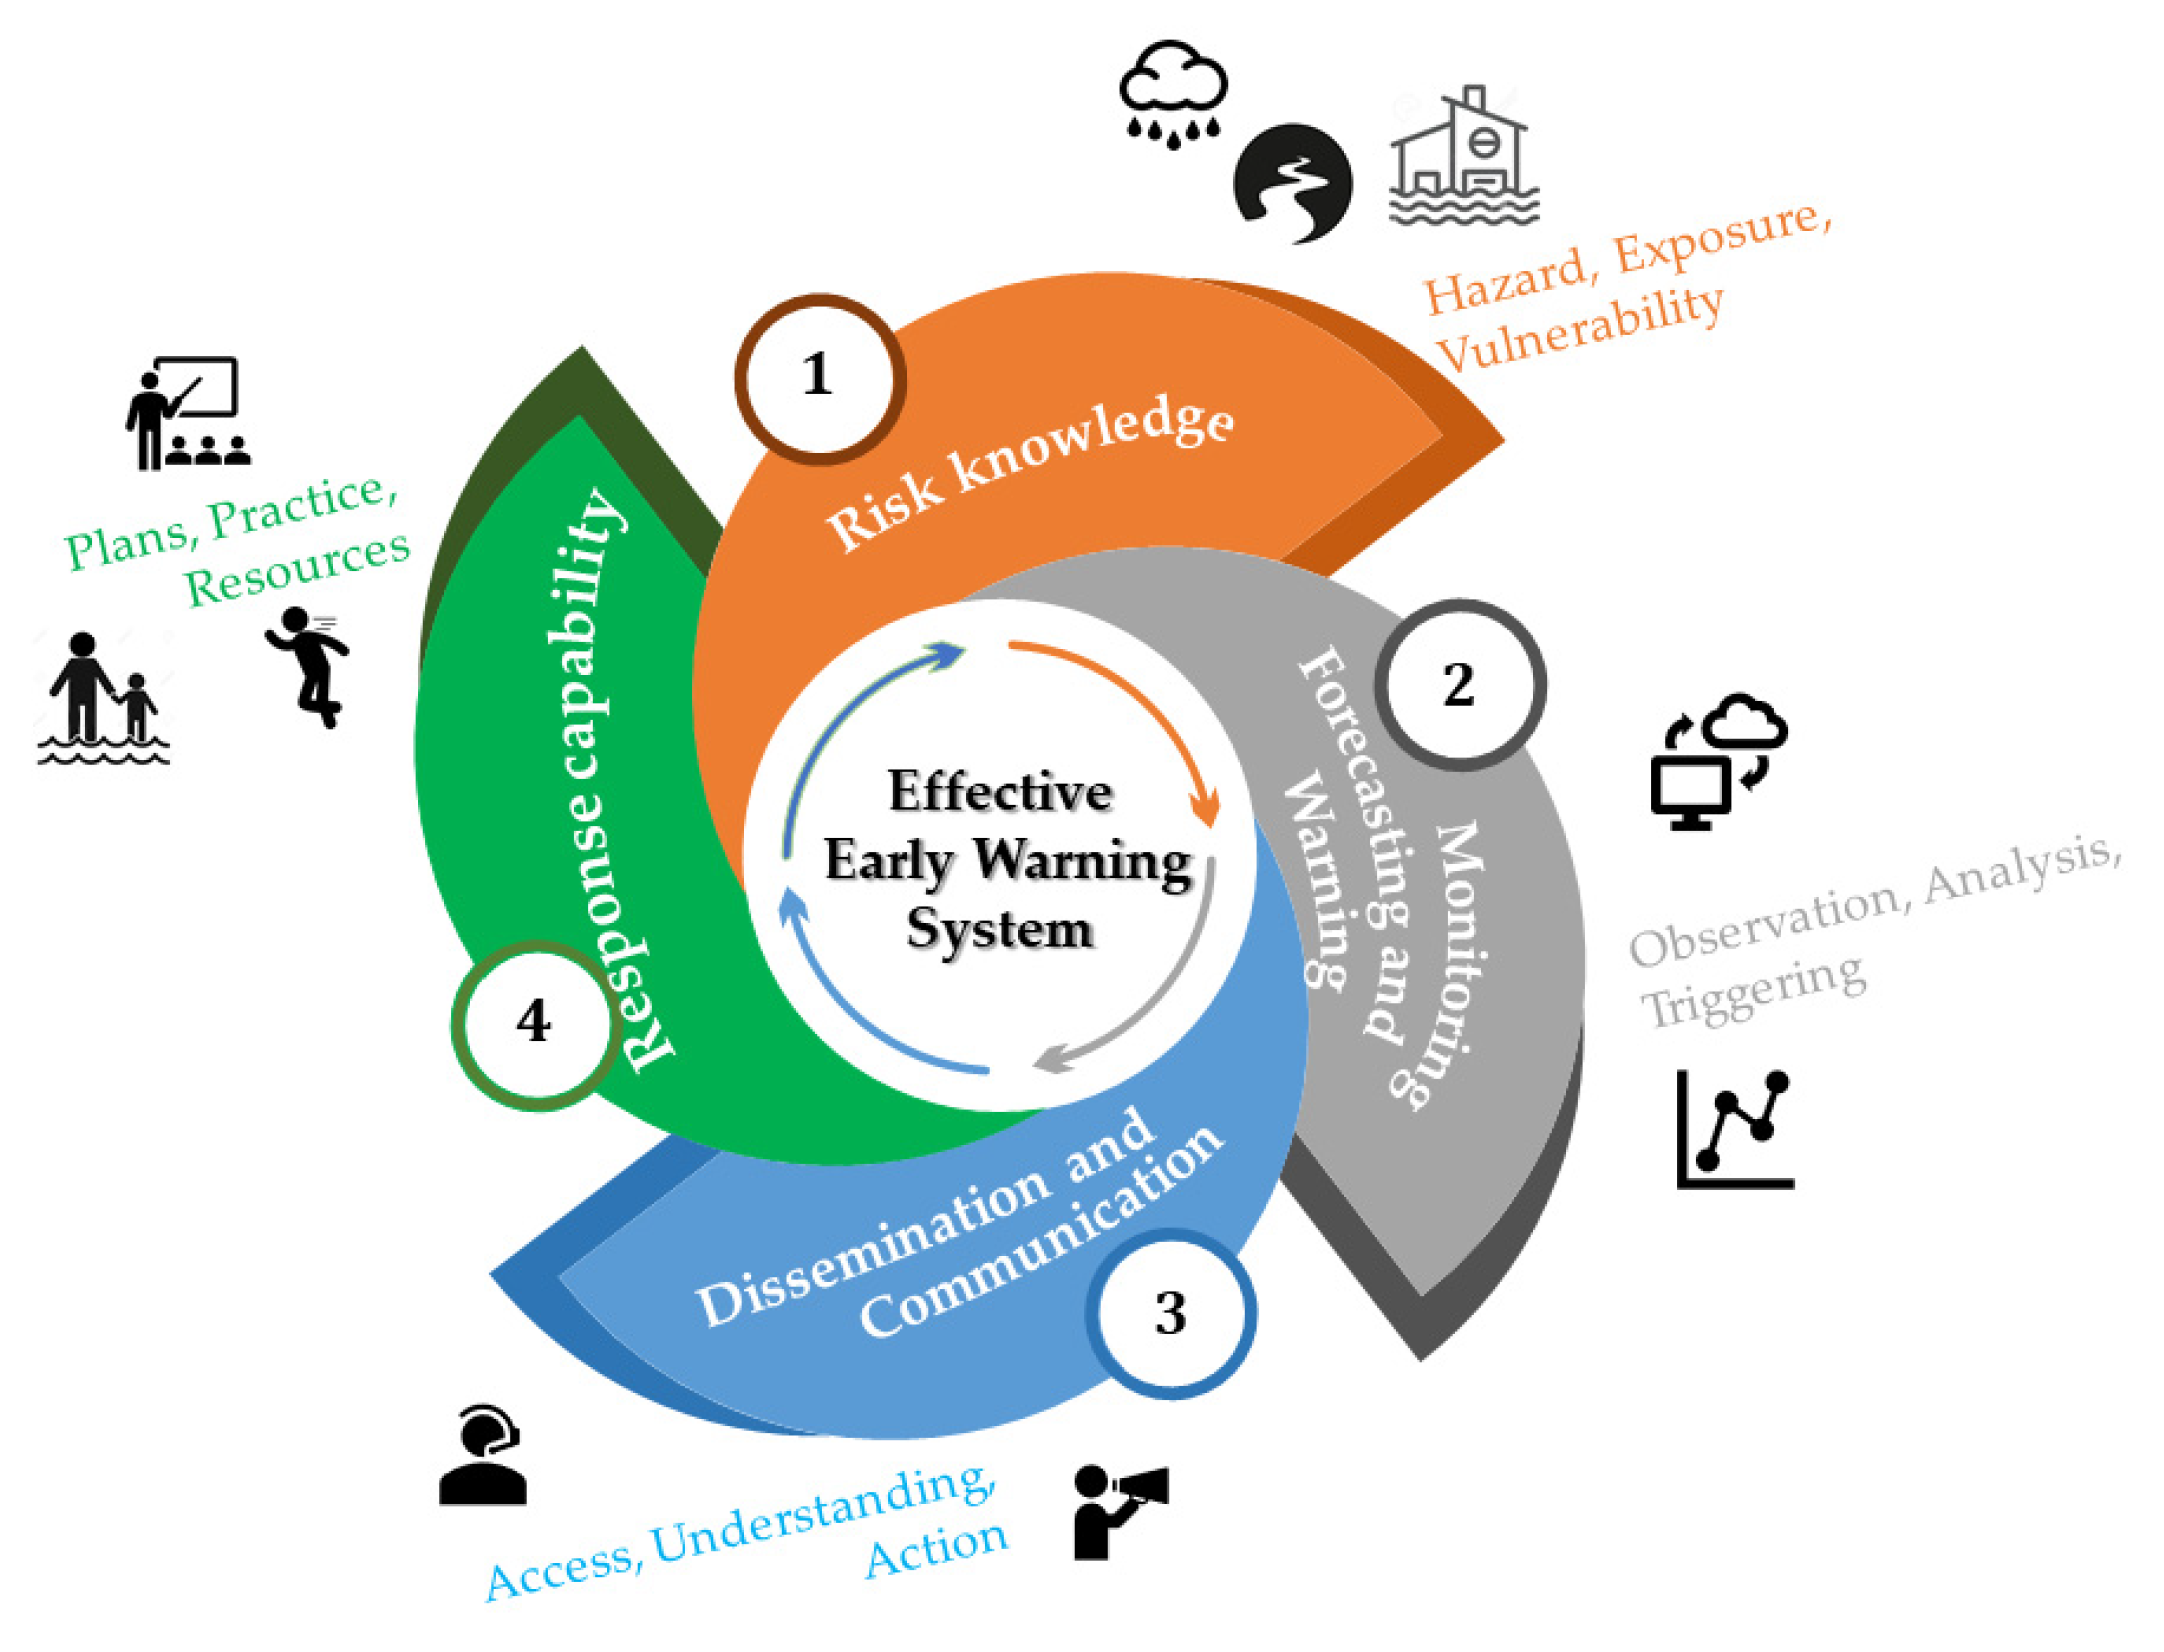
- Flood preparation: Consequences of floods can also be alleviated by being prepared for a flood event. Measures include developing flood forecasting and early-warning systems, as well as preparing disaster-management and evacuation plans.
- (5)
- Flood recovery facilitates an effective return to normality after a flood event. Measures include reconstruction or rebuilding plans as well as compensation or insurance systems.
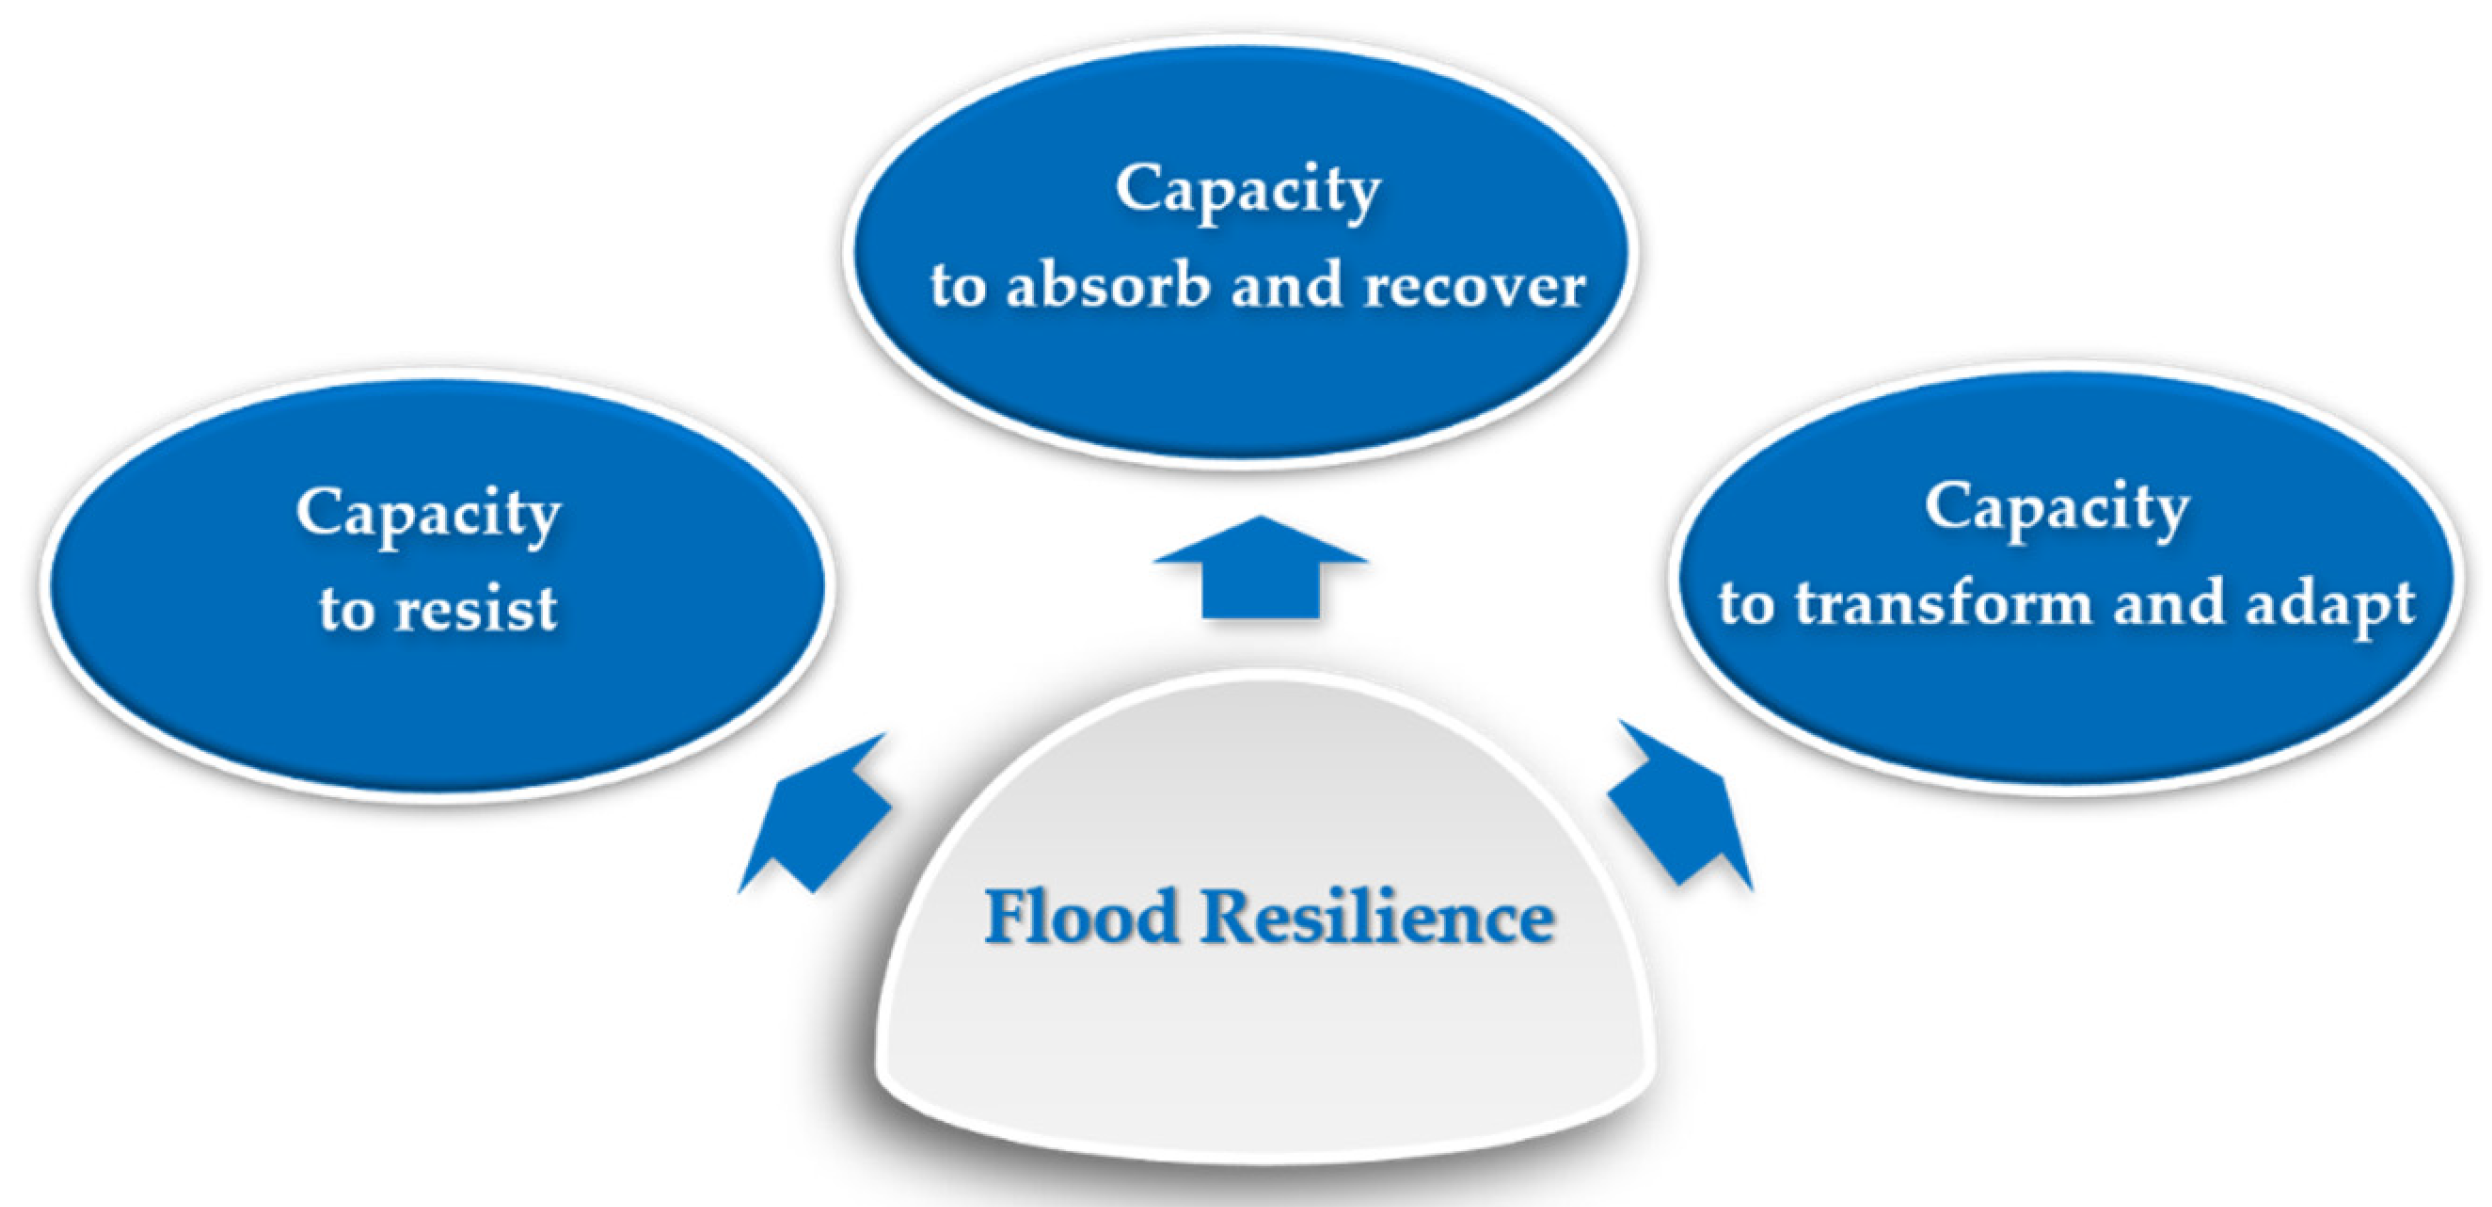
3.2. Flood Resilience
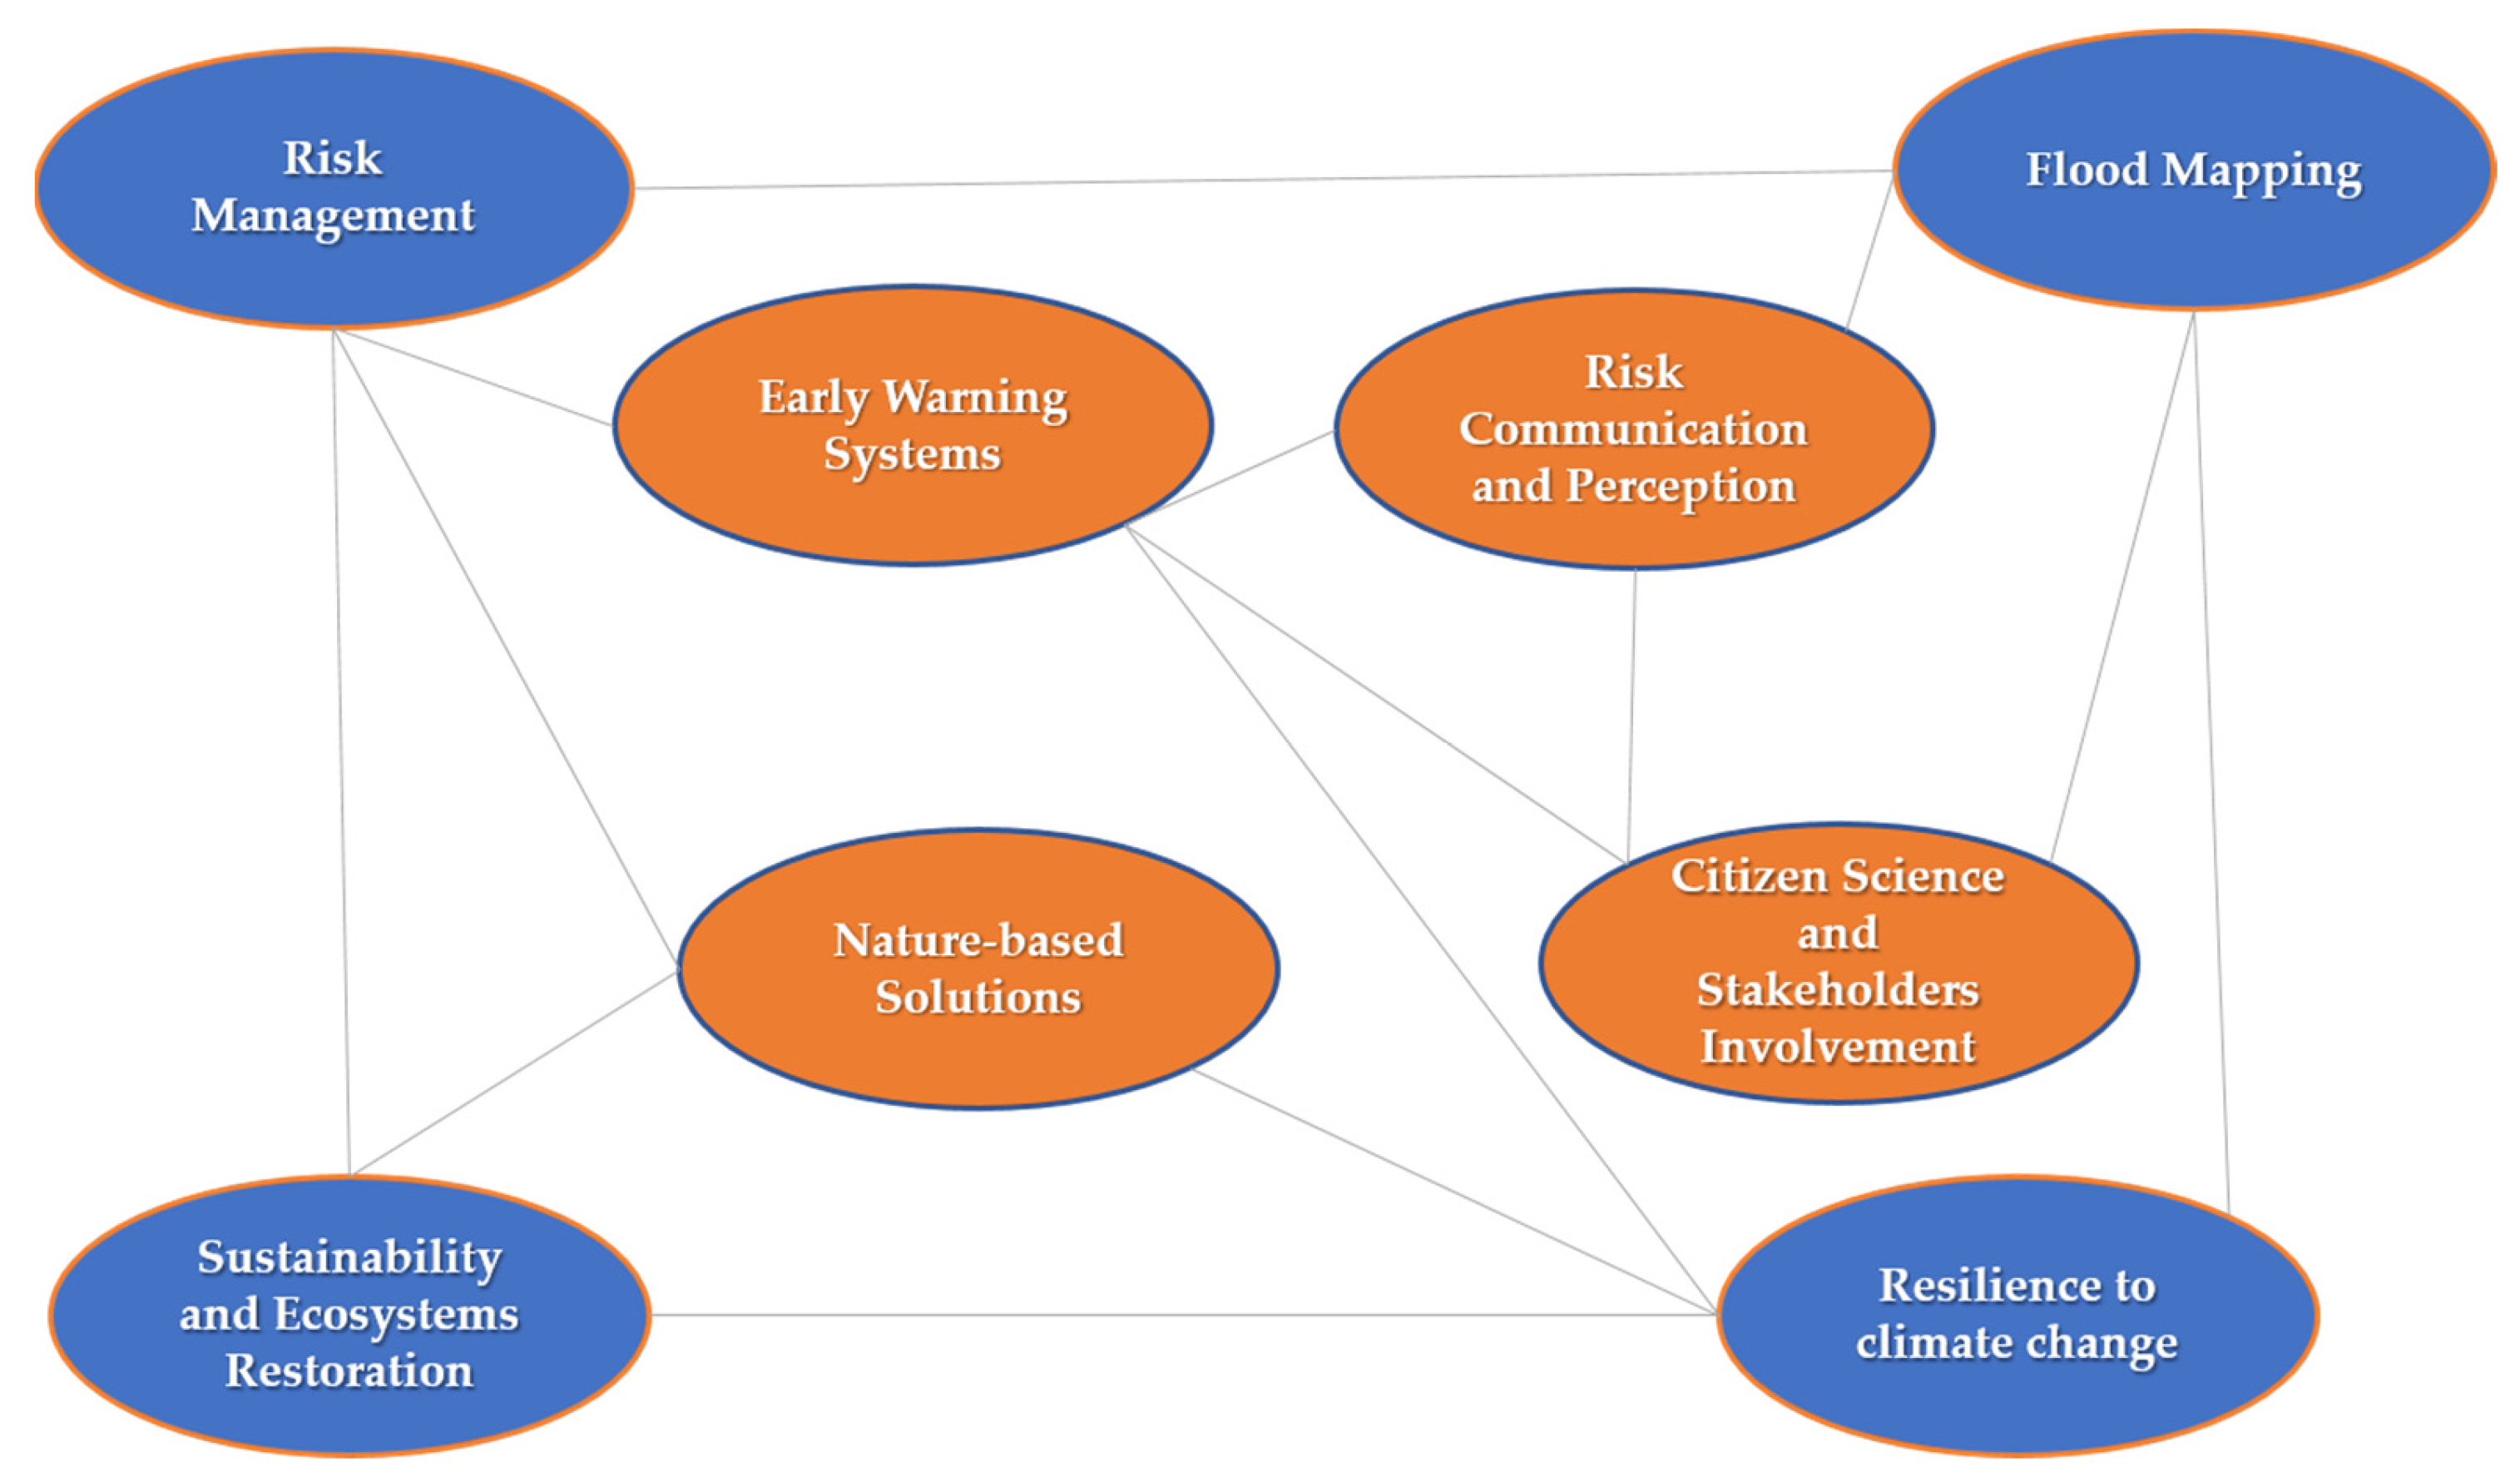
3.3. Recent Trends in Flood-Risk Management and Flood Resilience
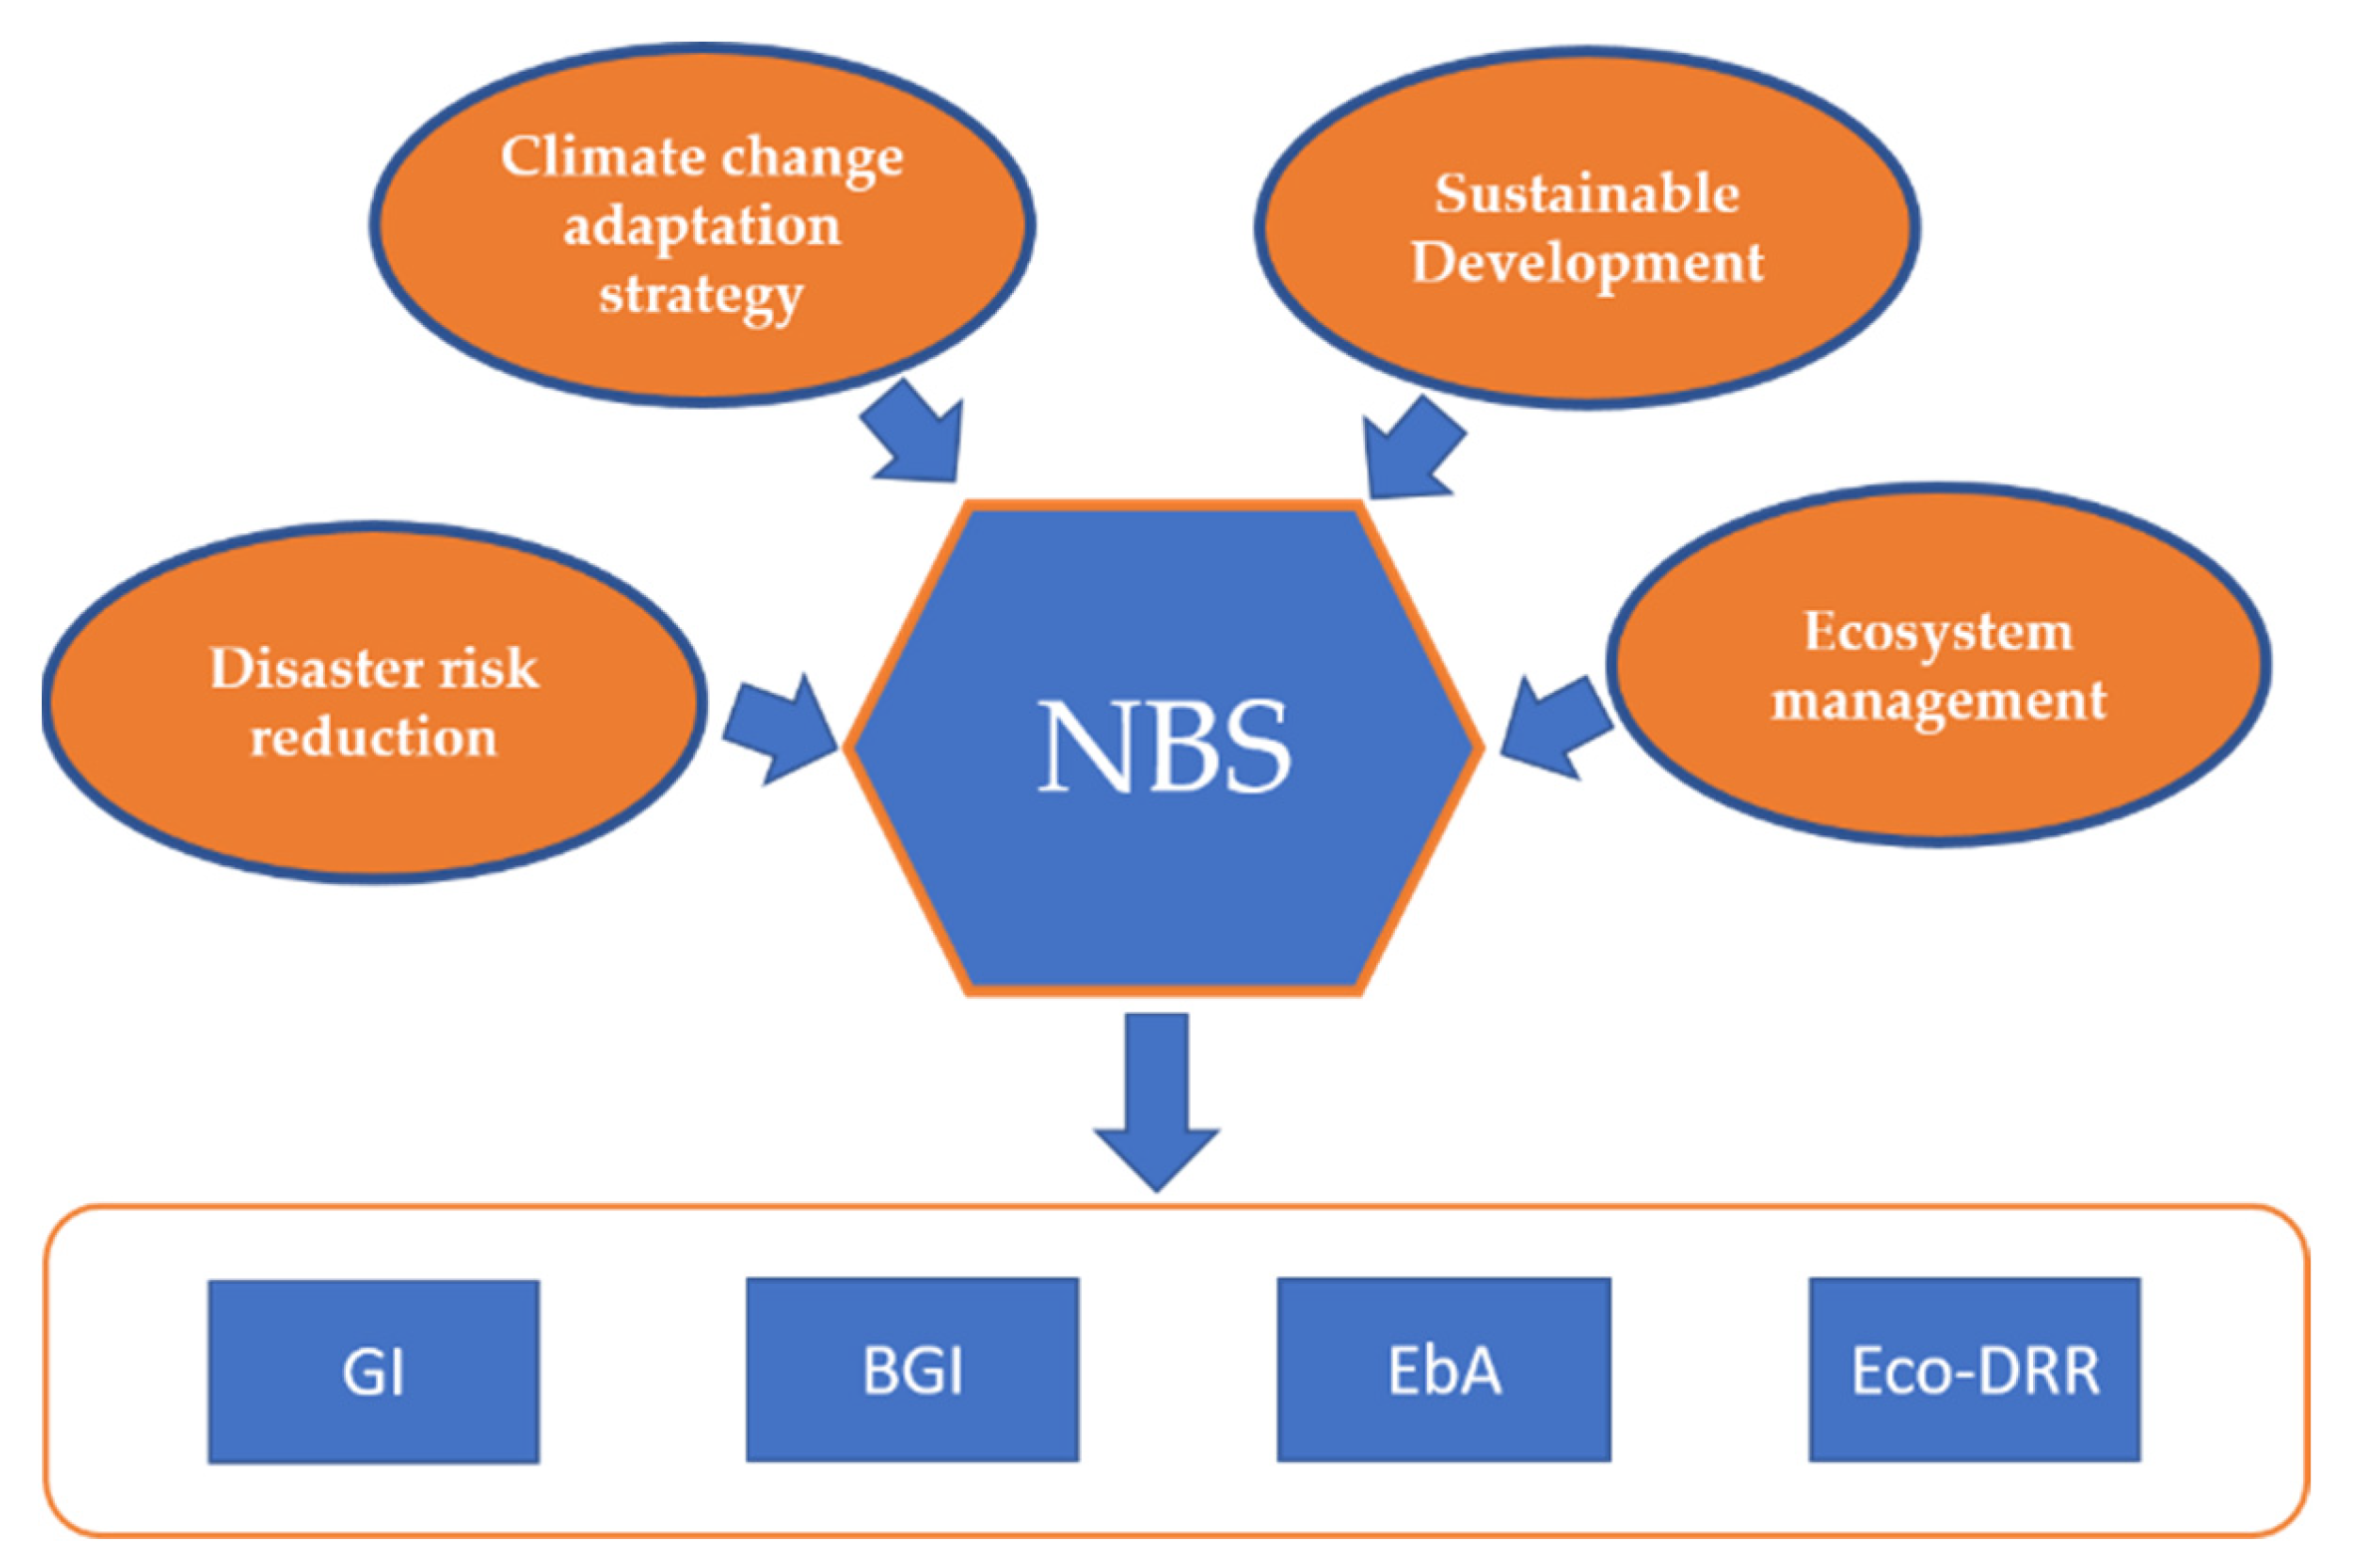
3.3.1. Nature-Based Solutions
3.3.2. Preparedness and Early-Warning Systems
3.3.3. Risk Communication and Perception
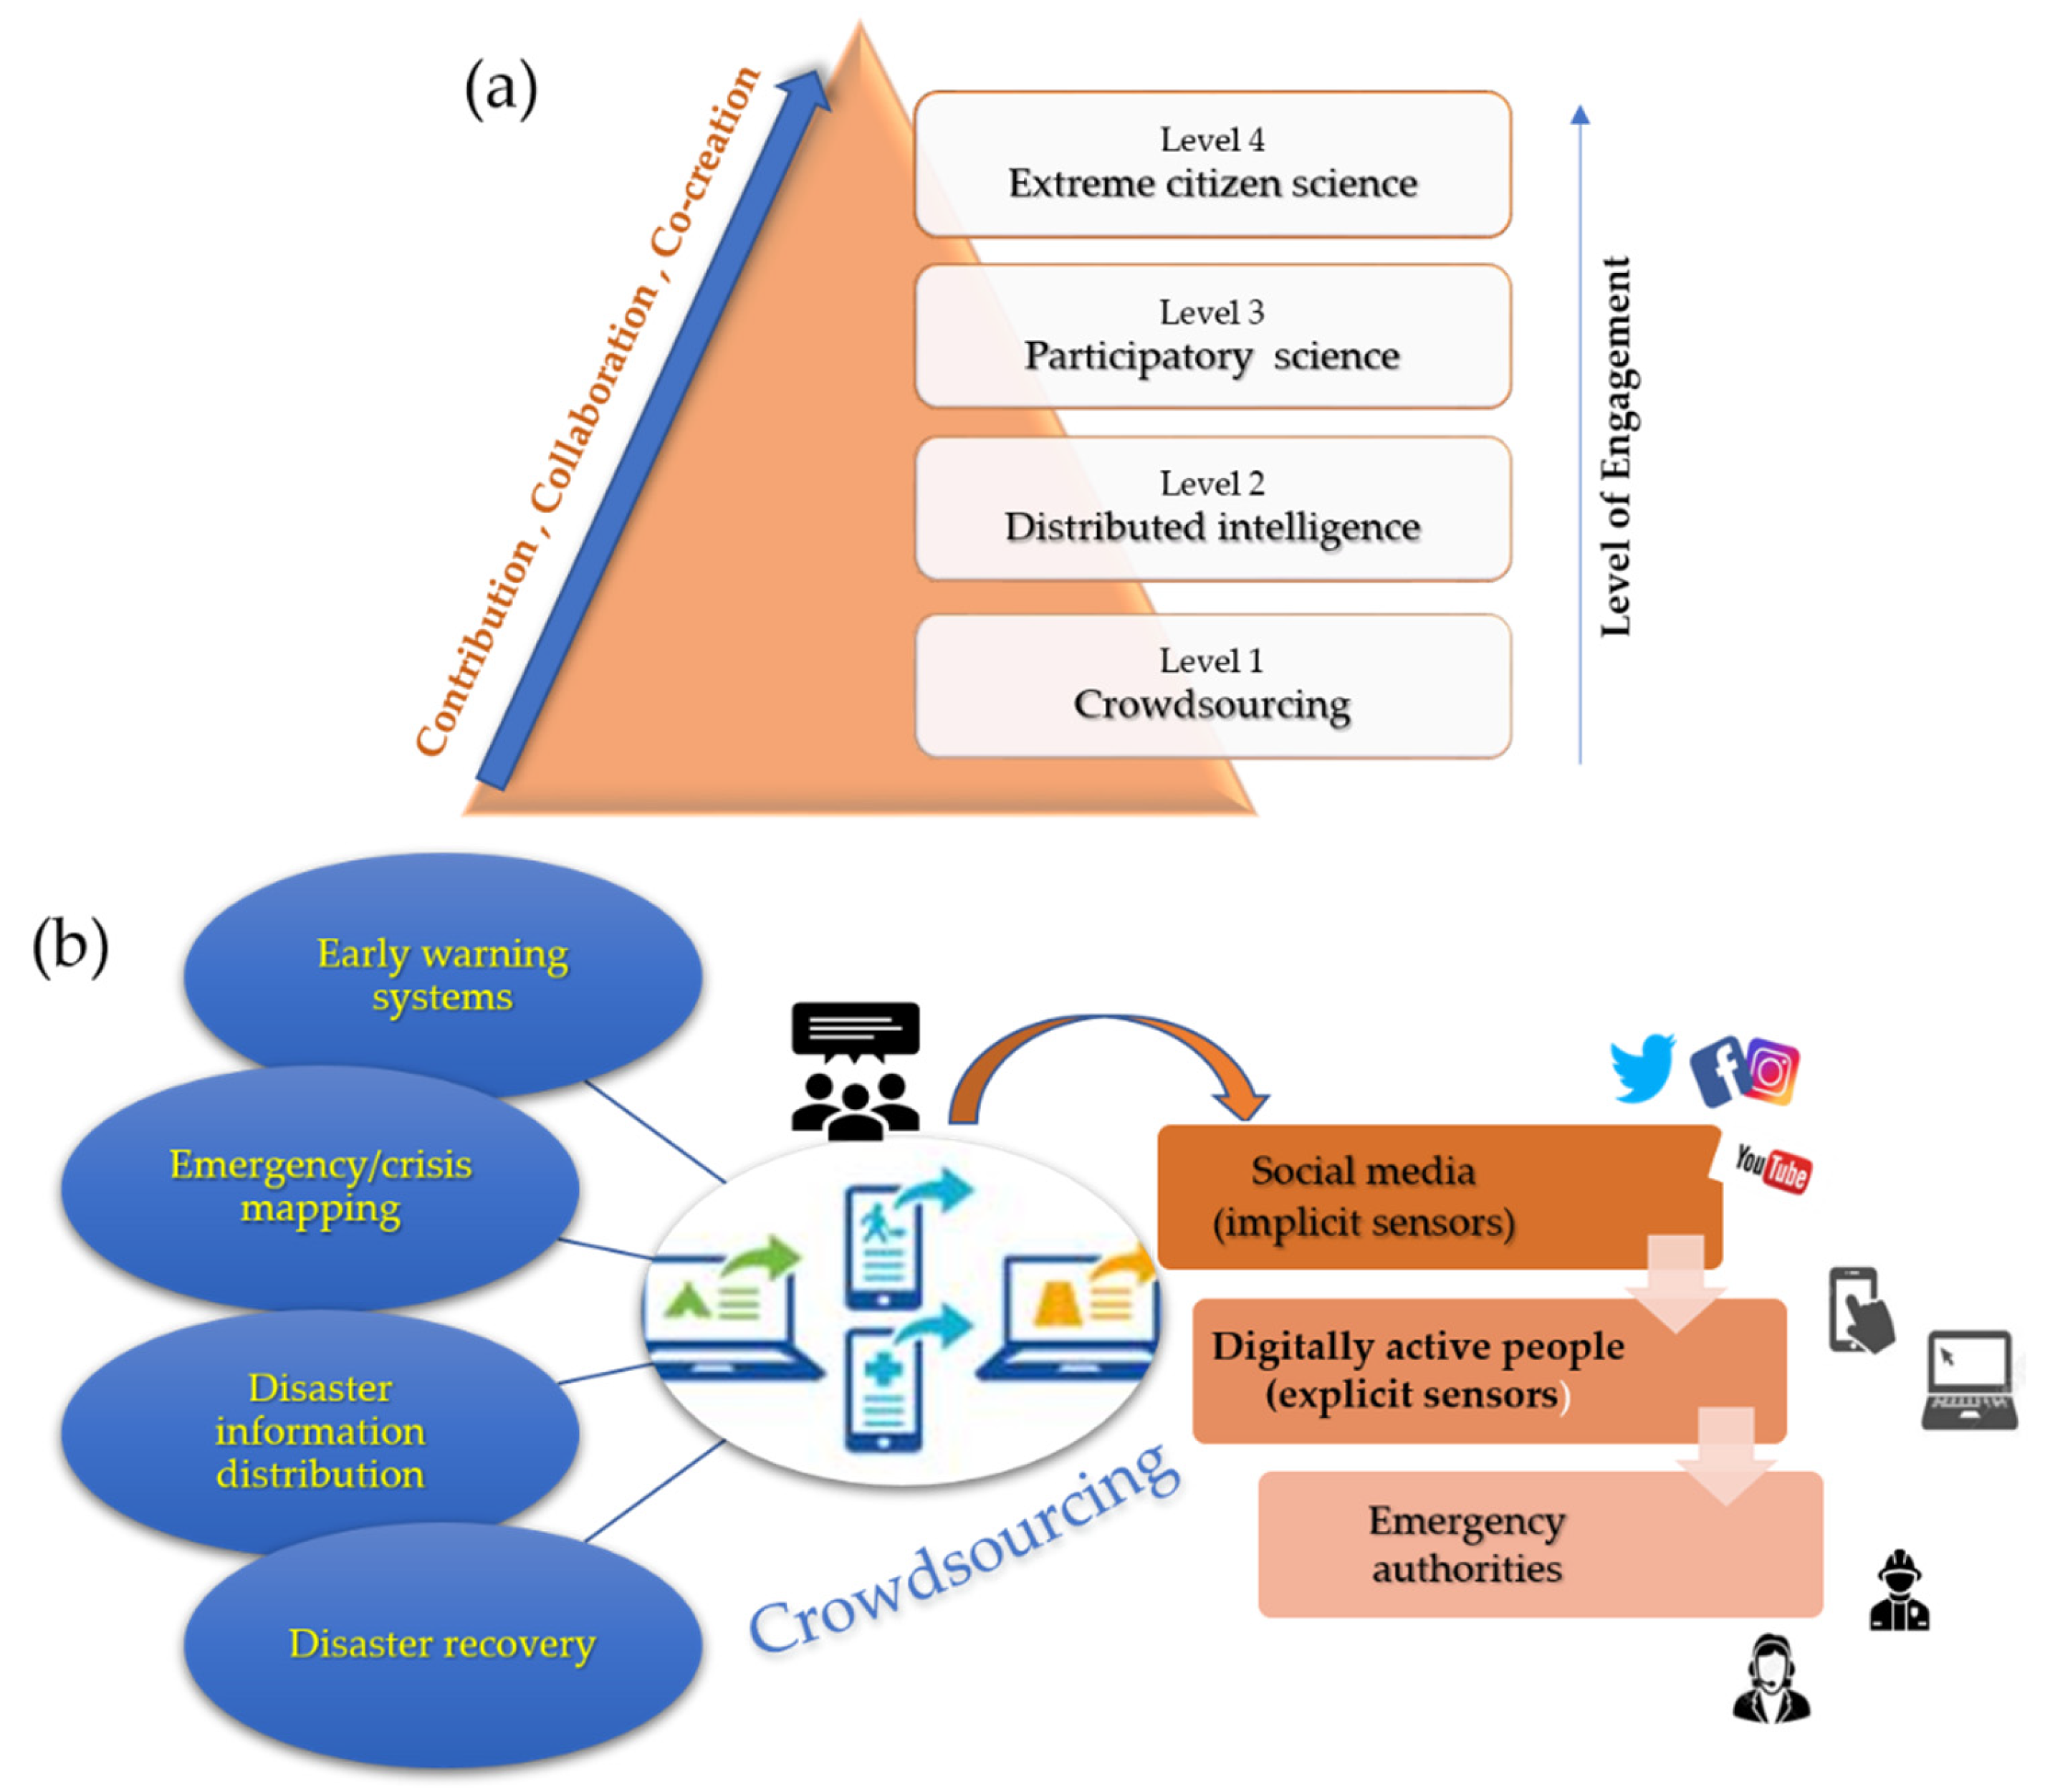
3.3.4. Citizen Science
4. Conclusions
Author Contributions
Funding
Conflicts of Interest
References
- Barredo, J.I.; Saurí, D.; Llasat, M.C. Assessing trends in insured losses from floods in Spain 1971–2008. Nat. Hazards Earth Syst. Sci. 2012, 12, 1723–1729. [Google Scholar] [CrossRef] [Green Version]
- Hallegatte, S.; Green, C.; Nicholls, R.J.; Corfee-Morlot, J. Future flood losses in major coastal cities. Nat. Clim. Chang. 2013, 3, 802–806. [Google Scholar] [CrossRef]
- Vousdoukas, M.I.; Mentaschi, L.; Voukouvalas, E.; Bianchi, A.; Dottori, F.; Feyen, L. Climatic and socioeconomic controls of future coastal flood risk in Europe. Nat. Clim. Chang. 2018, 8, 776–780. [Google Scholar] [CrossRef]
- Guerreiro, S.B.; Dawson, R.J.; Kilsby, C.; Lewis, E.; Ford, A. Future heat-waves, droughts and floods in 571 European cities. Environ. Res. Lett. 2018, 13, 034009. [Google Scholar] [CrossRef]
- Martel, J.L.; Mailhot, A.; Brissette, F. Global and regional projected changes in 100-yr subdaily, daily, and multiday precipitation extremes estimated from three large ensembles of climate simulations. J. Clim. 2020, 33, 1089–1103. [Google Scholar] [CrossRef]
- Bermúdez, M.; Cea, L.; Van Uytven, E.; Willems, P.; Farfán, J.F.; Puertas, J. A Robust Method to Update Local River Inundation Maps Using Global Climate Model Output and Weather Typing Based Statistical Downscaling. Water Resour. Manag. 2020, 34, 4345–4362. [Google Scholar] [CrossRef]
- Padulano, R.; Rianna, G.; Costabile, P.; Costanzo, C.; Del Giudice, G.; Mercogliano, P. Propagation of variability in climate projections within urban flood modelling: A multi-purpose impact analysis. J. Hydrol. 2021, 602, 126756. [Google Scholar] [CrossRef]
- Djordjević, S.; Butler, D.; Gourbesville, P.; Mark, O.; Pasche, E. New policies to deal with climate change and other drivers impacting on resilience to flooding in urban areas: The CORFU approach. Environ. Sci. Policy 2011, 14, 864–873. [Google Scholar] [CrossRef] [Green Version]
- Shah, M.A.R.; Rahman, A.; Chowdhury, S.H. Challenges for achieving sustainable flood risk management. J. Flood Risk Manag. 2018, 11, S352–S358. [Google Scholar] [CrossRef] [Green Version]
- Meyer, V.; Priest, S.; Kuhlicke, C. Economic evaluation of structural and non-structural flood risk management measures: Examples from the Mulde River. Nat. Hazards 2012, 62, 301–324. [Google Scholar] [CrossRef]
- White, I.; Connelly, A.; Garvin, S.; Lawson, N.; O’Hare, P. Flood resilience technology in Europe: Identifying barriers and co-producing best practice. J. Flood Risk Manag. 2018, 11, S468–S478. [Google Scholar] [CrossRef]
- Kumar, P.; Debele, S.E.; Sahani, J.; Aragão, L.; Barisani, F.; Basu, B.; Bucchignani, E.; Charizopoulos, N.; Di Sabatino, S.; Domeneghetti, A.; et al. Towards an operationalisation of nature-based solutions for natural hazards. Sci. Total Environ. 2020, 731, 138855. [Google Scholar] [CrossRef]
- Blázquez, L.; García, J.A.; Bodoque, J.M. Stakeholder analysis: Mapping the river networks for integrated flood risk management. Environ. Sci. Policy 2021, 124, 506–516. [Google Scholar] [CrossRef]
- Tobin, G.A. The levee love affair: A stormy relationship? JAWRA J. Am. Water Resour. Assoc. 1995, 31, 359–367. [Google Scholar] [CrossRef]
- Di Baldassarre, G.; Viglione, A.; Carr, G.; Kuil, L.; Yan, K.; Brandimarte, L.; Blöschl, G. Debates—Perspectives on socio-hydrology: Capturing feedbacks between physical and social processes. Water Resour. Res. 2015, 51, 4770–4781. [Google Scholar] [CrossRef]
- Schanze, J. Flood risk management—A basic framework. In Flood Risk Management: Hazards, Vulnerability and Mitigation Measures; Springer: Dordrecht, The Netherlands, 2007. [Google Scholar]
- WMO. Integrated Flood Management Concept Paper; World Meteorological Organization: Geneva, Switzerland, 2009; Volume 7. [Google Scholar]
- Penning-Rowsell, E.; Johnson, C.; Tunstall, S. “Signals” from pre-crisis discourse: Lessons from UK flooding for global environmental policy change? Glob. Environ. Chang. 2006, 16, 323–339. [Google Scholar] [CrossRef]
- IPCC Summary for policymakers. In Climate Change 2014: Impacts, Adaptation, and Vulnerability. Part A: Global and Sectoral Aspects; Contribution of Working Group II to the Fifth Assessment Report of the Intergovernmental Panel on Climate Change; Cambridge University Press: Cambridge, UK; New York, NY, USA, 2014.
- Serra-Llobet, A.; Conrad, E.; Schaefer, K. Governing for integrated water and flood risk management: Comparing top-down and bottom-up approaches in Spain and California. Water 2016, 8, 445. [Google Scholar] [CrossRef] [Green Version]
- Kron, W. Flood risk = hazard • values • vulnerability. Water Int. 2005, 30, 58–68. [Google Scholar] [CrossRef]
- De Moel, H.; Van Alphen, J.; Aerts, J.C.J.H. Flood maps in Europe—Methods, availability and use. Nat. Hazards Earth Syst. Sci. 2009, 9, 289–301. [Google Scholar] [CrossRef] [Green Version]
- Costabile, P.; Macchione, F. Analysis of One-Dimensional Modelling for Flood Routing in Compound Channels. Water Resour. Manag. 2012, 26, 1065–1087. [Google Scholar] [CrossRef]
- Costabile, P.; Macchione, F.; Petaccia, G.; Natale, L. Representing skewed bridge crossing on 1-D and 2-D flood propagation models: Compared analysis in practical studies. In Proceedings of the International Conference on Fluvial Hydraulics, RIVER FLOW 2014, Lausanne, Switzerland, 3–5 September 2014. [Google Scholar]
- Costabile, P.; Macchione, F.; Natale, L.; Petaccia, G. Flood mapping using LIDAR DEM. Limitations of the 1-D modeling highlighted by the 2-D approach. Nat. Hazards 2015, 77, 181–204. [Google Scholar] [CrossRef]
- Papaioannou, G.; Loukas, A.; Vasiliades, L.; Aronica, G.T. Flood inundation mapping sensitivity to riverine spatial resolution and modelling approach. Nat. Hazards 2016, 83, 117–132. [Google Scholar] [CrossRef]
- Dimitriadis, P.; Tegos, A.; Oikonomou, A.; Pagana, V.; Koukouvinos, A.; Mamassis, N.; Koutsoyiannis, D.; Efstratiadis, A. Comparative evaluation of 1D and quasi-2D hydraulic models based on benchmark and real-world applications for uncertainty assessment in flood mapping. J. Hydrol. 2016, 534, 478–492. [Google Scholar] [CrossRef]
- Liu, Z.; Merwade, V.; Jafarzadegan, K. Investigating the role of model structure and surface roughness in generating flood inundation extents using one- and two-dimensional hydraulic models. J. Flood Risk Manag. 2019, 12, e12347. [Google Scholar] [CrossRef] [Green Version]
- Fleischmann, A.; Paiva, R.; Collischonn, W. Can regional to continental river hydrodynamic models be locally relevant? A cross-scale comparison. J. Hydrol. X 2019, 3, 100027. [Google Scholar] [CrossRef]
- Bellos, V.; Tsakiris, V.K.; Kopsiaftis, G.; Tsakiris, G. Propagating dam breach parametric uncertainty in a river reach using the HEC-RAS software. Hydrology 2020, 7, 72. [Google Scholar] [CrossRef]
- Bates, P.D.; Horritt, M.S.; Fewtrell, T.J. A simple inertial formulation of the shallow water equations for efficient two-dimensional flood inundation modelling. J. Hydrol. 2010, 387, 33–45. [Google Scholar] [CrossRef]
- De Almeida, G.A.M.; Bates, P. Applicability of the local inertial approximation of the shallow water equations to flood modeling. Water Resour. Res. 2013, 49, 4833–4844. [Google Scholar] [CrossRef]
- Ponce, V.M. Generalized diffusion wave equation with inertial effects. Water Resour. Res. 1990, 26, 1099–1101. [Google Scholar] [CrossRef]
- Costabile, P.; Costanzo, C.; Macchione, F. Performances and limitations of the diffusive approximation of the 2-d shallow water equations for flood simulation in urban and rural areas. Appl. Numer. Math. 2016, 116, 141–156. [Google Scholar] [CrossRef]
- Neelz, S.; Pender, G. Benchmarking the Latest Generation of 2D Hydraulic Modelling Packages; Environment Agency: Bristol, UK, 2013.
- Leandro, J.; Chen, A.S.; Schumann, A. A 2D parallel diffusive wave model for floodplain inundation with variable time step (P-DWave). J. Hydrol. 2014, 517, 250–259. [Google Scholar] [CrossRef]
- Guidolin, M.; Chen, A.S.; Ghimire, B.; Keedwell, E.C.; Djordjević, S.; Savić, D.A. A weighted cellular automata 2D inundation model for rapid flood analysis. Environ. Model. Softw. 2016, 84, 378–394. [Google Scholar] [CrossRef] [Green Version]
- Ayog, J.L.; Kesserwani, G.; Shaw, J.; Sharifian, M.K.; Bau, D. Second-order discontinuous Galerkin flood model: Comparison with industry-standard finite volume models. J. Hydrol. 2021, 594, 125924. [Google Scholar] [CrossRef]
- García-Feal, O.; González-Cao, J.; Gómez-Gesteira, M.; Cea, L.; Domínguez, J.M.; Formella, A. An accelerated tool for flood modelling based on Iber. Water 2018, 10, 1459. [Google Scholar] [CrossRef] [Green Version]
- Costabile, P.; Costanzo, C.; Ferraro, D.; Barca, P. Is HEC-RAS 2D accurate enough for storm-event hazard assessment? Lessons learnt from a benchmarking study based on rain-on-grid modelling. J. Hydrol. 2021, 603, 126962. [Google Scholar] [CrossRef]
- Hunter, N.M.; Bates, P.D.; Horritt, M.S.; Wilson, M.D. Simple spatially-distributed models for predicting flood inundation: A review. Geomorphology 2007, 90, 208–225. [Google Scholar] [CrossRef]
- Cea, L.; Garrido, M.; Puertas, J. Experimental validation of two-dimensional depth-averaged models for forecasting rainfall-runoff from precipitation data in urban areas. J. Hydrol. 2010, 382, 88–102. [Google Scholar] [CrossRef]
- Schubert, J.E.; Sanders, B.F.; Smith, M.J.; Wright, N.G. Unstructured mesh generation and landcover-based resistance for hydrodynamic modeling of urban flooding. Adv. Water Resour. 2008, 31, 1603–1621. [Google Scholar] [CrossRef]
- Cea, L.; Bladé, E. A simple and efficient unstructured finite volume scheme for solving the shallow water equations in overland flow applications. Water Resour. Res. 2015, 51, 5464–5486. [Google Scholar] [CrossRef] [Green Version]
- Costabile, P.; Costanzo, C.; MacChione, F. Comparative analysis of overland flow models using finite volume schemes. J. Hydroinform. 2012, 14, 122–135. [Google Scholar] [CrossRef] [Green Version]
- Li, X.; Kitsikoudis, V.; Mignot, E.; Archambeau, P.; Pirotton, M.; Dewals, B.; Erpicum, S. Experimental and Numerical Study of the Effect of Model Geometric Distortion on Laboratory Modeling of Urban Flooding. Water Resour. Res. 2021, 57, e2021WR029666. [Google Scholar] [CrossRef]
- Dong, B.; Xia, J.; Zhou, M.; Deng, S.; Ahmadian, R.; Falconer, R.A. Experimental and numerical model studies on flash flood inundation processes over a typical urban street. Adv. Water Resour. 2021, 147, 103824. [Google Scholar] [CrossRef]
- Bruwier, M.; Maravat, C.; Mustafa, A.; Teller, J.; Pirotton, M.; Erpicum, S.; Archambeau, P.; Dewals, B. Influence of urban forms on surface flow in urban pluvial flooding. J. Hydrol. 2020, 582, 124493. [Google Scholar] [CrossRef]
- Glenis, V.; Kutija, V.; Kilsby, C.G. A fully hydrodynamic urban flood modelling system representing buildings, green space and interventions. Environ. Model. Softw. 2018, 109, 272–292. [Google Scholar] [CrossRef] [Green Version]
- Bazin, P.H.; Mignot, E.; Paquier, A. Computing flooding of crossroads with obstacles using a 2D numerical model. J. Hydraul. Res. 2017, 55, 72–84. [Google Scholar] [CrossRef] [Green Version]
- Bazin, P.-H.; Nakagawa, H.; Kawaike, K.; Paquier, A.; Mignot, E. Modeling Flow Exchanges between a Street and an Underground Drainage Pipe during Urban Floods. J. Hydraul. Eng. 2014, 140, 04014051. [Google Scholar] [CrossRef]
- Arrault, A.; Finaud-Guyot, P.; Archambeau, P.; Bruwier, M.; Erpicum, S.; Pirotton, M.; Dewals, B. Hydrodynamics of long-duration urban floods: Experiments and numerical modelling. Nat. Hazards Earth Syst. Sci. 2016, 16, 1413–1429. [Google Scholar] [CrossRef] [Green Version]
- de Almeida, G.A.M.; Bates, P.; Ozdemir, H. Modelling urban floods at submetre resolution: Challenges or opportunities for flood risk management? J. Flood Risk Manag. 2018, 11, S855–S865. [Google Scholar] [CrossRef] [Green Version]
- Bladé, E.; Cea, L.; Corestein, G.; Escolano, E.; Puertas, J.; Vázquez-Cendón, E.; Dolz, J.; Coll, A. Iber: Herramienta de simulación numérica del flujo en ríos. Rev. Int. Metod. Numer. Calc. Disen. Ing. 2014, 30, 1–10. [Google Scholar] [CrossRef] [Green Version]
- Arrighi, C.; Campo, L. Effects of digital terrain model uncertainties on high-resolution urban flood damage assessment. J. Flood Risk Manag. 2019, 12, c12530. [Google Scholar] [CrossRef] [Green Version]
- Cea, L.; Legout, C.; Darboux, F.; Esteves, M.; Nord, G. Experimental validation of a 2D overland flow model using high resolution water depth and velocity data. J. Hydrol. 2014, 513, 142–153. [Google Scholar] [CrossRef]
- Costabile, P.; Costanzo, C.; De Lorenzo, G.; Macchione, F. Is local flood hazard assessment in urban areas significantly influenced by the physical complexity of the hydrodynamic inundation model? J. Hydrol. 2020, 580, 124231. [Google Scholar] [CrossRef]
- Costabile, P.; Macchione, F. Enhancing river model set-up for 2-D dynamic flood modelling. Environ. Model. Softw. 2015, 67, 89–107. [Google Scholar] [CrossRef]
- Noh, S.J.; Lee, J.H.; Lee, S.; Kawaike, K.; Seo, D.J. Hyper-resolution 1D-2D urban flood modelling using LiDAR data and hybrid parallelization. Environ. Model. Softw. 2018, 103, 131–145. [Google Scholar] [CrossRef]
- Ouro, P.; Cea, L.; Ramírez, L.; Nogueira, X. An immersed boundary method for unstructured meshes in depth averaged shallow water models. Int. J. Numer. Methods Fluids 2016, 81, 672–688. [Google Scholar] [CrossRef]
- Schubert, J.E.; Sanders, B.F. Building treatments for urban flood inundation models and implications for predictive skill and modeling efficiency. Adv. Water Resour. 2012, 41, 49–64. [Google Scholar] [CrossRef]
- Bellos, V.; Tsakiris, G. Comparing Various Methods of Building Representation for 2D Flood Modelling In Built-Up Areas. Water Resour. Manag. 2015, 29, 379–397. [Google Scholar] [CrossRef]
- Ruiz-Villanueva, V.; Bodoque, J.M.; Díez-Herrero, A.; Bladé, E. Large wood transport as significant influence on flood risk in a mountain village. Nat. Hazards 2014, 74, 967–987. [Google Scholar] [CrossRef] [Green Version]
- Ruiz-Villanueva, V.; Mazzorana, B.; Bladé, E.; Bürkli, L.; Iribarren-Anacona, P.; Mao, L.; Nakamura, F.; Ravazzolo, D.; Rickenmann, D.; Sanz-Ramos, M.; et al. Characterization of wood-laden flows in rivers. Earth Surf. Process. Landforms 2019, 44, 1694–1709. [Google Scholar] [CrossRef]
- Fernández-Pato, J.; Martínez-Aranda, S.; García-Navarro, P. A 2D finite volume simulation tool to enable the assessment of combined hydrological and morphodynamical processes in mountain catchments. Adv. Water Resour. 2020, 141, 103617. [Google Scholar] [CrossRef]
- Persi, E.; Petaccia, G.; Sibilla, S.; Bentivoglio, R.; Armanini, A. A one-way coupled hydrodynamic advection-diffusion model to simulate congested large wood transport. Hydrology 2021, 8, 21. [Google Scholar] [CrossRef]
- Cea, L.; López-Núñez, A. Extension of the two-component pressure approach for modeling mixed free-surface-pressurized flows with the two-dimensional shallow water equations. Int. J. Numer. Methods Fluids 2021, 93, 628–652. [Google Scholar] [CrossRef]
- Bruwier, M.; Archambeau, P.; Erpicum, S.; Pirotton, M.; Dewals, B. Shallow-water models with anisotropic porosity and merging for flood modelling on Cartesian grids. J. Hydrol. 2017, 554, 693–709. [Google Scholar] [CrossRef]
- Casas, A.; Lane, S.N.; Yu, D.; Benito, G. A method for parameterising roughness and topographic sub-grid scale effects in hydraulic modelling from LiDAR data. Hydrol. Earth Syst. Sci. 2010, 14, 1567–1579. [Google Scholar] [CrossRef] [Green Version]
- Cea, L.; Vázquez-Cendón, M.E. Unstructured finite volume discretization of two-dimensional depth-averaged shallow water equations with porosity. Int. J. Numer. Methods Fluids 2010, 63, 903–930. [Google Scholar] [CrossRef]
- Guinot, V. Multiple porosity shallow water models for macroscopic modelling of urban floods. Adv. Water Resour. 2012, 37, 40–72. [Google Scholar] [CrossRef]
- Özgen, I.; Zhao, J.; Liang, D.; Hinkelmann, R. Urban flood modeling using shallow water equations with depth-dependent anisotropic porosity. J. Hydrol. 2016, 541, 1165–1184. [Google Scholar] [CrossRef] [Green Version]
- Sanders, B.F.; Schubert, J.E. PRIMo: Parallel raster inundation model. Adv. Water Resour. 2019, 126, 79–95. [Google Scholar] [CrossRef]
- Shen, D.; Wang, J.; Cheng, X.; Rui, Y.; Ye, S. Integration of 2-D hydraulic model and high-resolution lidar-derived DEM for floodplain flow modeling. Hydrol. Earth Syst. Sci. 2015, 19, 3605–3616. [Google Scholar] [CrossRef] [Green Version]
- Viero, D.P.; Valipour, M. Modeling anisotropy in free-surface overland and shallow inundation flows. Adv. Water Resour. 2017, 104, 1–14. [Google Scholar] [CrossRef]
- Bermúdez, M.; Neal, J.C.; Bates, P.D.; Coxon, G.; Freer, J.E.; Cea, L.; Puertas, J. Quantifying local rainfall dynamics and uncertain boundary conditions into a nested regional-local flood modeling system. Water Resour. Res. 2017, 53, 2770–2785. [Google Scholar] [CrossRef] [Green Version]
- Comer, J.; Indiana Olbert, A.; Nash, S.; Hartnett, M. Development of high-resolution multi-scale modelling system for simulation of coastal-fluvial urban flooding. Nat. Hazards Earth Syst. Sci. 2017, 17, 205–224. [Google Scholar] [CrossRef] [Green Version]
- Hoch, J.M.; van Beek, R.; Winsemius, H.C.; Bierkens, M.F.P. Benchmarking flexible meshes and regular grids for large-scale fluvial inundation modelling. Adv. Water Resour. 2018, 121, 350–360. [Google Scholar] [CrossRef]
- Hu, R.; Fang, F.; Salinas, P.; Pain, C.C. Unstructured mesh adaptivity for urban flooding modelling. J. Hydrol. 2018, 560, 354–363. [Google Scholar] [CrossRef]
- Hou, J.; Wang, R.; Liang, Q.; Li, Z.; Huang, M.S.; Hinkelmann, R. Efficient surface water flow simulation on static Cartesian grid with local refinement according to key topographic features. Comput. Fluids 2018, 176, 117–134. [Google Scholar] [CrossRef] [Green Version]
- Ferraro, D.; Costabile, P.; Costanzo, C.; Petaccia, G.; Macchione, F. A spectral analysis approach for the a priori generation of computational grids in the 2-D hydrodynamic-based runoff simulations at a basin scale. J. Hydrol. 2020, 582, 124508. [Google Scholar] [CrossRef]
- Wu, T.; Li, J.; Li, T.; Sivakumar, B.; Zhang, G.; Wang, G. High-efficient extraction of drainage networks from digital elevation models constrained by enhanced flow enforcement from known river maps. Geomorphology 2019, 340, 184–201. [Google Scholar] [CrossRef]
- Zhang, H.; Wu, W.; Hu, C.; Hu, C.; Li, M.; Hao, X.; Liu, S. A distributed hydrodynamic model for urban storm flood risk assessment. J. Hydrol. 2021, 600, 126513. [Google Scholar] [CrossRef]
- Russo, B.; Sunyer, D.; Velasco, M.; Djordjević, S. Analysis of extreme flooding events through a calibrated 1D/2D coupled model: The case of Barcelona (Spain). J. Hydroinform. 2015, 17, 473–491. [Google Scholar] [CrossRef]
- Martins, R.; Leandro, J.; Chen, A.S.; Djordjević, S. A comparison of three dual drainage models: Shallow water vs local inertial vs diffusive wave. J. Hydroinform. 2017, 19, 331–348. [Google Scholar] [CrossRef] [Green Version]
- Li, Q.; Liang, Q.; Xia, X. A novel 1D-2D coupled model for hydrodynamic simulation of flows in drainage networks. Adv. Water Resour. 2020, 137, 103519. [Google Scholar] [CrossRef]
- Kitsikoudis, V.; Erpicum, S.; Rubinato, M.; Shucksmith, J.D.; Archambeau, P.; Pirotton, M.; Dewals, B. Exchange between drainage systems and surface flows during urban flooding: Quasi-steady and dynamic modelling in unsteady flow conditions. J. Hydrol. 2021, 602, 126628. [Google Scholar] [CrossRef]
- Fraga, I.; Cea, L.; Puertas, J.; Suárez, J.; Jiménez, V.; Jácome, A. Global Sensitivity and GLUE-Based Uncertainty Analysis of a 2D-1D Dual Urban Drainage Model. J. Hydrol. Eng. 2016, 21, 04016004. [Google Scholar] [CrossRef]
- Chen, A.S.; Leandro, J.; Djordjević, S. Modelling sewer discharge via displacement of manhole covers during flood events using 1D/2D SIPSON/P-DWave dual drainage simulations. Urban Water J. 2016, 13, 830–840. [Google Scholar] [CrossRef] [Green Version]
- Bulti, D.T.; Abebe, B.G. A review of flood modeling methods for urban pluvial flood application. Model. Earth Syst. Environ. 2020, 6, 1293–1302. [Google Scholar] [CrossRef]
- Leandro, J.; Chen, A.S.; Djordjević, S.; Savić, D.A. Comparison of 1D/1D and 1D/2D Coupled (Sewer/Surface) Hydraulic Models for Urban Flood Simulation. J. Hydraul. Eng. 2009, 135, 495–504. [Google Scholar] [CrossRef]
- He, J.; Qiang, Y.; Luo, H.; Zhou, S.; Zhang, L. A stress test of urban system flooding upon extreme rainstorms in Hong Kong. J. Hydrol. 2021, 597, 125713. [Google Scholar] [CrossRef]
- Leandro, J.; Martins, R. A methodology for linking 2D overland flow models with the sewer network model SWMM 5.1 based on dynamic link libraries. Water Sci. Technol. 2016, 73, 3017–3026. [Google Scholar] [CrossRef]
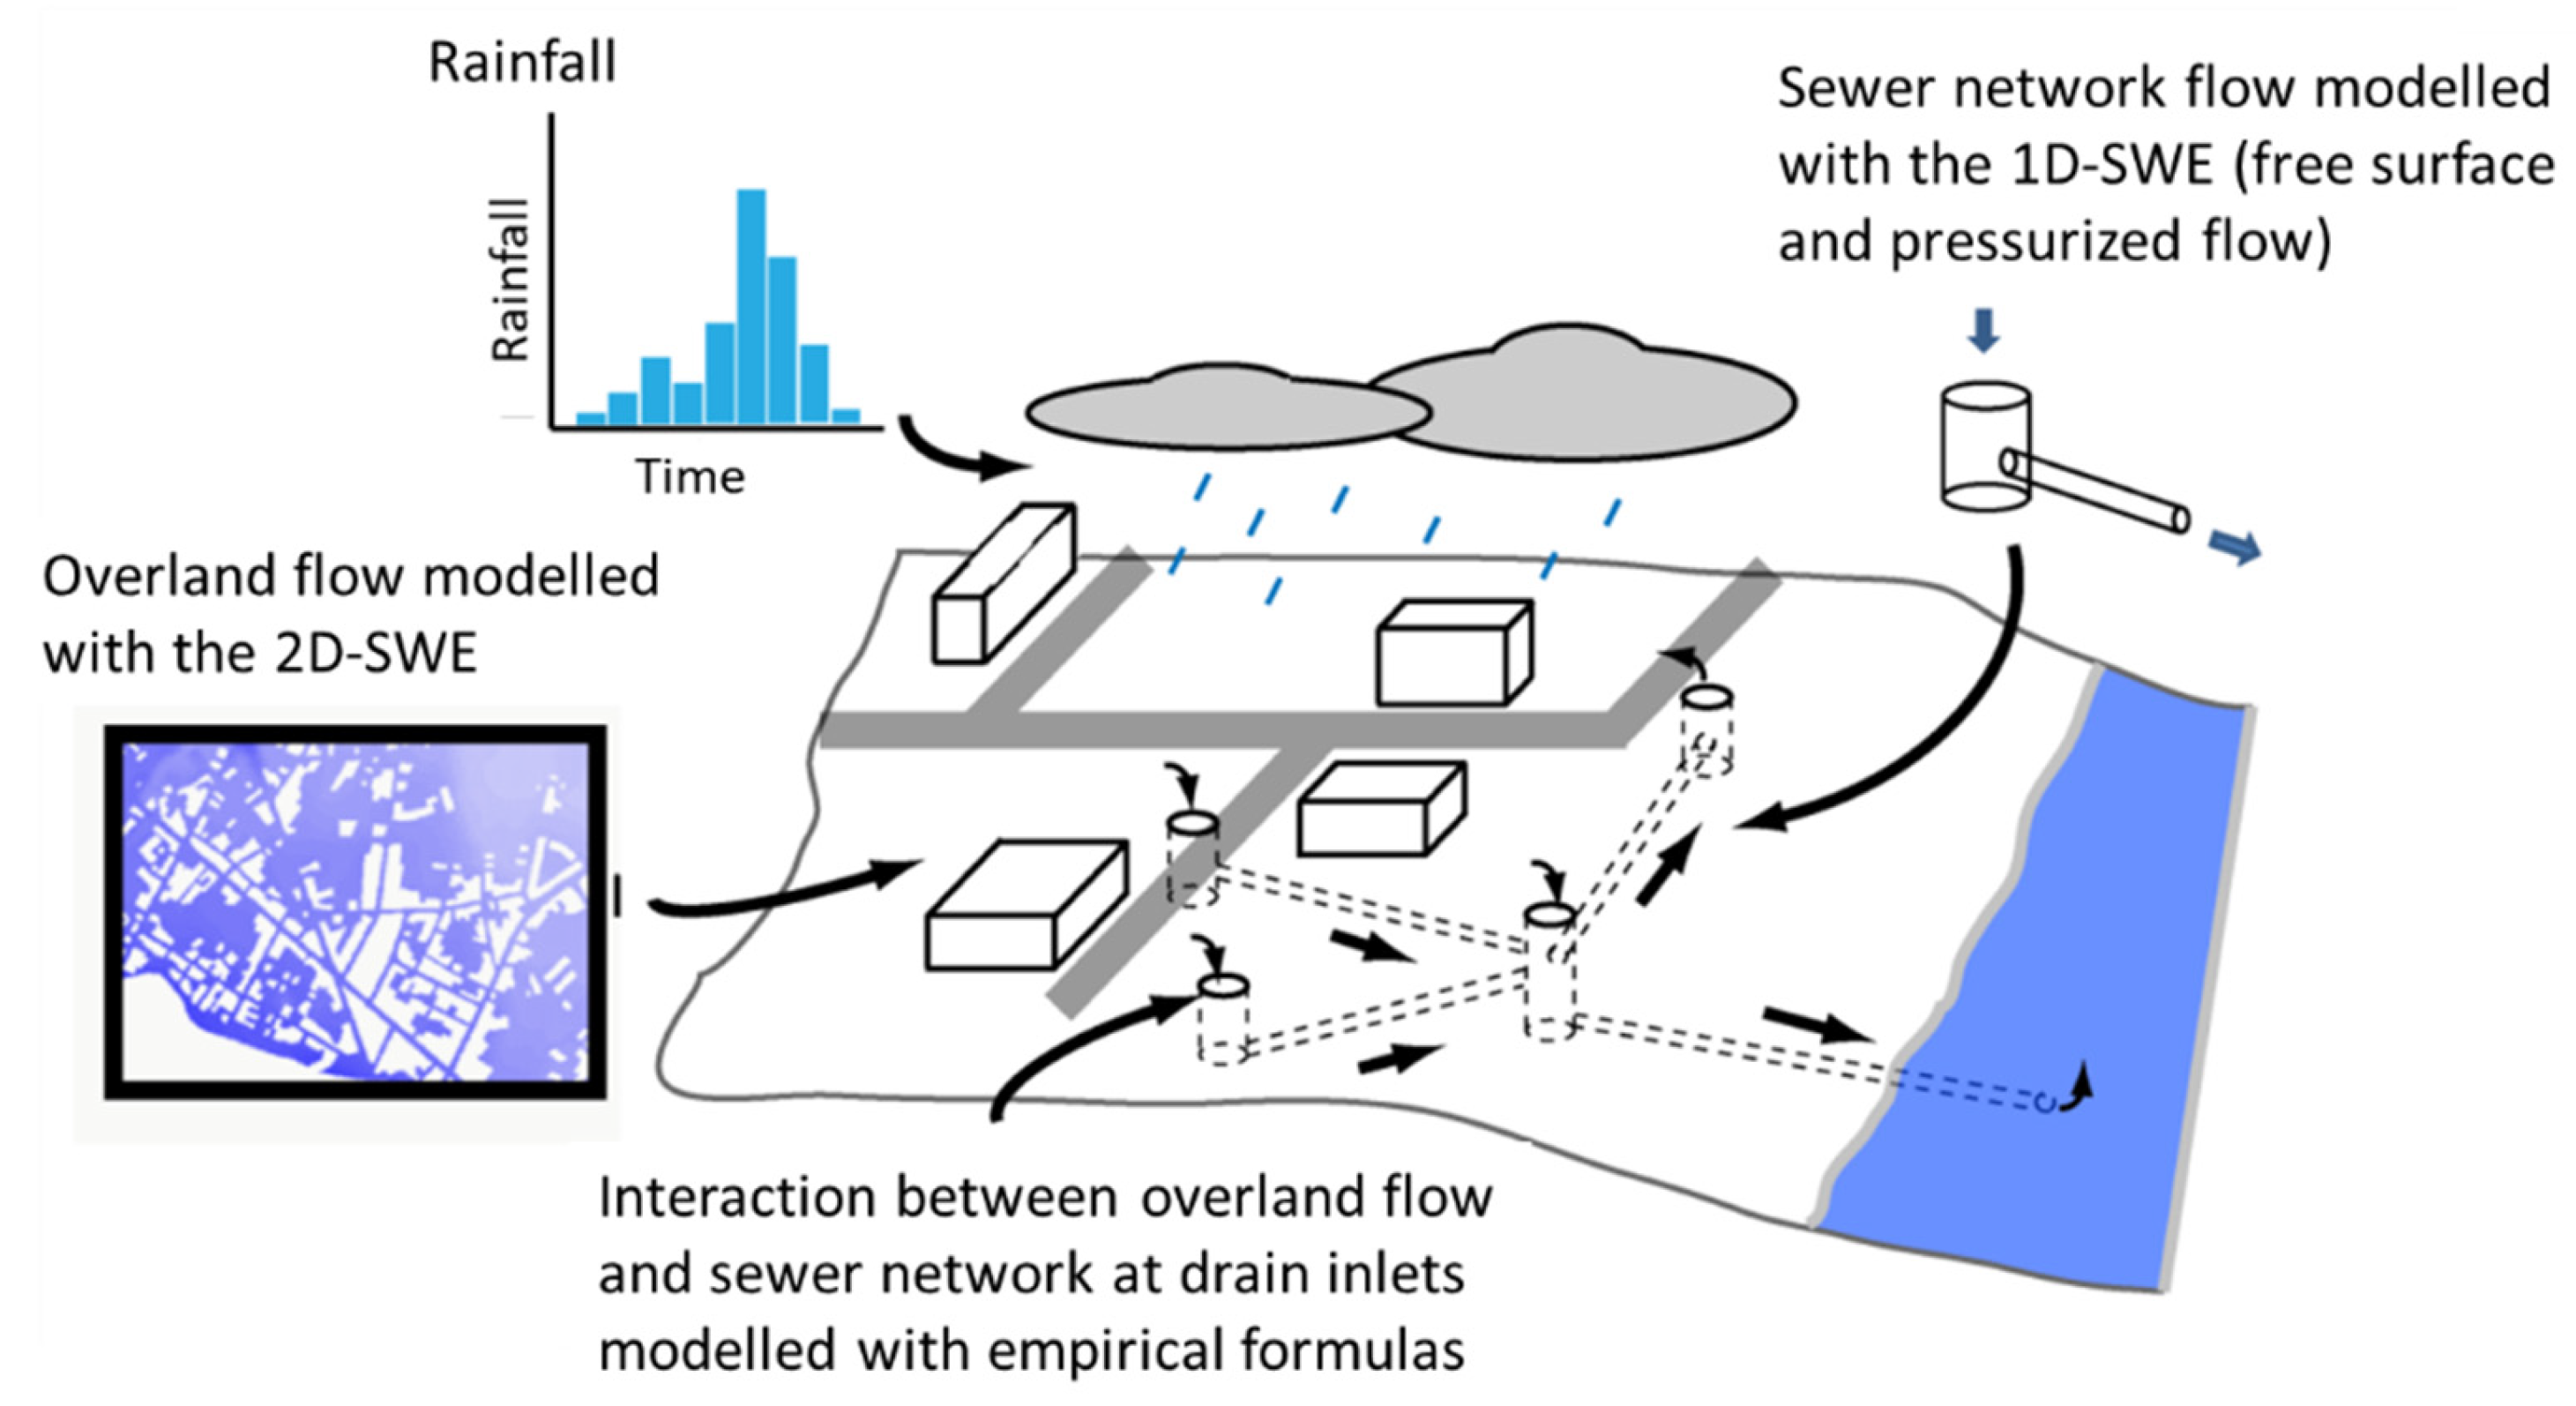
- Sañudo, E.; Cea, L.; Puertas, J. Modelling pluvial flooding in urban areas coupling the models iber and SWMM. Water 2020, 12, 2647. [Google Scholar] [CrossRef]
- Glenis, V.; McGough, A.S.; Kutija, V.; Kilsby, C.; Woodman, S. Flood modelling for cities using Cloud computing. J. Cloud Comput. 2013, 2, 7. [Google Scholar] [CrossRef] [Green Version]
- Cea, L.; Garrido, M.; Puertas, J.; Jácome, A.; Del Río, H.; Suárez, J. Overland flow computations in urban and industrial catchments from direct precipitation data using a two-dimensional shallow water model. Water Sci. Technol. 2010, 62, 1998–2008. [Google Scholar] [CrossRef] [PubMed]
- Chang, T.J.; Wang, C.H.; Chen, A.S.; Djordjević, S. The effect of inclusion of inlets in dual drainage modelling. J. Hydrol. 2018, 559, 541–555. [Google Scholar] [CrossRef]
- Fernández-Pato, J.; García-Navarro, P. An efficient gpu implementation of a coupled overland-sewer hydraulic model with pollutant transport. Hydrology 2021, 8, 146. [Google Scholar] [CrossRef]
- Dong, X.; Guo, H.; Zeng, S. Enhancing future resilience in urban drainage system: Green versus grey infrastructure. Water Res. 2017, 124, 280–289. [Google Scholar] [CrossRef]
- Kim, S.E.; Lee, S.; Kim, D.; Song, C.G. Stormwater Inundation Analysis in Small and Medium Cities for the Climate Change Using EPA-SWMM and HDM-2D. J. Coast. Res. 2018, 85, 991–995. [Google Scholar] [CrossRef]
- Qiang, Y.; Zhang, L.; He, J.; Xiao, T.; Huang, H.; Wang, H. Urban flood analysis for Pearl River Delta cities using an equivalent drainage method upon combined rainfall-high tide-storm surge events. J. Hydrol. 2021, 597, 126293. [Google Scholar] [CrossRef]
- Palla, A.; Colli, M.; Candela, A.; Aronica, G.T.; Lanza, L.G. Pluvial flooding in urban areas: The role of surface drainage efficiency. J. Flood Risk Manag. 2018, 11, S663–S676. [Google Scholar] [CrossRef]
- Guerreiro, S.B.; Glenis, V.; Dawson, R.J.; Kilsby, C. Pluvial flooding in European cities-A continental approach to urban flood modelling. Water 2017, 9, 296. [Google Scholar] [CrossRef] [Green Version]
- NVIDIA–Corporation. About CUDA. 2018. Available online: https://developer.nvidia.com/about-cuda (accessed on 15 March 2022).
- Vacondio, R.; Dal Palù, A.; Mignosa, P. GPU-enhanced finite volume shallow water solver for fast flood simulations. Environ. Model. Softw. 2014, 57, 60–75. [Google Scholar] [CrossRef]
- Petaccia, G.; Leporati, F.; Torti, E. OpenMP and CUDA simulations of Sella Zerbino Dam break on unstructured grids. Comput. Geosci. 2016, 20, 1123–1132. [Google Scholar] [CrossRef]
- Liu, Q.; Qin, Y.; Li, G. Fast simulation of large-scale floods based on GPU parallel computing. Water 2018, 10, 589. [Google Scholar] [CrossRef] [Green Version]
- Echeverribar, I.; Morales-Hernández, M.; Brufau, P.; García-Navarro, P. 2D numerical simulation of unsteady flows for large scale floods prediction in real time. Adv. Water Resour. 2019, 134, 103444. [Google Scholar] [CrossRef]
- Dazzi, S.; Vacondio, R.; Dal Palù, A.; Mignosa, P. A local time stepping algorithm for GPU-accelerated 2D shallow water models. Adv. Water Resour. 2018, 111, 274–288. [Google Scholar] [CrossRef]
- Dazzi, S.; Shustikova, I.; Domeneghetti, A.; Castellarin, A.; Vacondio, R. Comparison of two modelling strategies for 2D large-scale flood simulations. Environ. Model. Softw. 2021, 146, 105225. [Google Scholar] [CrossRef]
- Morales-Hernández, M.; Sharif, M.B.; Kalyanapu, A.; Ghafoor, S.K.; Dullo, T.T.; Gangrade, S.; Kao, S.C.; Norman, M.R.; Evans, K.J. TRITON: A Multi-GPU open source 2D hydrodynamic flood model. Environ. Model. Softw. 2021, 141, 105034. [Google Scholar] [CrossRef]
- Xia, X.; Liang, Q.; Ming, X. A full-scale fluvial flood modelling framework based on a high-performance integrated hydrodynamic modelling system (HiPIMS). Adv. Water Resour. 2019, 132, 103392. [Google Scholar] [CrossRef]
- Sanders, B.F.; Schubert, J.E.; Detwiler, R.L. ParBreZo: A parallel, unstructured grid, Godunov-type, shallow-water code for high-resolution flood inundation modeling at the regional scale. Adv. Water Resour. 2010, 33, 1456–1467. [Google Scholar] [CrossRef]
- Costabile, P.; Costanzo, C. A 2D-SWEs framework for efficient catchment-scale simulations: Hydrodynamic scaling properties of river networks and implications for non-uniform grids generation. J. Hydrol. 2021, 599, 126306. [Google Scholar] [CrossRef]
- Padulano, R.; Costabile, P.; Costanzo, C.; Rianna, G.; Del Giudice, G.; Mercogliano, P. Using the present to estimate the future: A simplified approach for the quantification of climate change effects on urban flooding by scenario analysis. Hydrol. Process. 2021, 35, e14436. [Google Scholar] [CrossRef]
- Bermúdez, M.; Cea, L.; Puertas, J. A rapid flood inundation model for hazard mapping based on least squares support vector machine regression. J. Flood Risk Manag. 2019, 12, c12522. [Google Scholar] [CrossRef] [Green Version]
- Bomers, A. Predicting outflow hydrographs of potential dike breaches in a bifurcating river system using narx neural networks. Hydrology 2021, 8, 87. [Google Scholar] [CrossRef]
- Chu, H.; Wu, W.; Wang, Q.J.; Nathan, R.; Wei, J. An ANN-based emulation modelling framework for flood inundation modelling: Application, challenges and future directions. Environ. Model. Softw. 2020, 124, 104587. [Google Scholar] [CrossRef]
- Ivanov, V.Y.; Xu, D.; Dwelle, M.C.; Sargsyan, K.; Wright, D.B.; Katopodes, N.; Kim, J.; Tran, V.N.; Warnock, A.; Fatichi, S.; et al. Breaking Down the Computational Barriers to Real-Time Urban Flood Forecasting. Geophys. Res. Lett. 2021, 48, e2021GL093585. [Google Scholar] [CrossRef]
- Löwe, R.; Böhm, J.; Jensen, D.G.; Leandro, J.; Rasmussen, S.H. U-FLOOD—Topographic deep learning for predicting urban pluvial flood water depth. J. Hydrol. 2021, 603, 126898. [Google Scholar] [CrossRef]
- Guo, Z.; Leitão, J.P.; Simões, N.E.; Moosavi, V. Data-driven flood emulation: Speeding up urban flood predictions by deep convolutional neural networks. J. Flood Risk Manag. 2021, 14, e12684. [Google Scholar] [CrossRef]
- Jamali, B.; Haghighat, E.; Ignjatovic, A.; Leitão, J.P.; Deletic, A. Machine learning for accelerating 2D flood models: Potential and challenges. Hydrol. Process. 2021, 35, e14064. [Google Scholar] [CrossRef]
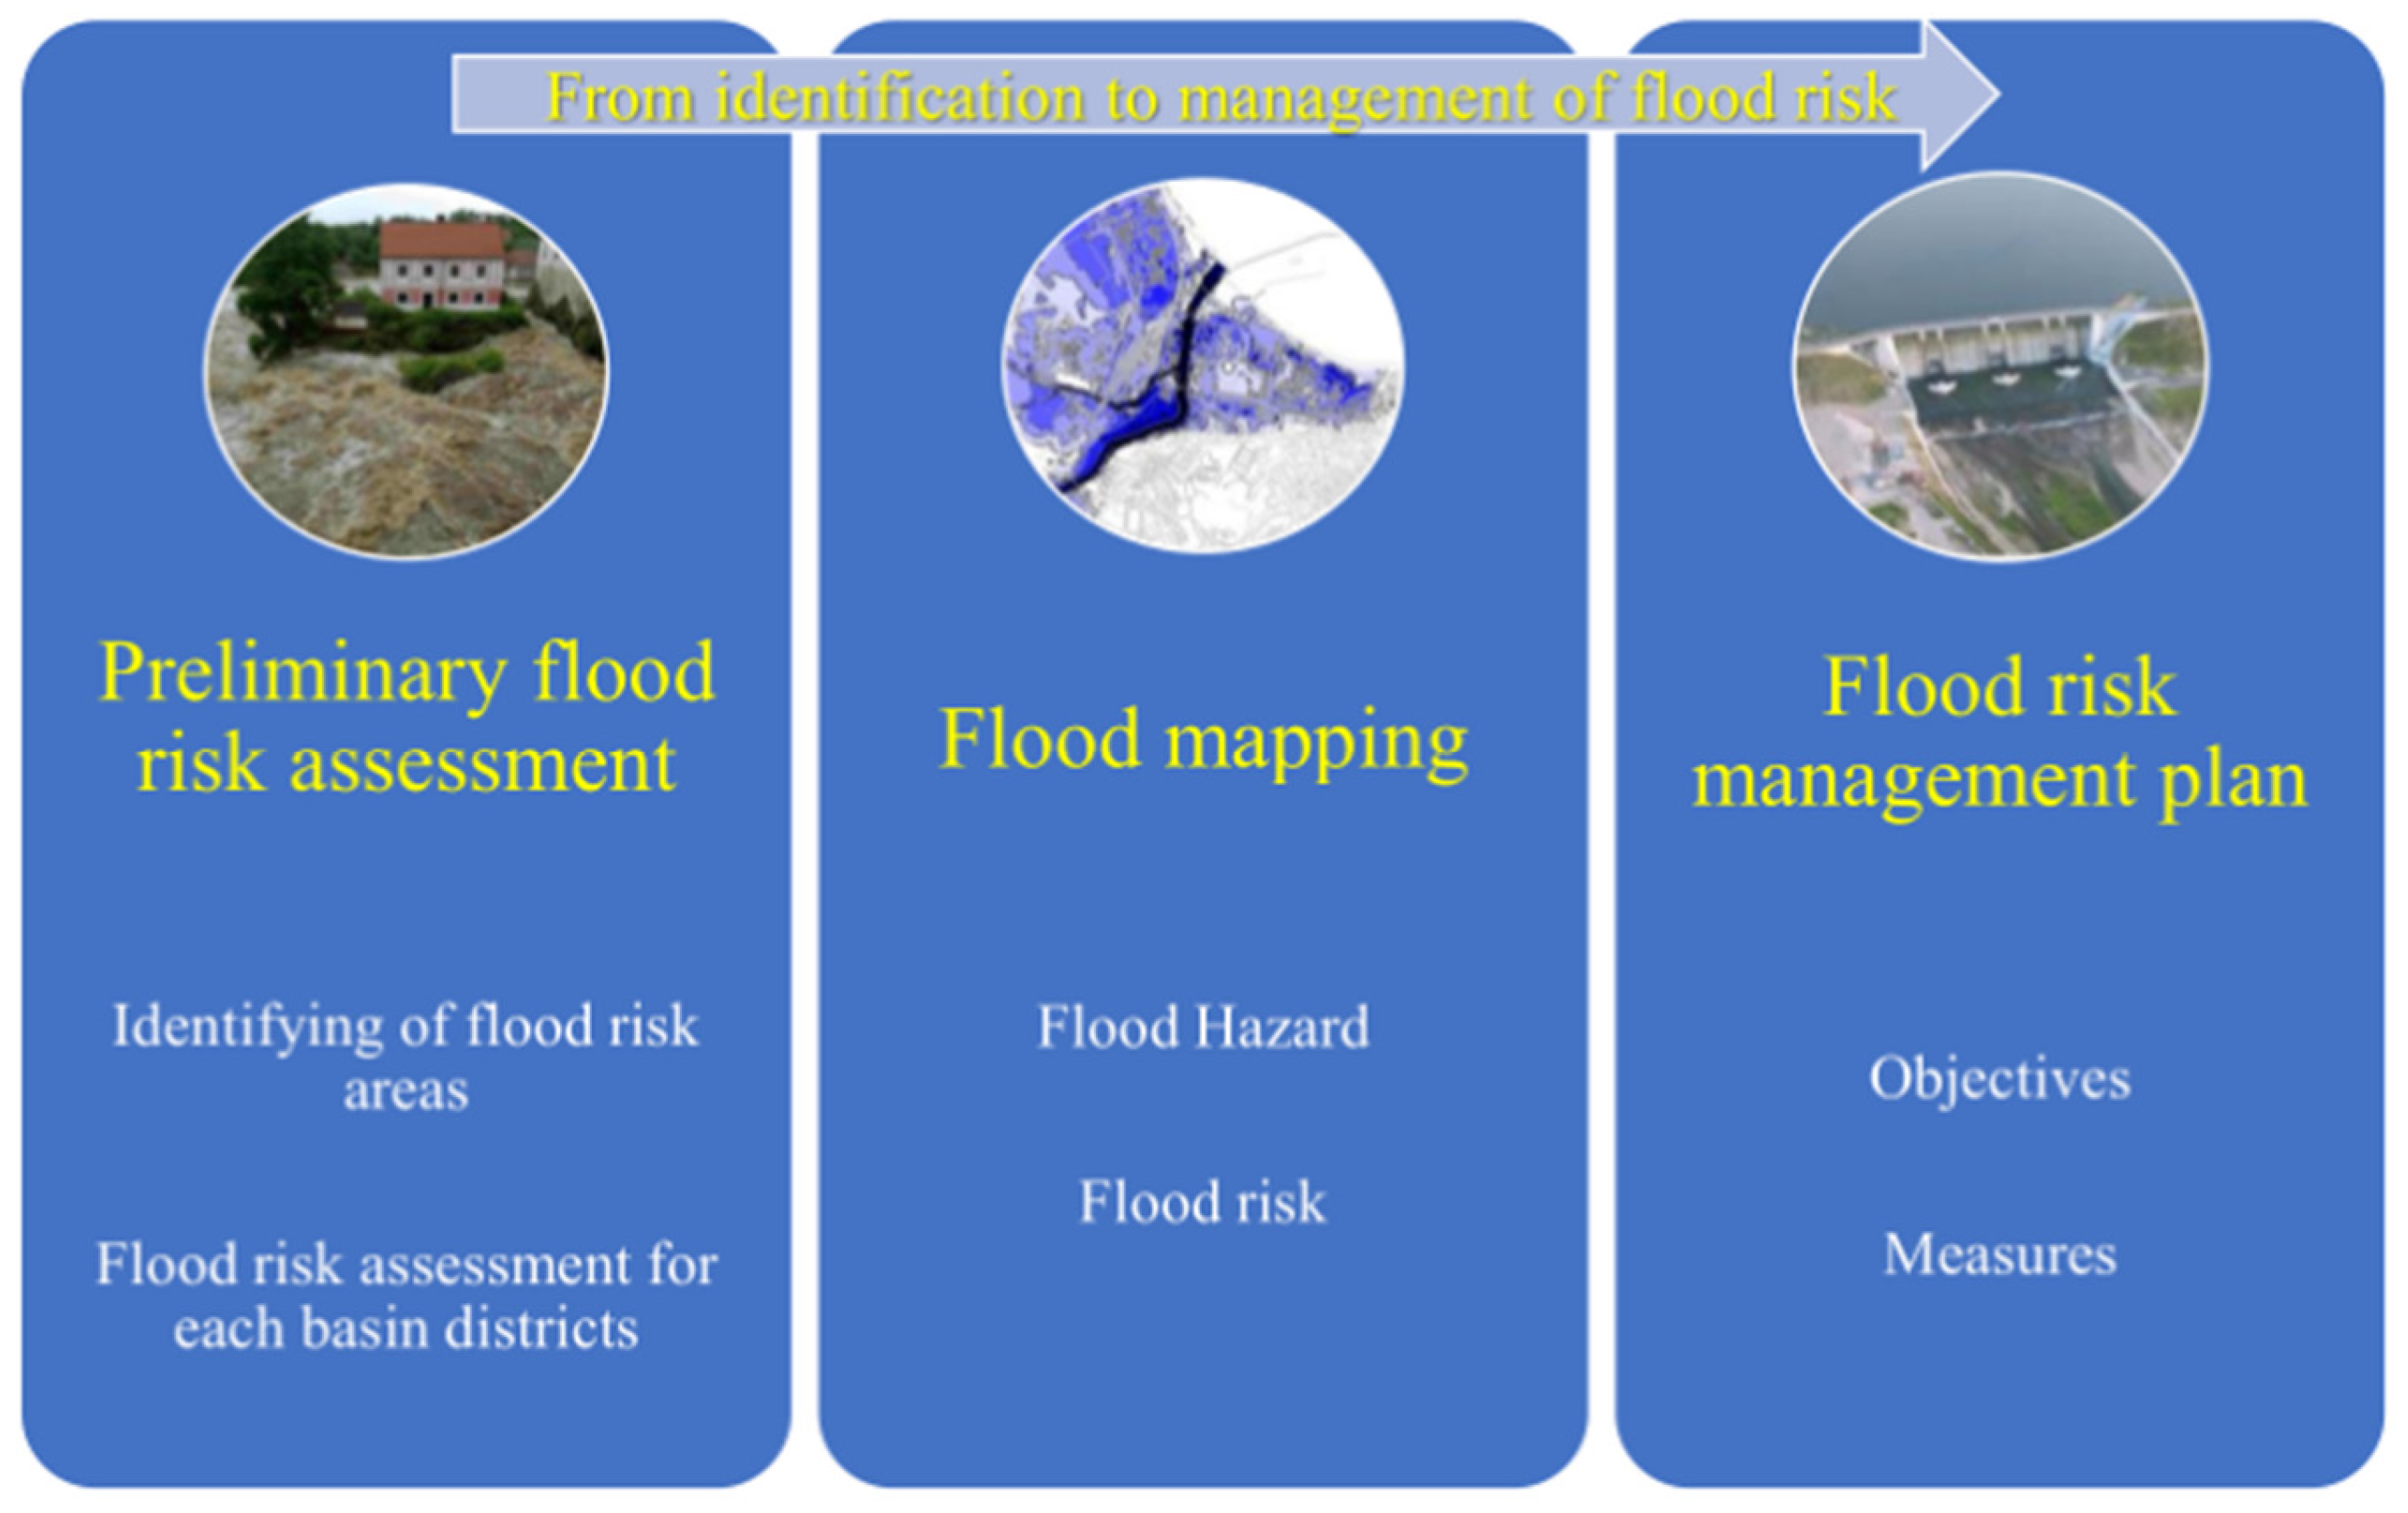
- European Parliament and the Council Directive 2007/60/EC on the Assessment and Management of Flood Risks; EU: Brussels, Belgium, 2007.
- Ferrari, A.; Viero, D.P.; Vacondio, R.; Defina, A.; Mignosa, P. Flood inundation modeling in urbanized areas: A mesh-independent porosity approach with anisotropic friction. Adv. Water Resour. 2019, 125, 98–113. [Google Scholar] [CrossRef]
- Ferrari, A.; Viero, D.P. Floodwater pathways in urban areas: A method to compute porosity fields for anisotropic subgrid models in differential form. J. Hydrol. 2020, 589, 125193. [Google Scholar] [CrossRef]
- Edmonds, D.A.; Caldwell, R.L.; Brondizio, E.S.; Siani, S.M.O. Coastal flooding will disproportionately impact people on river deltas. Nat. Commun. 2020, 11, 681–686. [Google Scholar] [CrossRef]
- Ganguli, P.; Merz, B. Extreme Coastal Water Levels Exacerbate Fluvial Flood Hazards in Northwestern Europe. Sci. Rep. 2019, 9, 13165. [Google Scholar] [CrossRef]
- Kew, S.F.; Selten, F.M.; Lenderink, G.; Hazeleger, W. The simultaneous occurrence of surge and discharge extremes for the Rhine delta. Nat. Hazards Earth Syst. Sci. 2013, 13, 2017–2029. [Google Scholar] [CrossRef] [Green Version]
- Wahl, T.; Jain, S.; Bender, J.; Meyers, S.D.; Luther, M.E. Increasing risk of compound flooding from storm surge and rainfall for major US cities. Nat. Clim. Chang. 2015, 5, 1093–1097. [Google Scholar] [CrossRef]
- Petroliagkis, T.; Voukouvalas, E.; Disperati, J.; Bidlot, J. Joint Probabilities of Storm Surge, Significant Wave Height and River Discharge Components of Coastal Flooding Events: Utilising Statistical Dependence Methodologies and Techniques; JRC100839; Publications Office of the European Union: Luxembourg, 2016. [Google Scholar]
- Hawkes, P.J. Joint probability analysis for estimation of extremes. J. Hydraul. Res. 2008, 46, 246–256. [Google Scholar] [CrossRef]
- Mazas, F.; Hamm, L. An event-based approach for extreme joint probabilities of waves and sea levels. Coast. Eng. 2017, 122, 44–59. [Google Scholar] [CrossRef]
- Bevacqua, E.; Maraun, D.; Vousdoukas, M.I.; Voukouvalas, E.; Vrac, M.; Mentaschi, L.; Widmann, M. Higher probability of compound flooding from precipitation and storm surge in Europe under anthropogenic climate change. Sci. Adv. 2019, 5, eaaw5531. [Google Scholar] [CrossRef] [Green Version]
- Salvadori, G.; Durante, F.; De Michele, C.; Bernardi, M.; Petrella, L. A multivariate copula-based framework for dealing with hazard scenarios and failure probabilities. Water Resour. Res. 2016, 52, 3701–3721. [Google Scholar] [CrossRef] [Green Version]
- Serinaldi, F. Dismissing return periods! Stoch. Environ. Res. Risk Assess. 2015, 29, 1179–1189. [Google Scholar] [CrossRef] [Green Version]
- Couasnon, A.; Eilander, D.; Muis, S.; Veldkamp, T.I.E.; Haigh, I.D.; Wahl, T.; Winsemius, H.C.; Ward, P.J. Measuring compound flood potential from river discharge and storm surge extremes at the global scale. Nat. Hazards Earth Syst. Sci. 2020, 20, 489–504. [Google Scholar] [CrossRef] [Green Version]
- Muñoz, D.F.; Moftakhari, H.; Moradkhani, H. Compound Effects of Flood Drivers and Wetland Elevation Correction on Coastal Flood Hazard Assessment. Water Resour. Res. 2020, 56, e2020WR027544. [Google Scholar] [CrossRef]
- Sadegh, M.; Moftakhari, H.; Gupta, H.V.; Ragno, E.; Mazdiyasni, O.; Sanders, B.; Matthew, R.; AghaKouchak, A. Multihazard Scenarios for Analysis of Compound Extreme Events. Geophys. Res. Lett. 2018, 45, 5470–5480. [Google Scholar] [CrossRef] [Green Version]
- Sopelana, J.; Cea, L.; Ruano, S. A continuous simulation approach for the estimation of extreme flood inundation in coastal river reaches affected by meso- and macrotides. Nat. Hazards 2018, 93, 1337–1358. [Google Scholar] [CrossRef]
- Wu, W.; Westra, S.; Leonard, M. Estimating the probability of compound floods in estuarine regions. Hydrol. Earth Syst. Sci. 2021, 25, 2821–2841. [Google Scholar] [CrossRef]
- Bermúdez, M.; Farfán, J.F.; Willems, P.; Cea, L. Assessing the Effects of Climate Change on Compound Flooding in Coastal River Areas. Water Resour. Res. 2021, 57, e2020WR029321. [Google Scholar] [CrossRef]
- Sušnik, J.; Strehl, C.; Postmes, L.A.; Vamvakeridou-Lyroudia, L.S.; Mälzer, H.J.; Savić, D.A.; Kapelan, Z. Assessing Financial Loss due to Pluvial Flooding and the Efficacy of Risk-Reduction Measures in the Residential Property Sector. Water Resour. Manag. 2015, 29, 161–179. [Google Scholar] [CrossRef] [Green Version]
- Prokić, M.; Savić, S.; Pavić, D. Pluvial flooding in Urban Areas Across the European Continent. Geogr. Pannonica 2019, 23, 216–232. [Google Scholar] [CrossRef] [Green Version]
- Wang, L.; Li, J.; Deng, Z.; Gong, Q. Spotting strategic storm drain inlets in flat urban catchments. J. Hydrol. 2021, 600, 126504. [Google Scholar] [CrossRef]
- Bertsch, R.; Glenis, V.; Kilsby, C. Urban flood simulation using synthetic storm drain networks. Water 2017, 9, 925. [Google Scholar] [CrossRef] [Green Version]
- Walsh, T.C.; Pomeroy, C.A.; Burian, S.J. Hydrologic modeling analysis of a passive, residential rainwater harvesting program in an urbanized, semi-arid watershed. J. Hydrol. 2014, 508, 240–253. [Google Scholar] [CrossRef]
- Zhu, Z.; Chen, Z.; Chen, X.; He, P. Approach for evaluating inundation risks in urban drainage systems. Sci. Total Environ. 2016, 553, 1–12. [Google Scholar] [CrossRef]
- Hao, X.; Li, Y.; Liu, S. Comparison of dynamic flow interaction methods between pipe system and overland in urban flood analysis. Sci. Rep. 2021, 11, 12079. [Google Scholar] [CrossRef]
- Rubinato, M.; Lee, S.; Martins, R.; Shucksmith, J.D. Surface to sewer flow exchange through circular inlets during urban flood conditions. J. Hydroinform. 2018, 20, 564–576. [Google Scholar] [CrossRef] [Green Version]
- Sanz-Ramos, M.; Tellez Alvarez, J.D.; Bladé, E.; Gómez-Valentín, M. Simulating the Hydrodynamics of Sewer-Inlets Using a 2D-SWE Based Model. In Advances in Hydroinformatics; Springer Water; Springer: Singapore, 2020. [Google Scholar]
- Rubinato, M.; Martins, R.; Kesserwani, G.; Leandro, J.; Djordjević, S.; Shucksmith, J. Experimental calibration and validation of sewer/surface flow exchange equations in steady and unsteady flow conditions. J. Hydrol. 2017, 552, 421–432. [Google Scholar] [CrossRef]
- Dai, S.; Jin, S.; Qian, C.; Yang, N.; Ma, Y.; Liang, C. Interception efficiency of grate inlets for sustainable urban drainage systems design under different road slopes and approaching discharges. Urban Water J. 2021, 18, 650–661. [Google Scholar] [CrossRef]
- Cárdenas-Quintero, M.; Carvajal-Serna, F. Review of the hydraulic capacity of urban grate inlet: A global and Latin American perspective. Water Sci. Technol. 2021, 83, 2575–2596. [Google Scholar] [CrossRef]
- Cosco, C.; Gómez, M.; Russo, B.; Tellez-Alvarez, J.; Macchione, F.; Costabile, P.; Costanzo, C. Discharge coefficients for specific grated inlets. Influence of the Froude number. Urban Water J. 2020, 17, 656–668. [Google Scholar] [CrossRef]
- Gómez, M.; Russo, B. Hydraulic Efficiency of Continuous Transverse Grates for Paved Areas. J. Irrig. Drain. Eng. 2009, 135, 225–230. [Google Scholar] [CrossRef]
- Gómez, M.; Recasens, J.; Russo, B.; Martínez-Gomariz, E. Assessment of inlet efficiency through a 3D simulation: Numerical and experimental comparison. Water Sci. Technol. 2016, 74, 1926–1935. [Google Scholar] [CrossRef] [Green Version]
- Gómez, M.; Parés, J.; Russo, B.; Martínez-Gomariz, E. Methodology to quantify clogging coefficients for grated inlets. Application to SANT MARTI catchment (Barcelona). J. Flood Risk Manag. 2019, 12, c12479. [Google Scholar] [CrossRef] [Green Version]
- Kemper, S.; Schlenkhoff, A. Experimental study on the hydraulic capacity of grate inlets with supercritical surface flow conditions. Water Sci. Technol. 2019, 79, 1717–1726. [Google Scholar] [CrossRef]
- Tellez-Alvarez, J.; Gómez, M.; Russo, B.; Amezaga-Kutija, M. Numerical and experimental approaches to estimate discharge coefficients and energy loss coefficients in pressurized grated inlets. Hydrology 2021, 8, 162. [Google Scholar] [CrossRef]
- Leitão, J.P.; Simões, N.E.; Pina, R.D.; Ochoa-Rodriguez, S.; Onof, C.; Sá Marques, A. Stochastic evaluation of the impact of sewer inlets’ hydraulic capacity on urban pluvial flooding. Stoch. Environ. Res. Risk Assess. 2017, 31, 1907–1922. [Google Scholar] [CrossRef]
- Gómez, M.; Rabasseda, G.H.; Russo, B. Experimental campaign to determine grated inlet clogging factors in an urban catchment of Barcelona. Urban Water J. 2013, 10, 50–61. [Google Scholar] [CrossRef]
- Leng, L.; Mao, X.; Jia, H.; Xu, T.; Chen, A.S.; Yin, D.; Fu, G. Performance assessment of coupled green-grey-blue systems for Sponge City construction. Sci. Total Environ. 2020, 728, 138608. [Google Scholar] [CrossRef] [PubMed]
- Martínez, C.; Vojinovic, Z.; Sanchez, A. Multi-objective model-based assessment of green-grey infrastructures for urban flood mitigation. Hydrology 2021, 8, 110. [Google Scholar] [CrossRef]
- Rodriguez, M.; Fu, G.; Butler, D.; Yuan, Z.; Sharma, K. Exploring the spatial impact of green infrastructure on urban drainage resilience. Water 2021, 13, 1789. [Google Scholar] [CrossRef]
- Viavattene, C.; Ellis, J.B. The management of urban surface water flood risks: SUDS performance in flood reduction from extreme events. Water Sci. Technol. 2013, 67, 99–108. [Google Scholar] [CrossRef]
- Costabile, P.; Costanzo, C.; MacChione, F. A storm event watershed model for surface runoff based on 2D fully dynamic wave equations. Hydrol. Process. 2013, 27, 554–569. [Google Scholar] [CrossRef]
- Mignot, E.; Li, X.; Dewals, B. Experimental modelling of urban flooding: A review. J. Hydrol. 2019, 568, 334–342. [Google Scholar] [CrossRef] [Green Version]
- Isidoro, J.M.G.P.; de Lima, J.L.M.P.; Leandro, J. The study of rooftop connectivity on the rainfall-runoff process by means of a rainfall simulator and a physical model. Z. Geomorphol. Suppl. Issues 2013, 57, 177–191. [Google Scholar] [CrossRef]
- Fraga, I.; Cea, L.; Puertas, J. Validation of a 1D-2D dual drainage model under unsteady part-full and surcharged sewer conditions. Urban Water J. 2017, 14, 74–84. [Google Scholar] [CrossRef]
- Naves, J.; Rieckermann, J.; Cea, L.; Puertas, J.; Anta, J. Global and local sensitivity analysis to improve the understanding of physically-based urban wash-off models from high-resolution laboratory experiments. Sci. Total Environ. 2020, 709, 136152. [Google Scholar] [CrossRef] [PubMed]
- Alves, P.B.R.; Djordjević, S.; Javadi, A.A. An integrated socio-environmental framework for mapping hazard-specific vulnerability and exposure in urban areas. Urban Water J. 2021, 18, 530–543. [Google Scholar] [CrossRef]
- Moreira, L.L.; De Brito, M.M.; Kobiyama, M. Review article: A systematic review and future prospects of flood vulnerability indices. Nat. Hazards Earth Syst. Sci. 2021, 21, 1513–1530. [Google Scholar] [CrossRef]
- Tate, E.; Rahman, M.A.; Emrich, C.T.; Sampson, C.C. Flood exposure and social vulnerability in the United States. Nat. Hazards 2021, 106, 435–457. [Google Scholar] [CrossRef]
- Wu, T. Quantifying coastal flood vulnerability for climate adaptation policy using principal component analysis. Ecol. Indic. 2021, 129, 108006. [Google Scholar] [CrossRef]
- Koks, E.E.; Jongman, B.; Husby, T.G.; Botzen, W.J.W. Combining hazard, exposure and social vulnerability to provide lessons for flood risk management. Environ. Sci. Policy 2015, 47, 42–52. [Google Scholar] [CrossRef]
- De Brito, M.M.; Evers, M.; Delos Santos Almoradie, A. Participatory flood vulnerability assessment: A multi-criteria approach. Hydrol. Earth Syst. Sci. 2018, 22, 373–390. [Google Scholar] [CrossRef] [Green Version]
- Aroca-Jimenez, E.; Bodoque, J.M.; Antonio Garcia, J.; Diez-Herrero, A. Construction of an integrated social vulnerability index in urban areas prone to flash flooding. Nat. Hazards Earth Syst. Sci. 2017, 17, 1541–1557. [Google Scholar] [CrossRef] [Green Version]
- Cutter, S.L.; Boruff, B.J.; Shirley, W.L. Social vulnerability to environmental hazards. Soc. Sci. Q. 2003, 84, 242–261. [Google Scholar] [CrossRef]
- Spielman, S.E.; Tuccillo, J.; Folch, D.C.; Schweikert, A.; Davies, R.; Wood, N.; Tate, E. Evaluating social vulnerability indicators: Criteria and their application to the Social Vulnerability Index. Nat. Hazards 2020, 100, 417–436. [Google Scholar] [CrossRef] [Green Version]
- Roder, G.; Sofia, G.; Wu, Z.; Tarolli, P. Assessment of Social Vulnerability to floods in the floodplain of northern Italy. Weather Clim. Soc. 2017, 9, 717–737. [Google Scholar] [CrossRef]
- Milanesi, L.; Pilotti, M.; Belleri, A.; Marini, A.; Fuchs, S. Vulnerability to Flash Floods: A Simplified Structural Model for Masonry Buildings. Water Resour. Res. 2018, 54, 7177–7197. [Google Scholar] [CrossRef]
- Martínez-Gomariz, E.; Gómez, M.; Russo, B.; Djordjević, S. Stability criteria for flooded vehicles: A state-of-the-art review. J. Flood Risk Manag. 2018, 11, S817–S826. [Google Scholar] [CrossRef]
- Martínez-Gomariz, E.; Gómez, M.; Russo, B.; Sánchez, P.; Montes, J.A. Methodology for the damage assessment of vehicles exposed to flooding in urban areas. J. Flood Risk Manag. 2019, 12, e12475. [Google Scholar] [CrossRef]
- Martínez-Gomariz, E.; Gómez, M.; Russo, B. Experimental study of the stability of pedestrians exposed to urban pluvial flooding. Nat. Hazards 2016, 82, 1259–1278. [Google Scholar] [CrossRef] [Green Version]
- Arrighi, C.; Oumeraci, H.; Castelli, F. Hydrodynamics of pedestrians’ instability in floodwaters. Hydrol. Earth Syst. Sci. 2017, 21, 515–531. [Google Scholar] [CrossRef] [Green Version]
- Milanesi, L.; Pilotti, M.; Ranzi, R. A conceptual model of people’s vulnerability to floods. Water Resour. Res. 2015, 51, 182–197. [Google Scholar] [CrossRef]
- Mobini, S.; Becker, P.; Larsson, R.; Berndtsson, R. Systemic inequity in urban flood exposure and damage compensation. Water 2020, 12, 3152. [Google Scholar] [CrossRef]
- Sörensen, J.; Persson, A.; Sternudd, C.; Aspegren, H.; Nilsson, J.; Nordström, J.; Jönsson, K.; Mottaghi, M.; Becker, P.; Pilesjö, P.; et al. Re-thinking urban flood management-time for a regime shift. Water 2016, 8, 332. [Google Scholar] [CrossRef] [Green Version]
- EU Commission. Water Framework Directive (2000/60/EC); EU: Brussels, Belgium, 2000; Volume L269. [Google Scholar]
- Traver, R. Flood Risk Management: Call for a National Strategy; American Society of Civil Engineers: Reston, VA, USA, 2014. [Google Scholar]
- Luke, A.; Sanders, B.F.; Goodrich, K.A.; Feldman, D.L.; Boudreau, D.; Eguiarte, A.; Serrano, K.; Reyes, A.; Schubert, J.E.; Aghakouchak, A.; et al. Going beyond the flood insurance rate map: Insights from flood hazard map co-production. Nat. Hazards Earth Syst. Sci. 2018, 18, 1097–1120. [Google Scholar] [CrossRef] [Green Version]
- Hegger, D.L.T.; Driessen, P.P.J.; Dieperink, C.; Wiering, M.; Raadgever, G.T.T.; van Rijswick, H.F.M.W. Assessing stability and dynamics in flood risk governance: An empirically illustrated research approach. Water Resour. Manag. 2014, 28, 4127–4142. [Google Scholar] [CrossRef]
- Driessen, P.P.J.; Hegger, D.L.T.; Kundzewicz, Z.W.; van Rijswick, H.F.M.W.; Crabbé, A.; Larrue, C.; Matczak, P.; Pettersson, M.; Priest, S.; Suykens, C.; et al. Governance strategies for improving flood resilience in the face of climate change. Water 2018, 10, 1595. [Google Scholar] [CrossRef] [Green Version]
- Hegger, D.L.T.; Driessen, P.P.J.; Wiering, M.; Van Rijswick, H.F.M.W.; Kundzewicz, Z.W.; Matczak, P.; Crabbé, A.; Raadgever, G.T.; Bakker, M.H.N.; Priest, S.J.; et al. Toward more flood resilience: Is a diversification of flood risk management strategies the way forward? Ecol. Soc. 2016, 21, 52. [Google Scholar] [CrossRef]
- Tariq, M.A.U.R.; Rajabi, Z.; Muttil, N. An evaluation of risk-based agricultural land-use adjustments under a flood management strategy in a floodplain. Hydrology 2021, 8, 53. [Google Scholar] [CrossRef]
- Hartmann, T.; Jüpner, R. Implementing resilience in flood risk management. WIREs Water 2020, 7, e1465. [Google Scholar] [CrossRef]
- Alexander, D.E. Resilience and disaster risk reduction: An etymological journey. Nat. Hazards Earth Syst. Sci. 2013, 13, 2707–2716. [Google Scholar] [CrossRef] [Green Version]
- Rodina, L. Defining “water resilience”: Debates, concepts, approaches, and gaps. WIREs Water 2019, 6, c1334. [Google Scholar] [CrossRef]
- McClymont, K.; Morrison, D.; Beevers, L.; Carmen, E. Flood resilience: A systematic review. J. Environ. Plan. Manag. 2020, 63, 1151–1176. [Google Scholar] [CrossRef] [Green Version]
- Karrasch, L.; Restemeyer, B.; Klenke, T. The ‘Flood Resilience Rose’: A management tool to promote transformation towards flood resilience. J. Flood Risk Manag. 2021, 14, e12726. [Google Scholar] [CrossRef]
- Liao, K.H. A theory on urban resilience to floods—A basis for alternative planning practices. Ecol. Soc. 2012, 17, 48. [Google Scholar] [CrossRef]
- Forrest, S.A.; Trell, E.M.; Woltjer, J. Emerging citizen contributions, roles and interactions with public authorities in Dutch pluvial flood risk management. Int. J. Water Resour. Dev. 2021, 37, 1–23. [Google Scholar] [CrossRef] [Green Version]
- De Graaf, R.; Van De Giesen, N.; Van De Ven, F. Alternative water management options to reduce vulnerability for climate change in the Netherlands. Nat. Hazards 2009, 51, 407–422. [Google Scholar] [CrossRef]
- Lhomme, S.; Serre, D.; Diab, Y.; Laganier, R. Analyzing resilience of urban networks: A preliminary step towards more flood resilient cities. Nat. Hazards Earth Syst. Sci. 2013, 13, 221–230. [Google Scholar] [CrossRef] [Green Version]
- Alexander, M.; Priest, S.; Mees, H. A framework for evaluating flood risk governance. Environ. Sci. Policy 2016, 64, 38–47. [Google Scholar] [CrossRef]
- Bertilsson, L.; Wiklund, K.; de Moura Tebaldi, I.; Rezende, O.M.; Veról, A.P.; Miguez, M.G. Urban flood resilience—A multi-criteria index to integrate flood resilience into urban planning. J. Hydrol. 2019, 573, 970–982. [Google Scholar] [CrossRef]
- Moura Rezende, O.; Ribeiro da Cruz de Franco, A.B.; Beleño de Oliveira, A.K.; Pitzer Jacob, A.C.; Gomes Miguez, M. A framework to introduce urban flood resilience into the design of flood control alternatives. J. Hydrol. 2019, 576, 478–493. [Google Scholar] [CrossRef]
- Leandro, J.; Chen, K.F.; Wood, R.R.; Ludwig, R. A scalable flood-resilience-index for measuring climate change adaptation: Munich city. Water Res. 2020, 173, 115502. [Google Scholar] [CrossRef]
- Uddin, M.S.; Haque, C.E.; Walker, D.; Choudhury, M.U.I. Community resilience to cyclone and storm surge disasters: Evidence from coastal communities of Bangladesh. J. Environ. Manag. 2020, 264, 110457. [Google Scholar] [CrossRef]
- Miguez, M.G.; Veról, A.P. A catchment scale Integrated Flood Resilience Index to support decision making in urban flood control design. Environ. Plan B Urban Anal. City Sci. 2017, 44, 925–946. [Google Scholar] [CrossRef]
- Moghadas, M.; Asadzadeh, A.; Vafeidis, A.; Fekete, A.; Kötter, T. A multi-criteria approach for assessing urban flood resilience in Tehran, Iran. Int. J. Disaster Risk Reduct. 2019, 35, 101069. [Google Scholar] [CrossRef]
- Chen, J.; Chen, W.; Huang, G. Assessing urban pluvial flood resilience based on a novel grid-based quantification method that considers human risk perceptions. J. Hydrol. 2021, 601, 126601. [Google Scholar] [CrossRef]
- Mugume, S.N.; Gomez, D.E.; Fu, G.; Farmani, R.; Butler, D. A global analysis approach for investigating structural resilience in urban drainage systems. Water Res. 2015, 81, 15–26. [Google Scholar] [CrossRef] [PubMed] [Green Version]
- Lee, E.H.; Kim, J.H. Development of resilience index based on flooding damage in urban areas. Water 2017, 9, 428. [Google Scholar] [CrossRef] [Green Version]
- Wang, Y.; Meng, F.; Liu, H.; Zhang, C.; Fu, G. Assessing catchment scale flood resilience of urban areas using a grid cell based metric. Water Res. 2019, 163, 114852. [Google Scholar] [CrossRef]
- Tong, P. Characteristics, dimensions and methods of current assessment for urban resilience to climate-related disasters: A systematic review of the literature. Int. J. Disaster Risk Reduct. 2021, 60, 102276. [Google Scholar] [CrossRef]
- Kabisch, N.; Frantzeskaki, N.; Pauleit, S.; Naumann, S.; Davis, M.; Artmann, M.; Haase, D.; Knapp, S.; Korn, H.; Stadler, J.; et al. Nature-based solutions to climate change mitigation and adaptation in urban areas: Perspectives on indicators, knowledge gaps, barriers, and opportunities for action. Ecol. Soc. 2016, 21, 39. [Google Scholar] [CrossRef] [Green Version]
- Borga, M.; Anagnostou, E.N.; Blöschl, G.; Creutin, J.D. Flash flood forecasting, warning and risk management: The HYDRATE project. Environ. Sci. Policy 2011, 14, 834–844. [Google Scholar] [CrossRef]
- Hallegatte, S. A Cost Effective Solution to Reduce Disaster Losses in Developing Countries: Hydro-Meteorological Services, Early Warning, and Evacuation. In World Bank Policy Research Working Paper No. 6058; World Bank: Washington, DC, USA, 2012. [Google Scholar] [CrossRef]
- Bouwer, L.M.; Papyrakis, E.; Poussin, J.; Pfurtscheller, C.; Thieken, A.H. The Costing of Measures for Natural Hazard Mitigation in Europe. Nat. Hazards Rev. 2014, 15, 04014010. [Google Scholar] [CrossRef]
- Cohen-Shacham, E.; Walters, G.; Janzen, C.; Maginnis, S. Nature-Based Solutions to Address Global Societal Challenges; IUCN: Gland, Switzerland, 2016. [Google Scholar]
- Klijn, F.; de Bruin, D.; de Hoog, M.C.; Jansen, S.; Sijmons, D.F. Design quality of room-for-the-river measures in the Netherlands: Role and assessment of the quality team (Q-team). Int. J. River Basin Manag. 2013, 11, 287–299. [Google Scholar] [CrossRef]
- Klijn, F.; Asselman, N.; Wagenaar, D. Room for rivers: Risk reduction by enhancing the flood conveyance capacity of The Netherlands’ large rivers. Geosciences 2018, 8, 224. [Google Scholar] [CrossRef] [Green Version]
- Restemeyer, B.; Woltjer, J.; van den Brink, M. A strategy-based framework for assessing the flood resilience of cities—A Hamburg case study. Plan. Theory Pract. 2015, 16, 45–62. [Google Scholar] [CrossRef]
- Busscher, T.; van den Brink, M.; Verweij, S. Strategies for integrating water management and spatial planning: Organising for spatial quality in the Dutch “Room for the River” program. J. Flood Risk Manag. 2019, 12, e12448. [Google Scholar] [CrossRef] [Green Version]
- Saleh, F.; Weinstein, M.P. The role of nature-based infrastructure (NBI) in coastal resiliency planning: A literature review. J. Environ. Manag. 2016, 183, 1088–1098. [Google Scholar] [CrossRef] [PubMed]
- Cook, B.; Forrester, J.; Bracken, L.; Spray, C.; Oughton, E. Competing paradigms of flood management in the Scottish/English borderlands. Disaster Prev. Manag. 2016, 25, 314–328. [Google Scholar] [CrossRef] [Green Version]
- Waylen, K.A.; Holstead, K.L.; Colley, K.; Hopkins, J. Challenges to enabling and implementing Natural Flood Management in Scotland. J. Flood Risk Manag. 2018, 11, S1078–S1089. [Google Scholar] [CrossRef] [Green Version]
- United Nations. Sendai Framework for Disaster Risk Reduction 2015–2030; 69th session of the General Assembly; United Nations: New York, NY, USA, 2015.
- United Nations. Transforming Our World: The 2030 Agenda for Sustainable Development; Resolution adopted by the General Assembly; United Nations: New York, NY, USA, 2015.
- UNFCCC Paris Agreement, United Nations Framework Convention on Climate Change; United Nations: New York, NY, USA, 2015.
- Maes, J.; Jacobs, S. Nature-Based Solutions for Europe’s Sustainable Development. Conserv. Lett. 2017, 10, 121–124. [Google Scholar] [CrossRef] [Green Version]
- Zölch, T.; Henze, L.; Keilholz, P.; Pauleit, S. Regulating urban surface runoff through nature-based solutions—An assessment at the micro-scale. Environ. Res. 2017, 157, 135–144. [Google Scholar] [CrossRef]
- Kabisch, N.; Korn, H.; Stadler, J.; Bonn, A. Nature-Based Solutions to Climate Change Adaptation in Urban Areas—Linkages between Science, Policy and Practice; Springer: Cham, Switzerland, 2017. [Google Scholar]
- Nesshöver, C.; Assmuth, T.; Irvine, K.N.; Rusch, G.M.; Waylen, K.A.; Delbaere, B.; Haase, D.; Jones-Walters, L.; Keune, H.; Kovacs, E.; et al. The science, policy and practice of nature-based solutions: An interdisciplinary perspective. Sci. Total Environ. 2017, 579, 1215–1227. [Google Scholar] [CrossRef]
- Ruangpan, L.; Vojinovic, Z.; Di Sabatino, S.; Leo, L.S.; Capobianco, V.; Oen, A.M.P.; Mcclain, M.E.; Lopez-Gunn, E. Nature-based solutions for hydro-meteorological risk reduction: A state-of-the-art review of the research area. Nat. Hazards Earth Syst. Sci. 2020, 20, 243–270. [Google Scholar] [CrossRef] [Green Version]
- Sörensen, J.; Emilsson, T. Green roofs, stormwater and sustainability: Augustenborg as a research site. In The Eco-City Augustenborg: Experiences and Lessons Learned; Månsson, M., Persson, B., Eds.; Arkus: Malmö, Sweden, 2020; pp. 162–171. [Google Scholar]
- Vojinovic, Z.; Alves, A.; Gómez, J.P.; Weesakul, S.; Keerakamolchai, W.; Meesuk, V.; Sanchez, A. Effectiveness of small- and large-scale Nature-Based Solutions for flood mitigation: The case of Ayutthaya, Thailand. Sci. Total Environ. 2021, 789, 147725. [Google Scholar] [CrossRef]
- Ercolani, G.; Chiaradia, E.A.; Gandolfi, C.; Castelli, F.; Masseroni, D. Evaluating performances of green roofs for stormwater runoff mitigation in a high flood risk urban catchment. J. Hydrol. 2018, 566, 830–845. [Google Scholar] [CrossRef]
- Mei, C.; Liu, J.; Wang, H.; Yang, Z.; Ding, X.; Shao, W. Integrated assessments of green infrastructure for flood mitigation to support robust decision-making for sponge city construction in an urbanized watershed. Sci. Total Environ. 2018, 639, 1394–1407. [Google Scholar] [CrossRef] [PubMed]
- Yang, Y.; Chui, T.F.M. Integrated hydro-environmental impact assessment and alternative selection of low impact development practices in small urban catchments. J. Environ. Manag. 2018, 223, 324–337. [Google Scholar] [CrossRef] [PubMed]
- Ishimatsu, K.; Ito, K.; Mitani, Y.; Tanaka, Y.; Sugahara, T.; Naka, Y. Use of rain gardens for stormwater management in urban design and planning. Landsc. Ecol. Eng. 2017, 13, 205–212. [Google Scholar] [CrossRef]
- Shafique, M.; Kim, R. Recent progress in low-impact development in South Korea: Water-management policies, challenges and opportunities. Water 2018, 10, 435. [Google Scholar] [CrossRef] [Green Version]
- Rouillard, J.J.; Ball, T.; Heal, K.V.; Reeves, A.D. Policy implementation of catchment-scale flood risk management: Learning from Scotland and England. Environ. Sci. Policy 2015, 50, 155–165. [Google Scholar] [CrossRef]
- De Risi, R.; De Paola, F.; Turpie, J.; Kroeger, T. Life Cycle Cost and Return on Investment as complementary decision variables for urban flood risk management in developing countries. Int. J. Disaster Risk Reduct. 2018, 28, 88–106. [Google Scholar] [CrossRef]
- Bhattacharjee, K.; Behera, B. Does forest cover help prevent flood damage? Empirical evidence from India. Glob. Environ. Chang. 2018, 53, 78–89. [Google Scholar] [CrossRef]
- Chou, R.J. Achieving successful river restoration in dense urban areas: Lessons from Taiwan. Sustainability 2016, 8, 1159. [Google Scholar] [CrossRef] [Green Version]
- Thorslund, J.; Jarsjo, J.; Jaramillo, F.; Jawitz, J.W.; Manzoni, S.; Basu, N.B.; Chalov, S.R.; Cohen, M.J.; Creed, I.F.; Goldenberg, R.; et al. Wetlands as large-scale nature-based solutions: Status and challenges for research, engineering and management. Ecol. Eng. 2017, 108, 489–497. [Google Scholar] [CrossRef]
- Casteller, A.; Häfelfinger, T.; Cortés Donoso, E.; Podvin, K.; Kulakowski, D.; Bebi, P. Assessing the interaction between mountain forests and snow avalanches at Nevados de Chillán, Chile and its implications for ecosystem-based disaster risk reduction. Nat. Hazards Earth Syst. Sci. 2018, 18, 1173–1186. [Google Scholar] [CrossRef] [Green Version]
- Watkin, L.J.; Ruangpan, L.; Vojinovic, Z.; Weesakul, S.; Torres, A.S. A framework for assessing benefits of implemented nature-based solutions. Sustainability 2019, 11, 6788. [Google Scholar] [CrossRef] [Green Version]
- Hu, M.; Sayama, T.; Zhang, X.; Tanaka, K.; Takara, K.; Yang, H. Evaluation of low impact development approach for mitigating flood inundation at a watershed scale in China. J. Environ. Manag. 2017, 193, 430–438. [Google Scholar] [CrossRef] [PubMed]
- Huang, Y.; Tian, Z.; Ke, Q.; Liu, J.; Irannezhad, M.; Fan, D.; Hou, M.; Sun, L. Nature-based solutions for urban pluvial flood risk management. WIREs Water 2020, 7, e1421. [Google Scholar] [CrossRef]
- Qin, H.P.; Li, Z.X.; Fu, G. The effects of low impact development on urban flooding under different rainfall characteristics. J. Environ. Manag. 2013, 129, 577–585. [Google Scholar] [CrossRef] [PubMed] [Green Version]
- Schanze, J. Nature-based solutions in flood risk management—Buzzword or innovation? J. Flood Risk Manag. 2017, 10, 281–282. [Google Scholar] [CrossRef]
- Alfieri, L.; Salamon, P.; Pappenberger, F.; Wetterhall, F.; Thielen, J. Operational early warning systems for water-related hazards in Europe. Environ. Sci. Policy 2012, 21, 35–49. [Google Scholar] [CrossRef]
- Arrighi, C.; Pregnolato, M.; Dawson, R.J.; Castelli, F. Preparedness against mobility disruption by floods. Sci. Total Environ. 2019, 654, 1010–1022. [Google Scholar] [CrossRef]
- Bernardini, G.; Romano, G.; Soldini, L.; Quagliarini, E. How urban layout and pedestrian evacuation behaviours can influence flood risk assessment in riverine historic built environments. Sustain. Cities Soc. 2021, 70, 102876. [Google Scholar] [CrossRef]
- Arosio, M.; Arrighi, C.; Cesarini, L.; Martina, M.L.V. Service accessibility risk (SAR) assessment for pluvial and fluvial floods in an urban context. Hydrology 2021, 8, 142. [Google Scholar] [CrossRef]
- Webster, P.J. Meteorology: Improve weather forecasts for the developing world. Nature 2013, 493, 17–19. [Google Scholar] [CrossRef] [PubMed]
- Li, X.; Rankin, C.; Gangrade, S.; Zhao, G.; Lander, K.; Voisin, N.; Shao, M.; Morales-Hernández, M.; Kao, S.-C.; Gao, H. Evaluating precipitation, streamflow, and inundation forecasting skills during extreme weather events: A case study for an urban watershed. J. Hydrol. 2021, 603, 127126. [Google Scholar] [CrossRef]
- Alvarez-Garreton, C.; Ryu, D.; Western, A.W.; Su, C.H.; Crow, W.T.; Robertson, D.E.; Leahy, C. Improving operational flood ensemble prediction by the assimilation of satellite soil moisture: Comparison between lumped and semi-distributed schemes. Hydrol. Earth Syst. Sci. 2015, 19, 1659–1676. [Google Scholar] [CrossRef] [Green Version]
- Oleyiblo, J.O.; Li, Z.J. Application of HEC-HMS for flood forecasting in Misai and Wan’an catchments in China. Water Sci. Eng. 2010, 3, 14–22. [Google Scholar] [CrossRef]
- Mure-Ravaud, M.; Binet, G.; Bracq, M.; Perarnaud, J.J.; Fradin, A.; Litrico, X. A web based tool for operational real-time flood forecasting using data assimilation to update hydraulic states. Environ. Model. Softw. 2016, 84, 35–49. [Google Scholar] [CrossRef]
- Thiemig, V.; Bisselink, B.; Pappenberger, F.; Thielen, J. A pan-African medium-range ensemble flood forecast system. Hydrol. Earth Syst. Sci. 2015, 19, 3365–3385. [Google Scholar] [CrossRef] [Green Version]
- Kasiviswanathan, K.S.; He, J.; Sudheer, K.P.; Tay, J.H. Potential application of wavelet neural network ensemble to forecast streamflow for flood management. J. Hydrol. 2016, 536, 161–173. [Google Scholar] [CrossRef]
- Kumar, M.; Sahay, R.R. Wavelet-genetic programming conjunction model for flood forecasting in rivers. Hydrol. Res. 2018, 49, 1880–1889. [Google Scholar] [CrossRef]
- Van Steenbergen, N.; Willems, P. Increasing river flood preparedness by real-time warning based on wetness state conditions. J. Hydrol. 2013, 489, 227–237. [Google Scholar] [CrossRef]
- Massari, C.; Brocca, L.; Barbetta, S.; Papathanasiou, C.; Mimikou, M.; Moramarco, T. Using globally available soil moisture indicators for flood modelling in Mediterranean catchments. Hydrol. Earth Syst. Sci. 2014, 18, 839–853. [Google Scholar] [CrossRef] [Green Version]
- Wanders, N.; Karssenberg, D.; De Roo, A.; De Jong, S.M.; Bierkens, M.F.P. The suitability of remotely sensed soil moisture for improving operational flood forecasting. Hydrol. Earth Syst. Sci. 2014, 18, 2343–2357. [Google Scholar] [CrossRef] [Green Version]
- Tayfur, G.; Zucco, G.; Brocca, L.; Moramarco, T. Coupling soil moisture and precipitation observations for predicting hourly runoff at small catchment scale. J. Hydrol. 2014, 510, 363–371. [Google Scholar] [CrossRef] [Green Version]
- Cea, L.; Fraga, I. Incorporating Antecedent Moisture Conditions and Intraevent Variability of Rainfall on Flood Frequency Analysis in Poorly Gauged Basins. Water Resour. Res. 2018, 54, 8774–8791. [Google Scholar] [CrossRef]
- González-Cao, J.; García-Feal, O.; Fernández-Nóvoa, D.; Domínguez-Alonso, J.M.; Gómez-Gesteira, M. Towards an automatic early warning system of flood hazards based on precipitation forecast: The case of the Miño River (NW Spain). Nat. Hazards Earth Syst. Sci. 2019, 19, 2583–2595. [Google Scholar] [CrossRef] [Green Version]
- Fraga, I.; Cea, L.; Puertas, J. MERLIN: A flood hazard forecasting system for coastal river reaches. Nat. Hazards 2020, 100, 1171–1193. [Google Scholar] [CrossRef]
- Ming, X.; Liang, Q.; Xia, X.; Li, D.; Fowler, H.J. Real-Time Flood Forecasting Based on a High-Performance 2-D Hydrodynamic Model and Numerical Weather Predictions. Water Resour. Res. 2020, 56, e2019WR025583. [Google Scholar] [CrossRef]
- Acosta-Coll, M.; Ballester-Merelo, F.; Martinez-Peiró, M.; De la Hoz-Franco, E. Real-time early warning system design for pluvial flash floods—A review. Sensors 2018, 18, 2255. [Google Scholar] [CrossRef] [Green Version]
- Flack, D.L.A.; Skinner, C.J.; Hawkness-Smith, L.; O’Donnell, G.; Thompson, R.J.; Waller, J.A.; Chen, A.S.; Moloney, J.; Largeron, C.; Xia, X.; et al. Recommendations for improving integration in national end-to-end flood forecasting systems: An overview of the FFIR (Flooding From Intense Rainfall) programme. Water 2019, 11, 725. [Google Scholar] [CrossRef] [Green Version]
- Goodarzi, L.; Banihabib, M.E.; Roozbahani, A. A decision-making model for flood warning system based on ensemble forecasts. J. Hydrol. 2019, 573, 207–219. [Google Scholar] [CrossRef]
- Liu, Y.; Wang, H.; Lei, X. Real-time forecasting of river water level in urban based on radar rainfall: A case study in Fuzhou City. J. Hydrol. 2021, 603, 126820. [Google Scholar] [CrossRef]
- Adams, T.E.; Dymond, R.L. Possible hydrologic forecasting improvements resulting from advancements in precipitation estimation and forecasting for a real-time flood forecast system in the Ohio River Valley, USA. J. Hydrol. 2019, 579, 124138. [Google Scholar] [CrossRef]
- Senatore, A.; Furnari, L.; Mendicino, G. Impact of high-resolution sea surface temperature representation on the forecast of small Mediterranean catchments’ hydrological responses to heavy precipitation. Hydrol. Earth Syst. Sci. 2020, 24, 269–291. [Google Scholar] [CrossRef] [Green Version]
- Ayzel, G. Openforecast v2: Development and benchmarking of the first national-scale operational runoff forecasting system in russia. Hydrology 2021, 8, 3. [Google Scholar] [CrossRef]
- Cools, J.; Innocenti, D.; O’Brien, S. Lessons from flood early warning systems. Environ. Sci. Policy 2016, 58, 117–122. [Google Scholar] [CrossRef]
- Mayhorn, C.B.; McLaughlin, A.C. Warning the world of extreme events: A global perspective on risk communication for natural and technological disaster. Saf. Sci. 2014, 61, 43–50. [Google Scholar] [CrossRef]
- Demeritt, D.; Nobert, S. Models of best practice in flood risk communication and management. Environ. Hazards 2014, 13, 313–328. [Google Scholar] [CrossRef] [Green Version]
- Gautam, D.K.; Phaiju, A.G. Community Based Approach to Flood Early Warning in West Rapti River Basin of Nepal. J. Integr. Disaster Risk Manag. 2013, 3, 155–169. [Google Scholar] [CrossRef]
- Baudoin, M.-A.; Henly-Shepard, S.; Fernando, N.; Sitati, A.; Zommers, Z. Early Warning Systems and Livelihood Resilience: Exploring Opportunities for Community Participation; United Nations University Institute of Environment and Human Security (UNU-EHS): Bonn, Germany, 2014; Volume 1. [Google Scholar]
- Kuller, M.; Schoenholzer, K.; Lienert, J. Creating effective flood warnings: A framework from a critical review. J. Hydrol. 2021, 602, 126708. [Google Scholar] [CrossRef]
- Kreibich, H.; Hudson, P.; Merz, B. Knowing what to do substantially improves the effectiveness of flood early warning. Bull. Am. Meteorol. Soc. 2021, 102, E1450–E1463. [Google Scholar] [CrossRef]
- Speight, L.J.; Cranston, M.D.; White, C.J.; Kelly, L. Operational and emerging capabilities for surface water flood forecasting. Wiley Interdiscip. Rev. Water 2021, 8, e1517. [Google Scholar] [CrossRef]
- Edelenbos, J.; Van Buuren, A.; Roth, D.; Winnubst, M. Stakeholder initiatives in flood risk management: Exploring the role and impact of bottom-up initiatives in three ‘Room for the River’ projects in the Netherlands. J. Environ. Plan. Manag. 2017, 60, 47–66. [Google Scholar] [CrossRef] [Green Version]
- McEwen, L.; Holmes, A.; Quinn, N.; Cobbing, P. ‘Learning for resilience’: Developing community capital through flood action groups in urban flood risk settings with lower social capital. Int. J. Disaster Risk Reduct. 2018, 27, 329–342. [Google Scholar] [CrossRef]
- Henstra, D.; Minano, A.; Thistlethwaite, J. Communicating disaster risk? An evaluation of the availability and quality of flood maps. Nat. Hazards Earth Syst. Sci. 2019, 19, 313–323. [Google Scholar] [CrossRef] [Green Version]
- Morrison, A.; Westbrook, C.J.; Noble, B.F. A review of the flood risk management governance and resilience literature. J. Flood Risk Manag. 2018, 11, 291–304. [Google Scholar] [CrossRef]
- Matczak, P.; Hegger, D.L.T. Flood risk governance for more resilience-reviewing the special issue’s contribution to existing insights. Water 2020, 12, 2122. [Google Scholar] [CrossRef]
- Maskrey, S.A.; Mount, N.J.; Thorne, C.R.; Dryden, I. Participatory modelling for stakeholder involvement in the development of flood risk management intervention options. Environ. Model. Softw. 2016, 82, 275–294. [Google Scholar] [CrossRef]
- Argent, R.M.; Sojda, R.S.; Guipponi, C.; McIntosh, B.; Voinov, A.A.; Maier, H.R. Best practices for conceptual modelling in environmental planning and management. Environ. Model. Softw. 2016, 80, 113–121. [Google Scholar] [CrossRef]
- Leskens, J.G.; Brugnach, M.; Hoekstra, A.Y.; Schuurmans, W. Why are decisions in flood disaster management so poorly supported by information from flood models? Environ. Model. Softw. 2014, 53, 53–61. [Google Scholar] [CrossRef]
- Hagemeier-Klose, M.; Wagner, K. Evaluation of flood hazard maps in print and web mapping services as information tools in flood risk communication. Nat. Hazards Earth Syst. Sci. 2009, 9, 563–574. [Google Scholar] [CrossRef]
- O’Sullivan, J.J.; Bradford, R.A.; Bonaiuto, M.; De Dominicis, S.; Rotko, P.; Aaltonen, J.; Waylen, K.; Langan, S.J. Enhancing flood resilience through improved risk communications. Nat. Hazards Earth Syst. Sci. 2012, 12, 2271–2282. [Google Scholar] [CrossRef]
- Strathie, A.; Netto, G.; Walker, G.H.; Pender, G. How presentation format affects the interpretation of probabilistic flood risk information. J. Flood Risk Manag. 2017, 10, 87–96. [Google Scholar] [CrossRef] [Green Version]
- Bradford, R.A.; O’Sullivan, J.J.; Van Der Craats, I.M.; Krywkow, J.; Rotko, P.; Aaltonen, J.; Bonaiuto, M.; De Dominicis, S.; Waylen, K.; Schelfaut, K. Risk perception—Issues for flood management in Europe. Nat. Hazards Earth Syst. Sci. 2012, 12, 2299–2309. [Google Scholar] [CrossRef]
- Botzen, W.J.W.; Aerts, J.C.J.H.; Van Den Bergh, J.C.J.M. Dependence of flood risk perceptions on socioeconomic and objective risk factors. Water Resour. Res. 2009, 45, W10440. [Google Scholar] [CrossRef] [Green Version]
- Bubeck, P.; Botzen, W.J.W.; Aerts, J.C.J.H. A Review of Risk Perceptions and Other Factors that Influence Flood Mitigation Behavior. Risk Anal. 2012, 32, 1481–1495. [Google Scholar] [CrossRef] [Green Version]
- Meyer, V.; Kuhlicke, C.; Luther, J.; Fuchs, S.; Priest, S.; Dorner, W.; Serrhini, K.; Pardoe, J.; McCarthy, S.; Seidel, J.; et al. Recommendations for the user-specific enhancement of flood maps. Nat. Hazards Earth Syst. Sci. 2012, 12, 1701–1716. [Google Scholar] [CrossRef]
- Rollason, E.; Bracken, L.J.; Hardy, R.J.; Large, A.R.G. Rethinking flood risk communication. Nat. Hazards 2018, 92, 1665–1686. [Google Scholar] [CrossRef] [Green Version]
- Bodoque, J.M.; Amérigo, M.; Díez-Herrero, A.; García, J.A.; Cortés, B.; Ballesteros-Cánovas, J.A.; Olcina, J. Improvement of resilience of urban areas by integrating social perception in flash-flood risk management. J. Hydrol. 2016, 541, 665–676. [Google Scholar] [CrossRef] [Green Version]
- Bodoque, J.M.; Díez-Herrero, A.; Amerigo, M.; García, J.A.; Olcina, J. Enhancing flash flood risk perception and awareness of mitigation actions through risk communication: A pre-post survey design. J. Hydrol. 2019, 568, 769–779. [Google Scholar] [CrossRef]
- Kreibich, H.; Müller, M.; Schröter, K.; Thieken, A.H. New insights into flood warning reception and emergency response by affected parties. Nat. Hazards Earth Syst. Sci. 2017, 17, 2075–2092. [Google Scholar] [CrossRef] [Green Version]
- Pilla, F.; Gharbia, S.S.; Lyons, R. How do households perceive flood-risk? The impact of flooding on the cost of accommodation in Dublin, Ireland. Sci. Total Environ. 2019, 650, 144–154. [Google Scholar] [CrossRef] [PubMed]
- Thaler, T.; Attems, M.S.; Bonnefond, M.; Clarke, D.; Gatien-Tournat, A.; Gralepois, M.; Fournier, M.; Murphy, C.; Rauter, M.; Papathoma-Köhle, M.; et al. Drivers and barriers of adaptation initiatives—How societal transformation affects natural hazard management and risk mitigation in Europe. Sci. Total Environ. 2019, 650, 1073–1082. [Google Scholar] [CrossRef]
- Morss, R.E.; Mulder, K.J.; Lazo, J.K.; Demuth, J.L. How do people perceive, understand, and anticipate responding to flash flood risks and warnings? Results from a public survey in Boulder, Colorado, USA. J. Hydrol. 2016, 541, 649–664. [Google Scholar] [CrossRef] [Green Version]
- Fuchs, S.; Karagiorgos, K.; Kitikidou, K.; Maris, F.; Paparrizos, S.; Thaler, T. Flood risk perception and adaptation capacity: A contribution to the socio-hydrology debate. Hydrol. Earth Syst. Sci. 2017, 21, 3183–3198. [Google Scholar] [CrossRef] [Green Version]
- Kellens, W.; Terpstra, T.; De Maeyer, P. Perception and Communication of Flood Risks: A Systematic Review of Empirical Research. Risk Anal. 2013, 33, 24–49. [Google Scholar] [CrossRef] [PubMed] [Green Version]
- Brennan, M.; O’Neill, E.; Brereton, F.; Dreoni, I.; Shahumyan, H. Exploring the spatial dimension of community-level flood risk perception: A cognitive mapping approach. Environ. Hazards 2016, 15, 279–310. [Google Scholar] [CrossRef]
- Roder, G.; Ruljigaljig, T.; Lin, C.W.; Tarolli, P. Natural hazards knowledge and risk perception of Wujie indigenous community in Taiwan. Nat. Hazards 2016, 81, 641–662. [Google Scholar] [CrossRef]
- Basco-Carrera, L.; Warren, A.; van Beek, E.; Jonoski, A.; Giardino, A. Collaborative modelling or participatory modelling? A framework for water resources management. Environ. Model. Softw. 2017, 91, 95–110. [Google Scholar] [CrossRef]
- Smith, P.; Brown, S.; Dugar, S. Community Based Early Warning Systems for flood risk mitigation in Nepal. Nat. Hazards Earth Syst. Sci. Discuss. 2016, 17, 423–437. [Google Scholar] [CrossRef] [Green Version]
- Sanders, B.F.; Schubert, J.E.; Goodrich, K.A.; Houston, D.; Feldman, D.L.; Basolo, V.; Luke, A.; Boudreau, D.; Karlin, B.; Cheung, W.; et al. Collaborative Modeling With Fine-Resolution Data Enhances Flood Awareness, Minimizes Differences in Flood Perception, and Produces Actionable Flood Maps. Earth’s Futur. 2020, 8, e2019EF001391. [Google Scholar] [CrossRef] [Green Version]
- Voinov, A.; Kolagani, N.; McCall, M.K.; Glynn, P.D.; Kragt, M.E.; Ostermann, F.O.; Pierce, S.A.; Ramu, P. Modelling with stakeholders—Next generation. Environ. Model. Softw. 2016, 77, 196–220. [Google Scholar] [CrossRef]
- Kuser Olsen, V.B.; Momen, B.; Langsdale, S.M.; Galloway, G.E.; Link, E.; Brubaker, K.L.; Ruth, M.; Hill, R.L. An approach for improving flood risk communication using realistic interactive visualisation. J. Flood Risk Manag. 2018, 11, S783–S793. [Google Scholar] [CrossRef]
- Zaalberg, R.; Midden, C.J.H. Living behind dikes: Mimicking flooding experiences. Risk Anal. 2013, 33, 866–876. [Google Scholar] [CrossRef] [PubMed]
- Qiu, L.; Du, Z.; Zhu, Q.; Fan, Y. An integrated flood management system based on linking environmental models and disaster-related data. Environ. Model. Softw. 2017, 91, 111–126. [Google Scholar] [CrossRef]
- Lai, J.S.; Chang, W.Y.; Chan, Y.C.; Kang, S.C.; Tan, Y.C. Development of a 3D virtual environment for improving public participation: Case study—The Yuansantze Flood Diversion Works Project. Adv. Eng. Inform. 2011, 25, 208–223. [Google Scholar] [CrossRef]
- Zhang, S.; Li, W.; Lei, X.; Ding, X.; Zhang, T. Implementation methods and applications of flow visualization in a watershed simulation platform. Adv. Eng. Softw. 2017, 112, 66–75. [Google Scholar] [CrossRef]
- Haynes, P.; Hehl-Lange, S.; Lange, E. Mobile Augmented Reality for Flood Visualisation. Environ. Model. Softw. 2018, 109, 380–389. [Google Scholar] [CrossRef]
- Tomkins, A.; Lange, E. Interactive landscape design and flood visualisation in augmented reality. Multimodal Technol. Interact. 2019, 3, 43. [Google Scholar] [CrossRef] [Green Version]
- Macchione, F.; Costabile, P.; Costanzo, C.; De Santis, R. Moving to 3-D flood hazard maps for enhancing risk communication. Environ. Model. Softw. 2019, 111, 510–522. [Google Scholar] [CrossRef]
- Costabile, P.; Costanzo, C.; De Lorenzo, G.; De Santis, R.; Penna, N.; Macchione, F. Terrestrial and airborne laser scanning and 2-D modelling for 3-D flood hazard maps in urban areas: New opportunities and perspectives. Environ. Model. Softw. 2021, 135, 104889. [Google Scholar] [CrossRef]
- Vamvakeridou-Lyroudia, L.S.; Chen, A.S.; Khoury, M.; Gibson, M.J.; Kostaridis, A.; Stewart, D.; Wood, M.; Djordjevic, S.; Savic, D.A. Assessing and visualising hazard impacts to enhance the resilience of Critical Infrastructures to urban flooding. Sci. Total Environ. 2020, 707, 136078. [Google Scholar] [CrossRef]
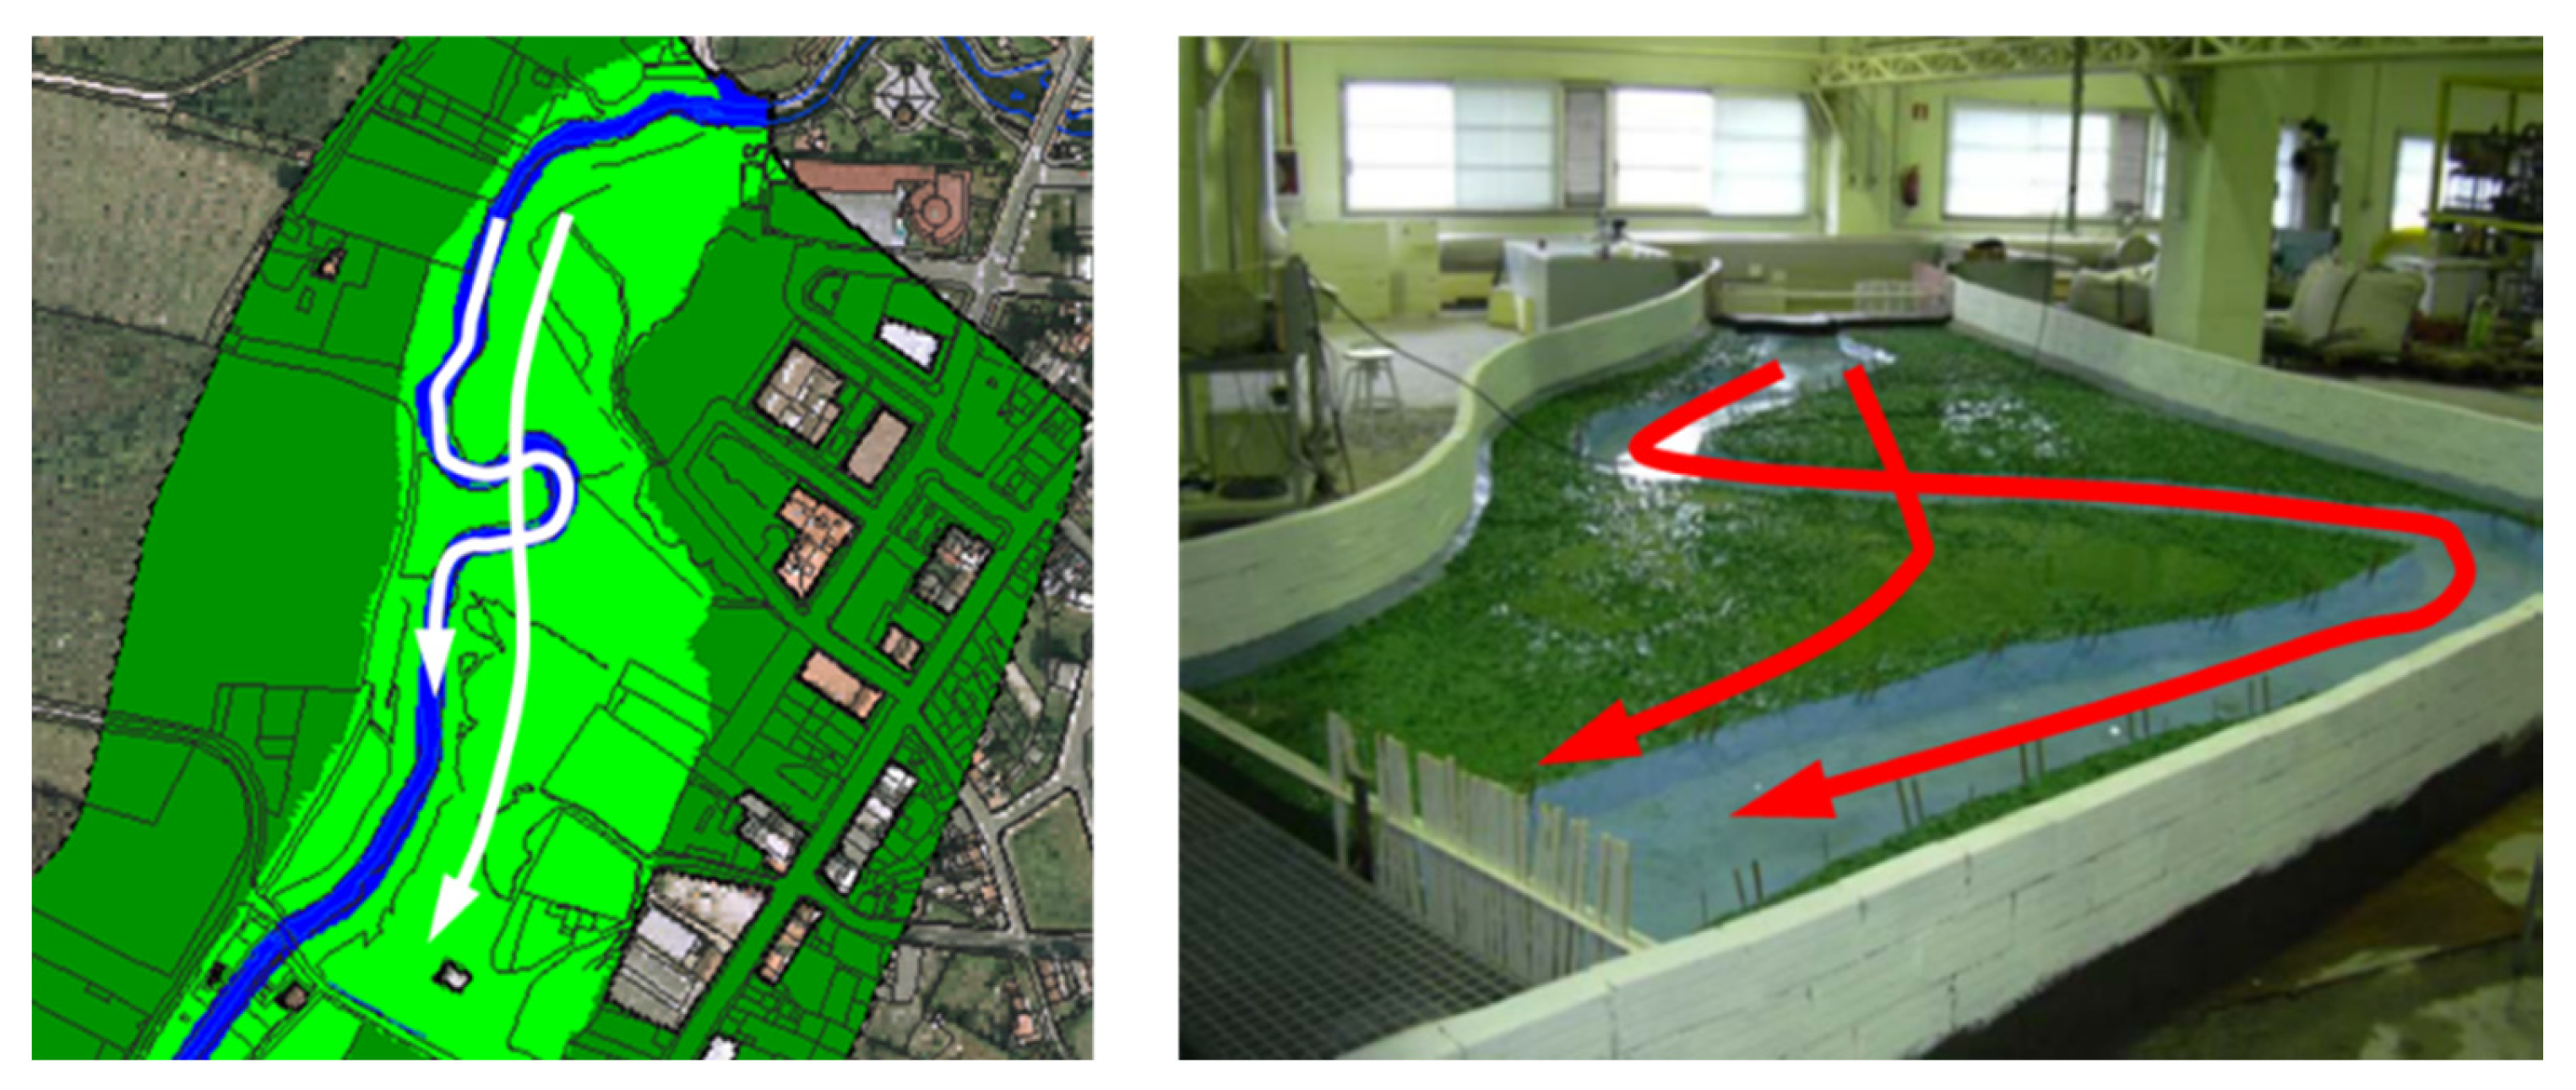
- Puertas, J.; Hernández-Ibáñez, L.; Cea, L.; Regueiro-Picallo, M.; Barneche-Naya, V.; Varela-García, F.A. An augmented reality facility to run hybrid physical-numerical flood models. Water 2020, 12, 3290. [Google Scholar] [CrossRef]
- Siegel, Z.S.; Kulp, S.A. Superimposing height-controllable and animated flood surfaces into street-level photographs for risk communication. Weather Clim. Extrem. 2021, 32, 100311. [Google Scholar] [CrossRef]
- Bonney, R.; Phillips, T.B.; Ballard, H.L.; Enck, J.W. Can citizen science enhance public understanding of science? Public Underst. Sci. 2016, 25, 2–16. [Google Scholar] [CrossRef] [PubMed]
- Buytaert, W.; Zulkafli, Z.; Grainger, S.; Acosta, L.; Alemie, T.C.; Bastiaensen, J.; De Bièvre, B.; Bhusal, J.; Clark, J.; Dewulf, A.; et al. Citizen science in hydrology and water resources: Opportunities for knowledge generation, ecosystem service management, and sustainable development. Front. Earth Sci. 2014, 2, 26. [Google Scholar] [CrossRef] [Green Version]
- Assumpção, T.H.; Popescu, I.; Jonoski, A.; Solomatine, D.P. Citizen observations contributing to flood modelling: Opportunities and challenges. Hydrol. Earth Syst. Sci. 2018, 22, 1473–1489. [Google Scholar] [CrossRef] [Green Version]
- Njue, N.; Stenfert Kroese, J.; Gräf, J.; Jacobs, S.R.; Weeser, B.; Breuer, L.; Rufino, M.C. Citizen science in hydrological monitoring and ecosystem services management: State of the art and future prospects. Sci. Total Environ. 2019, 693, 133531. [Google Scholar] [CrossRef] [PubMed]
- Horita, F.E.A.; de Albuquerque, J.P.; Degrossi, L.C.; Mendiondo, E.M.; Ueyama, J. Development of a spatial decision support system for flood risk management in Brazil that combines volunteered geographic information with wireless sensor networks. Comput. Geosci. 2015, 80, 84–94. [Google Scholar] [CrossRef]
- Rollason, E.; Bracken, L.J.; Hardy, R.J.; Large, A.R.G. The importance of volunteered geographic information for the validation of flood inundation models. J. Hydrol. 2018, 562, 267–280. [Google Scholar] [CrossRef]
- Wang, R.Q.; Mao, H.; Wang, Y.; Rae, C.; Shaw, W. Hyper-resolution monitoring of urban flooding with social media and crowdsourcing data. Comput. Geosci. 2018, 111, 139–147. [Google Scholar] [CrossRef] [Green Version]
- Paul, J.D.; Buytaert, W.; Allen, S.; Ballesteros-Cánovas, J.A.; Bhusal, J.; Cieslik, K.; Clark, J.; Dugar, S.; Hannah, D.M.; Stoffel, M.; et al. Citizen science for hydrological risk reduction and resilience building. WIREs Water 2018, 5, e1262. [Google Scholar] [CrossRef] [Green Version]
- Gebremedhin, E.T.; Basco-Carrera, L.; Jonoski, A.; Iliffe, M.; Winsemius, H. Crowdsourcing and interactive modelling for urban flood management. J. Flood Risk Manag. 2020, 13, e12602. [Google Scholar] [CrossRef] [Green Version]
- Tian, X.; ten Veldhuis, M.C.; Schleiss, M.; Bouwens, C.; van de Giesen, N. Critical rainfall thresholds for urban pluvial flooding inferred from citizen observations. Sci. Total Environ. 2019, 689, 258–268. [Google Scholar] [CrossRef] [PubMed]
- Ferri, M.; Wehn, U.; See, L.; Monego, M.; Fritz, S. The value of citizen science for flood risk reduction: Cost-benefit analysis of a citizen observatory in the Brenta-Bacchiglione catchment. Hydrol. Earth Syst. Sci. 2020, 24, 5781–5798. [Google Scholar] [CrossRef]
- Kullenberg, C.; Kasperowski, D. What is citizen science?—A scientometric meta-analysis. PLoS ONE 2016, 11, e0147152. [Google Scholar] [CrossRef] [PubMed] [Green Version]
- Verbrugge, L.N.H.; Ganzevoort, W.; Fliervoet, J.M.; Panten, K.; van den Born, R.J.G. Implementing participatory monitoring in river management: The role of stakeholders’ perspectives and incentives. J. Environ. Manag. 2017, 195, 62–69. [Google Scholar] [CrossRef] [PubMed]
- Haklay, M. Citizen science and volunteered geographic information: Overview and typology of participation. In Crowdsourcing Geographic Knowledge: Volunteered Geographic Information (VGI) in Theory and Practice; Sui, D., Elwood, S., Goodchild, M., Eds.; Springer: Dordrecht, The Netherlands, 2013; pp. 105–122. ISBN 978-94-007-4586-5. [Google Scholar]
- See, L.; Mooney, P.; Foody, G.; Bastin, L.; Comber, A.; Estima, J.; Fritz, S.; Kerle, N.; Jiang, B.; Laakso, M.; et al. Crowdsourcing, citizen science or volunteered geographic information? The current state of crowdsourced geographic information. ISPRS Int. J. Geo-Inf. 2016, 5, 55. [Google Scholar] [CrossRef]
- Sy, B.; Frischknecht, C.; Dao, H.; Consuegra, D.; Giuliani, G. Flood hazard assessment and the role of citizen science. J. Flood Risk Manag. 2019, 12, e12519. [Google Scholar] [CrossRef]
- Arthur, R.; Boulton, C.A.; Shotton, H.; Williams, H.T.P. Social sensing of floods in the UK. PLoS ONE 2018, 13, e0189327. [Google Scholar] [CrossRef]
- FFeng, Y.; Sester, M. Extraction of Pluvial Flood Relevant Volunteered Geographic Information (VGI) by Deep Learning from User Generated Texts and Photos. ISPRS Int. J. Geo-Inf. 2018, 7, 39. [Google Scholar] [CrossRef] [Green Version]
- Lin, W.Y.; Wu, T.H.; Tsai, M.H.; Hsu, W.C.; Chou, Y.T.; Kang, S.C. Filtering disaster responses using crowdsourcing. Autom. Constr. 2018, 91, 182–192. [Google Scholar] [CrossRef]
- Le Coz, J.; Patalano, A.; Collins, D.; Guillén, N.F.; García, C.M.; Smart, G.M.; Bind, J.; Chiaverini, A.; Le Boursicaud, R.; Dramais, G.; et al. Crowdsourced data for flood hydrology: Feedback from recent citizen science projects in Argentina, France and New Zealand. J. Hydrol. 2016, 541, 766–777. [Google Scholar] [CrossRef] [Green Version]
- Schnebele, E.; Cervone, G.; Waters, N. Road assessment after flood events using non-authoritative data. Nat. Hazards Earth Syst. Sci. 2014, 14, 1007–1015. [Google Scholar] [CrossRef] [Green Version]
- Macchione, F.; Costabile, P.; Costanzo, C.; De Lorenzo, G. Extracting quantitative data from non-conventional information for the hydraulic reconstruction of past urban flood events. A case study. J. Hydrol. 2019, 576, 443–465. [Google Scholar] [CrossRef]
- Blumberg, A.F.; Georgas, N.; Yin, L.; Herrington, T.O.; Orton, P.M. Street-scale modeling of storm surge inundation along the New Jersey Hudson river waterfront. J. Atmos. Ocean. Technol. 2015, 32, 1486–1497. [Google Scholar] [CrossRef] [Green Version]
- Yu, D.; Yin, J.; Liu, M. Validating city-scale surface water flood modelling using crowd-sourced data. Environ. Res. Lett. 2016, 11, 124011. [Google Scholar] [CrossRef]
- Smith, B.; Rodriguez, S. Spatial analysis of high-resolution radar rainfall and citizen-reported flash flood data in ultra-urban New York City. Water 2017, 9, 736. [Google Scholar] [CrossRef] [Green Version]
- Starkey, E.; Parkin, G.; Birkinshaw, S.; Large, A.; Quinn, P.; Gibson, C. Demonstrating the value of community-based (‘citizen science’) observations for catchment modelling and characterisation. J. Hydrol. 2017, 548, 801–817. [Google Scholar] [CrossRef]
- Lowry, C.S.; Fienen, M.N. CrowdHydrology: Crowdsourcing hydrologic data and engaging citizen scientists. Ground Water 2013, 51, 151–156. [Google Scholar] [CrossRef]
- Walker, D.; Forsythe, N.; Parkin, G.; Gowing, J. Filling the observational void: Scientific value and quantitative validation of hydrometeorological data from a community-based monitoring programme. J. Hydrol. 2016, 538, 713–725. [Google Scholar] [CrossRef] [Green Version]
- Smith, L.; Liang, Q.; James, P.; Lin, W. Assessing the utility of social media as a data source for flood risk management using a real-time modelling framework. J. Flood Risk Manag. 2017, 10, 370–380. [Google Scholar] [CrossRef]
- Cervone, G.; Sava, E.; Huang, Q.; Schnebele, E.; Harrison, J.; Waters, N. Using Twitter for tasking remote-sensing data collection and damage assessment: 2013 Boulder flood case study. Int. J. Remote Sens. 2016, 37, 100–124. [Google Scholar] [CrossRef]
- Li, Z.; Wang, C.; Emrich, C.T.; Guo, D. A novel approach to leveraging social media for rapid flood mapping: A case study of the 2015 South Carolina floods. Cartogr. Geogr. Inf. Sci. 2018, 45, 97–110. [Google Scholar] [CrossRef]
- Rosser, J.F.; Leibovici, D.G.; Jackson, M.J. Rapid flood inundation mapping using social media, remote sensing and topographic data. Nat. Hazards 2017, 87, 103–120. [Google Scholar] [CrossRef] [Green Version]
- See, L. A review of citizen science and crowdsourcing in applications of pluvial flooding. Front. Earth Sci. 2019, 7, 44. [Google Scholar] [CrossRef] [Green Version]
- Nardi, F.; Cudennec, C.; Abrate, T.; Allouch, C.; Annis, A.; Assumpção, T.; Aubert, A.H.; Bérod, D.; Braccini, A.M.; Buytaert, W.; et al. Citizens AND HYdrology (CANDHY): Conceptualizing a transdisciplinary framework for citizen science addressing hydrological challenges. Hydrol. Sci. J. 2021, 1–18. [Google Scholar] [CrossRef]
- Begg, C. Power, responsibility and justice: A review of local stakeholder participation in European flood risk management. Local Environ. 2018, 23, 383–397. [Google Scholar] [CrossRef]


Publisher’s Note: MDPI stays neutral with regard to jurisdictional claims in published maps and institutional affiliations. |
© 2022 by the authors. Licensee MDPI, Basel, Switzerland. This article is an open access article distributed under the terms and conditions of the Creative Commons Attribution (CC BY) license (https://creativecommons.org/licenses/by/4.0/).
Share and Cite
Cea, L.; Costabile, P. Flood Risk in Urban Areas: Modelling, Management and Adaptation to Climate Change. A Review. Hydrology 2022, 9, 50. https://doi.org/10.3390/hydrology9030050
Cea L, Costabile P. Flood Risk in Urban Areas: Modelling, Management and Adaptation to Climate Change. A Review. Hydrology. 2022; 9(3):50. https://doi.org/10.3390/hydrology9030050
Chicago/Turabian StyleCea, Luís, and Pierfranco Costabile. 2022. "Flood Risk in Urban Areas: Modelling, Management and Adaptation to Climate Change. A Review" Hydrology 9, no. 3: 50. https://doi.org/10.3390/hydrology9030050