
Linking DPSIR Model and Water Quality Indices to Achieve Sustainable Development Goals in Groundwater Resources


Abstract
:1. Introduction
2. Methods
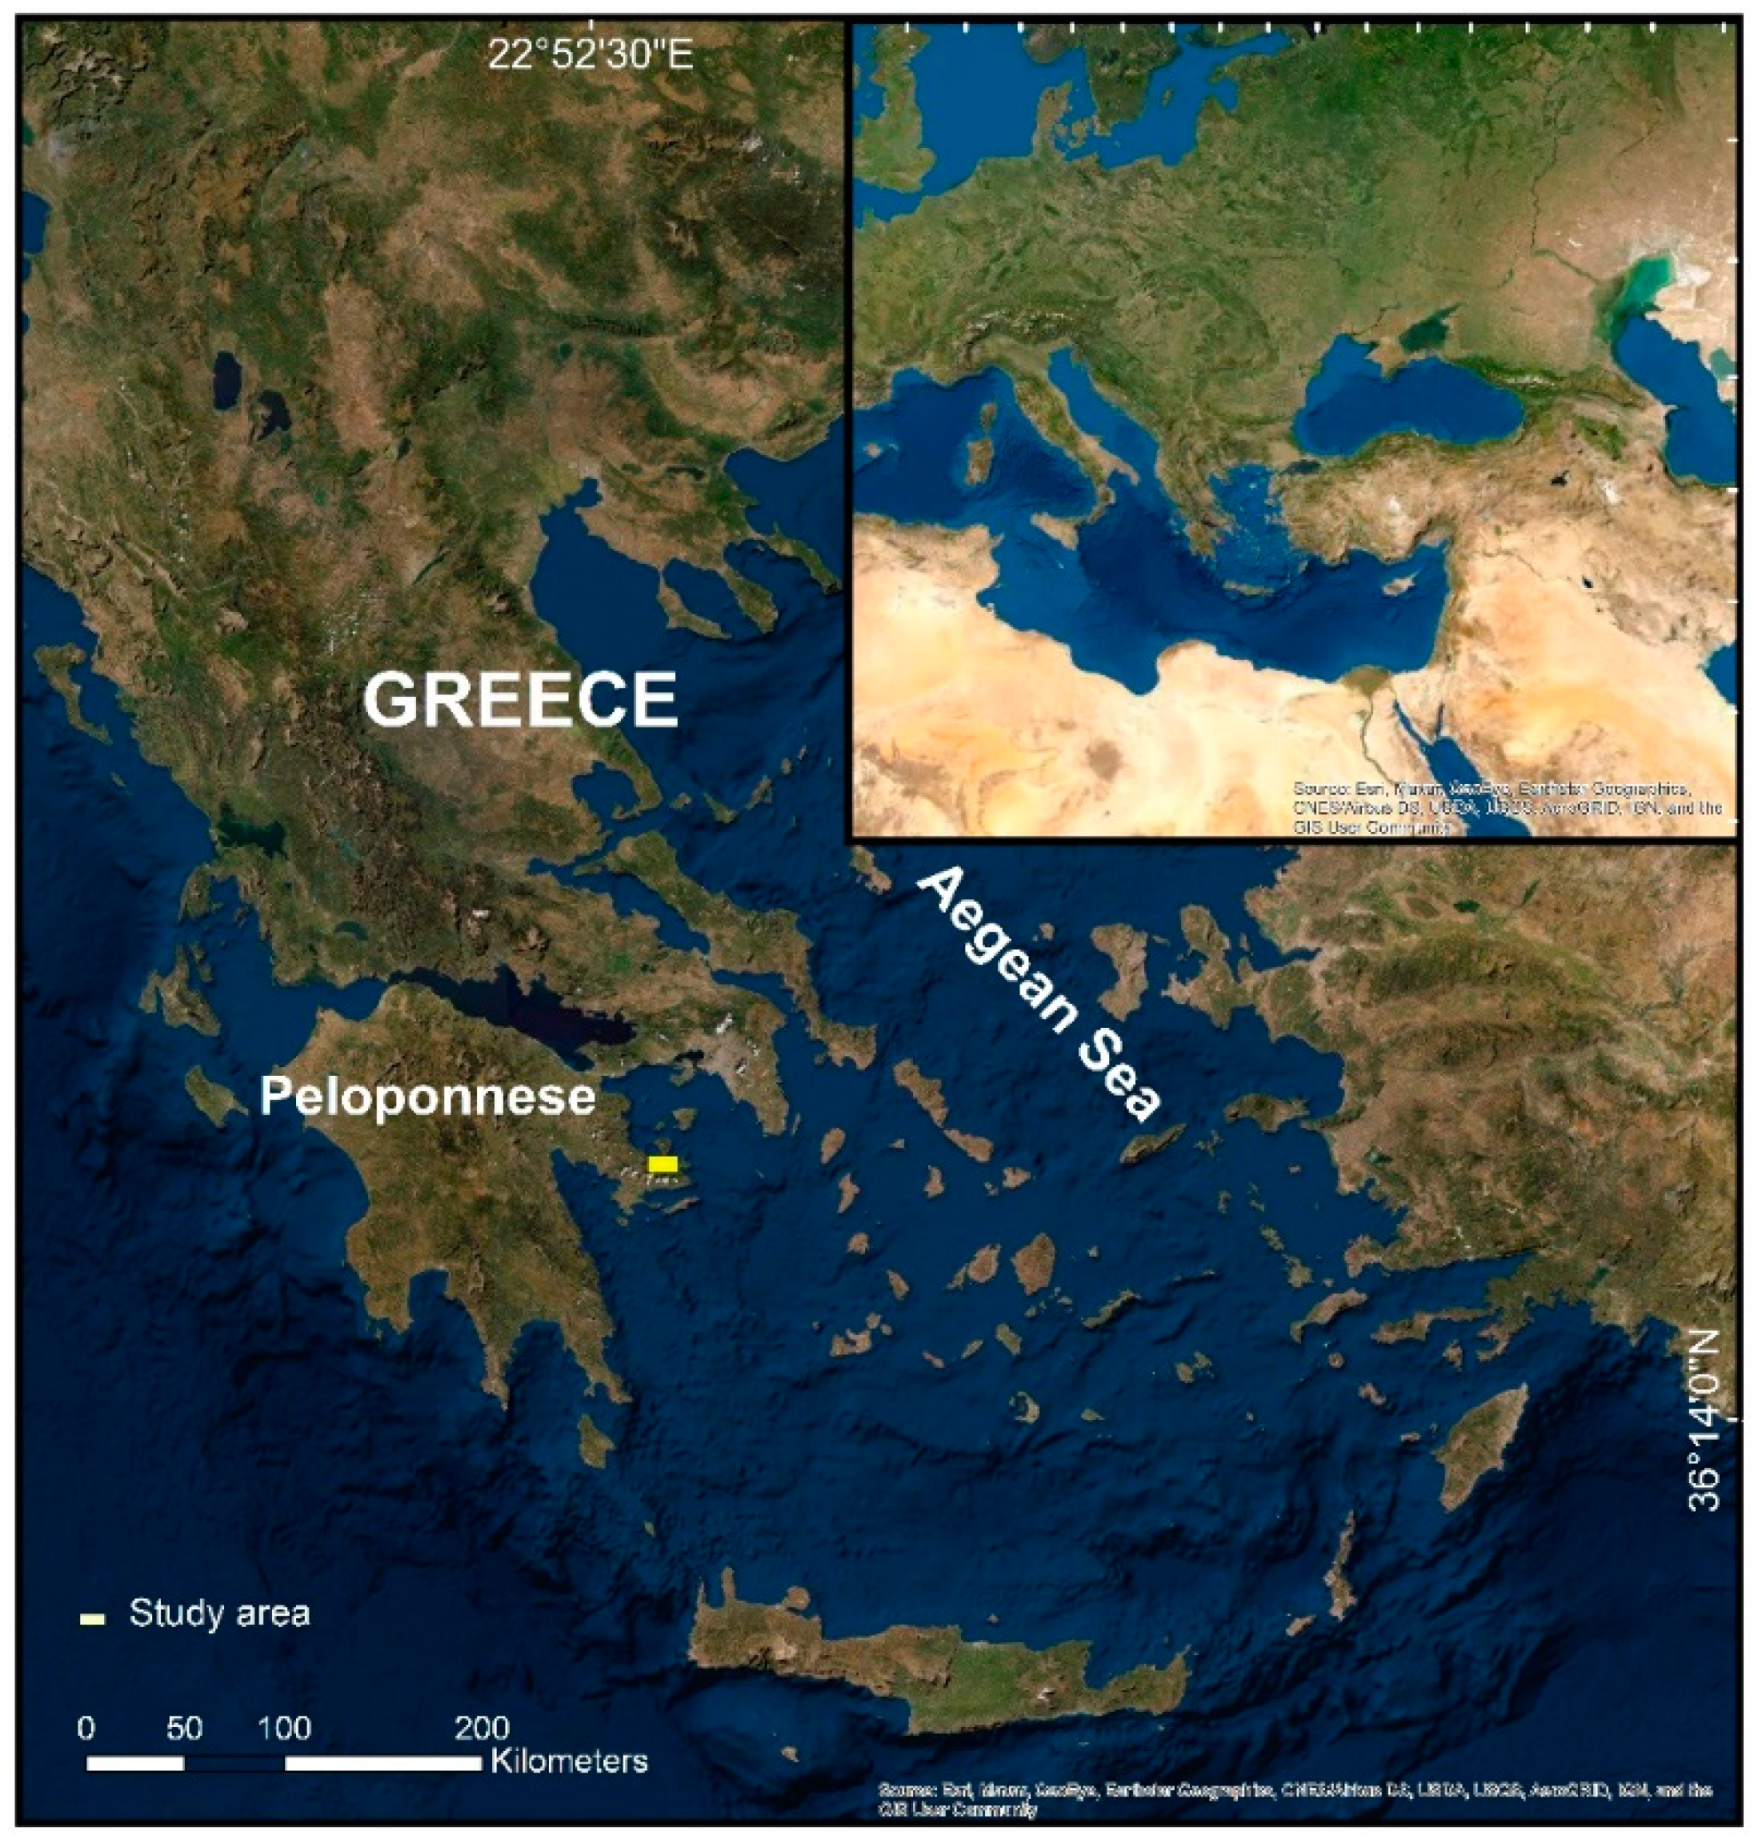
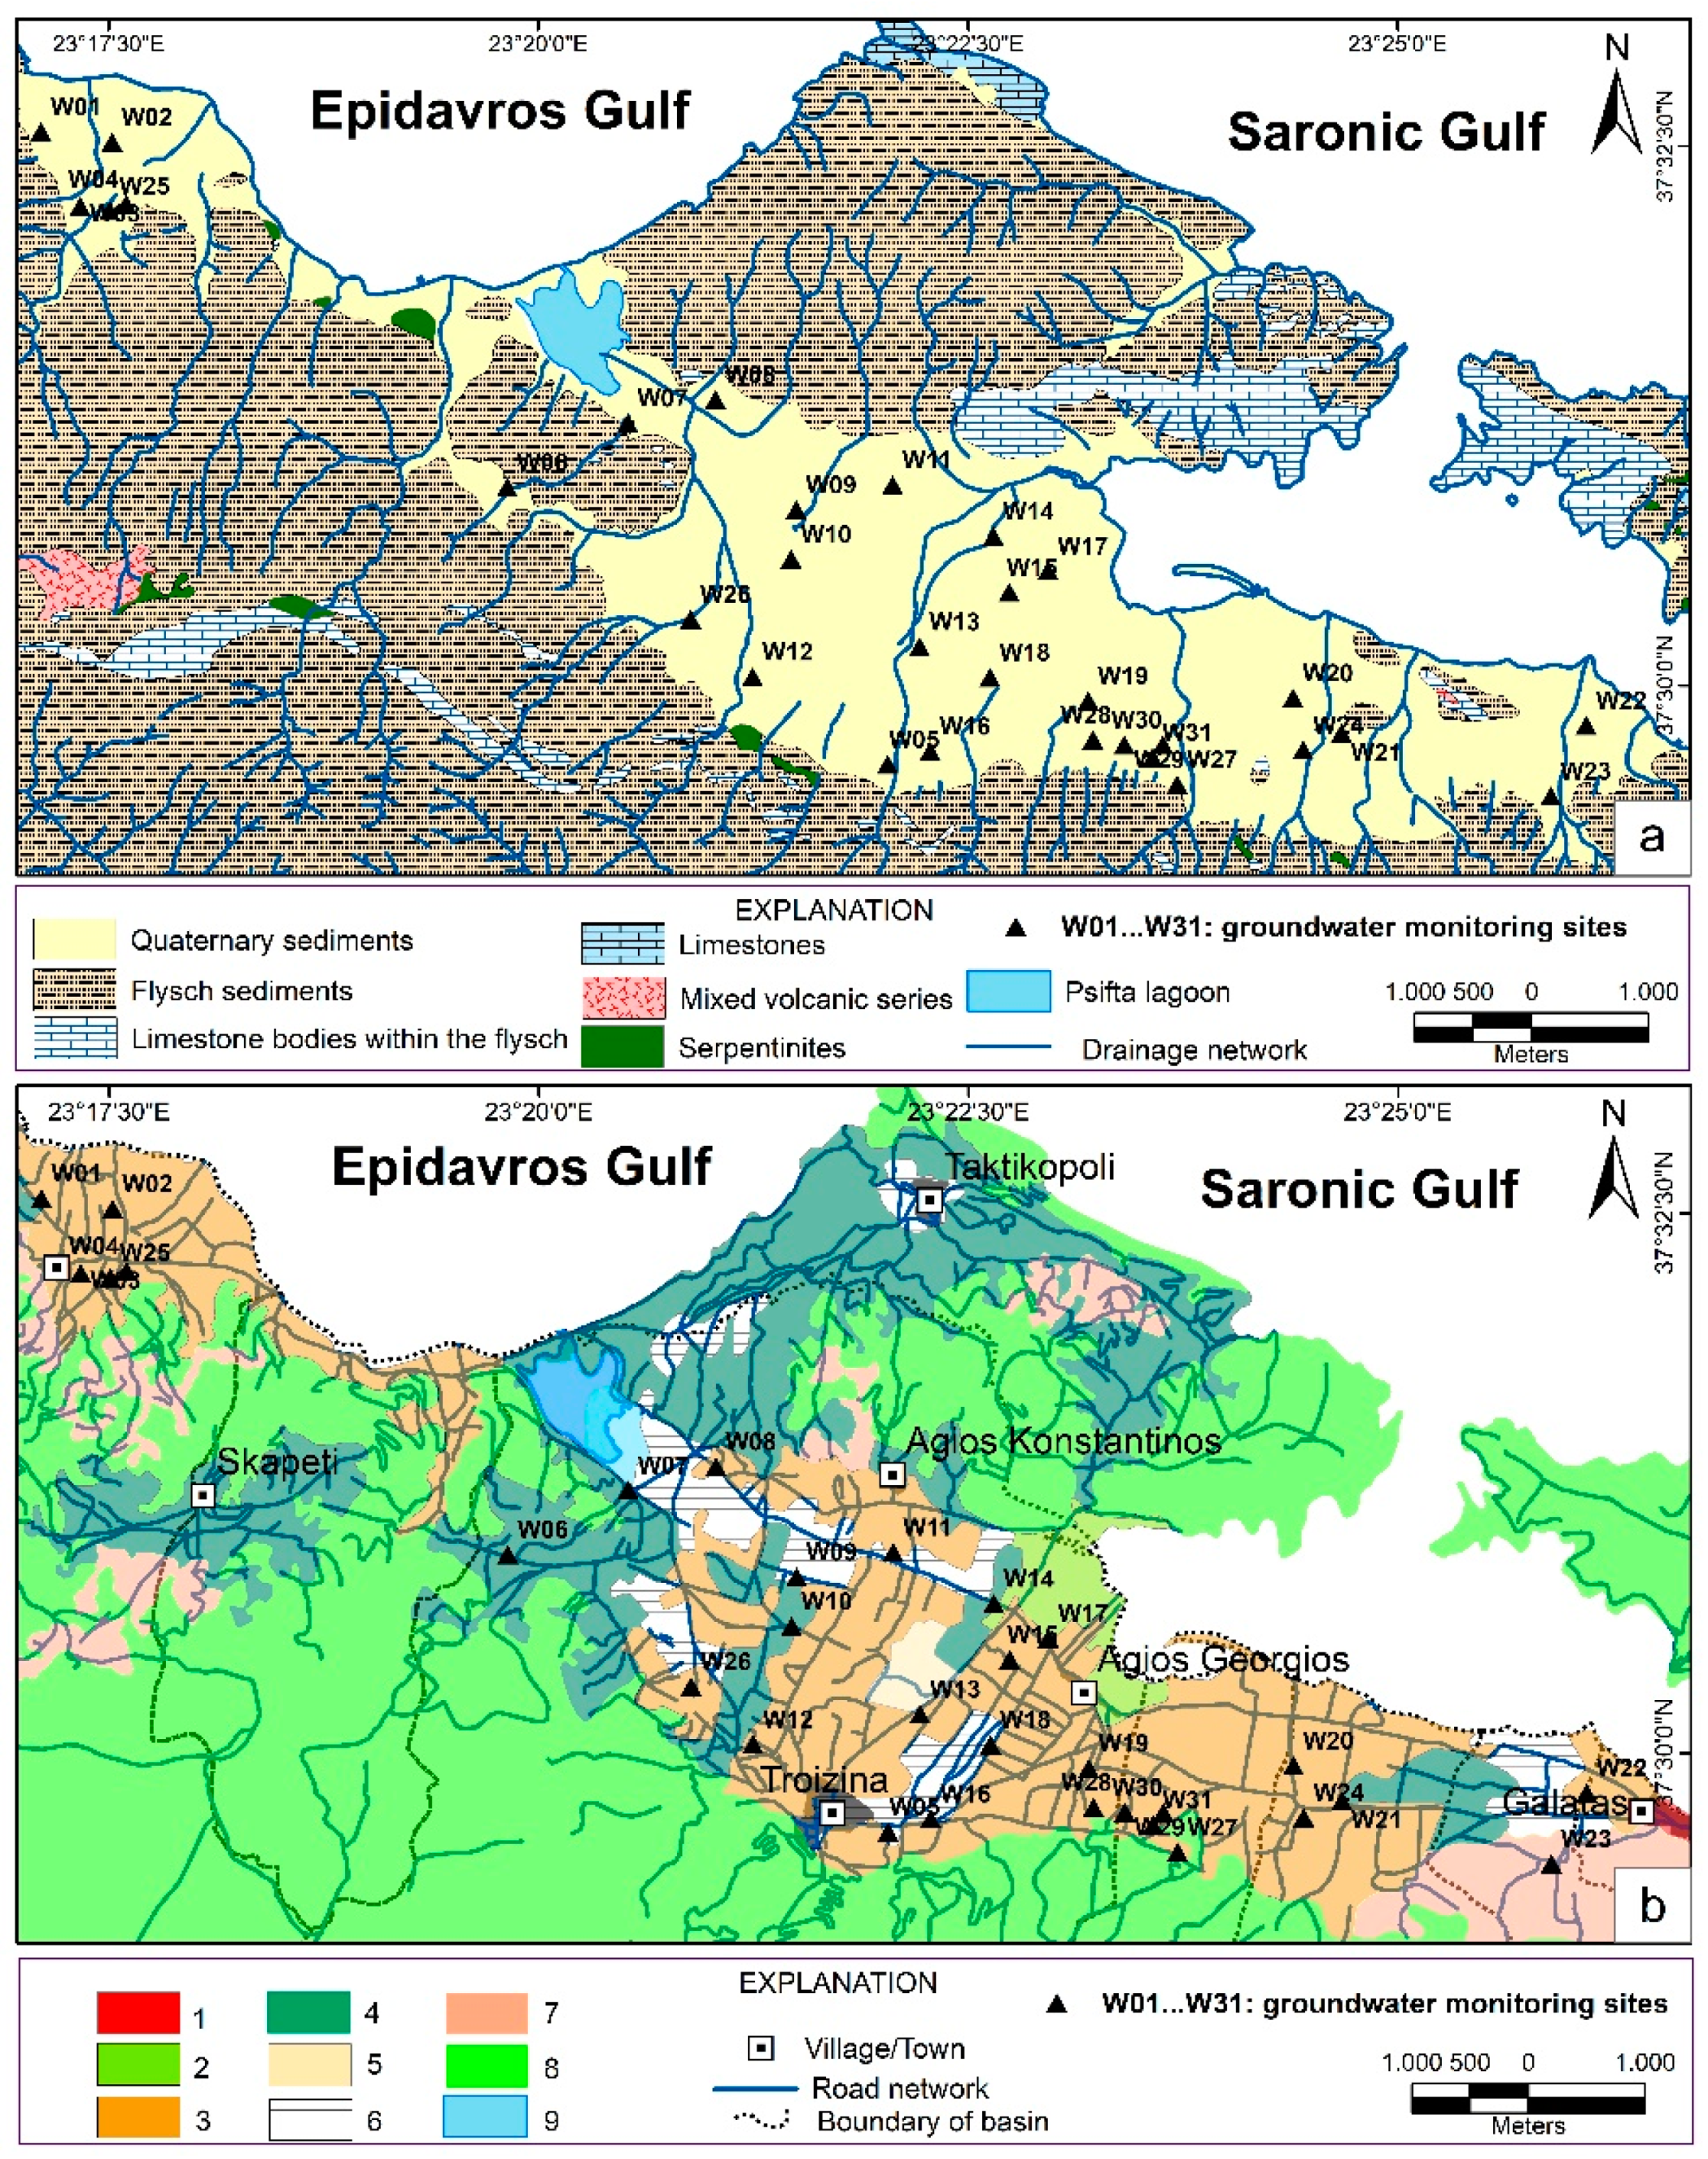
2.1. Study Area
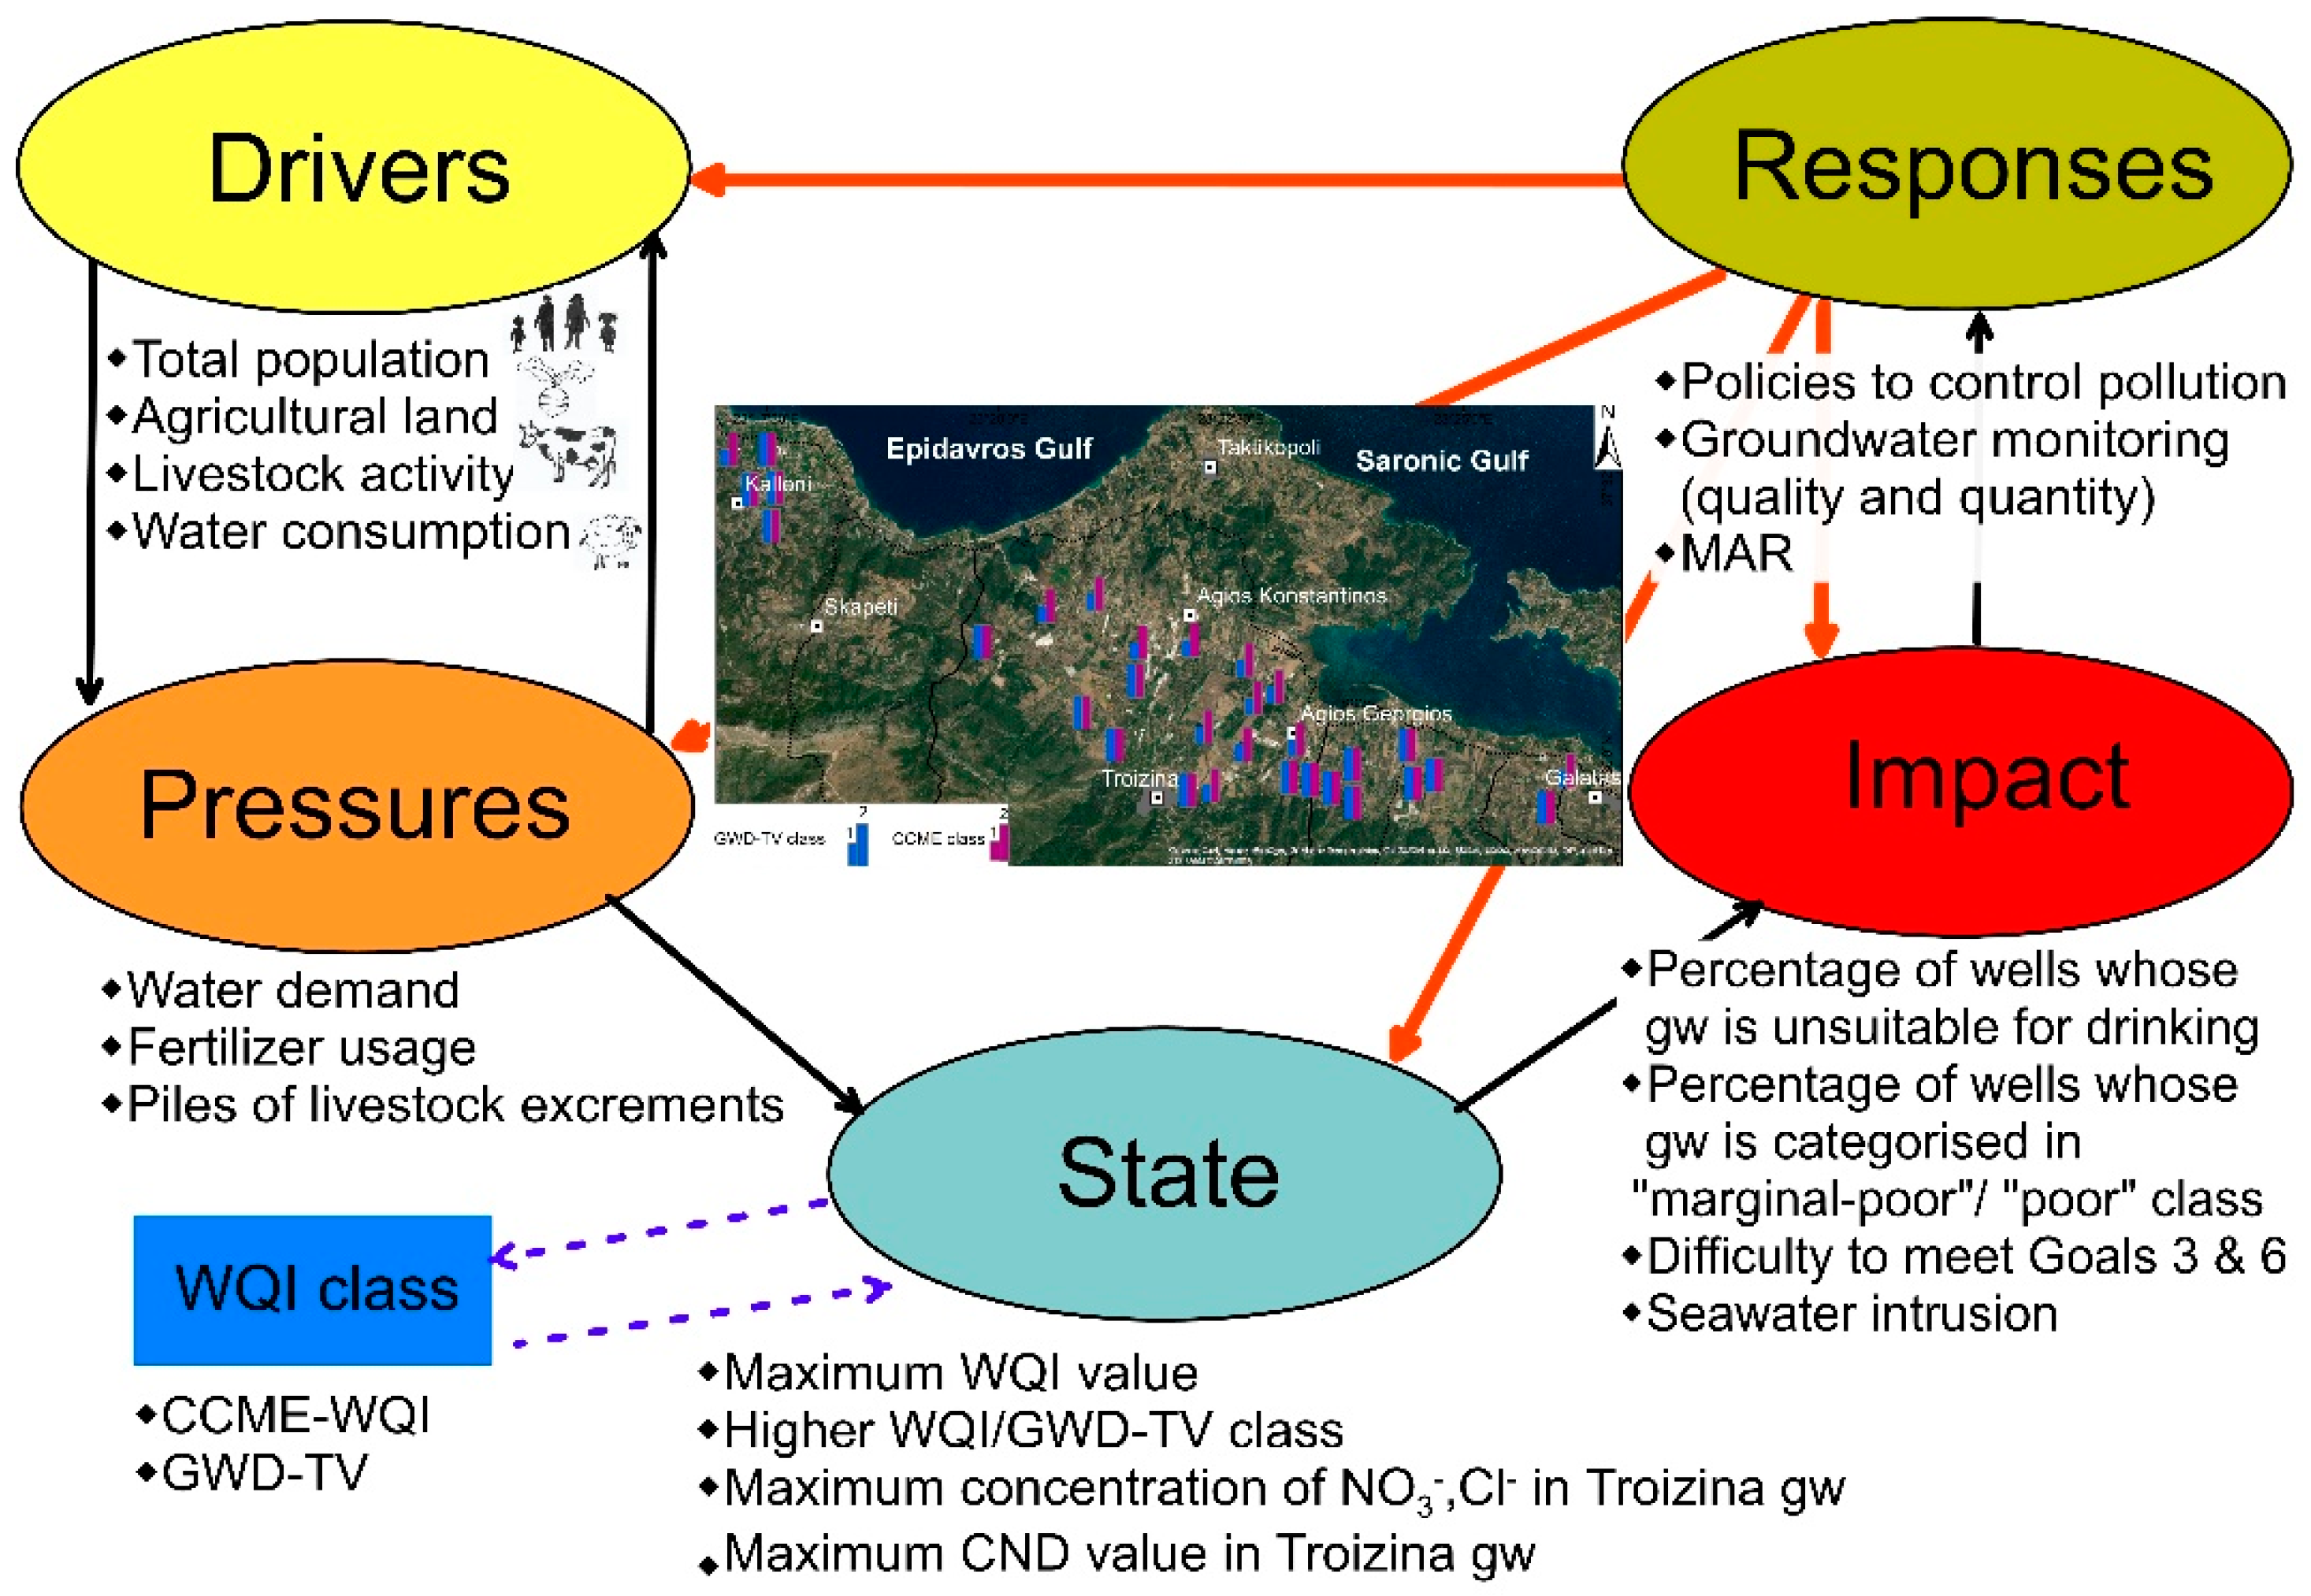
2.2. DPSIR Model
2.2.1. Drivers
2.2.2. Pressures
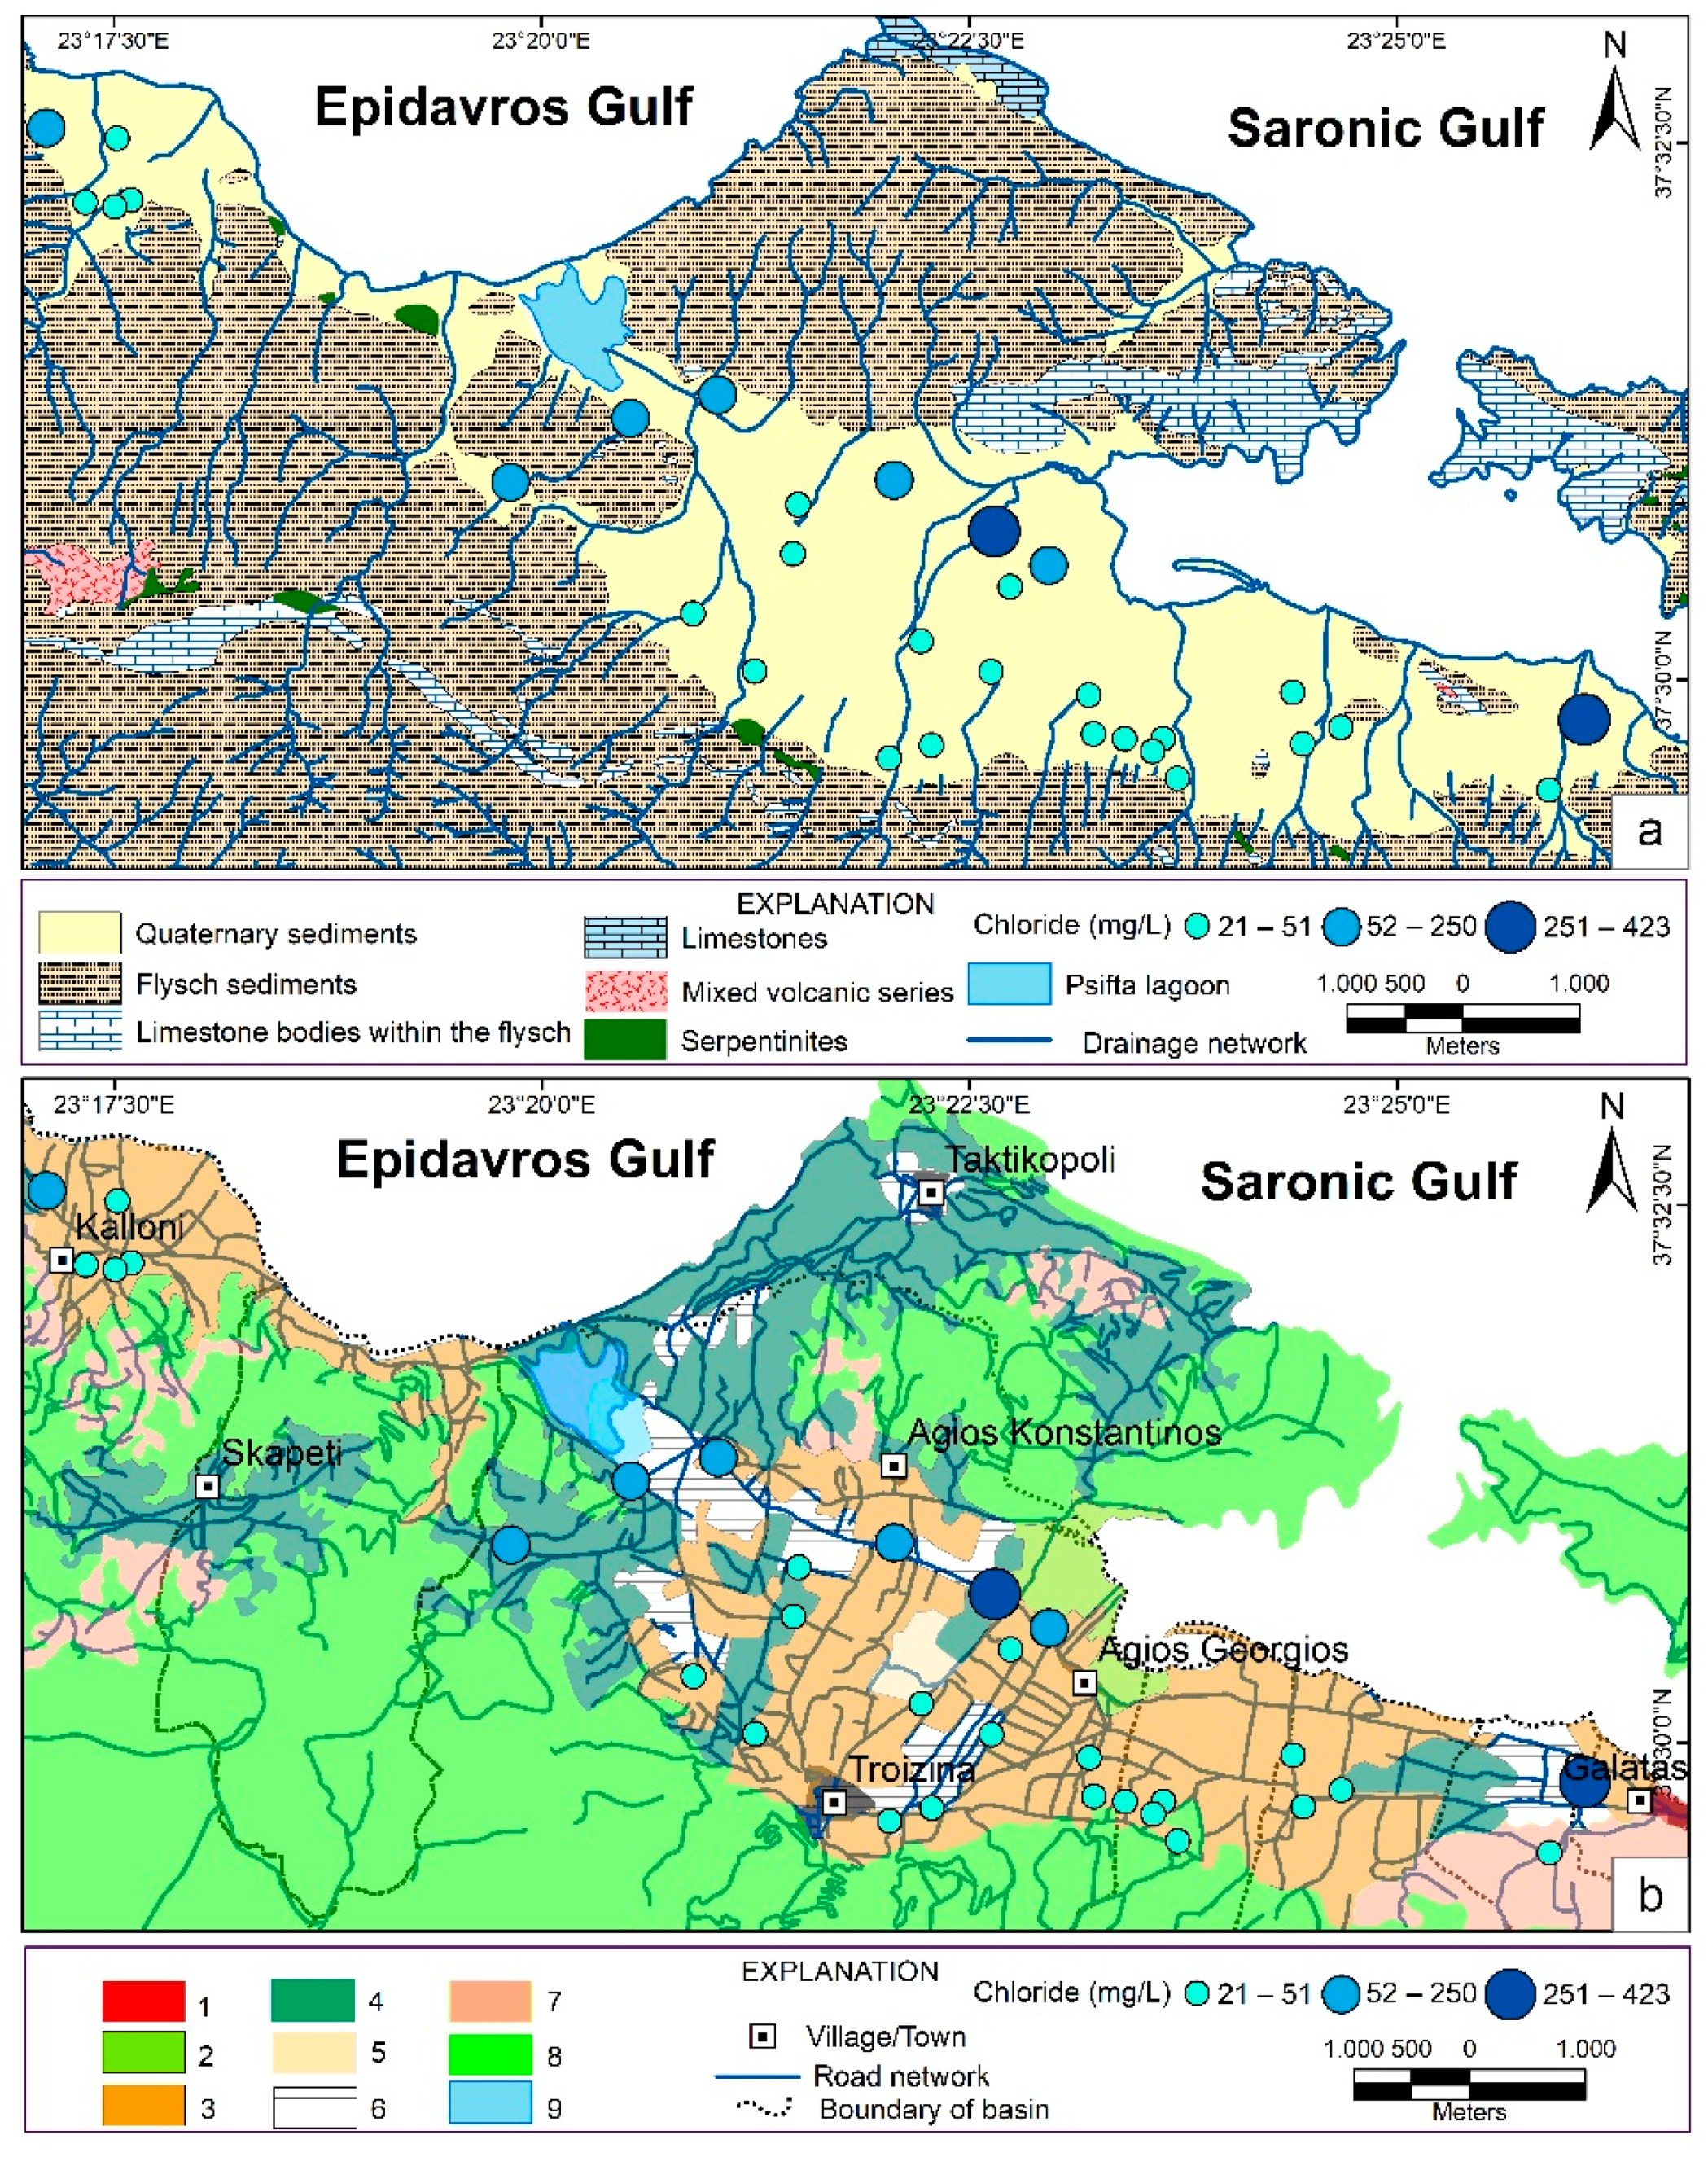
2.2.3. State
2.2.4. Impact
2.2.5. Responses
2.3. Data Treatment
2.4. Linkage between DPSIR Model, WQI Values and Spatial Analysis
3. Results and Discussion
3.1. Drivers
3.2. Pressures
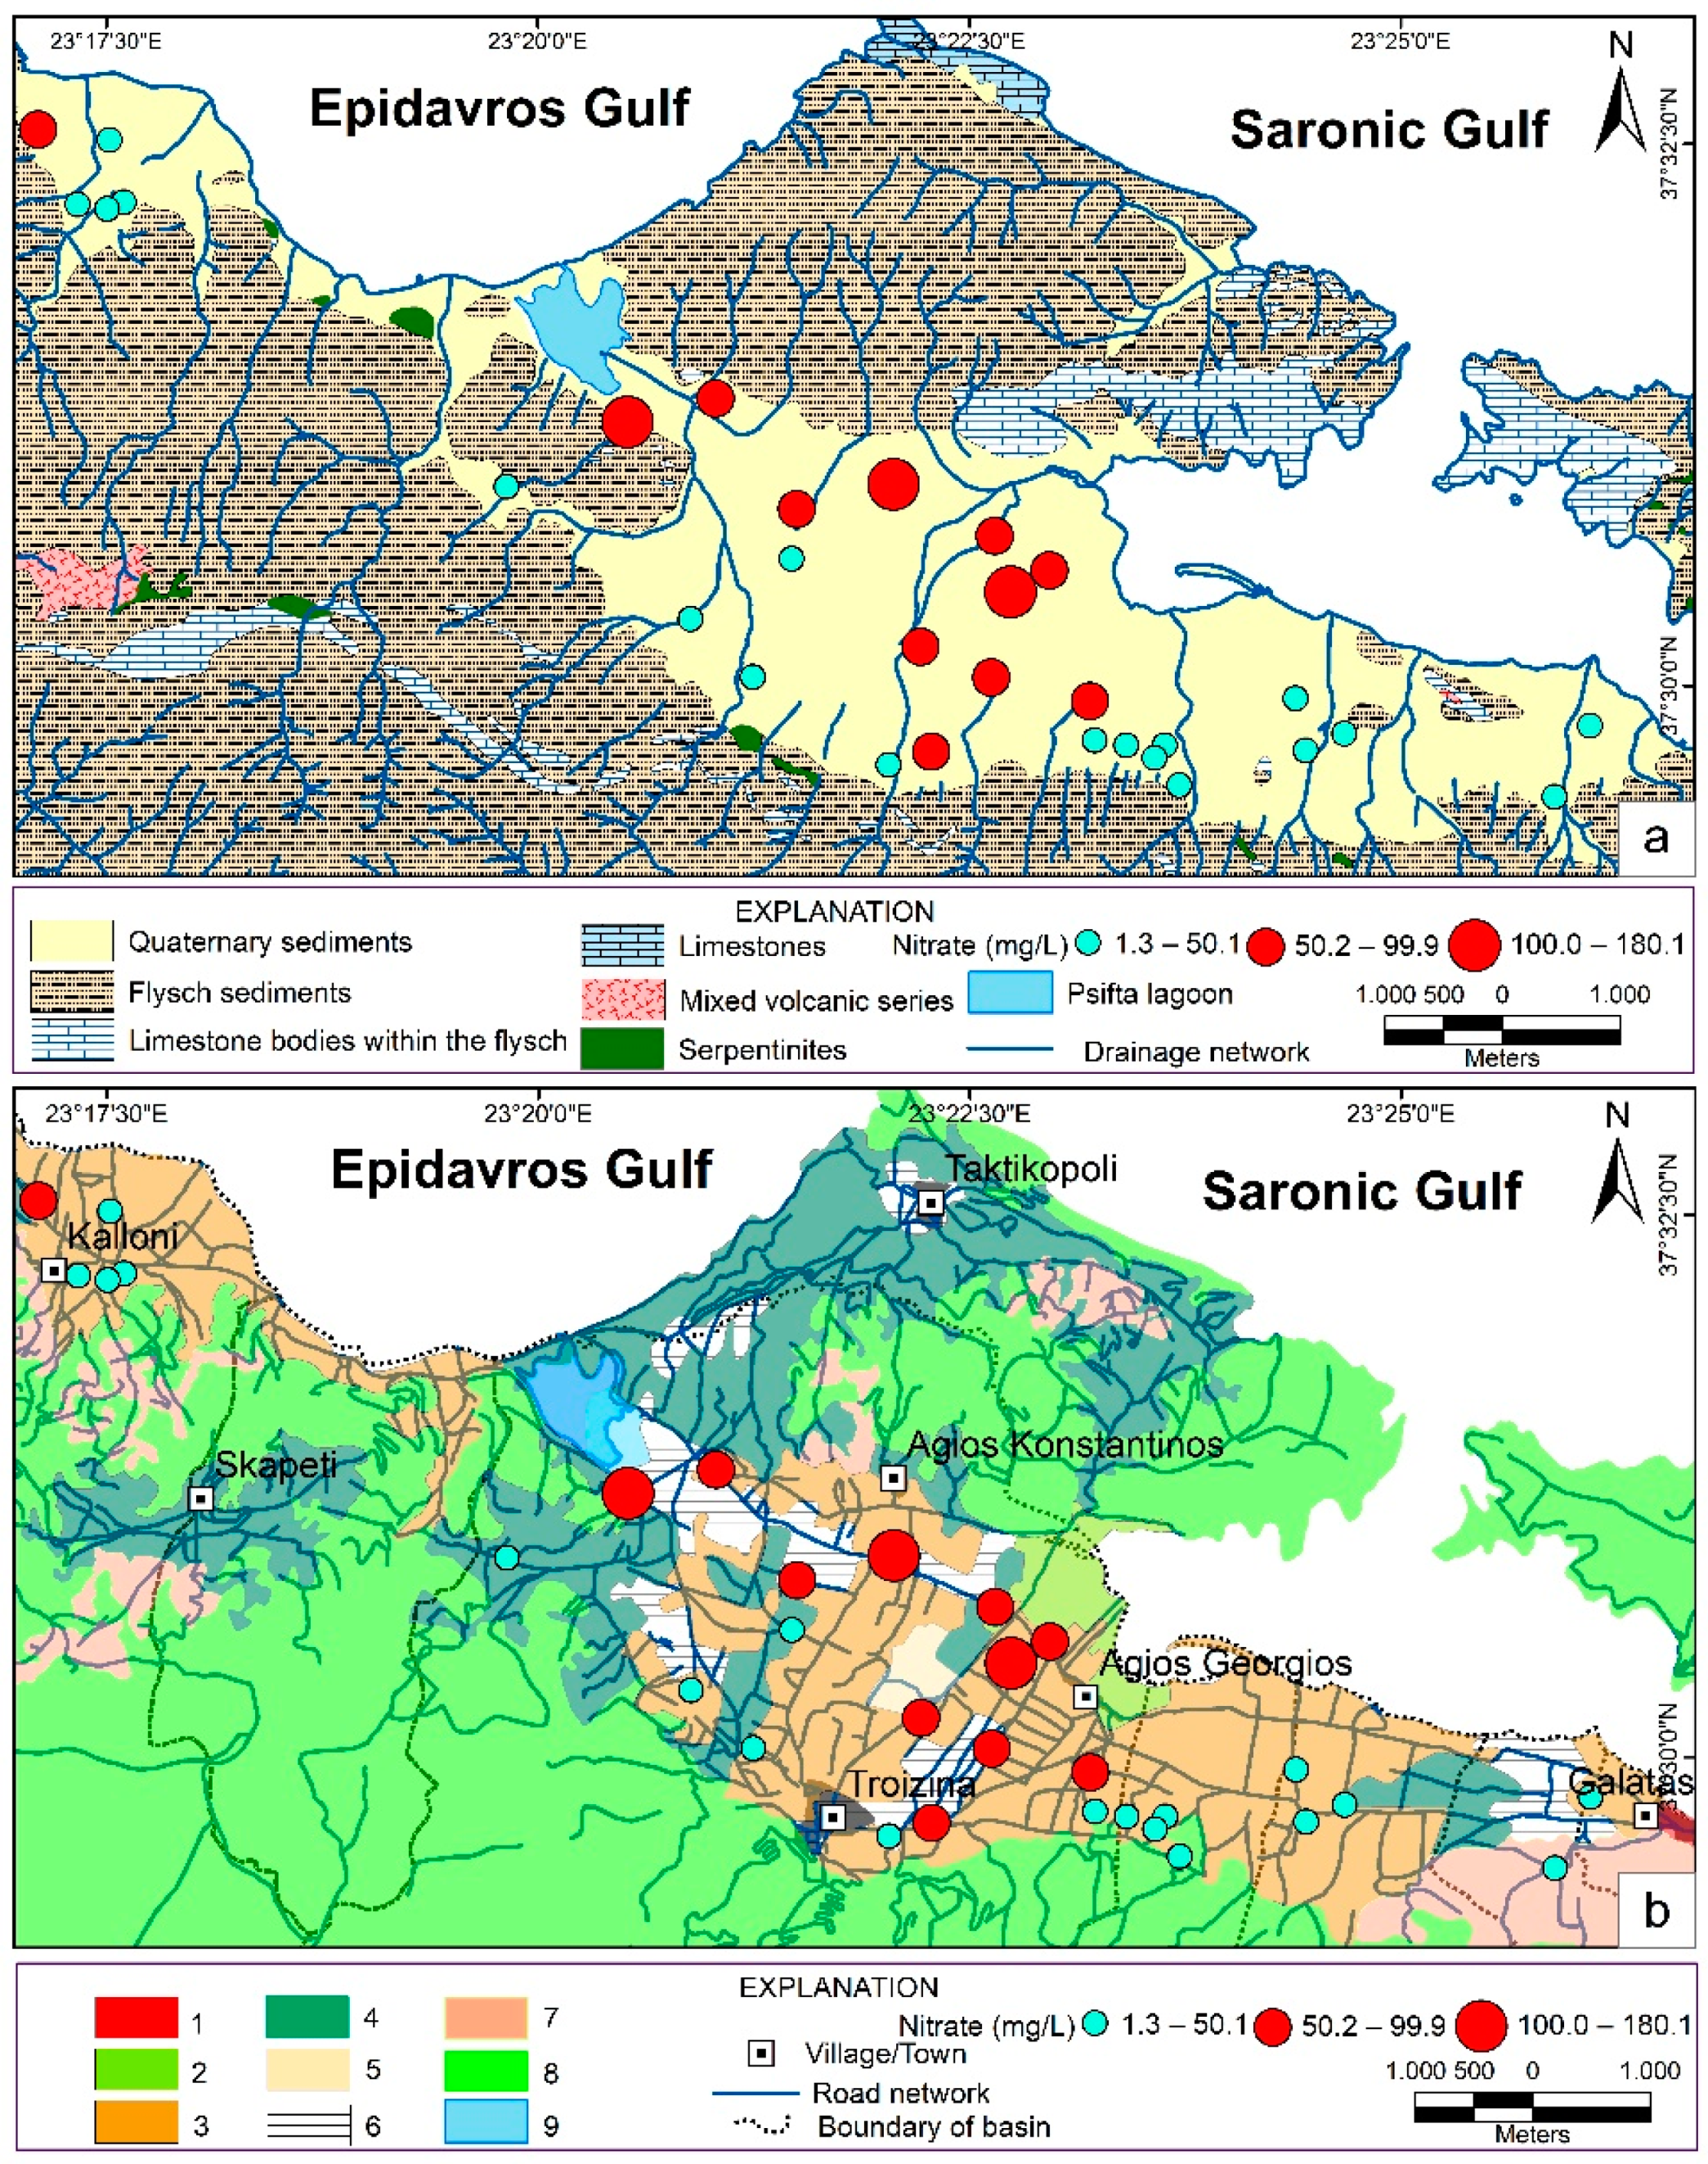
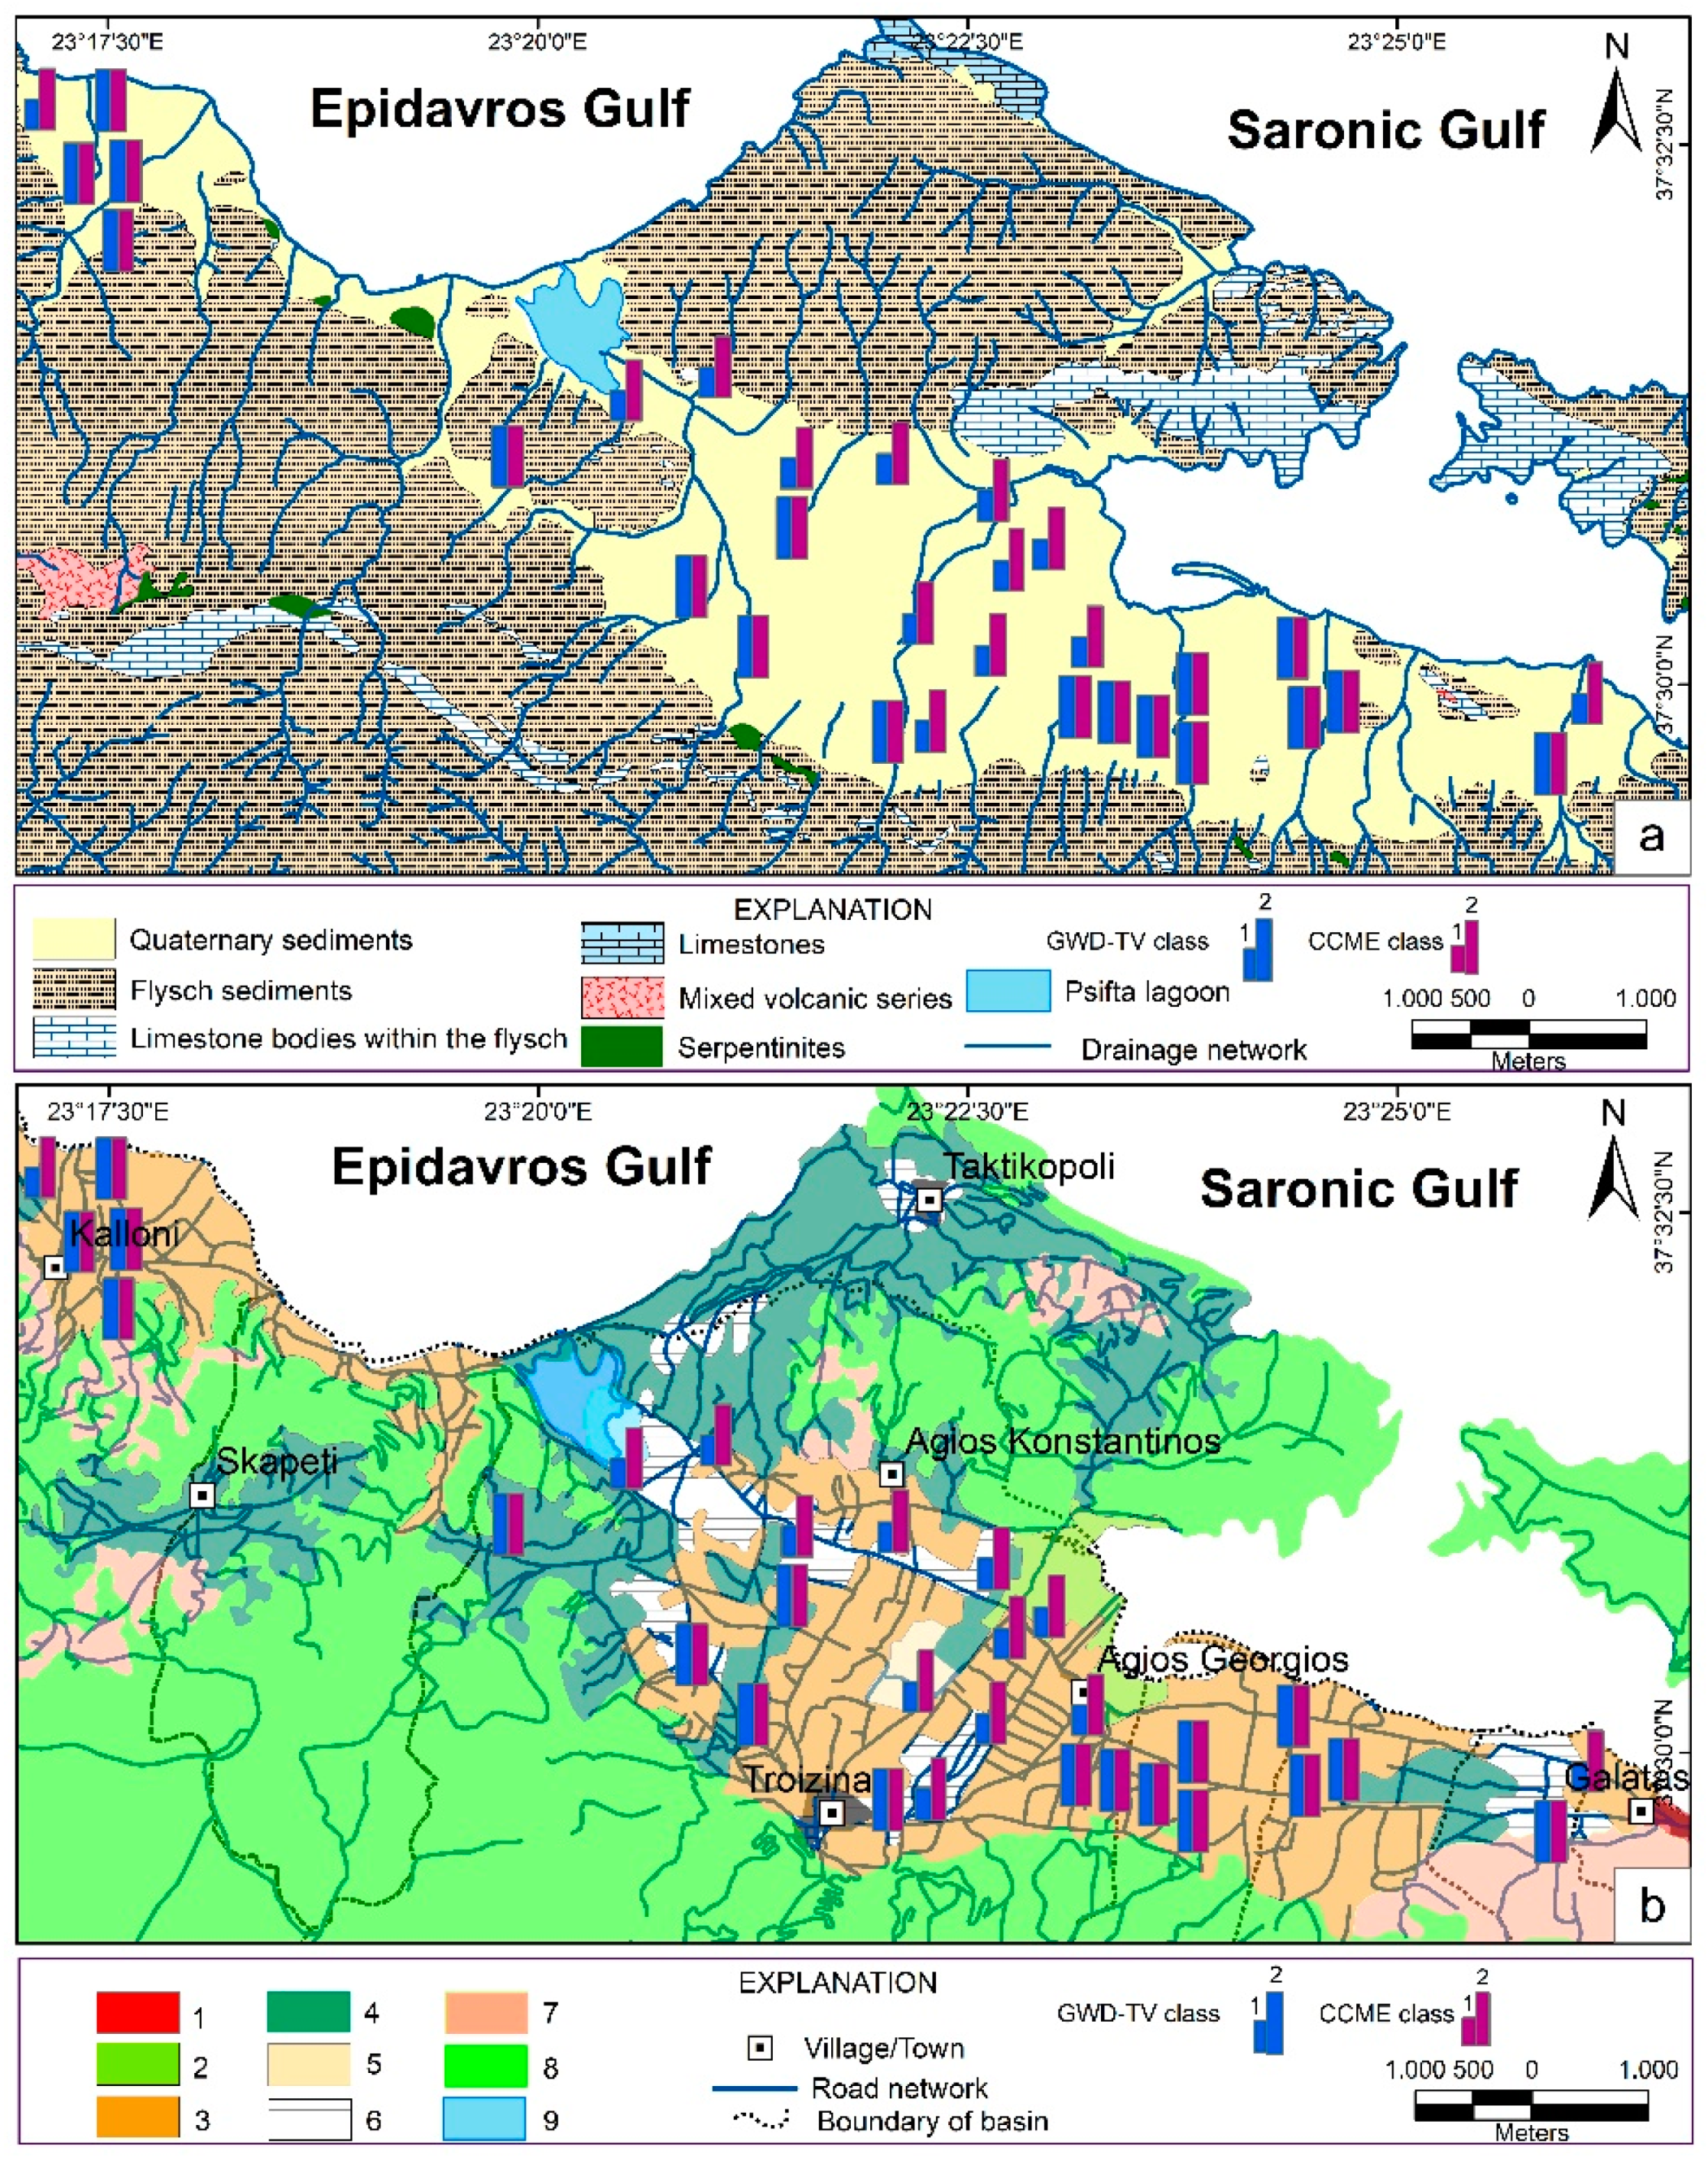
3.3. State
3.4. Impact
3.5. Proposed Responses
4. Conclusions
Funding
Institutional Review Board Statement
Informed Consent Statement
Data Availability Statement
Acknowledgments
Conflicts of Interest
References
- UN (United Nations). Available online: https://www.un.org/sustainabledevelopment/sustainabledevelopment-goals/ (accessed on 17 April 2021).
- Kelble, C.R.; Loomis, D.K.; Lovelace, S.; Nuttle, W.K.; Ortner, P.B.; Fletcher, P.; Cook, G.S.; Lorenz, J.J.; Boyer, J.N. The EBM-DPSER conceptual model: Integrating ecosystem services into the DPSIR framework. PLoS ONE 2013, 8, e70766. [Google Scholar] [CrossRef] [PubMed] [Green Version]
- Khan, S.U.; Cui, Y.; Khan, A.A.; Sufyan Ali, M.A.; Khan, A.; Xia, X.; Liu, G.; Zhao, M. Tracking sustainable development efficiency with human-environmental system relationship: An application of DPSIR and super efficiency SBM model. Sci. Total Environ. 2021, 783, 146959. [Google Scholar] [CrossRef]
- Pinto, R.; De Jonge, V.; Neto, J.; Domingos, T.; Marques, J.; Patrício, J. Towards a DPSIR driven integration of ecological value, water uses and ecosystem services for estuarine systems. Ocean Coast. Manag. 2013, 72, 64–79. [Google Scholar] [CrossRef]
- Song, X.; Frostell, B. The DPSIR framework and a pressure-oriented water quality monitoring approach to ecological river restoration. Water 2012, 4, 670–682. [Google Scholar] [CrossRef] [Green Version]
- Vannevel, R. Using DPSIR and balances to support water governance. Water 2018, 10, 118. [Google Scholar] [CrossRef] [Green Version]
- Ramos, T.B.; Darouich, H.; Gonçalves, M.C.; Brito, D.; Castelo Branco, M.A.; Martins, J.C.; Fernandes, M.L.; Pires, F.P.; Morais, M.; Neves, R. An integrated analysis of the eutrophication process in the Enxoé reservoir within the DPSIR framework. Water 2018, 10, 1576. [Google Scholar] [CrossRef] [Green Version]
- Cruz, S.; Cordovil, C.M.D.S.; Pinto, R.; Brito, A.G.; Cameira, M.R.; Gonçalves, G.; Poulsen, J.R.; Thodsen, H.; Kronvang, B.; May, L. Nitrogen in water-Portugal and Denmark: Two contrasting realities. Water 2019, 11, 1114. [Google Scholar] [CrossRef] [Green Version]
- Sanon, V.-P.; Toé, P.; Caballer Revenga, J.; El Bilali, H.; Hundscheid, L.J.; Kulakowska, M.; Magnuszewski, P.; Meulenbroek, P.; Paillaugue, J.; Sendzimir, J.; et al. Multiple-line identification of socio-ecological stressors affecting aquatic ecosystems in semi-arid countries: Implications for sustainable management of fisheries in sub-saharan Africa. Water 2020, 12, 1518. [Google Scholar] [CrossRef]
- Yu, H.; Yang, Z.; Li, B. Sustainability assessment of water resources in Beijing. Water 2020, 12, 1999. [Google Scholar] [CrossRef]
- Mou, S.; Yan, J.; Sha, J.; Deng, S.; Gao, Z.; Ke, W.; Li, S. A comprehensive evaluation model of regional water resource carrying capacity: Model development and a case study in Baoding, China. Water 2020, 12, 2637. [Google Scholar] [CrossRef]
- Anandhi, A.; Crandall, C.; Bentley, C. Hydrologic characteristics of streamflow in the southeast Atlantic and Gulf coast hydrologic region during 1939–2016 and conceptual map of potential impacts. Hydrology 2018, 5, 42. [Google Scholar] [CrossRef] [Green Version]
- Alexakis, D.E. Meta-evaluation of water quality indices. Application into groundwater resources. Water 2020, 12, 1890. [Google Scholar] [CrossRef]
- Alexakis, D.E. Water quality indices: Current and future trends in evaluating contamination of groundwater resources. Water 2021, 13, 401. [Google Scholar] [CrossRef]
- Alexakis, D. Assessment of water quality in the Messolonghi-Etoliko and Neochorio region (West Greece) using hydrochemical and statistical analysis methods. Environ. Monit. Assess. 2011, 182, 397–413. [Google Scholar] [CrossRef]
- Kelepertsis, A.; Alexakis, D.; Kita, I. Environmental geochemistry of soils and waters of Susaki area, Korinthos, Greece. Environ. Geochem. Health 2001, 23, 117–135. [Google Scholar] [CrossRef]
- Golfinopoulos, S.K.; Varnavas, S.P.; Alexakis, D.E. The status of arsenic pollution in the Greek and Cyprus environment: An overview. Water 2021, 13, 224. [Google Scholar] [CrossRef]
- Alexakis, D.; Kiskira, K.; Gamvroula, D.; Emmanouil, C.H.; Psomopoulos, C. Evaluating toxic element contamination sources in groundwater bodies of two Mediterranean sites. Environ. Sci. Pollut. Res. 2021. [Google Scholar] [CrossRef] [PubMed]
- Giakoumakis, S.; Alexakis, D.; Gotsis, D. An approximate method for estimating nutrient loads in drainage water from a coastal irrigated area. Earth Sci. Res. J. 2013, 17, 115–118. [Google Scholar]
- Stamatis, G.; Lambrakis, N.; Alexakis, D.; Zagana, E. Groundwater quality in Mesogea basin in eastern Attica (Greece). Hydrol. Proc. 2006, 20, 2803–2818. [Google Scholar] [CrossRef]
- Stamatis, G.; Alexakis, D.; Gamvroula, D.; Migiros, G. Groundwater quality assessment in Oropos-Kalamos basin, Attica, Greece. Environ. Earth Sci. 2011, 64, 973–988. [Google Scholar] [CrossRef]
- Gamvroula, D.; Alexakis, D.; Stamatis, G. Diagnosis of groundwater quality and assessment of contamination sources in the Megara basin (Attica, Greece). Arab. J. Geosci. 2013, 6, 2367–2381. [Google Scholar] [CrossRef]
- Bathrellos, G.D.; Skilodimou, H.D.; Kelepertsis, A.; Alexakis, D.; Chrisanthaki, I.; Archonti, D. Environmental research of groundwater in the urban and suburban areas of Attica region, Greece. Environ. Geol. 2008, 56, 11–18. [Google Scholar] [CrossRef]
- Olaoye, I.A.; Confesor, R.B., Jr.; Ortiz, J.D. Effect of projected land use and climate change on water quality of Old Woman Creek Watershed, Ohio. Hydrology 2021, 8, 62. [Google Scholar] [CrossRef]
- Chegbeleh, L.P.; Aklika, D.K.; Akurugu, B.A. Hydrochemical Characterization and suitability assessment of groundwater quality in the Saboba and Chereponi districts, Ghana. Hydrology 2020, 7, 53. [Google Scholar] [CrossRef]
- Saeed, W.; Shouakar-Stash, O.; Wood, W.; Parker, B.; Unger, A. Groundwater and solute budget (A case study from Sabkha Matti, Saudi Arabia). Hydrology 2020, 7, 94. [Google Scholar] [CrossRef]
- Lateef, Z.Q.; Al-Madhhachi, A.-S.T.; Sachit, D.E. Evaluation of water quality parameters in Shatt AL-Arab, Southern Iraq, using spatial analysis. Hydrology 2020, 7, 79. [Google Scholar] [CrossRef]
- European Community. Water Framework Directive 2000/60/EC of the European Parliament and of the Council of 23 October 2000 establishing a framework for Community action in the field of water policy. Off. J. Eur. Commun. 2000, 22, 1–73. [Google Scholar]
- Masoud, M. Groundwater resources management of the shallow groundwater aquifer in the desert fringes of El Beheira Governorate, Egypt. Earth. Syst. Environ. 2020, 4, 147–165. [Google Scholar] [CrossRef]
- World Bank. Water Resources Management. Available online: https://www.worldbank.org/en/topic/waterresourcesmanagement (accessed on 17 April 2021).
- Google Earth. Greece, World Imagery. Available online: https://earth.google.com/web (accessed on 17 April 2021).
- Peel, M.C.; Finlayson, B.L.; McMahon, T.A. Updated world map of the Köppen–Geiger climate classification. Hydrol. Earth Syst. Sci. Discuss. 2007, 11, 1633–1644. [Google Scholar] [CrossRef] [Green Version]
- Fytikas, M.; Innocenti, F.; Mazzuoli, R. Geological Map of Greece-“Methana”; Sheet, 1:50,000; IGME: Athens, Greece, 1981. [Google Scholar]
- Bezes, Κ. Hydrogeological Study of Artificial Recharge in Aquifers of Trizina in Piraeus Prefecture; Volume C, Report for Investigation Wells and Pumping Tests; Ministry of Agriculture: Athens, Greece, 1999. (In Greek)
- OECD (Organisation for Economic Cooperation and Development) (Ed.) OECD Core Set of Indicators for Environmental Performance Reviews; Environment Monographs: Paris, Germany, 1993; Volume 83. [Google Scholar]
- Alexakis, D.; Kagalou, I.; Tsakiris, G. Assessment of pressures and impacts on surface water bodies of the Mediterranean. Cace study: Pamvotis lake, Greece. Environ. Earth Sci. 2013, 70, 687–698. [Google Scholar] [CrossRef]
- Kagalou, I.; Leonardos, I.; Anastasiadou, C.; Neofytou, C. The DPSIR approach for an integrated river management framework. A preliminary application on a Mediterranean site (Kalamas River-NW Greece). Water Res. Manag. 2012, 26, 1677–1692. [Google Scholar] [CrossRef]
- Bagordo, F.; Migoni, D.; Grassi, T.; Serio, F.; Idolo, A.; Guido, M.; Zaccarelli, N.; Fanizzi, F.P.; De Donno, A. Using the DPSIR framework to identify factors influencing the quality of groundwater in Grecìa Salentina (Puglia, Italy). Rendiconti Lincei 2016, 27, 113–125. [Google Scholar] [CrossRef]
- Kristensen, P. The DPSIR framework. In Paper Presented at the 27–29 September 2004 Workshop on a Comprehensive/Detailed Assessment of the Vulnerability of Water Resources to Environmental Change in Africa Using River Basin Approach; UNEP Headquarters: Nairobi, Kenya, 2004. [Google Scholar]
- Alcamo, J. Water quality and its interlinkages with the Sustainable Development Goals. Cur. Opin. Environ. Sustain. 2019, 36, 126–140. [Google Scholar] [CrossRef]
- CCME. Canadian Water Quality Guidelines for the Protection of Aquatic Life: CCME Water Quality Index 1.0; Technical Report; Canadian Council of Ministers of the Environment: Winnipeg, QC, Canada, 2001. [Google Scholar]
- CCME. Water Quality Index Workshop; Canadian Council of Ministers of the Environment, Winnipeg: Winnipeg, MB, Canada, 2003. [Google Scholar]
- European Community. Directive 2006/118/EC of the European Parliament and of the Council of 12 December 2006 on the protection of groundwater against pollution and deterioration. Off. J. Eur. Commun. 2006, 372, 19–31. [Google Scholar]
- Hellenic Republic. Ministerial Decree No. 1811/30-12-2011 establishing threshold values for the pollutants, groups of pollutants and indicators of pollution following the procedure set out in Part A of Annex II of Groundwater Directive (GWD) 2006/118/EC of the European Parliament and of the Council. In The Official Journal of the Hellenic Republic; Series B; No. 3322/30-12-2011; The National Printing House: Athens, Greece, 2011. [Google Scholar]
- EC (European Community). Council Directive 98/83/EC Directive of the European Parliament on the quality of water intended for human consumption. The European Parliament and the Council of the European Union. Off. J. Eur. Commun. 1998, 330, 32–54. [Google Scholar]
- Copernicus. Urban Atlas 2018. Copernicus Land Monitoring Service. 2021. Available online: https://land.copernicus.eu/local/urban-atlas/urban-atlas-2018 (accessed on 20 March 2021).
- Special Secretariat for Water. River Basin Management Plans. In River Basin District of Eastern Peloponnese; Appendix B. Analysis of Anthropogenic Pressures and Impacts on Surface and Groundwater Bodies; Deliverable 8 of Phase A; Special Secretariat for Water; Ministry of Environment and Energy: Amaliada, Greece, 2013. (In Greek) [Google Scholar]
- Jia, X.; O’Connora, D.; Houa, D.; Jin, Y.; Li, G.; Zheng, C.; Ok, Y.S.; Tsang, D.C.W.; Luo, J. Groundwater depletion and contamination: Spatial distribution of groundwater resources sustainability in China. Sci. Total Environ. 2019, 672, 551–562. [Google Scholar] [CrossRef]
- Li, W.; Chen, Y.; Shen, H.; Wu, M.; Zhu, Y. Ground subsidence effects since groundwater exploitation restriction in Wenhuang Plain. Resour. Survey Environ. 2015, 36, 306–310. [Google Scholar]
- Cuoco, E.; Colombani, N.; Darrah, T.H.; Mastrocicco, M.; Tedesco, D. Geolithological and anthropogenic controls on the hydrochemistry of the Volturno River (Southern Italy). Hydrol. Process. 2017, 31, 627–638. [Google Scholar] [CrossRef]
- Puckett, L.J.; Tesoriero, A.J.; Dubrovsky, N.M. Nitrogen contamination of surficial aquifers—A growing legacy. Environ. Sci. Technol. 2011, 45, 839–844. [Google Scholar] [CrossRef]
- WHO. Chloride in Drinking-Water. Background Document for Development WHO Guidelines for Drinking-Water Quality. 1993. Available online: https://www.who.int/water_sanitation_health/publications/chloride/en/ (accessed on 20 March 2021).
- Parvizishad, M.; Dalvand, A.; Mahvi, A.M.; Goodarzi, F. A review of adverse effects and benefits of nitrate and nitrite in drinking water and food on human health. Health Scope 2017, 6, e14164. [Google Scholar] [CrossRef] [Green Version]
- Chen, F.; Yao, L.; Mei, G.; Shang, Y.; Xiong, F.; Ding, Z. Groundwater quality and potential human health risk assessment for drinking and irrigation purposes: A case study in the semiarid region of north China. Water 2021, 13, 783. [Google Scholar] [CrossRef]
- Van Maanen, J.M.; van Dijk, A.; Mulder, K.; de Baets, M.H.; Menheere, P.C.; van der Heide, D.; Mertens, P.L.J.M.; Kleinjans, J.C.S. Consumption of drinking water with high nitrate levels causes hypertrophy of the thyroid. Toxicol. Lett. 1994, 72, 365–374. [Google Scholar] [CrossRef]
- Lundberg, J.O.; Feelisch, M.; Bjorne, H.; Jansson, E.A.; Weitzberg, E. Cardioprotective effects of vegetables: Is nitrate the answer? Nitric Oxide 2006, 15, 359–362. [Google Scholar] [CrossRef] [PubMed]
- Jensen, O.M. Nitrate in drinking water and cancer in northern Jutland, Denmark, with special reference to stomach cancer. Ecotoxicol. Environ. Saf. 1982, 6, 258–267. [Google Scholar] [CrossRef]
- Morales-Suarez-Varela, M.M.; Llopis-Gonzalez, A.; Tejerizo-Perez, M.L. Impact of nitrates in drinking water on cancer mortality in Valencia, Spain. Eur. J. Epidemiol. 1995, 11, 15–21. [Google Scholar] [CrossRef] [PubMed]
- Zhang, H.; Xu, Y.; Kanyerere, T. A review of the managed aquifer recharge: Historical development, current situation and perspectives. Phys. Chem. Earth 2020, 118–119, 102887. [Google Scholar] [CrossRef]


| Indicator | DPSIR Index |
|---|---|
| Total population | D |
| Agricultural land | D |
| Livestock activity | D |
| Water consumption | D |
| Fertilizer consumption | D |
| Water demand | P |
| Compounds emissions from agriculture | P |
| Compounds emissions from livestock | P |
| Maximum concentration of Cl− in groundwater | S |
| Maximum concentration of Na+ in groundwater | S |
| Maximum concentration of NH4+ in groundwater | S |
| Maximum concentration of NO2− in groundwater | S |
| Maximum concentration of NO3− in groundwater | S |
| Maximum concentration of SO42− in groundwater | S |
| Maximum value of electrical conductivity in groundwater | S |
| Hydrogen ion concentration (min and max) in groundwater | S |
| Maximum Water Quality Index (WQI) value | S |
| Higher WQI class | S |
| Higher Groundwater Directive (GWD) 2006/118/EC threshold value (TV) | S |
| Percentage of wells whose water is unsuitable for drinking | I |
| Percentage of wells whose water is classified into “marginal-poor”/“poor” category | I |
| Difficulty to meet Goals 3 and 6 | I |
| Seawater intrusion | I |
| Groundwater monitoring (quality and quantity) | R |
| Policies to control compounds emissions | R |
| Managed aquifer recharge | R |
| Class | 1 | 2 | ||
|---|---|---|---|---|
| CCME-WQI | Rating | marginal-poor | excellent-good-fair | |
| Range | 0–64 | 65–100 | ||
| GWD-TV | Units | Rating | poor | good |
| Cl− | mg L−1 | Range | >250 | <250 |
| NH4+ | mg L−1 | >0.50 | <0.50 | |
| NO2− | μg L−1 | >0.50 | <0.50 | |
| NO3− | mg L−1 | >50 | <50 | |
| SO42− | mg L−1 | >250 | <250 | |
| CND | μS cm−1 | >2500 | <2500 | |
| pH | - | <6.5 or >9.5 | 6.5–9.5 |
| Units | DL | N | Min | Mean | Median | Max | PV | |
|---|---|---|---|---|---|---|---|---|
| Br− | μg L−1 | 0.01 | 5 | 0.2 | 0.5 | 0.4 | 0.8 | _ |
| Ca2+ | mg L−1 | 0.05 | 31 | 46.1 | 128.6 | 118.9 | 240.0 | _ |
| Cl− | mg L−1 | 1.0 | 31 | 21.0 | 80.5 | 42.3 | 423.2 | 250 |
| F− | mg L−1 | 0.05 | 2 | 0.1 | 0.3 | 0.3 | 0.4 | |
| HCO3− | mg L−1 | 1 | 31 | 207 | 283 | 286 | 361 | _ |
| K+ | mg L−1 | 0.05 | 31 | 0.5 | 1.2 | 1.0 | 3.7 | _ |
| Li+ | μg L−1 | 0.1 | 31 | _ | _ | _ | <0.1 | _ |
| Mg2+ | mg L−1 | 0.05 | 31 | 6.9 | 20.1 | 16.3 | 54.7 | _ |
| Na+ | mg L−1 | 0.05 | 31 | 16.6 | 30.6 | 24.5 | 115.4 | 200 |
| NH4+ | mg L−1 | 0.1 | 31 | _ | _ | _ | <0.1 | 0.50 |
| NO2− | mg L−1 | 0.1 | 31 | _ | _ | _ | <0.1 | 0.50 |
| NO3− | mg L−1 | 0.5 | 31 | 1 | 46.6 | 26.7 | 180 | 50 |
| PO43− | mg L−1 | 0.1 | 31 | _ | _ | _ | <0.1 | _ |
| SO42− | mg L−1 | 1 | 31 | 26 | 55 | 51 | 107 | 250 |
| CND | μS cm−1 | 1 | 31 | 597 | 1062 | 943 | 2037 | 2500 |
| pH | _ | _ | 31 | 7.4 | 7.7 | 7.7 | 8.2 | 6.5–9.5 |
| TDS | mg L−1 | 2 | 31 | 390 | 691 | 611 | 1326 | _ |
Publisher’s Note: MDPI stays neutral with regard to jurisdictional claims in published maps and institutional affiliations. |
© 2021 by the author. Licensee MDPI, Basel, Switzerland. This article is an open access article distributed under the terms and conditions of the Creative Commons Attribution (CC BY) license (https://creativecommons.org/licenses/by/4.0/).
Share and Cite
Alexakis, D.E. Linking DPSIR Model and Water Quality Indices to Achieve Sustainable Development Goals in Groundwater Resources. Hydrology 2021, 8, 90. https://doi.org/10.3390/hydrology8020090
Alexakis DE. Linking DPSIR Model and Water Quality Indices to Achieve Sustainable Development Goals in Groundwater Resources. Hydrology. 2021; 8(2):90. https://doi.org/10.3390/hydrology8020090
Chicago/Turabian StyleAlexakis, Dimitrios E. 2021. "Linking DPSIR Model and Water Quality Indices to Achieve Sustainable Development Goals in Groundwater Resources" Hydrology 8, no. 2: 90. https://doi.org/10.3390/hydrology8020090