Article

Real-Time Flood Mapping on Client-Side Web Systems Using HAND Model

1
Computer Science, Massachusetts Institute of Technology, Cambridge, MA 02139, USA
2
Civil and Environmental Engineering, University of Iowa, Iowa City, IA 52246, USA
*
Author to whom correspondence should be addressed.
Hydrology 2021, 8(2), 65; https://doi.org/10.3390/hydrology8020065
Submission received: 26 January 2021 / Revised: 28 March 2021 / Accepted: 3 April 2021 / Published: 11 April 2021
(This article belongs to the Special Issue Flood Early Warning and Risk Modelling)

Abstract

:
The height above nearest drainage (HAND) model is frequently used to calculate properties of the soil and predict flood inundation extents. HAND is extremely useful due to its lack of reliance on prior data, as only the digital elevation model (DEM) is needed. It is close to optimal, running in linear or linearithmic time in the number of cells depending on the values of the heights. It can predict watersheds and flood extent to a high degree of accuracy. We applied a client-side HAND model on the web to determine extent of flood inundation in several flood prone areas in Iowa, including the city of Cedar Rapids and Ames. We demonstrated that the HAND model was able to achieve inundation maps comparable to advanced hydrodynamic models (i.e., Federal Emergency Management Agency approved flood insurance rate maps) in Iowa, and would be helpful in the absence of detailed hydrological data. The HAND model is applicable in situations where a combination of accuracy and short runtime are needed, for example, in interactive flood mapping and supporting mitigation decisions, where users can add features to the landscape and see the predicted inundation.

1. Introduction

Flooding is a global problem, and floods around the world are becoming more significant and severe [1]. Of natural disasters worldwide 40% are floods [2]. It is important to model and predict inundation extent of floods, which is critical information for flood mitigation [3,4], preparedness [5], and planning and response efforts [6]. Real-time and accurate predictions of flood inundation extent can facilitate understanding the potential flood risk and damage [7,8], and support flood mitigation and planning [9]. Flood inundation maps can be used in flood risk communication using intelligent systems [10,11] and novel communication systems [12].
Floods are caused by a multitude of factors, which makes prediction difficult [13]. Moisture flows and consequently rainfall [14], runoff, and stream behavior [15] and other issues affect flooding significantly. For these reasons, flood prediction has a highly complex and non-linear nature [16]. There are various models to predict flood extent. While empirical models include observations [17] and remote sensing [18], and benchmark datasets [19] of past events, hydrodynamic models simulate physical movement of the water [20]. Data driven methods are used extensively in hydrology and water resources modeling [21,22]. One of the simplest and earliest data driven methods based on elevation is flood-fill, which produces results in optimal time but provides less accurate predictions. Another simple method involves overlaying an observed flood level with the topography [23]. On the other hand, there are a variety of complex hydrological models that take into account numerous distinct factors, such as the three-dimensional model [24]. Generally, models that have a good balance between speed and accuracy are used in operational needs [25].
There are several challenges with the existing hydrodynamic models to be helpful in real-time and operational decision-making situations [26]. One of the main issues is that these models often require a lot of detailed hydrological data [27]. For example, advanced hydrodynamic models for flood map prediction often take into account a plethora of factors, including riverbed dynamics, hydraulic features, and structures [28]. The second main challenge to utilize these models in decision making is their computational complexity. Some of the methods that provide a balance between speed and accuracy [29] also utilize data that is costly to gather, such as topographical indices [30].
The height above the nearest drainage algorithm has a wide variety of applications. The height above nearest drainage (HAND) method was originally designed to categorize soil environments and find water tables. Renno et al. [31] first outlined the algorithm and applied it to categorize swampy forests vs. terra-firme forests in the Amazonian jungle. Nobre et al. [32] applied HAND to categorize water tables in a large area of the central Amazon rainforest. The most recent application area for HAND methods is in flood inundation. Nobre et al. [33] applied the HAND model to predict flooding in Southern Brazil. The largest application of this is being able to predict flooding in areas that have little to no prior data, due to the HAND model’s total reliance on the DEM. Previous studies on HAND model to predict flood maps [33,34] achieved model accuracy around 86-98% when compared to reference flood extent maps.
Recent advancements in web technologies have allowed for desktop level computation and analysis of large-scale datasets. Web systems have been effectively used in environmental data analysis [35,36], distributed computing [37], and geospatial data processing [38]. WebAssembly is a low-level assembly-like language for the web with near-native performance and allows languages such as C/C++, C# and Rust to run on the web. WebAssembly was recently released in March 2017 and is designed to run code both safely and efficiently in browsers on the client-side [39]. These technologies have allowed for previously unobtainable speeds and computations to be performed on local users’ computers.
Here, we utilize the HAND method in order to provide flood inundation extent predictions in real-time on client-side web systems. We discuss the applicability of the algorithm in comparison with other prediction algorithms for flood-prone regions of Iowa and the applications for such real-time prediction. Our objective is to outline the HAND algorithm and demonstrate that it has potential to predict both accurately and quickly on the web, and support flood related decision-making activities [40,41]. There are a variety of benefits that HAND can provide in flood inundation prediction. First, due to its low complexity, HAND runs in very fast time both theoretically and practically. This means that stakeholders involved or interested in flood planning (for example a government official or concerned citizen) can easily make changes to a DEM to simulate adding man-made barriers and then run the algorithm to determine how these changes affect flood inundation extents. This can lead to more effective flood protection planning, since previously users were meant to look at a standalone flood model generated once by an advanced but computationally expensive algorithm and then make educated guesses on the design and utilization of man-made flood prevention measures.
In the following sections, we will outline the algorithm, details of implementations on the web systems, and several evaluation case-studies for comparison to real-world flooding scenarios.

2. Materials and Methods

Our goal with this study is to demonstrate the implementation of the HAND model on client-side web systems and evaluate the accuracy and performance for real-time decision-making scenarios. The system will provide an implementation of the HAND algorithm that runs in the local browser of the user for fast flood extent prediction that can work offline and in operational settings with minimal processing on the web server. The system will allow users to modify aspects of the terrain for mitigation purposes and be able to see predicted flood inundation extents in order to facilitate the use of measures to control potential flood damage.

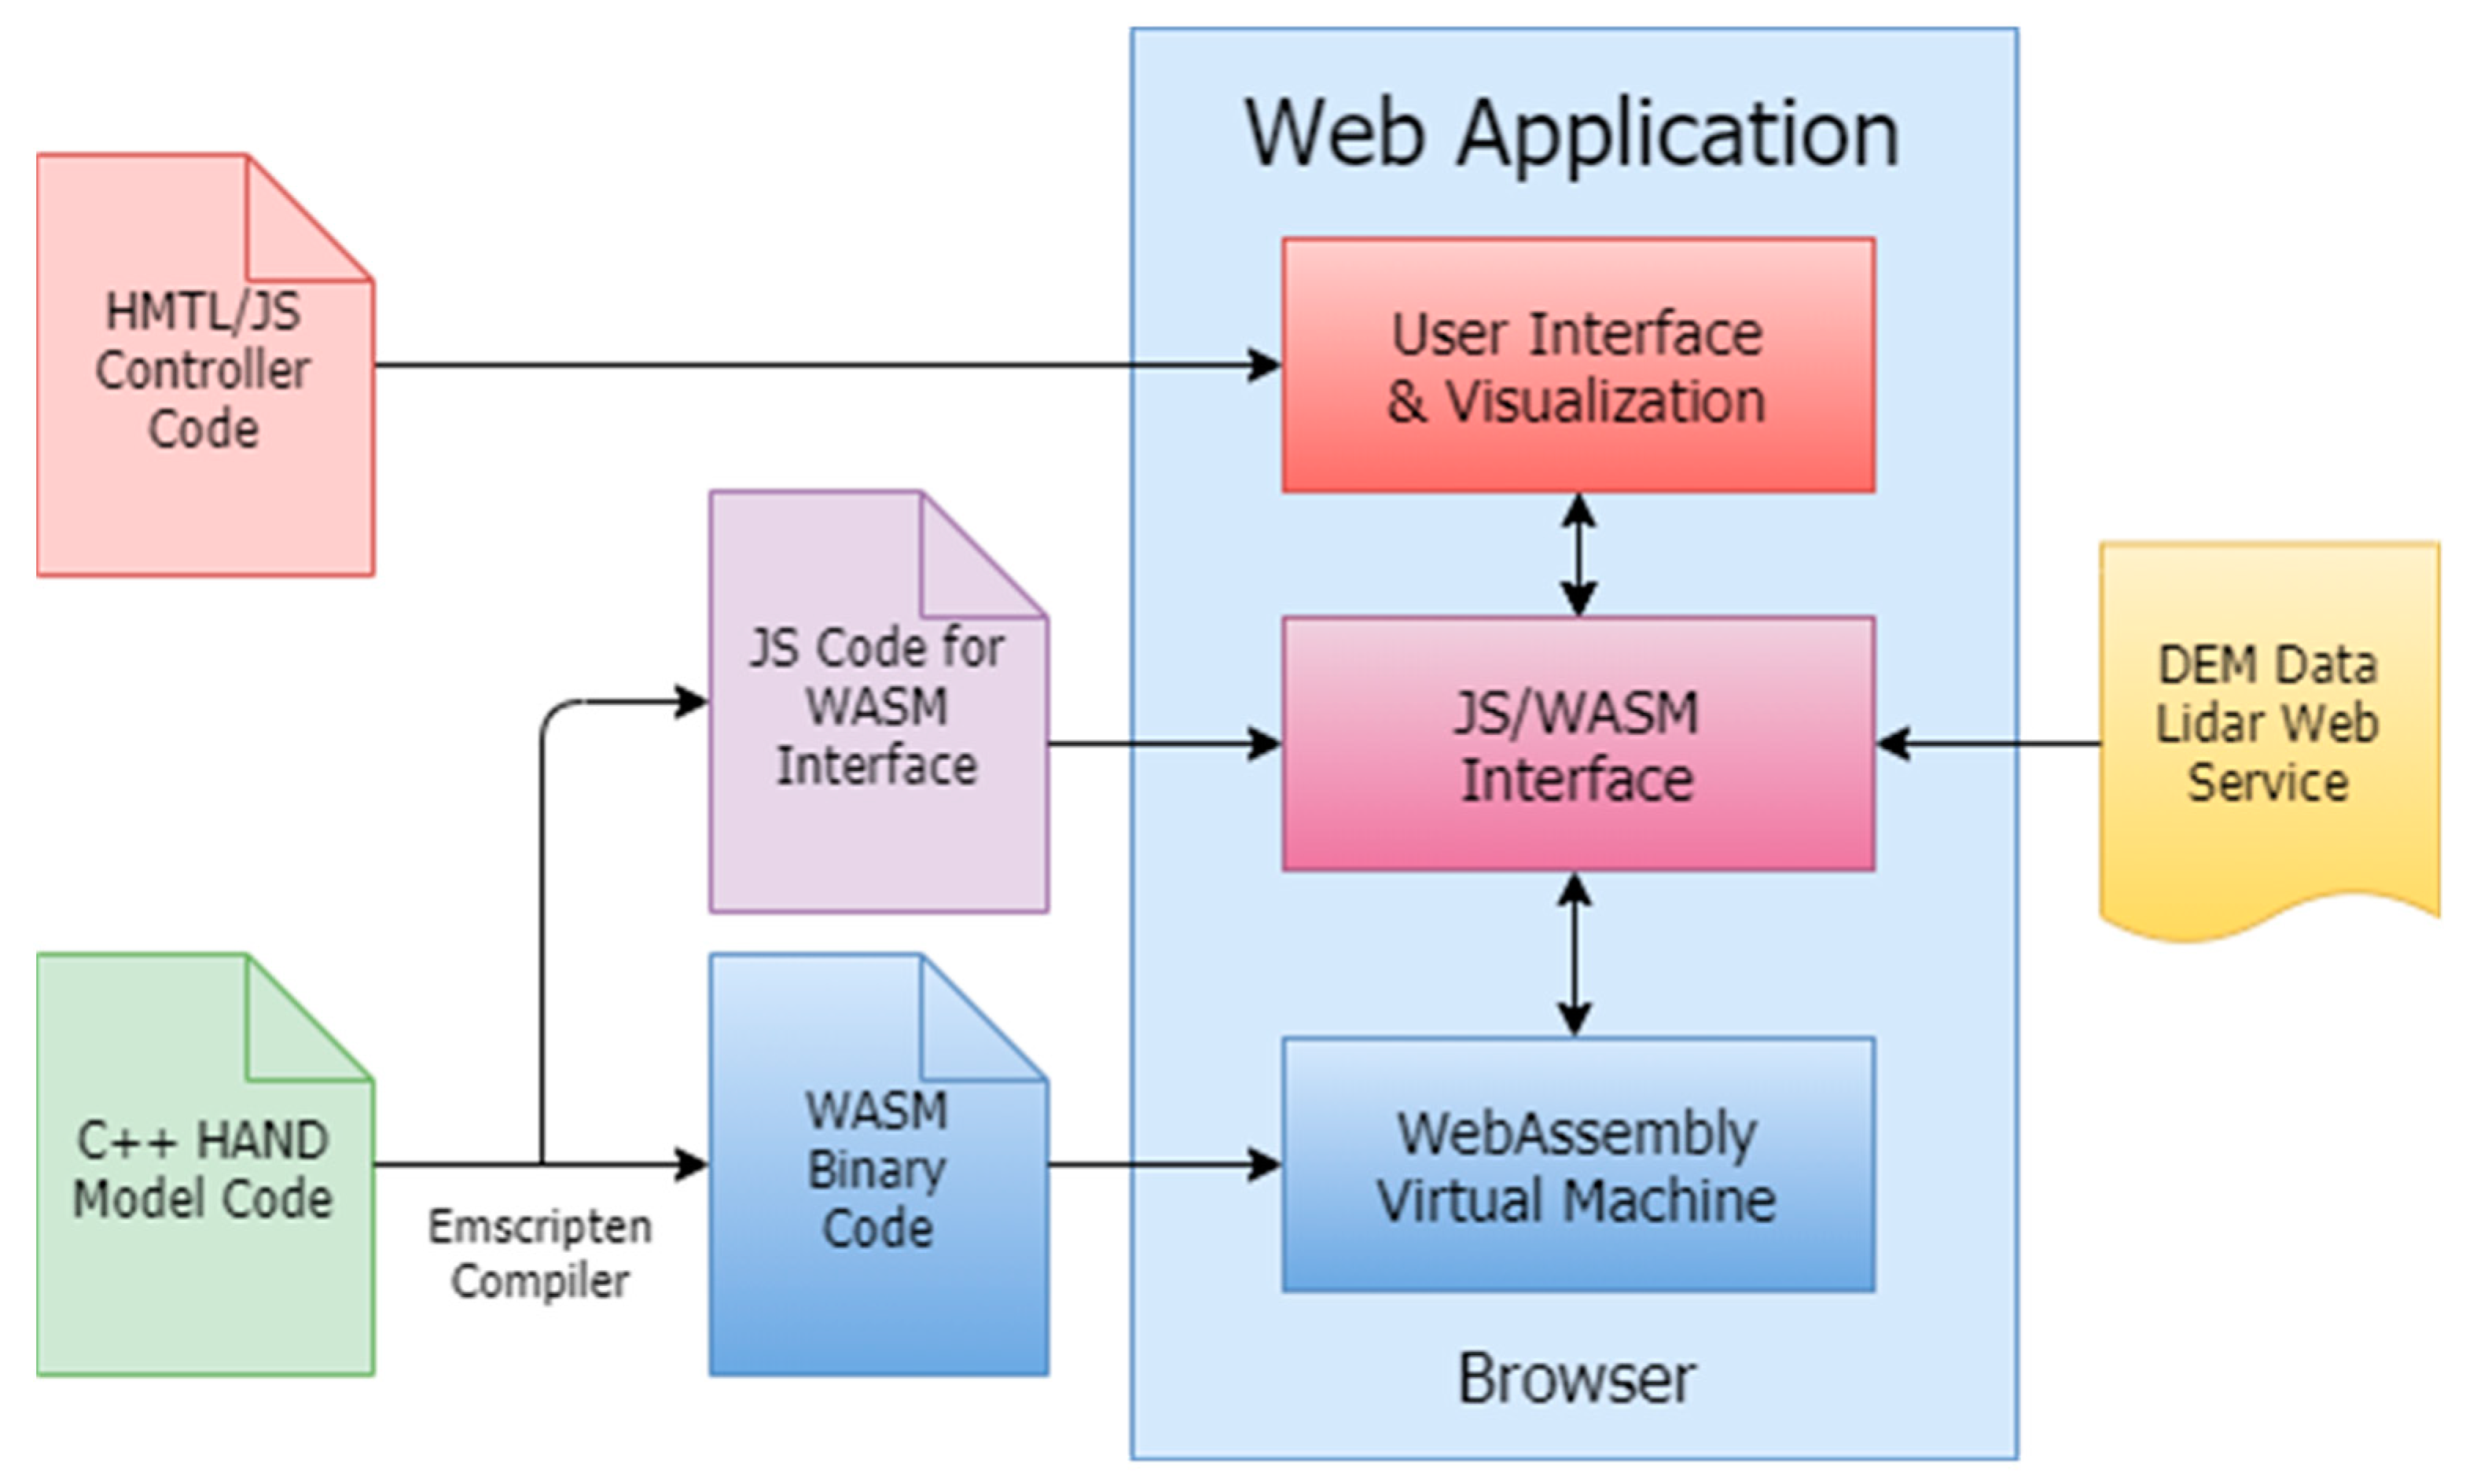
2.1. Web Implementation of HAND
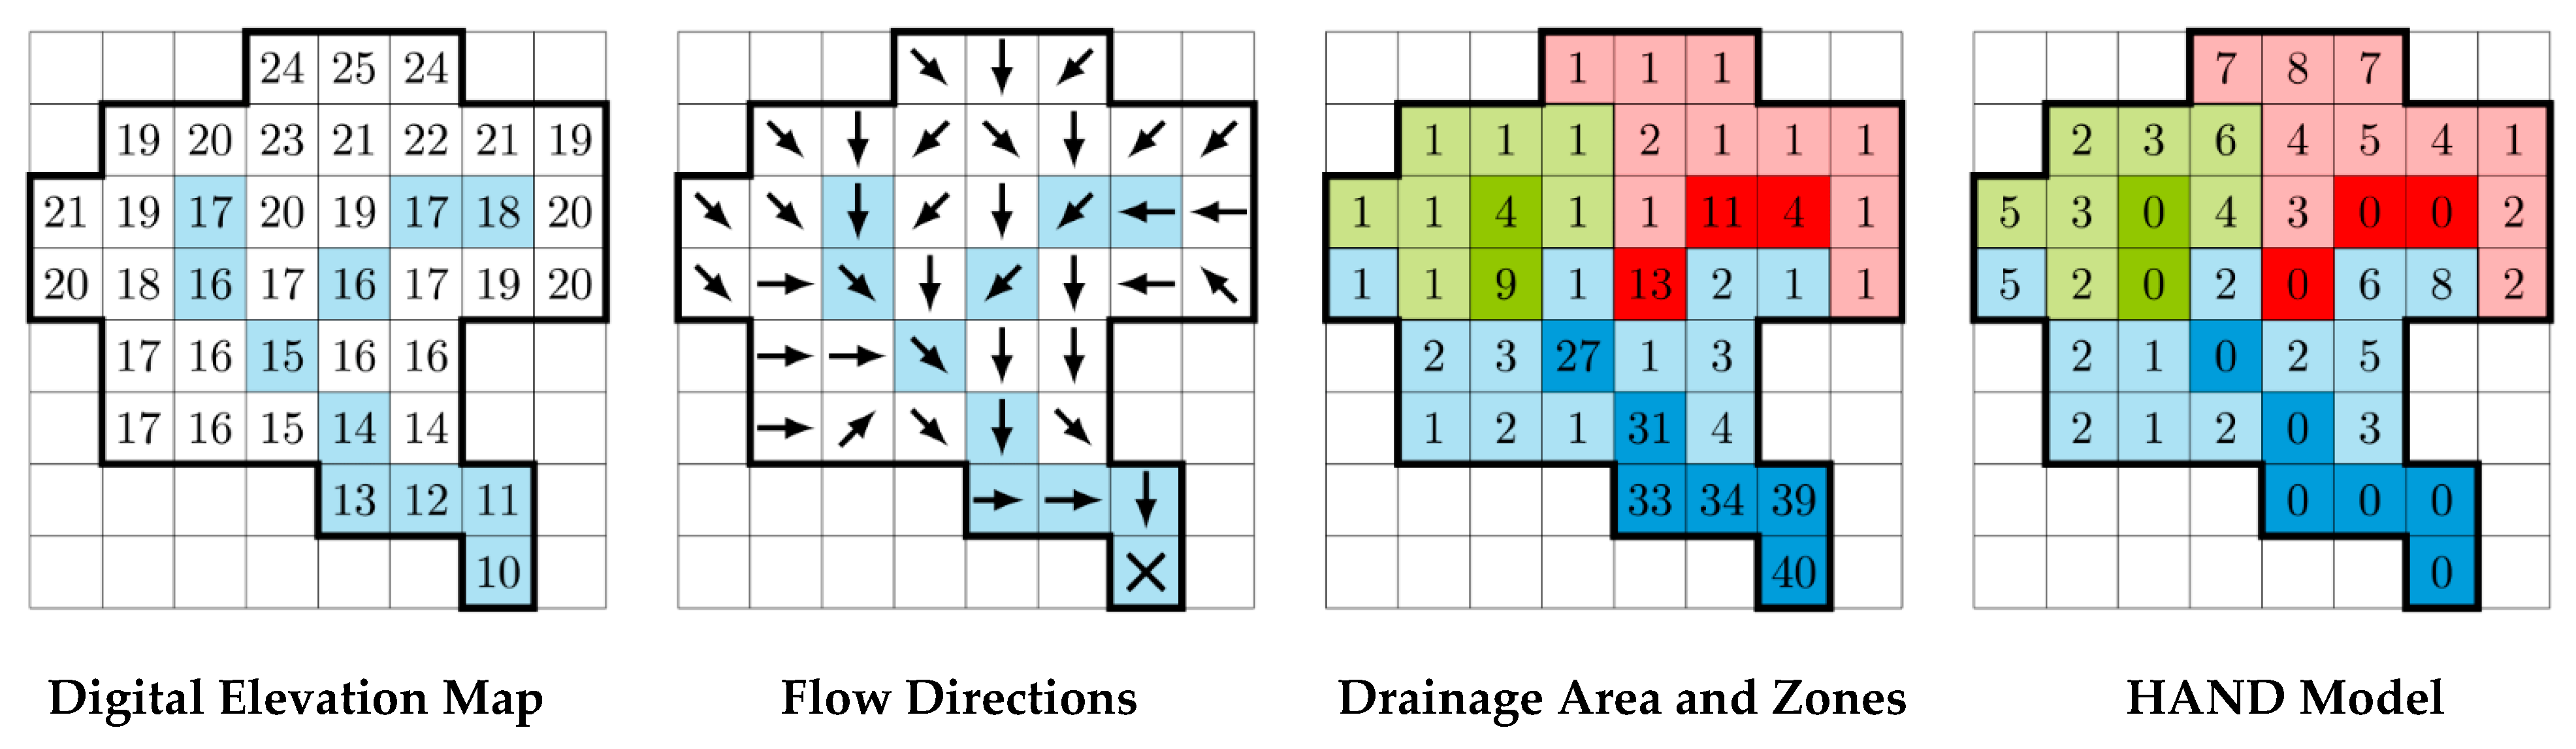
Figure 1 presents the architecture of the real-time web-based HAND flood map generation system. It includes several steps to compute and generate flood maps using the HAND algorithm. The system is designed so that the algorithmic portion of HAND is entirely in C++ and run on WebAssembly to enable client-side implementation. The code for the computationally heavy portion of the HAND algorithm was written in C++. Emscripten was used to compile the C++ code to WebAssembly, which allows JavaScript (JS) to pass input data and receive model output. The only input is the DEM data and the drainage threshold value provided by the user. The WebAssembly-compiled implementation of HAND calculates the heights above nearest drainages and passes that information to JavaScript for visualizing the flood extent on Google Maps.
The C++ algorithmic implementation is precompiled into WebAssembly. The resulting code is meant to supply an efficient way to run the HAND algorithm. Most features of prediction, which can be applied either pre- or post-computation, are left out of the WebAssembly component. WebAssembly is running on an in-browser virtual machine. JavaScript glue code generated by Emscripten provides a means to interface with the WebAssembly VM. The HTML/JS frontend loads images from a source, either static or online, and applies user selected parameters before and after computation. This piece of the architecture calls the API provided by the glue code to interface with the WebAssembly VM and provide prediction results. The JS manages the frontend of the application for taking user inputs, integrating external terrain data, and visualizing map output.
The web implementation is meant to make the system as flexible as possible for all sorts of applications that can utilize the HAND algorithm implementation, and apply their own features (changing terrain, allowing for multiple parameter changes in local areas, etc.). For example, one application might scrape DEM data from various online sources and allow users to generate flood maps in any region in the world. A different application might generate DEMs with another algorithm and allow users to explore the generated flood maps.
Many of the features relevant for flood prediction are nearly independent of the computation of the HAND. For example, two of the three relevant parameters, HAND threshold and absolute height threshold, can be applied after the actual HAND model is computed. In addition, other features such as applying HAND thresholds only to specific areas, dynamically loading DEMs, and adding terrain features (dikes, reservoirs, etc.) are better suited to the client-side processing using JavaScript. Since these features are highly application-specific but low in terms of computational expense, we leave them out of the C++ and WebAssembly implementation. For example, one application might require dynamic loading of DEMs from state resources, while another generates DEMs with an algorithm and passes them in. This allows the C++ implementation to be highly portable and versatile; a wide variety of applications requiring the use of the HAND algorithm can utilize it.

2.2. HAND Algorithm

In our study, we applied HAND methodology (as described in [32,33]) in order to predict the extent of flood inundation. By calculating the vertical distance from a cell and its parent cell and applying several heuristic steps, we can calculate the extent of flood inundation with a comparable accuracy. A brief description of the steps (Figure 2) for HAND algorithm is given here:
Determining Flow Direction: We define the direction of the flow of cell a in the DEM as the adjacent cell to which the water on a will flow. Water can only flow in one direction, which means that it can only flow to one cell. We define the set of adjacent cells to the cell at coordinates (x0, y0) in Equation (1) as
{ (x, y) | max (|x − x0|, |y − y0|) = 1 }
We define the child of cell a to be cell b such that the direction of the flow of cell a is towards cell b. We define a flow chain of cell a as an ordered list of cells such that the first cell in the list is a, and each subsequent cell is a child of the previous cell.
Depression Removal: First, the graph must be normalized to remove depressions that are undrainable. An undrainable depression is a set of cells in which any pair of cells in the set can be reached by traversing a path of cells in which consecutive cells on the path are adjacent to each other and each cell in the path is part of the set and none of the cells have a continuous flow to the border of the DEM (none of the cells have a border cell in their flow chain). We used priority-flood depression filling [43] in this case. This ensures that all water can drain to the outside of the map, and that there will be no cycles or other anomalies that can disrupt subsequent algorithms. This step runs in O(N) for integer elevations or O(N log N) for floating-point elevations, where N is the number of cells.
Computing Flow Directions: Then, the direction of water flow for each cell needs to be resolved. We used the D8 algorithm to compute the flow directions. The D8 algorithm takes the adjacent cell that provides the highest gradient to be the cell of the direction of the flow. A flat-resolving algorithm [44] was used to determine the direction of flow in flat areas (where all adjacent cells to a cell have the same height) and guide water away from high areas and towards lower areas. This step runs in O(N) time.
HAND Model Generation: Next, drainages need to be established on the graph. This is done by setting an accumulated area threshold. If a cell has more units of area of water that drain through it than the area threshold, then it becomes a drainage cell. In other words, if the number of flow chains that the cell is part of is greater than the accumulated area threshold, then it is a drainage cell. The nearest drainage for a cell is then the first cell in its flow chain that is a drainage cell. This step runs in O(N) time. Finally, the heights above the nearest drainage are calculated by subtracting the height of the cell in the original DEM with the nearest drainage cell’s height in the original DEM.

2.3. Implementation Challenges

There were several issues encountered during the course of implementing the HAND model on the web. HAND model does not account for some of the parameters like height of water and absolute height.
Height of Water: The HAND algorithm as it currently exists views each drainage stream as only one pixel in width, and it does not take into account the height of water. This means that the algorithm will think that a wide river is actually a canyon. The algorithm thinks that the banks of the river have extremely high HAND values because the stream’s elevation is at the bottom of the river. In reality the banks of the river have HAND value near zero, because water goes up to the top of the river bank, but the algorithm does not reflect this. To overcome this issue, we added two parameters into implementation.
(a)
HAND flood threshold (hereafter referred to as “HAND threshold”). This is the main component of the flood inundation calculation. If the HAND of a cell is below this threshold, then it will be counted as flooded, as long as it satisfies the third parameter. In other words, cell a is counted as flooded by threshold t if HAND[a] < t.
(b)
Accumulated area of drainage threshold (hereafter referred to “drainage threshold”). This is used to define which flows of water are actually drainages. If the amount of water area that flows over a cell is over this threshold, then it is counted as drainage.
There are several effects of these parameters on the model outcome. As the HAND threshold goes up, the extent of areas marked as flooded will increase. If the HAND threshold is defined too high, the entire area will be flooded. Drainage threshold controls how many drainage points are available in the selected region. If the drainage threshold is defined too high, the algorithm becomes a slow flood-fill. If it is too low, the flooding predictions are exceedingly coarse, with big blotches splattered around with general inaccuracy. By having a high HAND threshold and enough drainage streams, we allow the areas adjacent to the rivers to be easily flooded, despite being viewed as canyons by the algorithm.
Absolute Height: If there is a large plateau that drains into a stream going downhill, the algorithm will view the plateau as flooded, even when it might be far above local rivers and other water bodies and have a low chance of flooding. To overcome this issue, we added a third parameter for the maximum height threshold of flooding (hereafter referred to “absolute height threshold”). If a cell’s absolute height is above this threshold, then it will not be considered as flooded. Absolute height threshold controls extent of flooding. If it is defined too high, areas that would be dry are predicted as flooded. If it is too low, the algorithm will miss much of the flooding in higher areas. A medium absolute height threshold allows rivers that have a slope to still have effective flooding predictions within them and on their borders but prevents adjacent flat-but-elevated landforms being counted as flooded. A combination of a medium absolute height threshold and high HAND threshold effectively serves to counter the two issues listed.

3. Results and Discussion

We compared the results of the HAND output with two other flood inundation predictors: a basic flood-fill implementation and Federal Emergency Management Agency (FEMA) approved Flood Insurance Rate Maps (100-yr, 500-yr) developed [45] at the Iowa Flood Center (IFC). We used two datasets for the analysis. The first was the Cedar Rapids (Figure 3) metro area in Iowa, where we utilized a DEM at a resolution of 1 m for 5 sq km area (2863 × 1746 grid). The second was for the Ames, Iowa (Figure 3), where we used a DEM at a resolution of 2 m for 53.8 sq km area (4220 × 3189 grid). All DEMs were normalized to 255 units corresponding to 1–3 ft vertical elevation in real-world based on vertical resolution.
For the Cedar Rapids area, the HAND algorithm ran in roughly 3 s using a mid-range personal laptop and produced an output differing from the reference map predictions by 10%. The flood-fill implementation ran in less than one second and produced an output differing by roughly 15%. For the Ames area, the HAND algorithm (Figure 4) ran in roughly 9 s and produced an output differing from the reference map predictions by 6%. The flood-fill implementation (Figure 4) ran in roughly one second and produced an output differing by roughly 30%. The HAND model’s accuracy was notably improved, both in absolute error and in error relative to the flood-fill implementation; this was most likely due to the larger scale of the Ames DEM. Comparisons were drawn between appropriate thresholds in the FEMA reference maps and the results of the HAND implementation. Several predictions of arbitrary values of parameters were generated with the algorithm and are presented here to show the effects of adjusting the parameters of the prediction algorithm on the output.

3.1. Adjustment of Parameters

To adjust for flood predictions in areas without prior predictions or flood maps, we must take into account the scale of the area we are modifying, and a sense of an absolute maximum for good area control. The Ames area DEM measures 65 square km, and the most effective drainage threshold measured was 1 million cells corresponding to a 4 square km area. This is most likely the absolute maximum, as it is strikingly similar to suggested effective threshold value of 4.05 square km in the literature [33]. The HAND threshold is highly correlated with the level of the flooding on the terrain. The best way to analyze this is to figure out the relative heights of the cells and compare them to real-world heights, and then scale appropriately. For example, if the cells had relative heights corresponding to one unit as 2 ft, and if information exists that areas less than 4 ft above the nearest drainage will be flooded, then the HAND threshold can be set as two units corresponding to 4 ft.
The absolute threshold must be determined by the maximum height that the user predicts the flood will extend, similar to the HAND threshold, but in an absolute manner. To generalize parameters to areas for which there is no prior prediction available, it is recommended that areas with similar topography and known predictions for flood inundation extents be examined; then, the user can find good parameters for the HAND algorithm that match those known predictions, and apply those same parameters to the unknown area.

3.2. Evaluation of Parameter Sensitivity

We evaluated the sensitivity of the HAND parameters on generating the flood extent. Table 1 and Table 2 present the resulting flood extents for changing model parameters mentioned in the HAND algorithm section above. We tested several drainage threshold (100 K, 500 K, 1 M, and 2 M cells), HAND threshold (2, 3, 4, and 6 units), and absolute elevation threshold (220 and 225 ft) values. As seen from the resulting flood extents, higher HAND threshold values cause larger areas around drainage points to be flooded. Higher drainage threshold on the other hand causes number of drainage points to be fewer, which causes less branching in the predictions. Higher absolute threshold causes fewer high-elevation areas to be flooded. These parameters have significant impact on the resulting map details and accuracy. Drainage threshold has an optimal value as 4 square kilometers as supported by the literature [33], however it can further be calibrated if reference maps are available for selected region. The HAND threshold represents the water level at the outlet of the selected watershed. The HAND threshold value can be assigned using visual inspection, water level gauge, forecast models or historical data from a near-by gauge.

3.3. Real-Time HAND Generation Performance

In this study, we evaluated the computational performance of client-side flood map generation using the HAND model and WebAssembly. We selected different DEM resolutions (1, 5, 10, 25, 50, and 100 m) and grid sizes (1, 4, 9, 16, and 25 million cells) for evaluation. Based on the selected elevation data resolution and grid size, generated maps represent city, county, and state scale in coverage (Table 3). The performance of the map generation took roughly 0.25–6.25 s on a moderate personal computer. Higher DEM resolutions could be used for any scale based on data availability and computational resources. The client-side implementation on WebAssembly could further speed up by using Web Workers and distributing the computation to multiple CPUs on the same machine.
Terrain Modification and Mitigation Scenarios: The computational speed and starting the mapping process from bare elevation dataset is a critical benefit of the presented system for what if scenario analysis in flood mitigation. The users can modify the terrain for potential flood preparedness and mitigation applications (i.e., adding flood walls, elevating structures, and sand bagging critical infrastructure) and generate the resulting map within seconds to evaluate the mitigation application. The system can use base or modified terrain data as an input and generate corresponding floods maps. Users can evaluate mitigation options based on resulting flood maps and how much area is saved from flooding.
A sample case study was generated for Cedar Rapids, Iowa, where resulting map can be seen in Figure 5 before and after terrain modification. Mitigation impact of the levee on resulting flood can be seen from the figure. Significant area in the urban setting could be saved from flooding by installing a levee on the west site of the river. The system can be used for what-if scenario evaluation by simple terrain modifications. While this analysis could take hours to days to run on traditional flood mapping applications, it takes under a minute to modify the terrain and generate the resulting maps in the proposed system.
Model Generalization: Operational use and generalization capability of any flood map generation method is heavily dependent on the data availability and quality. While high-resolution DEM data (e.g., 1 m or 3 m) is not generally available around the world, many global elevation datasets [46] exist with moderate resolution (i.e., 30 m) and data quality. We tested HAND model at Cedar Rapids, Iowa (Figure 6) with low resolution elevation datasets (i.e., 10 m, 25 m, and 50 m) to understand the performance of the proposed system for limited data availability and quality. The resulting maps using 25 m or 50 m were relatively similar in flood map prediction quality compared to maps based on 10 m resolution datasets.
Low resolution elevation dataset caused small percentage (<5%) of the areas to be overestimated and underestimated compared to high resolution maps due to changes in the connectivity of the terrain for flow direction calculations. This issue could be further reduced while creating different resolution elevation datasets during resampling or surveying. The proposed HAND model includes terrain conditioning and clean up (i.e., pit removal and resolving flats) during flow direction generation. Low resolution elevation datasets can be further improved externally before connecting to the real-time system for more accurate results.

4. Conclusions

Real-time flood map generation is critical for operational activities in flood preparedness, mitigation, and response. Traditional flood mapping models requires extensive data and computation resources. In this study, we presented real-time flood map generation in client-side web systems using the HAND model with comparable results to FEMA-based reference maps. The height above the nearest drainage model computes the vertical distance from each cell to its nearest drainage. Testing of the HAND model in two key regions of Iowa demonstrated that the HAND model could be used to generate flood inundation predictions that are both accurate and fast. Predictions generated matched precomputed FEMA-approved flood insurance rate maps with acceptable accuracy within several seconds. Previous papers and applications of HAND focused on their minimal usage of external datasets, which allows for prediction of soil conditions and flood inundation extent in areas with little to no data aside from elevation datasets. The main application of our development is the ability of floodplain managers and end-users to add features to the terrain, such as levees and reservoirs, and examine how they will affect the extent of flooding. Since the users will be able to modify the terrain and see the result in real time, they will be able to get a better idea of how flood mitigation measures will affect flood inundation extents and be able to prepare for flooding in time with more accurate and relevant information. Future work can include an interactive user interface allowing selection of parameters, with potential automation and algorithms to select parameters to reflect real-world scenarios.

Author Contributions

Conceptualization, I.D.; methodology, A.H. and I.D.; software, A.H. and I.D.; validation, A.H.; formal analysis, A.H.; investigation, A.H. and I.D.; resources, A.H. and I.D.; data curation, A.H.; writing—original draft preparation, A.H. and I.D.; writing—review and editing, A.H. and I.D.; visualization, A.H. and I.D.; supervision, I.D.; project administration, I.D.; funding acquisition, I.D. All authors have read and agreed to the published version of the manuscript.

Funding

This research was supported by Secondary Student Training Program at the University of Iowa.

Institutional Review Board Statement

Not applicable.

Informed Consent Statement

Not applicable.

Data Availability Statement

Data used in this study is publicly available from Federal Emergency Management Agency, Iowa Flood Center and Iowa Department of Natural Resources.

Acknowledgments

The floodplain maps used in the analysis were acquired from the statewide mapping project at the Iowa Flood Center.

Conflicts of Interest

The authors declare no conflict of interest.

References

  1. Coumou, D.; Rahmstorf, S. A decade of weather extremes. Nat. Clim. Chang. 2012, 2, 491–496. [Google Scholar] [CrossRef]
  2. Noji, E.K. Natural Disasters. Crit. Care Clin. 1991, 7, 271–292. [Google Scholar] [CrossRef]
  3. Bhola, P.K.; Leandro, J.; Disse, M. Framework for offline flood inundation forecasts for two-dimensional hydrodynamic models. Geosciences 2018, 8, 346. [Google Scholar] [CrossRef] [Green Version]
  4. Tadesse, Y.B.; Fröhle, P. Modelling of Flood Inundation due to Levee Breaches: Sensitivity of Flood Inundation against Breach Process Parameters. Water 2020, 12, 3566. [Google Scholar] [CrossRef]
  5. Arrighi, C.; Pregnolato, M.; Dawson, R.J.; Castelli, F. Preparedness against mobility disruption by floods. Sci. Total Environ. 2019, 654, 1010–1022. [Google Scholar] [CrossRef] [PubMed]
  6. Bhatt, C.M.; Rao, G.S.; Diwakar, P.G.; Dadhwal, V.K. Development of flood inundation extent libraries over a range of potential flood levels: A practical framework for quick flood response. Geomat. Nat. Hazards Risk 2017, 8, 384–401. [Google Scholar] [CrossRef] [Green Version]
  7. Singh, Y.K.; Dutta, U.; Prabhu, T.S.; Prabu, I.; Mhatre, J.; Khare, M.; Srivastava, S.; Dutta, S. Flood response system—A case study. Hydrology 2017, 4, 30. [Google Scholar] [CrossRef] [Green Version]
  8. Yildirim, E.; Demir, I. An integrated web framework for HAZUS-MH flood loss estimation analysis. Nat. Hazards 2019, 99, 275–286. [Google Scholar] [CrossRef]
  9. Yildirim, E.; Demir, I. An Integrated Flood Risk Assessment and Mitigation Framework: A Case Study for Middle Cedar River Basin, Iowa, US. Int. J. Disaster Risk Reduct. 2021, 56, 102113. [Google Scholar] [CrossRef]
  10. Lamichhane, N.; Sharma, S. Development of flood warning system and flood inundation mapping using field survey and LiDAR data for the Grand River near the city of Painesville, Ohio. Hydrology 2017, 4, 24. [Google Scholar] [CrossRef] [Green Version]
  11. Sermet, Y.; Demir, I. Towards an information centric flood ontology for information management and communication. Earth Sci. Inform. 2019, 12, 541–551. [Google Scholar] [CrossRef]
  12. Sermet, Y.; Demir, I. Flood action VR: A virtual reality framework for disaster awareness and emergency response training. In Proceedings of the ACM SIGGRAPH 2019 Posters, Los Angeles, CA, USA, 28 July–1 August 2019; pp. 1–2. [Google Scholar]
  13. Xiang, Z.; Demir, I. Distributed long-term hourly streamflow predictions using deep learning–A case study for State of Iowa. Environ. Model. Softw. 2020, 131, 104761. [Google Scholar] [CrossRef]
  14. Dettinger, M. Climate change, atmospheric rivers, and floods in California—A multimodel analysis of storm frequency and magnitude changes. JAWRA J. Am. Water Resour. Assoc. 2011, 47, 514–523. [Google Scholar] [CrossRef]
  15. Gaál, L.; Szolgay, J.; Kohnová, S.; Parajka, J.; Merz, R.; Viglione, A.; Blöschl, G. Flood timescales: Understanding the interplay of climate and catchment processes through comparative hydrology. Water Resour. Res. 2012, 48, W04511. [Google Scholar] [CrossRef]
  16. Di Baldassarre, G.; Uhlenbrook, S. Is the current flood of data enough? A treatise on research needs for the improvement of flood modelling. Hydrol. Process. 2012, 26, 153–158. [Google Scholar] [CrossRef]
  17. Sermet, Y.; Villanueva, P.; Sit, M.A.; Demir, I. Crowdsourced approaches for stage measurements at ungauged locations using smartphones. Hydrol. Sci. J. 2020, 65, 813–822. [Google Scholar] [CrossRef]
  18. Seo, B.C.; Keem, M.; Hammond, R.; Demir, I.; Krajewski, W.F. A pilot infrastructure for searching rainfall metadata and generating rainfall product using the big data of NEXRAD. Environ. Model. Softw. 2019, 117, 69–75. [Google Scholar] [CrossRef]
  19. Ebert-Uphoff, I.; Thompson, D.R.; Demir, I.; Gel, Y.R.; Karpatne, A.; Guereque, M.; Kumar, V.; Cabral-Cano, E.; Smyth, P. A vision for the development of benchmarks to bridge geoscience and data science. In Proceedings of the 17th International Workshop on Climate Informatics, Boulder, CO, USA, 20–22 September 2017. [Google Scholar]
  20. Teng, J.; Jakeman, A.J.; Vaze, J.; Croke, B.F.; Dutta, D.; Kim, S. Flood inundation modelling: A review of methods, recent advances and uncertainty analysis. Environ. Model. Softw. 2017, 90, 201–216. [Google Scholar] [CrossRef]
  21. Sit, M.; Demiray, B.Z.; Xiang, Z.; Ewing, G.J.; Sermet, Y.; Demir, I. A comprehensive review of deep learning applications in hydrology and water resources. Water Sci. Technol. 2020, 82, 2635–2670. [Google Scholar] [CrossRef]
  22. Esfandiari, M.; Abdi, G.; Jabari, S.; McGrath, H.; Coleman, D. Flood Hazard Risk Mapping Using a Pseudo Supervised Random Forest. Remote Sens. 2020, 12, 3206. [Google Scholar] [CrossRef]
  23. Priestnall, G.; Jaafar, J.; Duncan, A. Extracting urban features from LiDAR digital surface models. Comput. Environ. Urban Syst. 2000, 24, 65–78. [Google Scholar] [CrossRef]
  24. Sinha, S.; Sotiropoulos, F.; Odgaard, A. Three-dimensional numerical model for flow through natural rivers. J. Hydraul. Eng. 1998, 124, 13–24. [Google Scholar] [CrossRef]
  25. McGrath, H.; Bourgon, J.F.; Proulx-Bourque, J.S.; Nastev, M.; El Ezz, A.A. A comparison of simplified conceptual models for rapid web-based flood inundation mapping. Nat. Hazards 2018, 93, 905–920. [Google Scholar] [CrossRef]
  26. Barthélémy, S.; Ricci, S.; Rochoux, M.C.; Le Pape, E.; Thual, O. Ensemble-based data assimilation for operational flood forecasting–On the merits of state estimation for 1D hydrodynamic forecasting through the example of the “Adour Maritime” river. J. Hydrol. 2017, 552, 210–224. [Google Scholar] [CrossRef]
  27. Schumann, G.; Bates, P.D.; Apel, H.; Aronica, G.T. Global flood hazard mapping, modeling, and forecasting: Challenges and perspectives. In Global Flood Hazard: Applications in Modeling, Mapping, and Forecasting; John Wiley & Sons: Hoboken, NJ, USA, 2018; pp. 239–244. [Google Scholar]
  28. Wu, W.; Rodi, W.; Wenka, T. 3D numerical modeling of flow and sediment transport in open channels. J. Hydraul. Eng. ASCE 2000, 126, 4–15. [Google Scholar] [CrossRef]
  29. Afshari, S.; Tavakoly, A.A.; Rajib, M.A.; Zheng, X.; Follum, M.L.; Omranian, E.; Fekete, B.M. Comparison of new generation low-complexity flood inundation mapping tools with a hydrodynamic model. J. Hydrol. 2018, 556, 539–556. [Google Scholar] [CrossRef]
  30. Gallant, J.C.; Dowling, T.I. A multiresolution index of valley bottom flatness for mapping depositional areas. Water Resour. Res. 2003, 39, 1347. [Google Scholar] [CrossRef]
  31. Renno, C.D.; Nobre, A.D.; Cuartas, L.A.; Soares, J.V.; Hodnett, M.; Tomasella, J.; Saleska, S. HAND, a new terrain descriptor using SRTM-DEM: Mapping terra-firme rainforest environments in Amazonia. Remote Sens. Environ. 2008, 112, 3469–3481. [Google Scholar] [CrossRef]
  32. Nobre, A.D.; Cuartas, L.A.; Hodnett, M.; Renno, C.D.; Rodrigues, G.; Silveira, A.; Waterloo, M.; Saleska, S. Height above the nearest drainage—A hydrologically relevant new terrain model. J. Hydrol. 2011, 404, 13–29. [Google Scholar] [CrossRef] [Green Version]
  33. Nobre, A.D.; Cuartas, L.A.; Momo, M.R.; Severo, D.L.; Pinheiro, A.; Nobre, C.A. HAND contour: A new proxy predictor of inundation extent. Hydrol. Process. 2016, 30, 320–333. [Google Scholar] [CrossRef]
  34. Li, Z.; Mount, J.; Demir, I. Model Parameter Evaluation and Improvement for Real-Time Flood Inundation Mapping Using HAND Model: Iowa Case Study. EarthArxiv 2020. [Google Scholar] [CrossRef]
  35. Xu, H.; Demir, I.; Koylu, C.; Muste, M. A web-based geovisual analytics platform for identifying potential contributors to culvert sedimentation. Sci. Total Environ. 2019, 692, 806–817. [Google Scholar] [CrossRef]
  36. Sit, M.; Langel, R.J.; Thompson, D.; Cwiertny, D.M.; Demir, I. Web-based data analytics framework for well forecasting and groundwater quality. Sci. Total Environ. 2020, 761, 144121. [Google Scholar] [CrossRef] [PubMed]
  37. Agliamzanov, R.; Sit, M.; Demir, I. Hydrology@ Home: A distributed volunteer computing framework for hydrological research and applications. J. Hydroinform. 2020, 22, 235–248. [Google Scholar] [CrossRef]
  38. Sit, M.; Sermet, Y.; Demir, I. Optimized watershed delineation library for server-side and client-side web applications. Open Geospat. Data Softw. Stand. 2019, 4, 1–10. [Google Scholar] [CrossRef] [Green Version]
  39. Haas, A.; Rossberg, A.; Schuff, D.L.; Titzer, B.L.; Holman, M.; Gohman, D.; Wagner, L.; Zakai, A.; Bastien, J.F. Bringing the web up to speed with WebAssembly. In Proceedings of the 38th ACM SIGPLAN Conference on Programming Language Design and Implementation, Barcelona, Spain, 18–23 July 2017; ACM: New York, NY, USA, 2017. [Google Scholar]
  40. Sermet, Y.; Demir, I.; Muste, M. A serious gaming framework for decision support on hydrological hazards. Sci. Total Environ. 2020, 728, 138895. [Google Scholar] [CrossRef] [PubMed] [Green Version]
  41. Xu, H.; Windsor, M.; Muste, M.; Demir, I. A web-based decision support system for collaborative mitigation of multiple water-related hazards using serious gaming. J. Environ. Manag. 2020, 255, 109887. [Google Scholar] [CrossRef] [PubMed]
  42. Rebolho, C.; Andréassian, V.; Moine, N.L. Inundation mapping based on reach-scale effective geometry. Hydrol. Earth Syst. Sci. 2018, 22, 5967–5985. [Google Scholar] [CrossRef] [Green Version]
  43. Barnes, R.; Lehman, C.; Mulla, D. Priority-flood: An optimal depression-filling and watershed-labeling algorithm for digital elevation models. Comput. Geosci. 2013, 62, 117–127. [Google Scholar] [CrossRef] [Green Version]
  44. Barnes, R.; Lehman, C.; Mulla, D. An efficient assignment of drainage direction over flat surfaces in raster digital elevation models. Comput. Geosci. 2013, 62, 128–135. [Google Scholar] [CrossRef] [Green Version]
  45. Gilles, D.; Young, N.; Schroeder, H.; Piotrowski, J.; Chang, Y.J. Inundation mapping initiatives of the Iowa Flood Center: Statewide coverage and detailed urban flooding analysis. Water 2012, 4, 85–106. [Google Scholar] [CrossRef]
  46. Abrams, M.; Crippen, R.; Fujisada, H. ASTER Global Digital Elevation Model (GDEM) and ASTER Global Water Body Dataset (ASTWBD). Remote Sens. 2020, 12, 1156. [Google Scholar] [CrossRef] [Green Version]
Figure 1. Architecture and components of the real-time web-based height above nearest drainage (HAND) mapping system.
Hydrology 08 00065 g001
Figure 2. Steps of HAND algorithm procedure to generate flood maps (adapted from [42]).
Hydrology 08 00065 g002
Figure 3. FEMA-approved flood maps for Cedar Rapids (left) and Ames (right), Iowa by the Iowa Flood Center (IFC).
Hydrology 08 00065 g003
Figure 4. Maps generated for Ames, Iowa using basic flood-fill (left) and HAND model (right).
Hydrology 08 00065 g004
Figure 5. Maps generated for Cedar Rapids, Iowa before (left) and after (right) mitigation using levees.
Hydrology 08 00065 g005
Figure 6. Maps generated for Cedar Rapids, Iowa with HAND model using 10 m, 25 m, and 50 m (left to right).
Hydrology 08 00065 g006
Table 1. Sensitivity of model parameters (HAND threshold, drainage threshold) on the resulting flood extent (absolute threshold 220 ft).
HAND Threshold
Drainage
Threshold
2346
100 k cells Hydrology 08 00065 i001 Hydrology 08 00065 i002 Hydrology 08 00065 i003 Hydrology 08 00065 i004
500 k cells Hydrology 08 00065 i005 Hydrology 08 00065 i006 Hydrology 08 00065 i007 Hydrology 08 00065 i008
1 m cells Hydrology 08 00065 i009 Hydrology 08 00065 i010 Hydrology 08 00065 i011 Hydrology 08 00065 i012
2 m cells Hydrology 08 00065 i013 Hydrology 08 00065 i014 Hydrology 08 00065 i015 Hydrology 08 00065 i016
Table 2. Sensitivity of model parameters (HAND threshold and drainage threshold) on the resulting flood extent (absolute threshold 225 ft).
HAND Threshold
Drainage
Threshold
2346
100 k cells Hydrology 08 00065 i017 Hydrology 08 00065 i018 Hydrology 08 00065 i019 Hydrology 08 00065 i020
500 k cells Hydrology 08 00065 i021 Hydrology 08 00065 i022 Hydrology 08 00065 i023 Hydrology 08 00065 i024
1 m cells Hydrology 08 00065 i025 Hydrology 08 00065 i026 Hydrology 08 00065 i027 Hydrology 08 00065 i028
2 m cells Hydrology 08 00065 i029 Hydrology 08 00065 i030 Hydrology 08 00065 i031 Hydrology 08 00065 i032
Table 3. Computing time for generating flood extent in different scales and resolutions.
ScaleDEM ResolutionRegionGrid CellsComputing Time
City1–5 m1–225 sq km1–9 million0.25–2.25 s
County5–10 m225–1600 sq km9–16 million2.25–4.00 s
State25–100 m10,000–250,000 sq km16–25 million4.00–6.25 s
Publisher’s Note: MDPI stays neutral with regard to jurisdictional claims in published maps and institutional affiliations.

