
Purpose-Designed Hydrogeological Maps for Wide Interconnected Surface–Groundwater Systems: The Test Example of Parma Alluvial Aquifer and Taro River Basin (Northern Italy)

Abstract
:1. Introduction
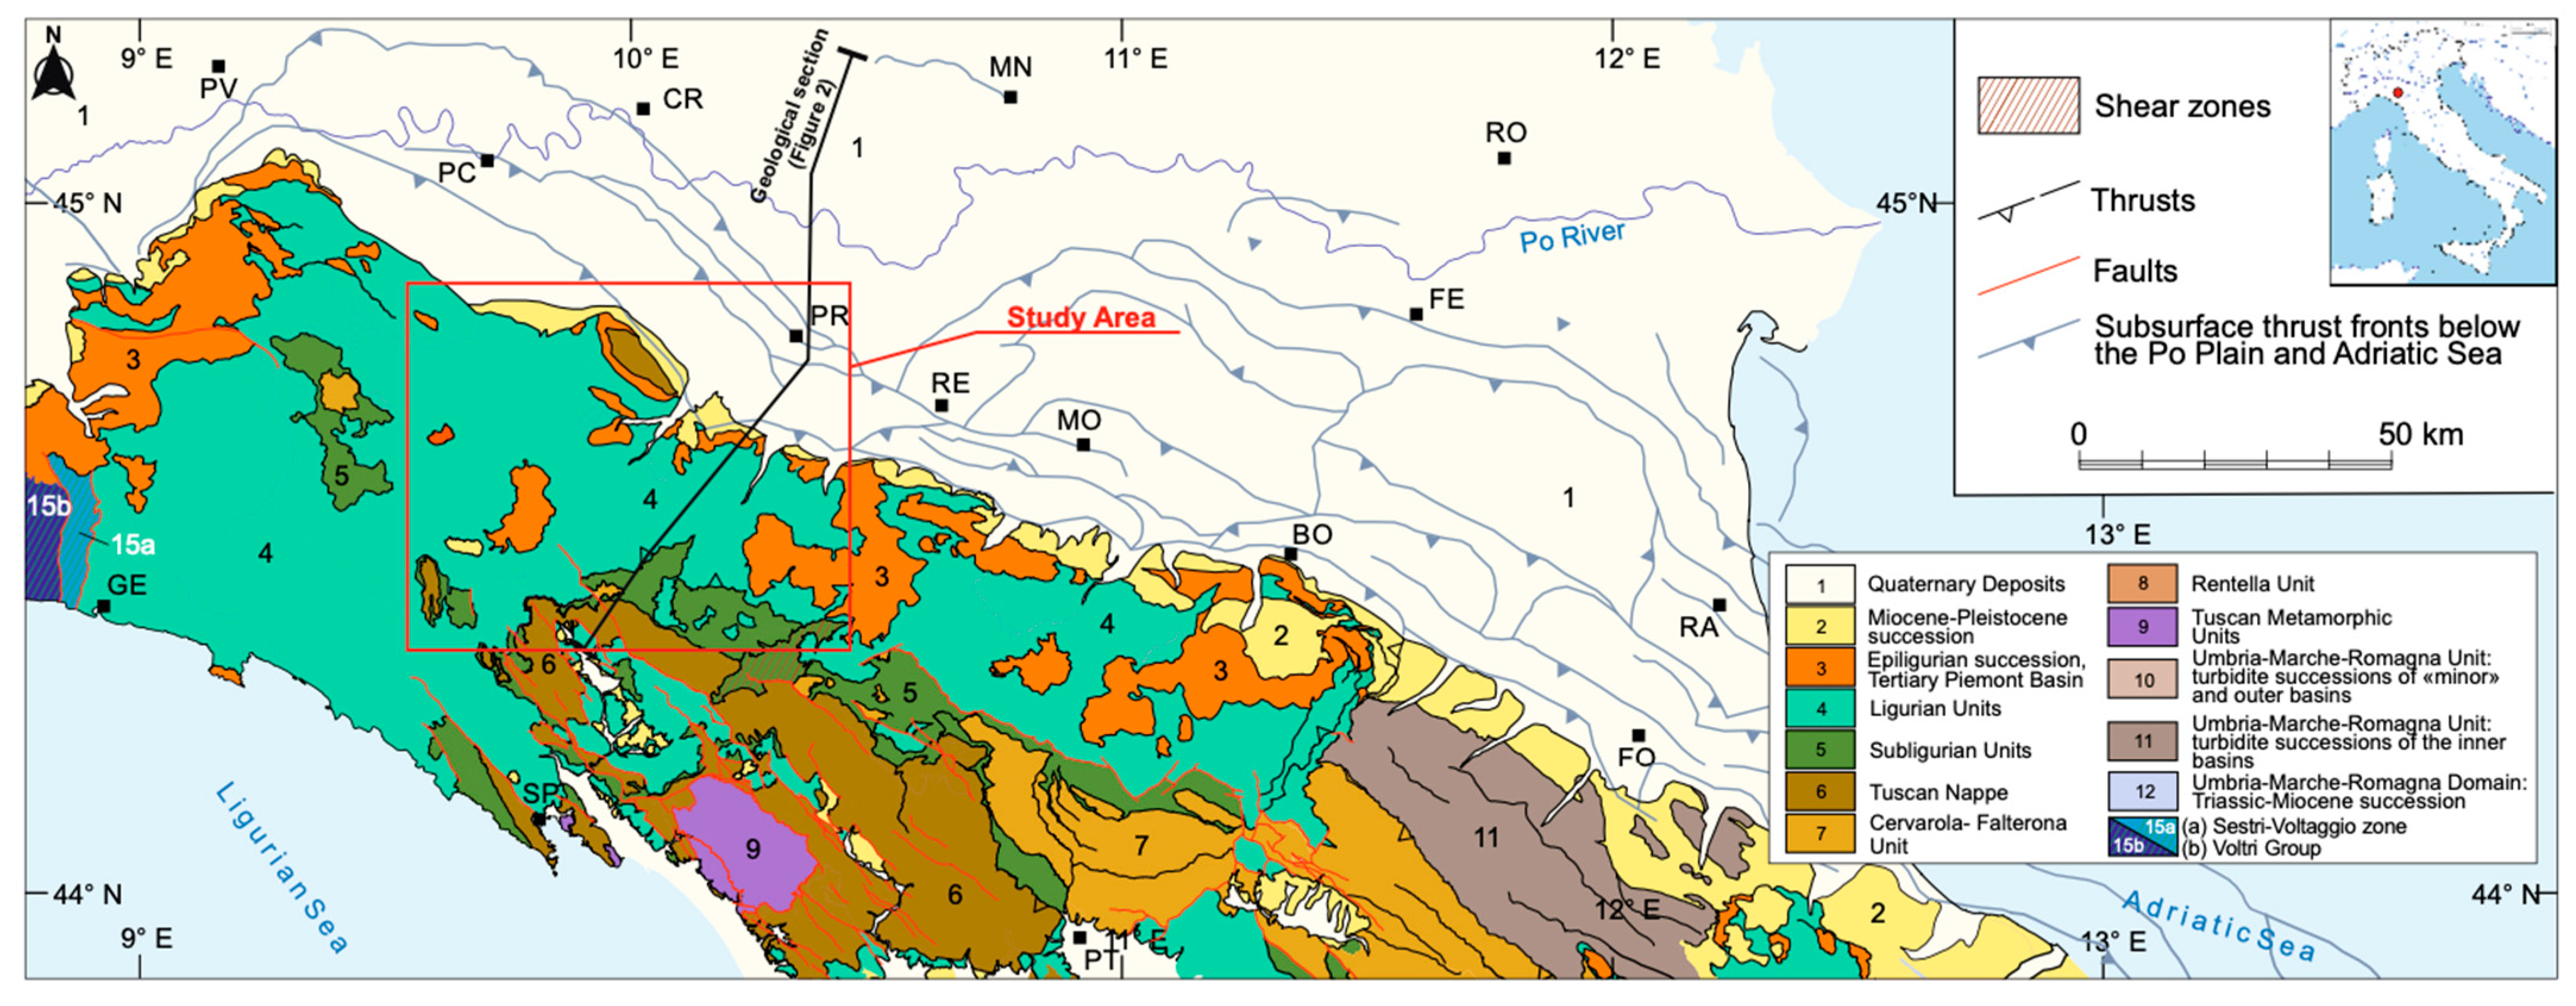
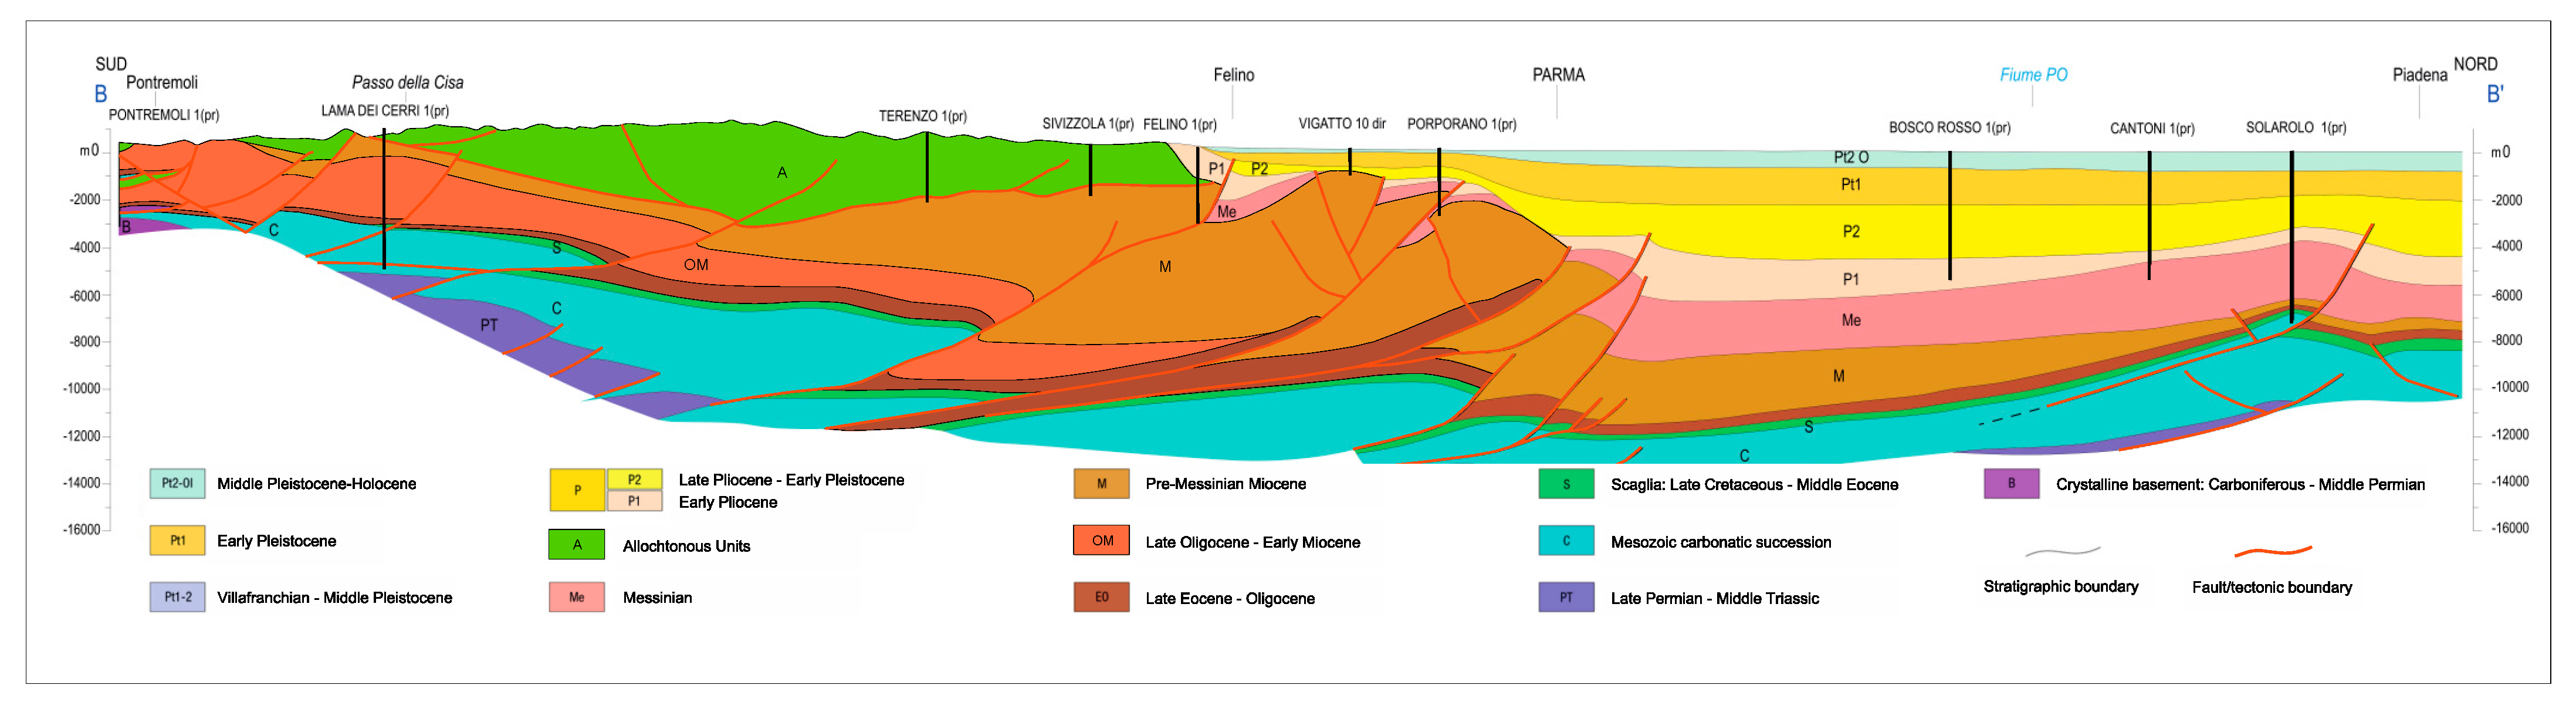
2. Study Area

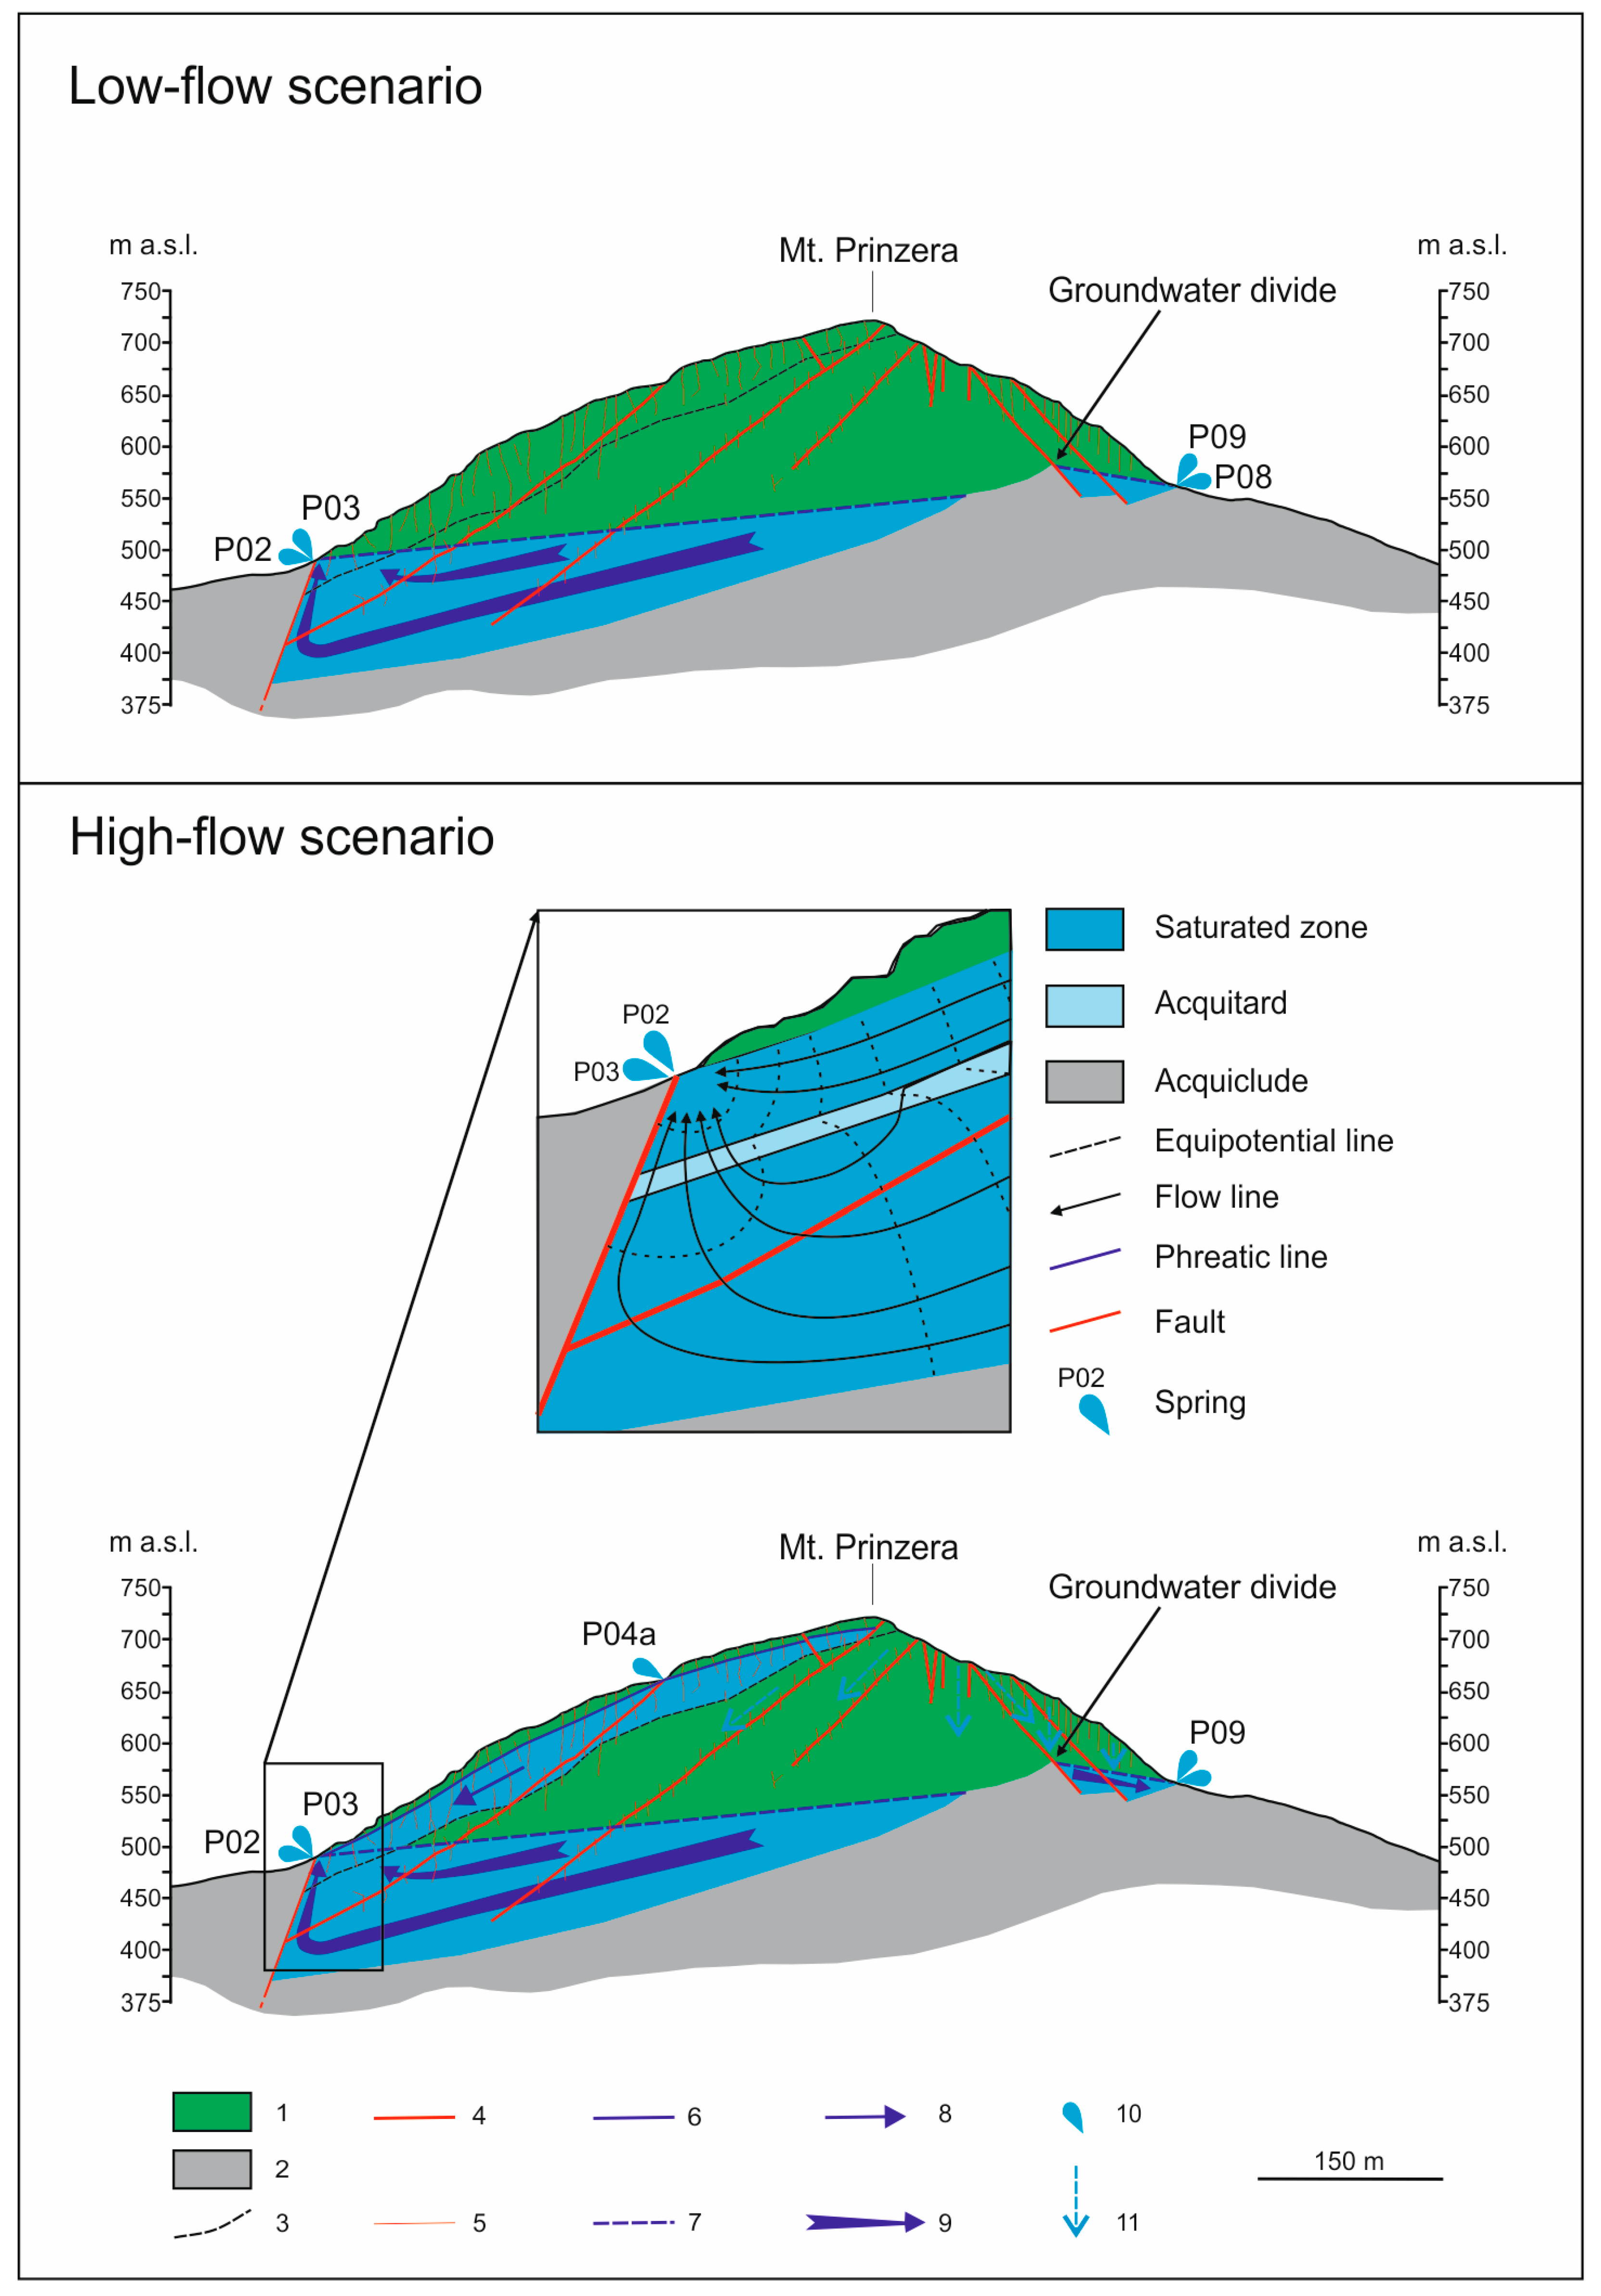
3. Hydrogeological Subsystems
4. Materials and Methods
5. Discussion
6. Conclusions
Supplementary Materials
Author Contributions
Funding
Data Availability Statement
Acknowledgments
Conflicts of Interest
References
- Freeze, R.A.; Cherry, J.A. Groundwater; Prentice Hall Inc.: Englewood Cliffs, NJ, USA, 1979. [Google Scholar]
- Stuckmeier, W.F.; Margat, J. Hydrogeological Maps. A Guide and a Standard Legend; International Association of Hydrogeoiogist, Contributions to Hydrogeology, Cerlag Heinz Heisse: Hannover, Germany, 1995; Volume 17, 170p. [Google Scholar]
- Iacumin, P.; Venturelli, G.; Selmo, E. Isotopic features of rivers and groundwater of the Parma Province (Northern Italy) and their relationships with precipitation. J. Geochem. Explor. 2009, 102, 56–62. [Google Scholar] [CrossRef]
- Mancini, M.C.; Arfini, F.; Guareschi, M. When Higher Education Meets Sustainable Development of Rural Areas: Lessons Learned from a Community–University Partnership. Soc. Sci. 2022, 11, 338. [Google Scholar] [CrossRef]
- Arfini, F.; Cozzi, E.; Mancini, M.C.; Ferrer-Perez, H.; Gil, J.M. Are Geographical Indication Products Fostering Public Goods? Some Evidence from Europe. Sustainability 2019, 11, 272. [Google Scholar] [CrossRef] [Green Version]
- Mancini, M.C.; Donati, M. Local Agri-Food Systems in a Global World: Market, Social and Environmental Challenges; Cambridge Scholars Publishing: Cambridge, UK, 2012. [Google Scholar]
- Mancini, M.C.; Consiglieri, C. Innovation and marketing strategies for PDO products: The case of “Parmigiano Reggiano” as an ingredient. Bio-Based Appl. Econ. J. 2016, 5, 153–174. [Google Scholar]
- Parma Manifactures Associations. Parma and Its Enterprises. 2020. Available online: www.upi.pr.it (accessed on 1 January 2023).
- Conti, P.; Cornamusini, G.; Carmignani, L. An outline of the geology of the Northern Apennines (Italy), with geological map at 1:250,000 scale. Ital. J. Geosci. 2020, 139, 149–194. [Google Scholar] [CrossRef]
- Elter, P.; Grasso, M.; Parotto, M.; Vezzani, L. Structural setting of the Apennine-Maghrebian thrust belt. Epis. J. Int. Geosci. 2003, 26, 205–211. [Google Scholar] [CrossRef]
- Remitti, F.; Vannucchi, P.; Bettelli, G.; Fantoni, L.; Panini, F.; Vescovi, P. Tectonic and sedimentary evolution of the frontal part of an ancient subduction complex at the transition from accretion to erosion: The case of the Ligurian wedge of the northern Apennines, Italy. GSA Bull. 2011, 123, 51–70. [Google Scholar] [CrossRef]
- Carlini, M.; Artoni, A.; Vescovi, P.; Bernini, M.; Remitti, F.; Bettelli, G.; Vannucchi, P.; Aldega, L.; Balestrieri, M.L.; Corrado, S.; et al. Tectonic and erosional exhumation processes in the western Northern Apennines of Italy: Coeval compressional and extensional tectonics affecting an eroding orogenic wedge. In Proceedings of the EGU General Assembly Conference, Vienna, Austria, 7–12 April 2013; p. 12994. [Google Scholar]
- Molli, G.; Crispini, L.; Malusà, M.; Mosca, P.; Piana, F.; Federico, L. Geology of the Western Alps-Northern Apennine junction area: A regional review. Eds Marco Beltrando Angelo Peccerillo Massimo Mattei Sandro Conticelli Carlo Doglioni J. Virtual Explor. 2010, 36, 1–49. [Google Scholar] [CrossRef]
- Vescovi, P. Note Illustrative Della Carta Geologica d'Italia Alla Scala 1:50.000, Foglio 216 “Borgo Val Di Taro”; Servizio Geologico d'Italia-Regione Emilia Romagna; SELCA: Firenze, Italy, 2002. [Google Scholar]
- Boccaletti, M.; Corti, G.; Martelli, L. Recent and active tectonics of the external zone of the Northern Apennines (Italy). Int. J. Earth Sci. 2011, 100, 1331–1348. [Google Scholar] [CrossRef]
- Marroni, M.; Molli, G.; Montanini, A.; Tribuzio, R. The association of continental crust rocks with ophiolites (northern Apen-nines, Italy): Implications for the continent-ocean transition. Tectonophysics 1998, 292, 43–66. [Google Scholar] [CrossRef]
- Marroni, M.; Molli, G.; Montanini, A.; Ottria, G.; Pandolfi, L.; Tribuzio, R. The External Liguride units (Northern Apennine, Italy): From rifting to convergence history of a fossil ocean-continent transition zone. Ofioliti 2002, 27, 119–132. [Google Scholar]
- Vescovi, P.; Fornaciari, E.; Rio, D.; Valloni, R. The basal complex stratigraphy of the Helminthoid Monte Cassio Flysch: A key to the eoalpine tectonics of the Northern Apennines. Riv. Ital. Di Paleontol. E Stratigr. (Res. Paleontol. Stratigr.) 1999, 105, 101–128. [Google Scholar]
- Marroni, M.; Meneghini, F.; Pandolfi, L. A revised subduction inception model to explain the Late Cretaceous, double-vergent orogen in the precollisional western Tethys: Evidence from the Northern Apennines. Tectonics 2017, 36, 2227–2249. [Google Scholar] [CrossRef]
- Amorosi, A.; Ricci Lucchi, F.; Tateo, F. The Lower Miocene siliceous zone: A marker in the palaeogeographic evolution of the northern Apennines. Palaeogeogr. Palaeoclimatol. Palaeoecol. 1995, 118, 131–149. [Google Scholar] [CrossRef]
- Piazza, A.; Artoni, A.; Ogata, K. The Epiligurian wedge-top succession in the Enza Valley (Northern Apennines): Evidence of a syn-depositional transpressive system. Swiss J. Geosci. 2016, 109, 17–36. [Google Scholar] [CrossRef]
- Fantoni, R.; Franciosi, R. Tectono-sedimentary setting of the Po Plain and Adriatic foreland. Rend. Lincei 2010, 21, 197–209. [Google Scholar] [CrossRef]
- Livani, M.; Scrocca, D.; Arecco, P.; Doglioni, C. Structural and stratigraphic control on salient and recess development along a thrust belt front: The Northern Apennines (Po Plain, Italy). J. Geophys. Res. Solid Earth 2018, 123, 4360–4387. [Google Scholar] [CrossRef]
- Salvador, A. International Stratigraphic Guide: A Guide to Stratigraphic Classification, Terminology, and Procedure; Geological Society of America: London, UK, 1994. [Google Scholar]
- Tazioli, A.; Cervi, F.; Doveri, M.; Mussi, M.; Deiana, M.; Ronchetti, F. Estimating the isotopic altitude gradient for hydrogeo-logical studies in mountainous areas: Are the low-yield springs suitable? Insights from the northern Apennines of Italy. Water 2019, 11, 1764. [Google Scholar] [CrossRef] [Green Version]
- Ronchetti, F.; Piccinini, L.; Deiana, M.; Ciccarese, G.; Vincenzi, V.; Aguzzoli, A.; Malavasi, G.; Fabbri, P.; Corsini, A. Tracer test to asses flow and transport parameters of an earth slide: The Montecagno landslide case study (Italy). Eng. Geol. 2020, 275, 105749. [Google Scholar] [CrossRef]
- Aguzzoli, A.; Arosio, D.; Mulas, M.; Ciccarese, G.; Benedikt, B.; Gerfried, W.; Ronchetti, F. Multidisciplinary non-invasive in-vestigations to develop a hydrogeological conceptual model supporting slope kinematics at Fontana Cornia landslide, Northern Apennines, Italy. Environ. Earth Sci. 2022, 81, 471. [Google Scholar] [CrossRef]
- Martelli, L.; Calabrese, L.; Ercolessi, G.; Molinari, F.C.; Severi, P.; Bonini, M. The New Seismotectonic Map of the Emilia-Romagna Region and Surrounding Areas. Atti del 36° Congresso del Gruppo Nazionale di Geofisicxa della Terra Solida. Atti. Del. 2017, 36, 14–16. [Google Scholar]
- Segadelli, S.; Vescovi, P.; Ogata, K.; Chelli, A.; Zanini, A.; Boschetti, T.; Petrella, E.; Toscani, L.; Gargini, A.; Celico, F. A con-ceptual hydrogeological model of ophiolitic aquifers (serpentinised peridotite): The test example of Mt. Prinzera (Northern Italy). Hydrol. Process. 2017, 31, 1058–1073. [Google Scholar] [CrossRef]
- Segadelli, S.; Vescovi, P.; Chelli, A.; Petrella, E.; De Nardo, M.T.; Gargini, A.; Celico, F. Hydrogeological mapping of hetero-geneous and multi-layered ophiolitic aquifers (Mountain Prinzera, northern Apennines, Italy). J. Maps 2017, 13, 737–746. [Google Scholar] [CrossRef]
- Segadelli, S.; Filippini, M.; Monti, A.; Celico, F.; Gargini, A. Estimation of recharge in mountain hard-rock aquifers based on discrete spring discharge monitoring during base-flow recession. Hydrogeol. J. 2021, 29, 949–961. [Google Scholar] [CrossRef]
- Caine, J.S.; Evans, J.P.; Forster, C.B. Fault zone architecture and permeability structure. Geology 1996, 24, 1025–1028. [Google Scholar] [CrossRef]
- Bense, V.F.; Gleeson, T.; Loveless, S.E.; Bour, O.; Scibek, J. Fault zone hydrogeology. Earth Sci. Rev. 2013, 127, 171–192. [Google Scholar] [CrossRef]
- Segadelli, S.; Adorni, M.; Carbognani, M.; Celico, F.; Tomaselli, M. Combining biological and hydrogeological approaches: The grass Molinia arundinacea as a possible bioindicator of temporary perched aquifers in ophiolitic systems. Catena 2022, 217, 106448. [Google Scholar] [CrossRef]
- Gargini, A.; Vincenzi, V.; Piccinini, L.; Zuppi, G.M.; Canuti, P. Groundwater flow systems in turbidites of the Northern Ap-ennines (Italy): Natural discharge and high speed railway tunnel drainage. Hydrogeol. J. 2008, 16, 1577. [Google Scholar] [CrossRef]
- Petrella, E.; Celico, F. Heterogeneous aquitard properties in sedimentary successions in the Apennine chain: Case studies in southern Italy. Hydrol. Process. Int. J. 2009, 23, 3365–3371. [Google Scholar] [CrossRef]
- Davis, S.N.; De Wiest, R.J.M. Hydrogeology; John Wiley & Sons: New York, NY, USA, 1966. [Google Scholar]
- Rizzo, P.; Severini, E.; Bucci, A.; Bocchia, F.; Palladino, G.; Riboni, N.; Celico, F. How do turbidite systems behave from the hydrogeological point of view? New insights and open questions coming from an interdisciplinary work in southern Italy. PLoS ONE 2022, 17, e0268252. [Google Scholar] [CrossRef]
- Bonini, M. Interrelations of mud volcanism, fluid venting, and thrust-anticline folding: Examples from the external northern Apennines (Emilia-Romagna, Italy). J. Geophys. Res. Solid Earth 2007, 112, 1–21. [Google Scholar] [CrossRef]
- Deiana, M.; Cervi, F.; Pennisi, M.; Mussi, M.; Bertrand, C.; Tazioli, A.; Ronchetti, F. Chemical and isotopic investigations (δ 18 O, δ 2 H, 3 H, 87 Sr/86 Sr) to define groundwater processes occurring in a deep-seated landslide in flysch. Hydrogeol. J. 2018, 26, 2669–2691. [Google Scholar] [CrossRef]
- Remelli, S.; Petrella, E.; Chelli, A.; Conti, F.D.; Lozano Fondón, C.; Celico, F.; Francese, R.; Menta, C. Hydrodynamic and soil biodiversity characterization in an active landslide. Water 2019, 11, 1882. [Google Scholar] [CrossRef] [Green Version]
- Rizzo, P.; Petrella, E.; Bucci, A.; Salvioli Mariani, E.; Chelli, A.; Sanangelantoni, A.M.; Raimondo, M.; Quagliarini, A.; Celico, F. Studying hydraulic interconnections in low-permeability media by using bacterial communities as natural tracers. Water 2020, 12, 1795. [Google Scholar] [CrossRef]
- Chelli, A.; Francese, R.; Petrella, E.; Carri, A.; Quagliarini, A.; Segalini, A.; Celico, F. A multi-parameter field monitoring system to investigate the dynamics of large earth slides–earth flows in the Northern Apennines, Italy. Eng. Geol. 2020, 275, 105780. [Google Scholar] [CrossRef]
- Petrella, E.; Raimondo, M.; Chelli, A.; Valentino, R.; Severini, E.; Diena, M.; Celico, F. Processes and factors controlling the groundwater flow in a complex landslide: A case study in the Northern Italy. Hydrol. Process. 2023, 37(5), e14891. [Google Scholar] [CrossRef]
- Regione Emilia-Romagna; ENI-AGIP. Riserve Idriche Sotterranee Della Regione Emilia-Romagna. A Cura di G.M. Di Dio; Regione Emilia-Romagna, ENI Agip Divisione Esplorazione e Produzione; SELCA: Firenze, Italy, 1998; p. 120. [Google Scholar]
- Zanini, A.; Petrella, E.; Sanangelantoni, A.M.; Angelo, L.; Ventosi, B.; Viani, L.; Celico, F. Groundwater characterization from an ecological and human perspective: An interdisciplinary approach in the Functional Urban Area of Parma, Italy. Rend. Lincei. Sci. Fis. E Nat. 2019, 30, 93–108. [Google Scholar] [CrossRef]
- Di Dio, G.; Martini, A.; Lasagna, S.; Zanzucchi, G. Explanatory notes of the Geologic Map of Italy at the Scale 1:50,000, Sheet No. 199 Parma Sud-Ovest; Servizio Geologico della Regione Emilia-Romagna, Servizio Geologico Nazionale, ISPRA: Rome, Italy, 2005. [Google Scholar]
- Zanini, A.; Ghirardi, M.; Emiliani, R. A multidisciplinary approach to evaluate the effectiveness of natural attenuation at a contaminated site. Hydrology 2021, 8, 101. [Google Scholar] [CrossRef]
- Severini, E.; Ducci, L.; Sutti, A.; Robottom, S.; Sutti, S.; Celico, F. River–Groundwater Interaction and Recharge Effects on Microplastics Contamination of Groundwater in Confined Alluvial Aquifers. Water 2022, 14, 1913. [Google Scholar] [CrossRef]
- Ducci, L.; Rizzo, P.; Pinardi, R.; Solfrini, A.; Maggiali, A.; Pizzati, M.; Balsamo, F.; Celico, F. What Is the Impact of Leaky Sewers on Groundwater Contamination in Urban Semi-Confined Aquifers? A Test Study Related to Fecal Matter and Personal Care Products (PCPs). Hydrology 2022, 10, 3. [Google Scholar] [CrossRef]
- Rossetti, G.; Pieri, V.; Martens, K. Recent ostracods (Crustacea, Ostracoda) found in lowland springs of the provinces of Pia-cenza and Parma (Northern Italy). Hydrobiologia 2005, 542, 287–296. [Google Scholar] [CrossRef]
- Bonaposta, D.; Segadelli, S.; De Nardo, M.T.; Alessandrini, A.; Pezzoli, S. Le potenzialità geologiche dei dati storici am-bientali: Il caso delle sorgenti e dei fontanili in Emilia-Romagna. Il Geologo dell’Emilia Romagna 2011, 1, 19–34. [Google Scholar]
- Kløve, B.; Ala-Aho, P.; Bertrand, G.; Boukalova, Z.; Ertürk, A.; Goldscheider, N.; Widerlund, A. Groundwater dependent ecosystems. Part I: Hydroecological status and trends. Environ. Sci. Policy 2011, 14, 770–781. [Google Scholar] [CrossRef]
- Song, Y.; Ji, J.; Mao, C.; Yang, Z.; Yuan, X.; Godwin, A.A.; Frost, R.L. Heavy metal contamination in suspended solids of Changjiang river—Environmental implications. Geoderma 2010, 159, 286–295. [Google Scholar] [CrossRef]
- Thorslund, J.; Jarsjö, J.; Chalov, S.R.; Belozerova, E.V. Gold mining impact on riverine heavy metal transport in a sparsely monitored region: The upper Lake Baikal Basin case. J. Environ. Monit. 2012, 14, 2780–2792. [Google Scholar] [CrossRef]
- Hu, B.; Li, J.; Bi, N.; Wang, H.; Yang, J.; Wei, H.; Zhao, J.; Li, G.; Yin, X.; Liu, M.; et al. Seasonal variability and flux of patticulate trace elements from the Yellow River: Impacts of the anthropogenic flood event. Mar. Pollut. Bull. 2015, 91, 35–44. [Google Scholar] [CrossRef]
- Oberholster, P.J.; Botha, A.M.; Hill, L.; Strydom, W.F. River catchment responses to anthropogenic acidification in relationship with sewage effluent: An ecotoxicology screening application. Chemosphere 2017, 189, 407–417. [Google Scholar] [CrossRef]
- Zhou, Q.; Yang, N.; Li, Y.; Ren, B.; Ding, X.; Bian, H.; Yao, X. Total concentration and sources of heavy metal pollution in global river and lake water bodies from 1972 to 2017. Glob. Ecol. Conserv. 2020, 22, e00925. [Google Scholar] [CrossRef]
- Atangana, E.; Oberholster, P.J. Using heavy metal pollution indices to assess water quality of surface and groundwater on catchment levels in South Africa. J. Afr. Earth Sci. 2021, 182, 104254. [Google Scholar] [CrossRef]
- Sui, C.; Fatichi, S.; Burlando, P.; Weber, E.; Battista, G. Modeling distributed metal pollution transport in a mine impacted catchment: Short and long-term effects. Sci. Total Environ. 2022, 812, 151473. [Google Scholar] [CrossRef]
- Owens, P.N.; Petticrew, E.L.; Albers, S.J.; French, T.D.; Granger, B.; Laval, B.; Vagle, S. Annual pulses of copper-enriched sediment in a North American river downstream of a large lake following the catastrophic failure of a mine tailings storage facility. Sci. Total Environ. 2023, 856, 158927. [Google Scholar] [CrossRef] [PubMed]
- Rezaei Kalvani, S.; Celico, F. The Water–Energy–Food Nexus in European Countries: A Review and Future Perspectives. Sustainability 2023, 15, 4960. [Google Scholar] [CrossRef]
- D’Oria, M.; Cozzi, C.; Tanda, M.G. Future precipitation and temperature changes over the Taro, Parma and Enza River Basins in Northern Italy. Ital. J. Eng. Geol. Environ. (Spec. Issue) 2018, 1, 49–63. [Google Scholar]
- Todaro, V.; D’Oria, M.; Secci, D.; Zanini, A.; Tanda, M.G. Climate change over the Mediterranean region: Local temperature and precipitation variations at five pilot sites. Water 2022, 14, 2499. [Google Scholar] [CrossRef]
- Ouyang, Z.; Song, C.; Zheng, H.; Polasky, S.; Xiao, Y.; Bateman, I.J.; Daily, G.C. Using gross ecosystem product (GEP) to value nature in decision making. Proc. Natl. Acad. Sci. USA 2020, 117, 14593–14601. [Google Scholar] [CrossRef] [PubMed]


Disclaimer/Publisher’s Note: The statements, opinions and data contained in all publications are solely those of the individual author(s) and contributor(s) and not of MDPI and/or the editor(s). MDPI and/or the editor(s) disclaim responsibility for any injury to people or property resulting from any ideas, methods, instructions or products referred to in the content. |
© 2023 by the authors. Licensee MDPI, Basel, Switzerland. This article is an open access article distributed under the terms and conditions of the Creative Commons Attribution (CC BY) license (https://creativecommons.org/licenses/by/4.0/).
Share and Cite
Pinardi, R.; Feo, A.; Ruffini, A.; Celico, F. Purpose-Designed Hydrogeological Maps for Wide Interconnected Surface–Groundwater Systems: The Test Example of Parma Alluvial Aquifer and Taro River Basin (Northern Italy). Hydrology 2023, 10, 127. https://doi.org/10.3390/hydrology10060127
Pinardi R, Feo A, Ruffini A, Celico F. Purpose-Designed Hydrogeological Maps for Wide Interconnected Surface–Groundwater Systems: The Test Example of Parma Alluvial Aquifer and Taro River Basin (Northern Italy). Hydrology. 2023; 10(6):127. https://doi.org/10.3390/hydrology10060127
Chicago/Turabian StylePinardi, Riccardo, Alessandra Feo, Andrea Ruffini, and Fulvio Celico. 2023. "Purpose-Designed Hydrogeological Maps for Wide Interconnected Surface–Groundwater Systems: The Test Example of Parma Alluvial Aquifer and Taro River Basin (Northern Italy)" Hydrology 10, no. 6: 127. https://doi.org/10.3390/hydrology10060127