Article

Investigating Multilayer Aquifer Dynamics by Combining Geochemistry, Isotopes and Hydrogeological Context Analysis

1
Englobe, 855 Rue Pépin, Sherbrooke, QC J1L 2P8, Canada
2
Polytechnique Montreal, Department of Civil, Geological and Mining Engineering, C.P. 6079, succ. Centre-Ville, Montreal, QC H3C 3A7, Canada
3
UMR G-EAU, Institut de Recherche pour le Développement, 361 Rue Jean François Breton, 34090 Montpellier, France
4
Geological Survey of Canada, Natural Resources Canada, 490 Rue de la Couronne, Québec, QC G1K 9A9, Canada
5
Nottawasaga Valley Conservation Authority, 8195 8th Line, Utopia, ON L0M 1T0, Canada
6
École de Technologie Supérieure, Département de Génie de la Construction, 1100 R. Notre Dame O, Montréal, QC H3C 1K3, Canada
7
Geotop-UQAM, Chair in Urban Hydrogeology, Department of Earth and Atmospheric Sciences, C.P. 8888, succ. Centre-Ville, Montreal, QC H3C 3P8, Canada
8
Quebec Water Research Centre (CentrEau), Pavillon Adrien-Pouliot, Université Laval, 1065, Avenue de la Médecine, Québec, QC G1V 0A6, Canada
*
Author to whom correspondence should be addressed.
Hydrology 2023, 10(11), 211; https://doi.org/10.3390/hydrology10110211
Submission received: 10 October 2023 / Revised: 4 November 2023 / Accepted: 8 November 2023 / Published: 13 November 2023

Abstract

:
Geochemical tracers have the potential to provide valuable insights for constructing conceptual models of groundwater flow, especially in complex geological contexts. Nevertheless, the reliability of tracer interpretation hinges on its integration into a robust geological framework. In our research, we concentrated on delineating the groundwater flow dynamics in the Innisfil Creek watershed, located in Ontario, Canada. We amalgamated extensive hydrogeological data derived from a comprehensive 3D geological model with the analysis of 61 groundwater samples, encompassing major ions, stable water isotopes, tritium, and radiocarbon. By seamlessly incorporating regional physiographic characteristics, flow pathways, and confinement attributes, we bolstered the efficiency of these tracers, resulting in several notable findings. Firstly, we identified prominent recharge and discharge zones within the watershed. Secondly, we observed the coexistence of relatively shallow and fast-flowing paths with deeper, slower-flowing channels, responsible for transporting groundwater from ancient glacial events. Thirdly, we determined that cation exchange stands as the predominant mechanism governing the geochemical evolution of contemporary water as it migrates toward confined aquifers situated at the base of the Quaternary sequence. Fourthly, we provided evidence of the mixing of modern, low-mineralized water originating from unconfined aquifer units with deep, highly mineralized water within soil–bedrock interface aquifers. These findings not only contribute significantly to the development a conceptual flow model for the sustainable management of groundwater in the Innisfil watershed, but also offer practical insights that hold relevance for analogous geological complexities encountered in other regions.

1. Introduction

In Southern Ontario, Canada, severe droughts have occurred in the past decades, and there is a consensus that their frequency, duration and intensity are likely to increase due to future climate changes [1]. Repeated droughts combined with the increasing economic need for irrigation are of major concern in the Innisfil Creek watershed. To avoid the worsening of the situation, experts recommend the use of groundwater rather than surface water as the sustainable source of water in the watershed [2]. To this end, a broad understanding of groundwater dynamics is needed [3,4]. Aquifer architecture, recharge conditions, flow dynamics and geochemical interactions are crucial parameters needed to understand the long-term evolution of groundwater quality and quantity.
The groundwater characterization process starts with the creation of a preliminary conceptual model for the regional groundwater flow. Exploiting the potential of hydrogeochemistry and isotopes alongside the interpretation of bedrock and Quaternary geology for hydrostratigraphic unit identification can significantly enhance the precision and constraint of input parameter ranges [5,6,7,8,9,10]. The existing knowledge and the newly acquired information are generally stored in appropriate spatial databases and multivariate statistics are applied as an unsupervised method to determine a subsets of hydrogeochemical and isotopes samples with similar properties to minimize the variability of the results [11,12,13]. Recent studies focus on the direct interpretation of collected data for main conservative and/or stable and radioactive isotopic as well as chemical relations to help with understanding the regional and/or local groundwater flow model [14,15,16,17,18,19,20,21,22,23]. Another common approach is to identify the main physical parameters that could eventually impact groundwater geochemical and isotopic composition, such as the aquifer mineralogy, confinement and proximity to an anthropic contamination, and to concentrate on the clarification of eventual differences and mutual relations between distinct water groups [24,25,26].
This paper presents an approach where geochemical and isotopic tracers are supported by hydrogeological contexts provided by a detailed 3D geological framework to define groundwater flow dynamics, including recharge and discharge, hydrologic linkages between hydrostratigraphic units and the chemical evolution of groundwater. It is applied to the complex aquifer system of the Innisfil Creek watershed. Existing hydrogeochemical data are combined with a new sampling survey for a better coverage of the physiographic and hydrogeological sections. The interpretation of analytical results is presented with a few perspectives on future steps. This research looks to establish a predictive framework to anticipate potential shifts in groundwater quantity and quality in the Innisfil watershed. Such insights can enable evidence-based decision making and the development of water resources management strategies to mitigate the escalating impacts of prolongated droughts in the region.

2. Materials and Methods
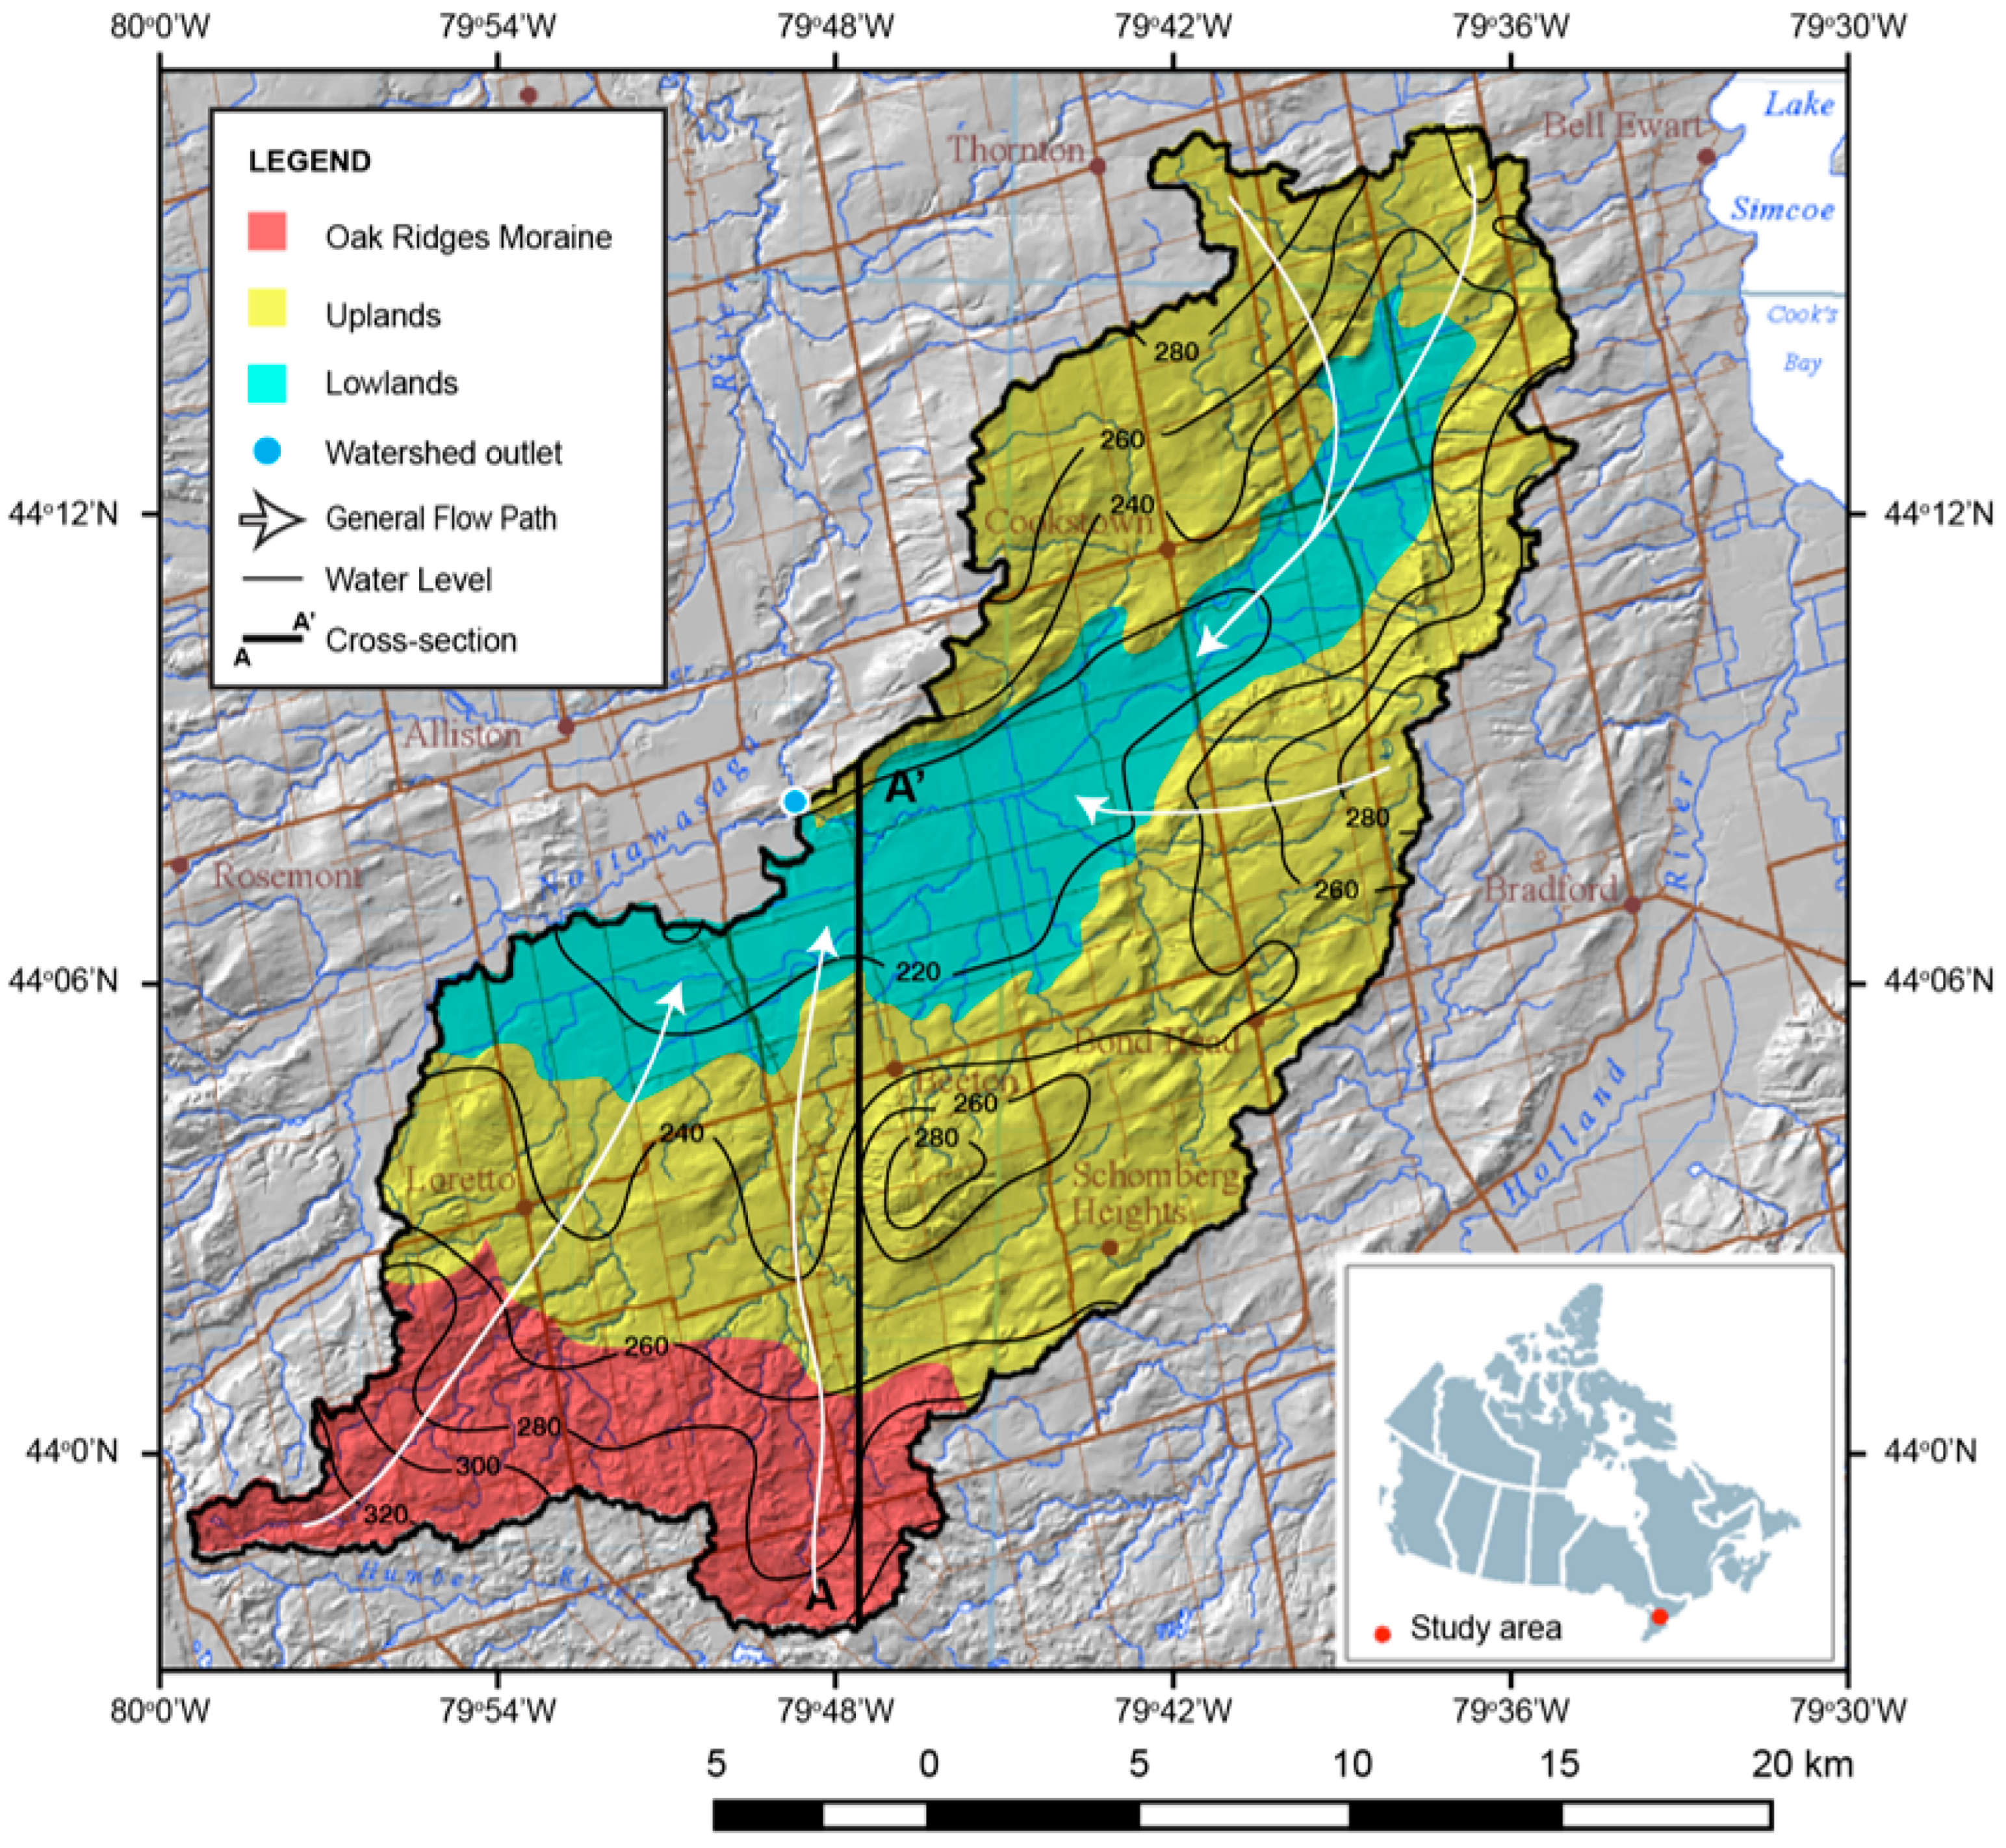
2.1. Study Area

Located approximately 130 km north of Toronto, on the western shore of the Lake Simcoe, Ontario, Canada (Figure 1), the Innisfil Creek watershed covers an area of approximately 490 km2. The climate is characterized by mild winters and warm summers, with an average mean annual temperature of about 7 °C and total mean annual precipitation of 793 mm/year, according to data from the closest meteorological station (Egbert), sourced from Canadian Climate Normals 1991–2020 Data, Environment and Climate Change Canada [27]. The Innisfil Creek takes sources to the north of the watershed and flows southwestwards, where it becomes tributary of the Nottowasaga River. A gauging station is located near Alliston (44°07′52″ N, 79°46′51″ W). Based on historical data from 2000 to 2020 [28], the mean discharge ranges between 8 m3/s in March–April and 0.9 m3/s in August–September. The watershed has mainly rural agricultural coverage with several isolated forested areas. In recent decades, it has undergone major changes including land use and economic activities combined with population growth and increased stresses to water quantity and quality. Recent drought episodes have further aggravated the situation by limiting the capacity of surface water use for irrigation purposes. These shortages have become a problem for the agricultural activities and a major concern for the local conservation authorities. A few studies have been conducted recently with the objective to improve the understanding of the groundwater resource in the watershed and to provide the knowledge needed for informed decision making [29,30,31]. Concerned population and local experts were included in the various planning and elaboration processes, and one of the main output was the suggestion to shift gradually from surface to groundwater as a sustainable alternative for water intake and the protection of aquatic life [32]. However, this suggestion needs to be better supported with the knowledge of the hydrogeological contexts in the watershed since the multi-aquifer system in glacial sediments is still not fully understood.

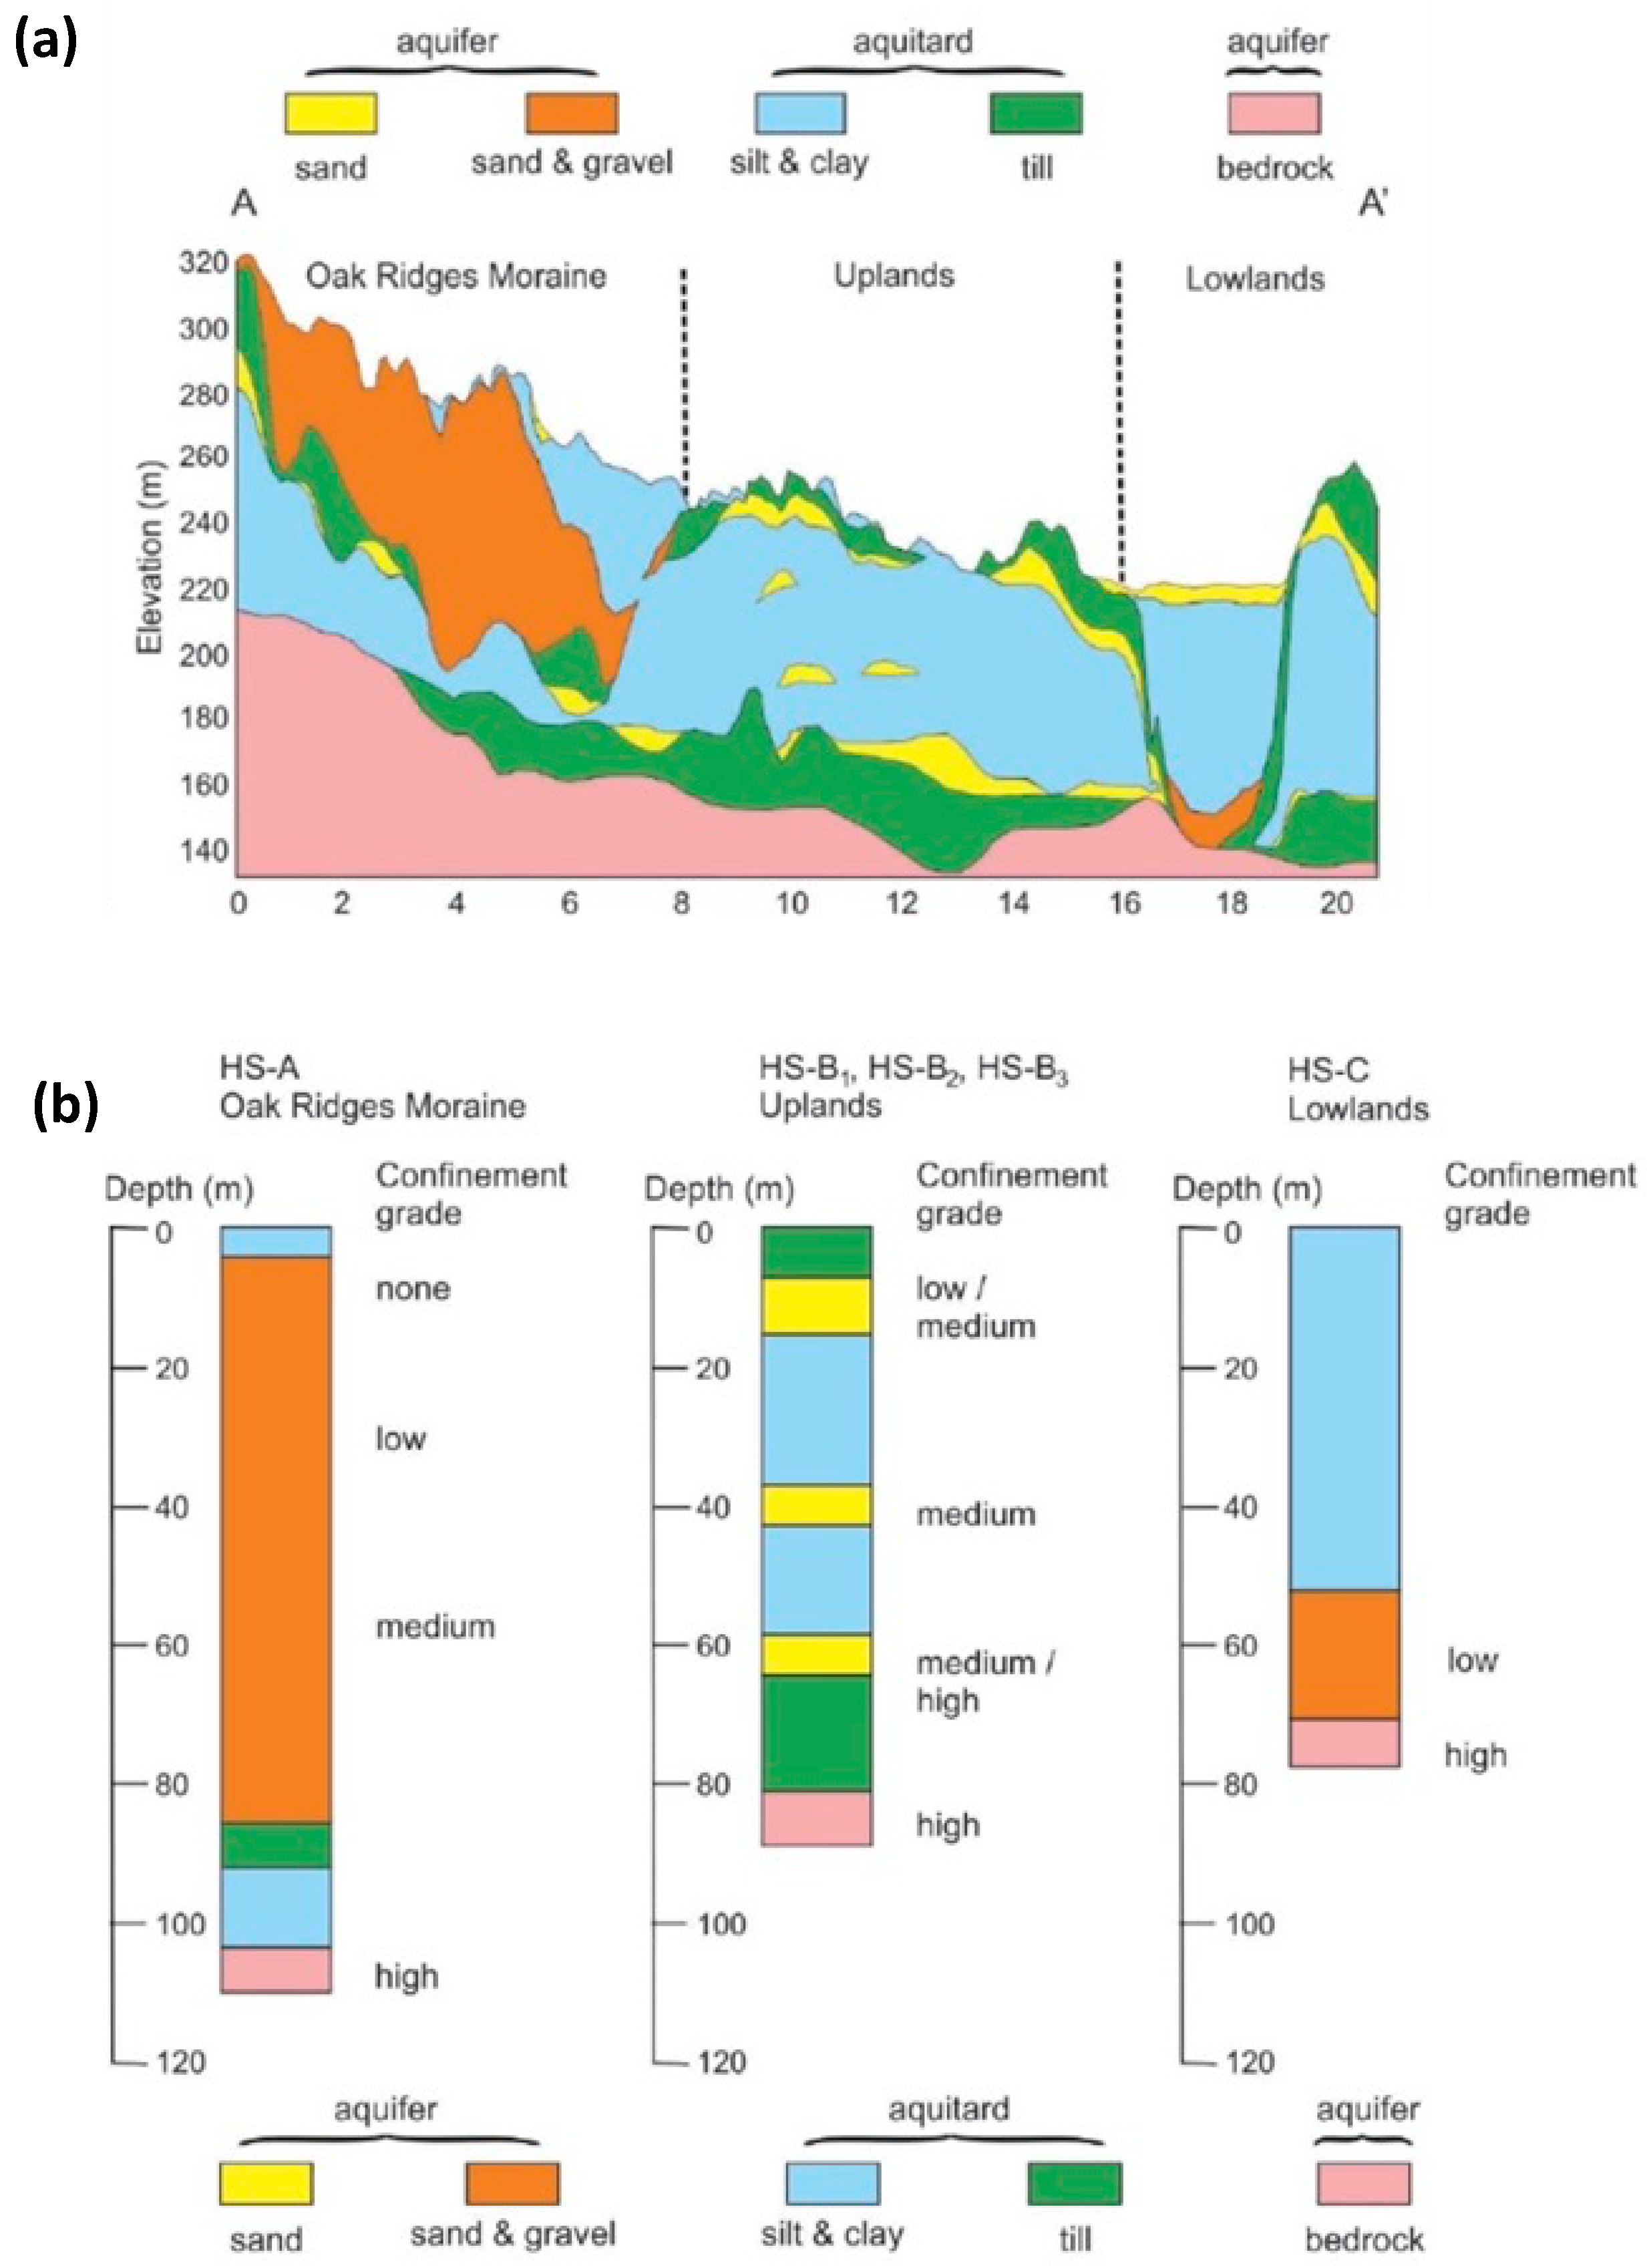
2.2. Hydrostratigraphy

The geology of the area consists of relatively thick Quaternary deposits overlying Ordovician sedimentary bedrock [29]. To determine the distribution of the hydrostratigraphic units (HSU) across the study area, Bajc, Mulligan [33] developed a 3D hydrostratigraphic model. This model confirms the geological complexity caused by the spatial variability of the HSUs. It consists of several of the 15 total distinct HSUs, from which six constitute high permeability aquifer system, whereas the remaining five HSUs represent confining aquitards.
The bedrock consists mainly of limestone, Lindsay Formation, and shale with various proportions of limestone: Blue Mountain, Georgian Bay and Queenston formations. The surficial sediments are mainly of glacial origin and a product of different deposition events resulting in deposits of different granulometry and physical characteristics (e.g., gravel, sand, silt, clay, till). They form both aquifer and aquitard units, which are not continuous but rather feature important vertical and lateral discontinuities. At the base of the hydrostratigraphic sequence are found pre-Middle-Wisconsinian till aquitard (ATG1; codes refer to aquifer (AF) and aquitard (AT) units as described in [25]), aquifer (AFF1) and aquitard (ATE1). The overlying Don–Scarborough–Thorncliffe formation equivalents consist of interbedded aquifers (AFD4, AFD3, AFD2 and AFD1) and aquitards (ATD3, ATD2 and ATD1). Stratified deposits of AFD4 unconformably overlie ATE1, which, in this area, consists of a fine textured diamicton. Newmarket till (ATC1) caps the sedimentary sequence and acts as a regional aquitard. The till is eroded locally and has been traced down into broad valleys interpreted as tunnel valleys [34]. Glaciofluvial sand and gravel aquifer (AFB2) is present at the base of the tunnel channels and is roughly equivalent in age to early Oak Ridges Moraine deposits. AFB2 includes gravelly and sandy sediment at the base and is capped by a sequence of glaciolacustrine silt and clay with subordinate sand (aquitard ATB2). Overlying deposits of sand and gravel (AFB1) complete the stratigraphic sequence. Most of the groundwater wells tap into these coarse sediments which can be very productive. The bedrock interface often reaches depths of up to 150 m, therefore only a few wells extend as deep into the fractured bedrock aquifer.
Such complex HSU (hydrostratigraphic units) system in place makes the watershed a puzzling case with respect to groundwater flow and sustainable exploitation. In order to simplify the understanding of the geology and the complex aquifer system in place, the stratified sediments were grouped into simplified hydrostratigraphic units: aquifers composed of predominantly coarse-grained sediments (sand and gravel), aquitards composed of predominantly fine-grained sediments (silt and clay), till aquitards (a wide range of sediments of various types and sizes) and the fractured bedrock aquifers (Figure 2a).
Three major physiographic zones can also be delimited within the watershed: the Oak Ridges Moraine (ORM) and the Upland and Lowland areas (Figure 1). The ORM is a linear structure that covers a large portion of Southern Ontario with an overall area of about 1900 km2. It outcrops at the south of the Innisfil watershed as a thick fluvioglacial aquifer composed of mainly coarse sand and gravel with high permeability. At the base, the moraine is separated from the fractured aquifer by a low permeability fine silt and clay. This physiographic zone has the highest elevation across the watershed, i.e., more than 280 m ASL, and is expected to represent an important recharge area.
The second physiographic zone is the Upland area, characterized by two to four discontinuous aquifer units in the unconsolidated coarse sediments and the bedrock aquifer (Figure 2). The typical hydrostratigraphic sequence consists of the continuous low permeability Newmarket till on the ground surface, a compact till with a thickness of up to 20 m. It follows the fine sand aquifer unit in the upper part of the Thorncliffe formation. At depth, this formation shifts gradually into fine silt and clay, which are the dominant aquitard material in the area. Occasionally, lenses of permeable coarse sand (aquifer unit) are found at depth, embedded in the fine matrix. At the base of the Thorncliffe formation, fine sands make up another productive aquifer unit. The lowermost portion of the Quaternary sequence is occupied by a thick silt and clay aquitard that overlies the bedrock aquifer at an average depth of about 100 m.
The Lowlands represent the third major physiographic zone, which actually represents a relatively wide elongated valley in the central part of the watershed (Figure 1). The hydrogeological setting consists of two aquifer units in the coarse sediments and the bedrock aquifer at the base. Aquifer units are alternated with intermediate aquitards. The surficial aquifer is found in a relatively shallow fine sandy layer with a maximum depth of about 10 m. The next permeable unit at depth is the coarse sand and gravel aquifer confined by about 50 m thick glaciolacustrine silt and clay materials. The lowermost fractured aquifer is occasionally in direct contact with the juxtaposed granular aquifer, but most often, these two units are separated by low permeability tills.

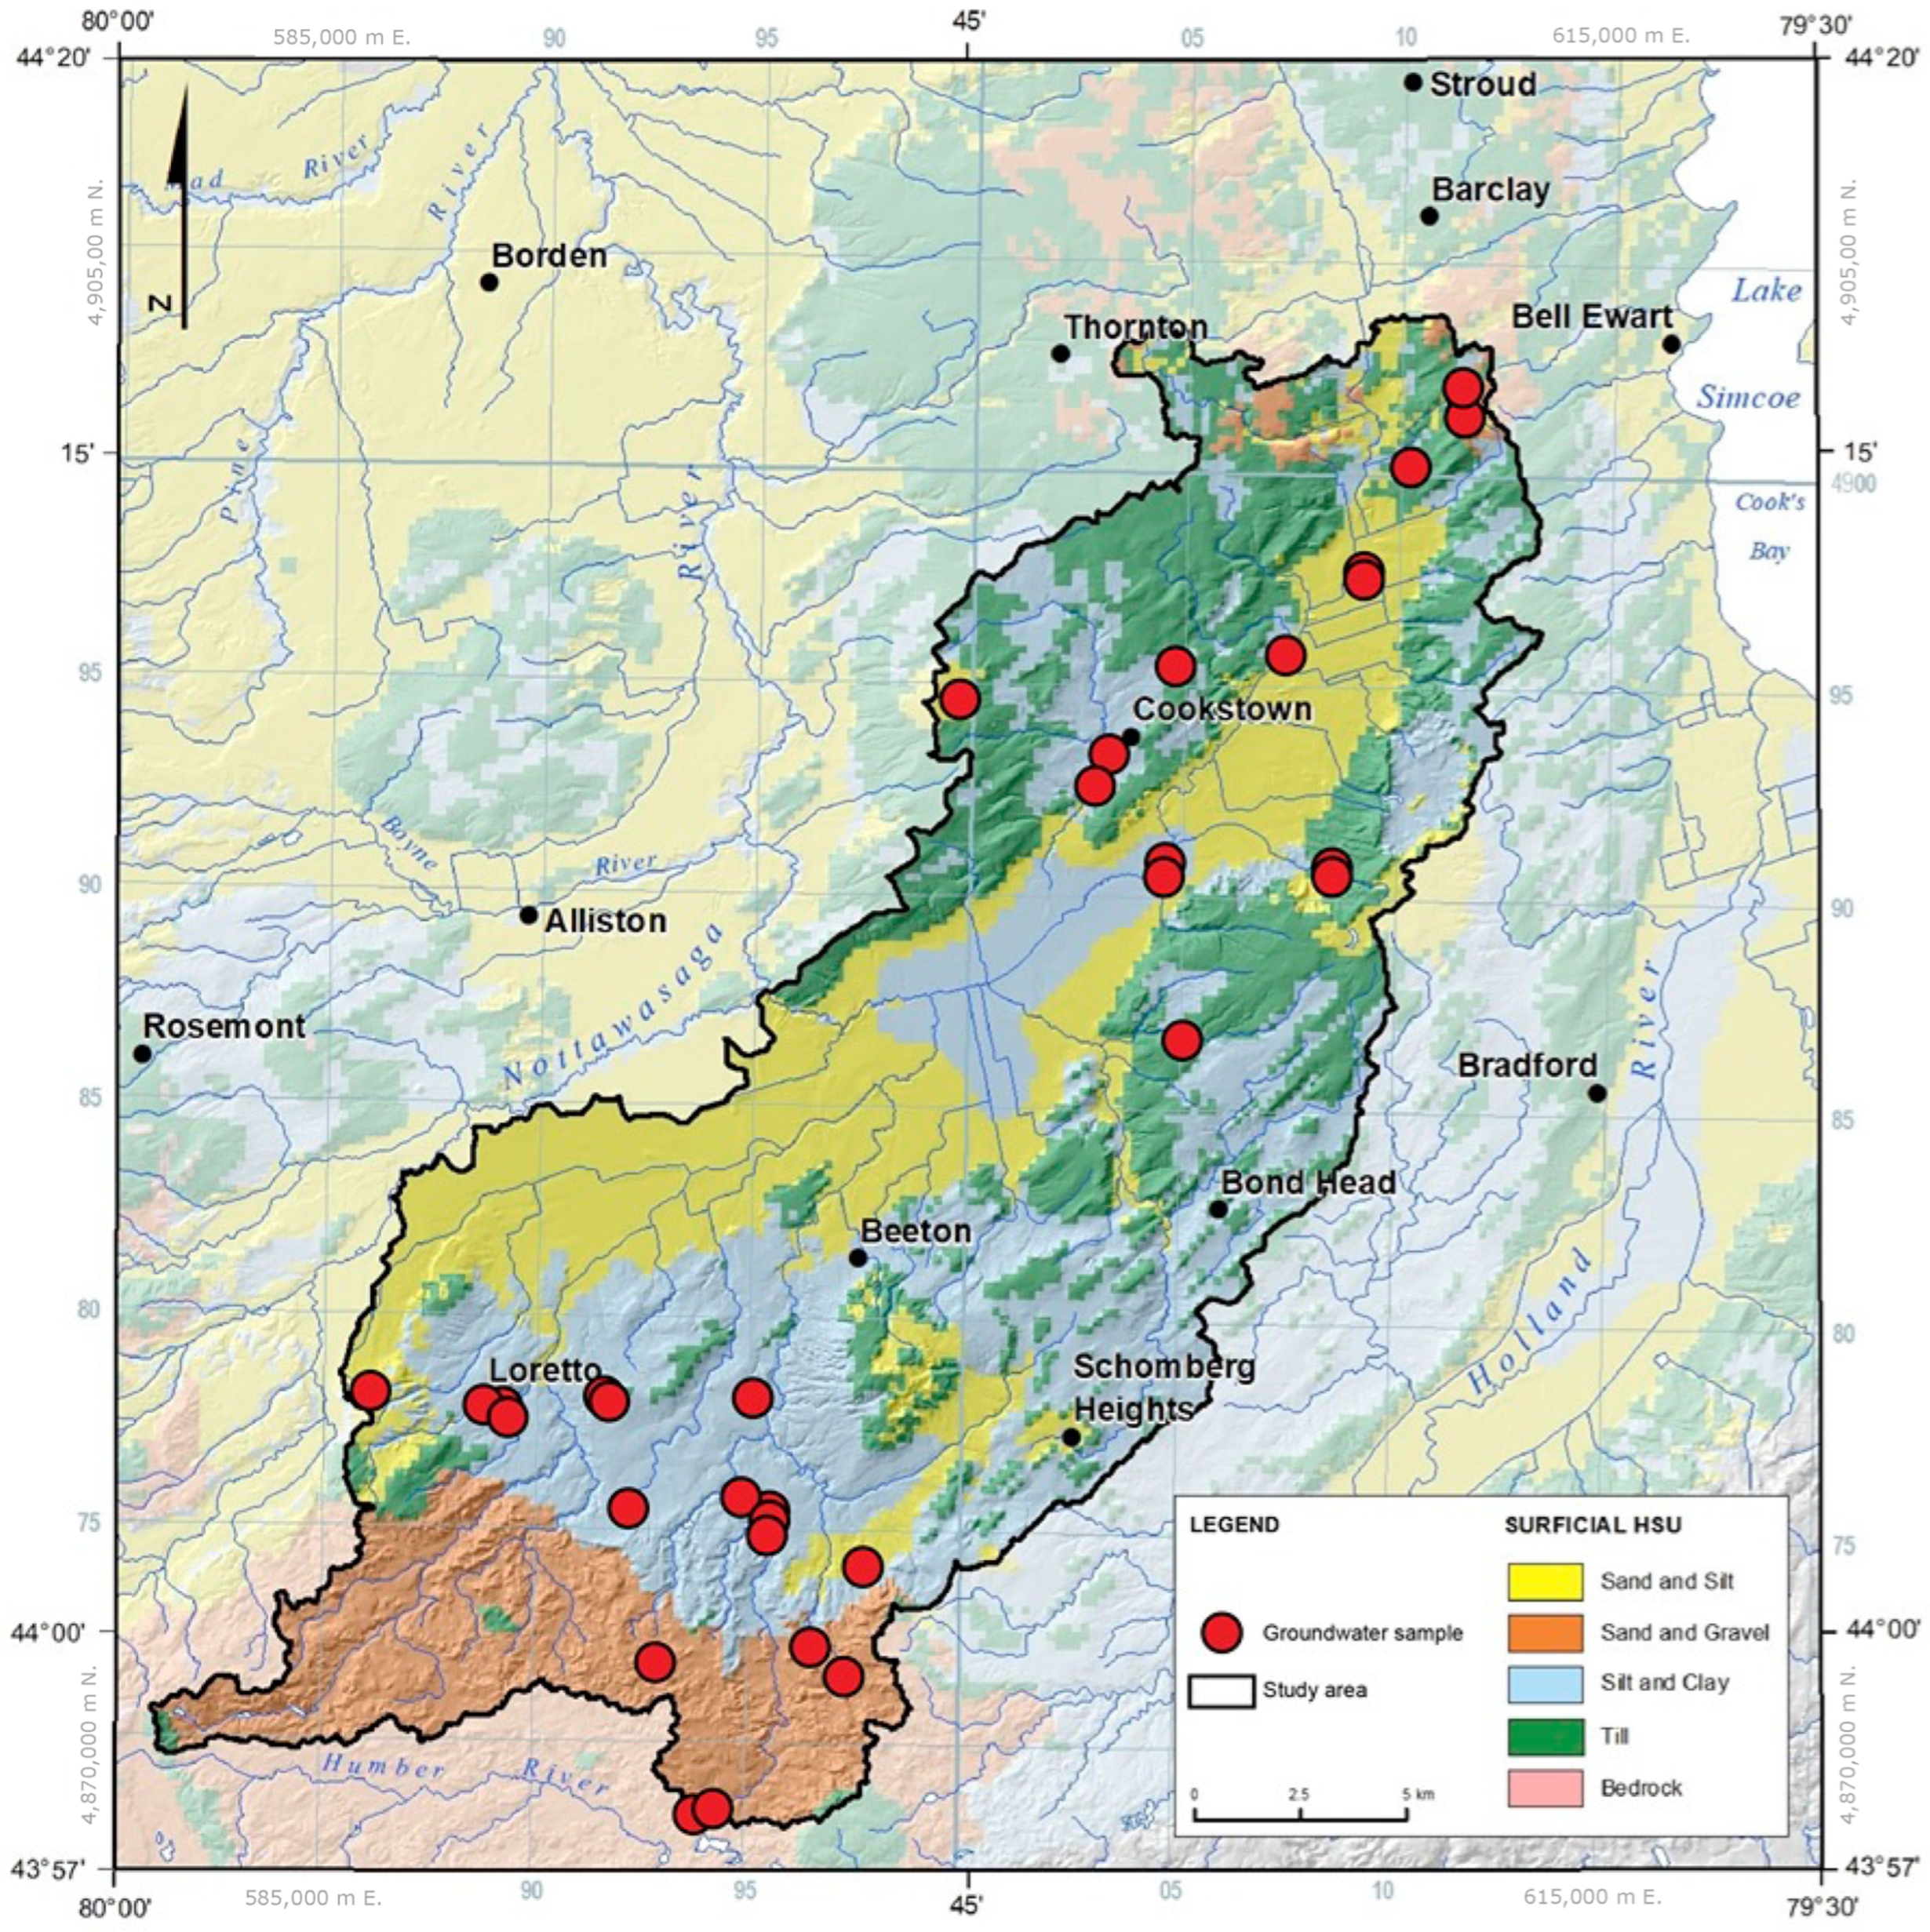
2.3. Geochemical and Isotopic Data

Available geochemical and isotopic data for the watershed were compiled first, including chemical analyses of water samples from wells installed across the main physiographic areas and tapping water from the main aquifer units. The initial database consisted mainly of field surveys carried out by the Geological Survey of Canada in 2016 and from the ongoing Groundwater Program of the Oak Ridges Moraine provided by the Conservation Authorities Moraine Coalition. Quality assurance and quality control processes were performed on the compiled data to identify the wells with a consistent geochemical dataset, their location, and assess the date of sampling, as reported by Proteau-Bedard, Baudron [35]. Collected data were then analysed and interpreted to identify areas the need additional information, such as areas with limited hydrogeochemical data density regarding major ions or isotopes, thus limiting the possibilities of interpretation for understanding groundwater evolution. To complete the hydrogeochemical and isotope dataset, a supplementary groundwater survey was conducted in this study in 2018. The sampling procedure aligns with the method utilized by the Geological Survey of Canada during the 2016 campaign. Groundwater samples for major ions (cations and anions) and stable isotopes (water molecule and DIC) were collected in four (4) different 60-mL HDPE containers, whereas 500-mL HDPE bottles were used for 14C. Samples for cations were acidified with nitric acid at 0.5 N and 0.1 mL HgCl2 was added to 14C samples for conservation. All samples, except for stable isotopes of water, were stored in a refrigerator (or cooler during transport) at 4 °C until analysis. Major ions analyses were performed by ionic chromatography (ICS 5000 AS-DP DIONEX Thermo Fisher Scientific instrument (Waltham, MA, USA)) at Polytechnique Montreal, CREDEAU laboratory. Detection limits were better than 0.2 mg/L for the targeted ions, and quality control was performed with an internal laboratory control water (with known concentrations). δ2H-H2O and δ18O-H2O were analyzed using an LGR (Los Gatos Research) model T-LWIA-45-EP Off-Axis Integrated Cavity Output Spectroscopy (OA-ICOS) at Geotop-UQAM. Three (3) internal reference waters (δ18O = 0.23 ± 0.06‰, −13.74 ± 0.07‰ & −20.35 ± 0.10‰; δ2H = 1.28 ± 0.27‰, −98.89 ± 1.12‰ & −155.66 ± 0.69‰) were used to normalize the results on the VSMOW-SLAP scale. The overall analytical uncertainty (1 s) is better than ±0.1‰ for δ18O and ±1.0 ‰ for δ2H. This uncertainty is based on the long-term measurement of the 4th reference water (δ18O = −4.31 ± 0.08‰; δ2H = −25.19 ± 0.83‰). δ13C-DIC was analysed using mass spectrometry (Isoprime 100 DI—MicroGas) at Geotop-UQAM, whereas 14C-DIC was measured using a mass accelerator (3MV accelerator mass spectrometer, High Voltage Engineering) at Ottawa University, A.E. Lalonde AMS laboratory.
The final hydrogeochemical and isotope database included analytical results from a total of 61 water samples with their corresponding depth, elevation, major ions concentrations, pH and specific conductivity. The samples were taken primarily from private domestic wells (21), municipal wells (20) and wells belonging to the Provincial Groundwater Monitoring Network (20), whose locations are illustrated in Figure 3. Coordinates, well depth and elevation are listed in Table S1, Supplementary Materials.
When information regarding well construction was available, the required sampling protocol consisted of the purging of at least three (3) well volumes before collecting samples. For wells with unknown water volume, mainly some of the domestic wells, physical parameter stabilization was used as an indicator of adequate purging. With respect to the physiographic zones: 16 water samples originate from ORM formation, 40 samples are from aquifer units of the Upland area, and 5 samples were collected from the Lowlands. Of these, 27 samples were analysed for δ2H-H2O, δ18O-H2O, δ13C-DIC, and 14C-DIC isotopes. The reliability of major ions analyses was evaluated using a threshold of ±10% for the ionic balance error. As shown in Figure 3, the spatial distribution of the groundwater samples is uneven across the study area, reflecting both the focus of field surveys on portraying the water quality within specific HSUs and the accessibility of the wells and permission of the landowners to perform sampling.

2.4. Analytical Program

The hydrochemistry of major ions (Ca, Mg, Na, K, SO4, HCO3, NO3 and Cl) was used as an indicator of the chemical processes taking place and of the water evolution in the groundwater system. The considered isotopes were δ2H-H2O, δ18O-H2O, δ13C-DIC and 14C-DIC. δ2H-H2O and δ18O-H2O were used to assess the recharge conditions and provide qualitative information on the timing of recharge. δ13C-DIC and 14C-DIC were used for groundwater dating and the assessment of the residence time since infiltration.
In the context of radiocarbon age assessment for groundwater, correction models are crucial due to the complexities arising from isotopic exchange with marine carbonate, soil CO2 dissolution, and other geochemical processes, ensuring the accurate determination of groundwater age. Radiocarbon data correction applied the program NETPATH [36] with geochemical phases inspired from the study by Aravena, Wassenaar [37]. Eichinger as well as Fontes and Garnier correction methods [38] provided similar apparent ages. The ultimate values were calculated by averaging the two results and rounding the resulting ages to the nearest thousand, allowing for the possibility of obtaining zero in the case of modern samples. This simplification is not a limitation in this study, as the 14C age dating information was used to distinguish between the older and younger end-members.

3. Results

3.1. Hydrogeological Contexts

The pre-treatment of the collected dataset showed a high variability in the local confinement conditions and revealed varying connections between the aquifer units. Therefore, to accurately estimate the local hydrogeological contexts, a comprehensive assessment of each sample’s information required regrouping samples that yielded similar results. A brief review of regional characterization studies of aquifers in similar post-glacial settings [11,12,16,39,40] points to a few key parameters whose identification is critical within the heterogeneous nature of complex aquifer systems, such as hydrostratigraphy, main recharge and discharge zones, respective flow paths and corresponding degree of confinement. Characterizing the main groundwater flow paths from recharge zones to discharge zones is not an easy task since multiple recharge zones could be observed in the studied watershed [32]. On the other hand, this inferred knowledge is important since it can be validated or invalidated based on the different geochemical signature along different flow paths, which was the main objective of the present study.

3.1.1. Hydrostratigraphy

The first parameter in the definition of the hydrogeological sections in place is the HSU distribution. With the help of the 3D geological model [33], the hydrostratigraphic variation was found to be minimal within the three predefined main physiographic areas (Figure 4): ORM hydrostratigraphic setting (HS-A), Upland area (HS-B) and Lowland area (HS-C). Additional delineation had to be made to acknowledge the different level of confinements found in HS-B. Three sub-areas were defined accordingly: (i) HS-B1: located in the southern part of the Uplands, where recharged water mixes with groundwater from HS-A and follows the same northward flow path; (ii) HS-B2: encompasses the eastern portion of the Uplands, which is confined by a low permeability surficial till; and (iii) HS-B3: covers the north-western part of the Uplands with an expected groundwater flow direction from the northern water divide of the watershed towards HS-C and further downstream of the Innisfil Creek (Figure 4). In general, HS-A corresponds to >50 m thick coarse sediments, whereas aquifers in HS-B1, HS-B2, HS-B3 and HS-C consist of relatively thin sand layers confined by >40 m thick silt and clay aquitards.

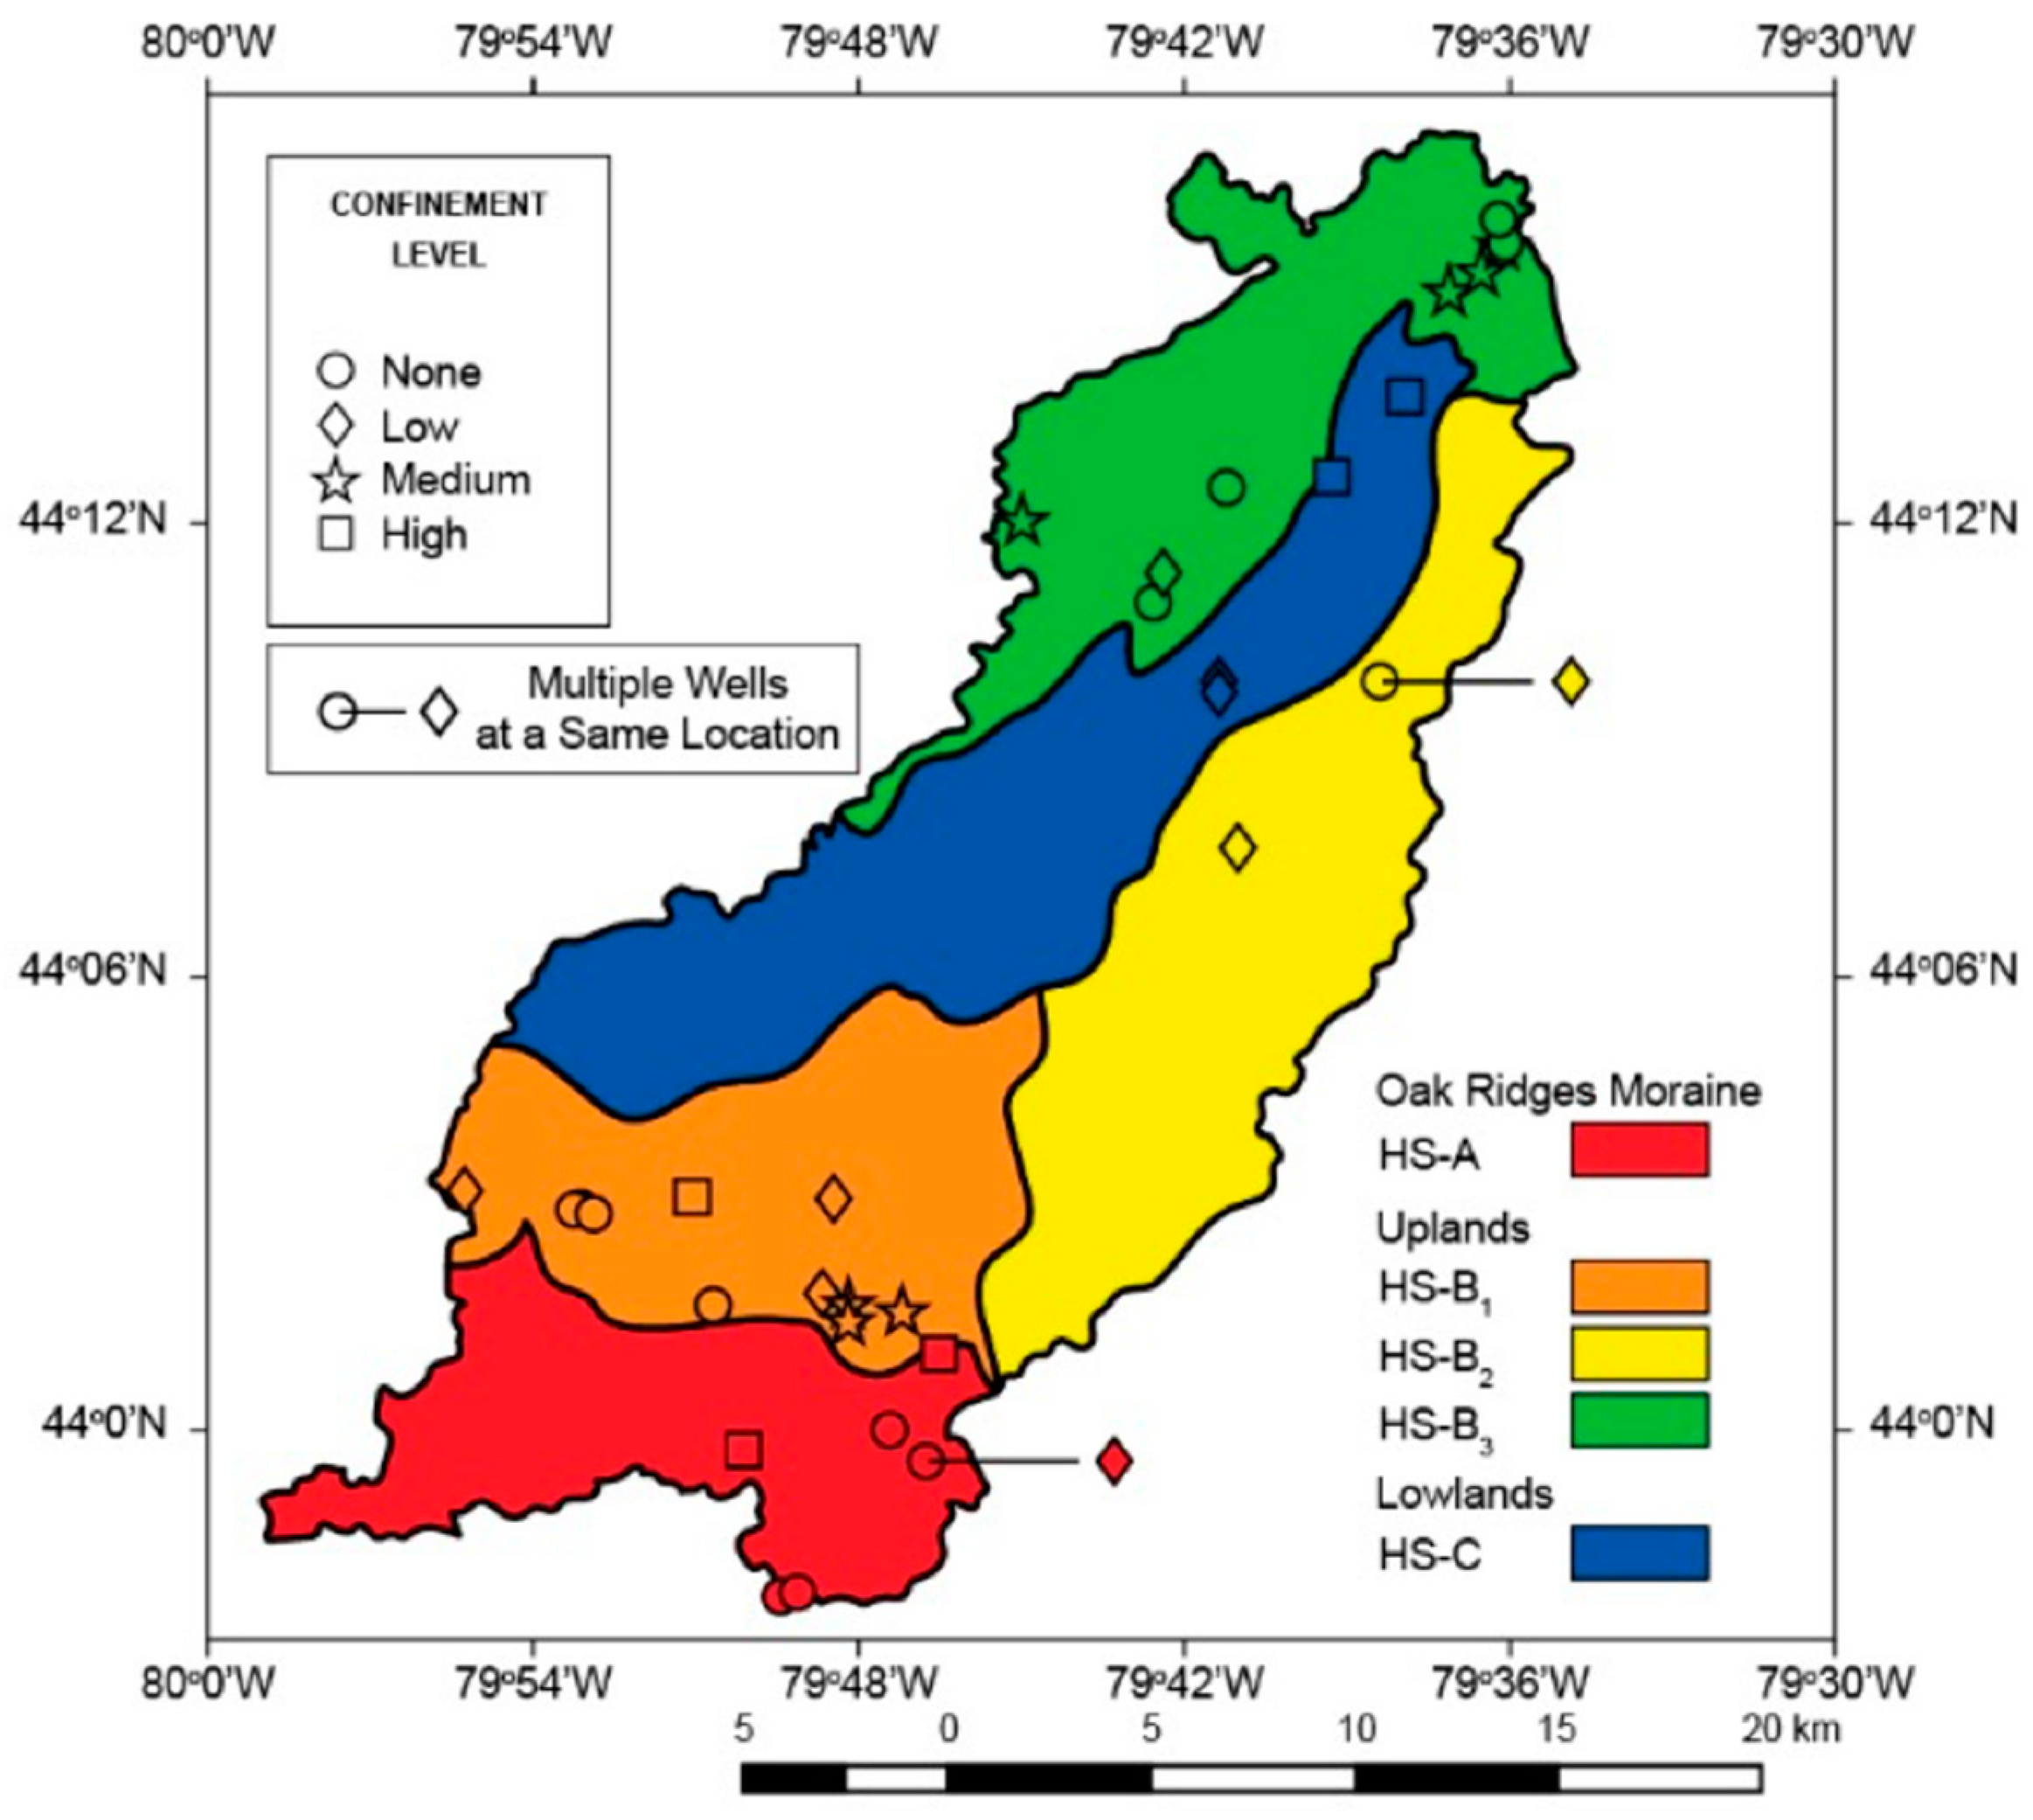
3.1.2. Degree of Confinement
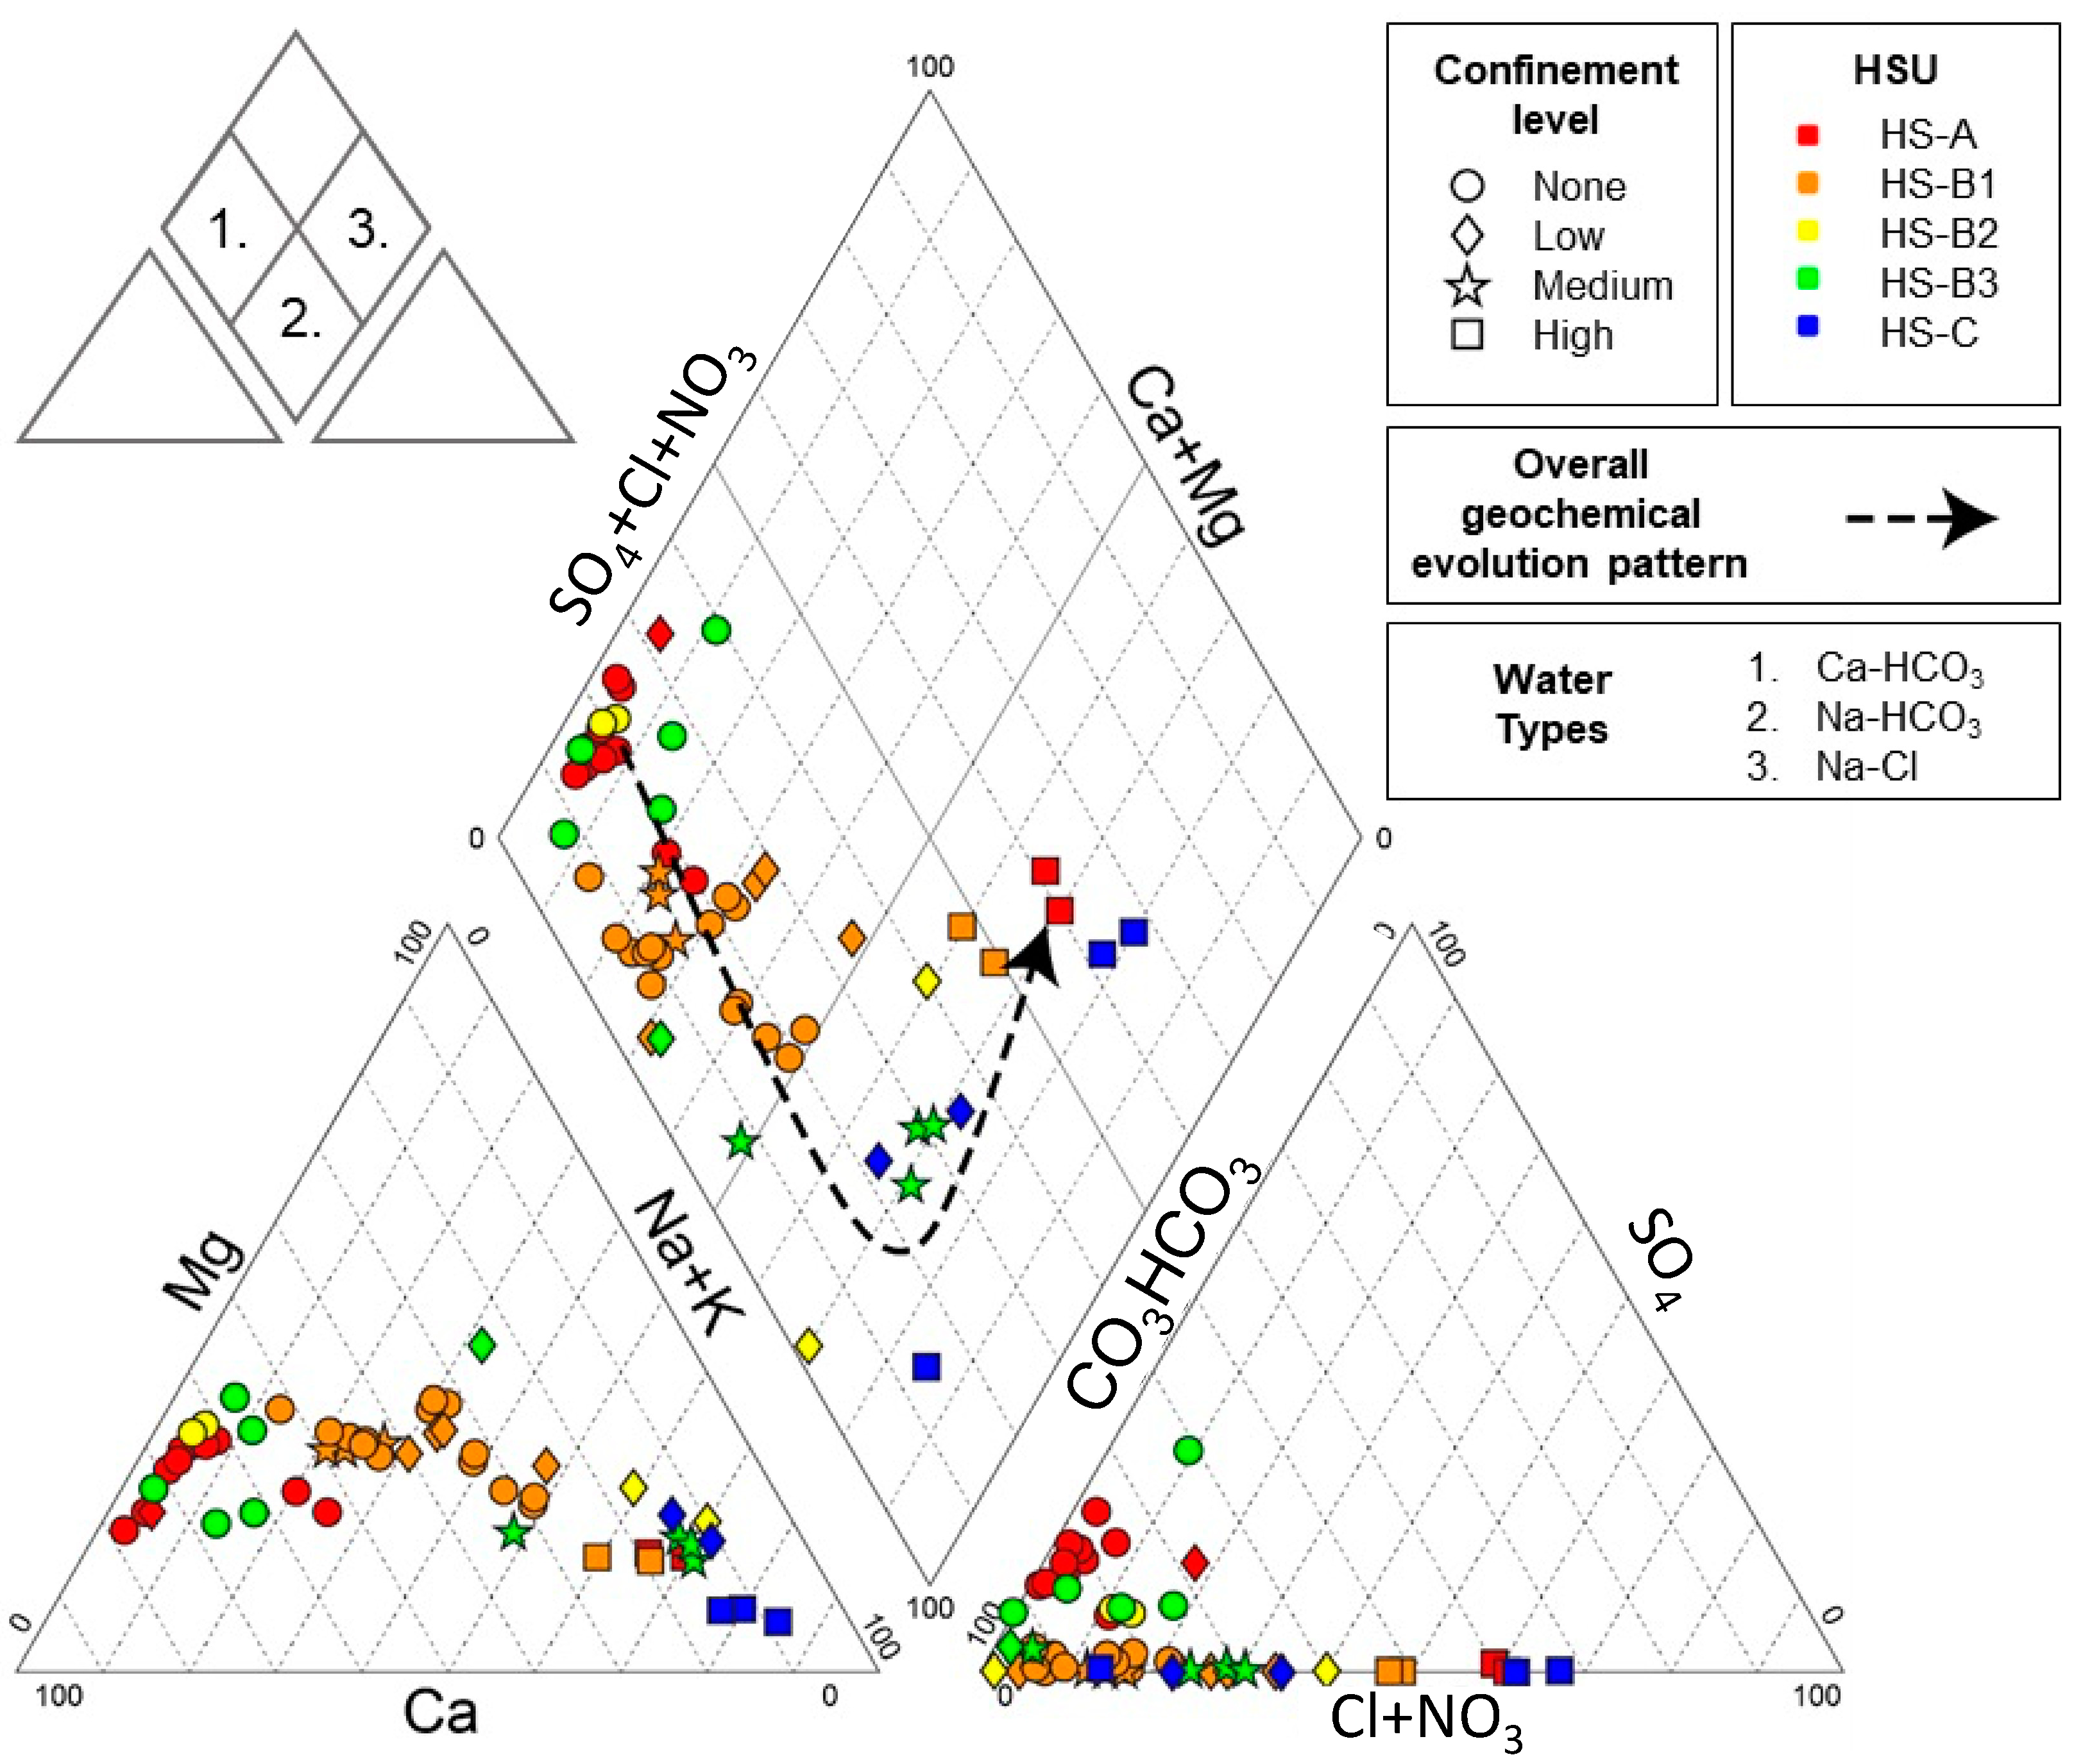
A 3D geological model of the area developed by Bajc, Mulligan [33] was used to evaluate the confinement conditions of a given aquifer unit based on the thickness of the overlaying aquitard and eventual linkages with groundwater flow in neighbouring less confined aquifers. To this end, a four-step qualitative indicator of the confinement was considered: (i) none (unconfined surficial aquifers often covered with discontinuous shallow low permeability sediments), (ii) low (aquifer at a depth of <30 m and/or covered by continuous <10 m thick low permeability sediments, interconnected with other aquifer units), (iii) medium (aquifer unit at a depth of >30 m and/or covered by <30 m thick low permeability sediments, low linkages with other aquifer units) and (iv) a high degree of confinement (aquifer unit overlain with >30 m thick aquitard layer(s), usually located at the base of the vertical stratigraphy with no to low linkages with other aquifers).
Based on the hydrogeological contexts identified according to the physiographic zones, the degree of confinement and the typical hydrostratigraphy are presented in Figure 4 As it can be observed, high confinement occurs mainly in the bedrock aquifers and in the upstream part of the Innisfil Creek (HS-C), whereas medium confinement is expected in parts of HS-B and the downstream part of HS-C. On the other hand, groundwater recharge with a different rate can be expected across unconfined to low confinement conditions in HS-A and parts of HS-B.

3.2. Major Ions

The major ions are shown with the Piper diagram in Figure 5. Three (3) distinct water types can be observed: Ca-HCO3 type (n = 47 water samples) as the most common water type followed by Na-HCO3 (n = 10) and Na-Cl (n = 4) water types. The Ca-HCO3 water type suggests low-mineralized water that was exposed to limited interaction with the geology and whose chemistry is dominated by the dissolution of calcite and dolomite. Older groundwater evolves to the Na-HCO3 water type, indicating considerable cation exchange and to highly mineralized Na-Cl water type further down gradient through mixing and longer residence time [5].
The investigation of the location of the sampled groundwater wells and the screened portions of the aquifer units with depth shows a much stronger relation between the identified water types and the degree of confinement rather than just with the altitude of the wells. Accordingly, HS-A samples, which originate from the hilly ORM area, are subject to drastic geochemical changes with respect to the confinement and include all three water types. Groundwater samples from wells in unconfined and low confinement aquifer units show Ca-HCO3 water types. The Na-HCO3 water type dominates in medium-confinement conditions, whereas groundwater samples from wells under high confinement are on the other end of the Piper diagram, with the Na-Cl water type. The HS-B samples show considerably more homogeneous characteristics with a small influence from the level of confinement: Ca-HCO3 water type for no to low confinement and Na-HCO3 at medium and high confinement. On the other hand, the groundwater in the main discharge zone for the watershed (lowlands), HS-C, is composed of Na-HCO3 and Na-Cl water types under medium and high confinement conditions, respectively.
As shown in Figure 5, most of the water samples show a coherent relation between the aquifer confinement and the water type, i.e., groundwater in lower confinement conditions is closer to the Ca-HCO3 geochemical pole, whereas that in highest confinement is closer to the Na-Cl type. High chloride concentrations in some of the groundwater wells from all sectors except HS-B3 was somehow unexpected. Firstly, the local geology does not contain evaporites, and secondly, the study area is located more than 1000 km from the closest ocean. Possible hypotheses that need to be examined for such high chloride concentrations include deep bedrock water inflow, past climate events and/or long residence time.

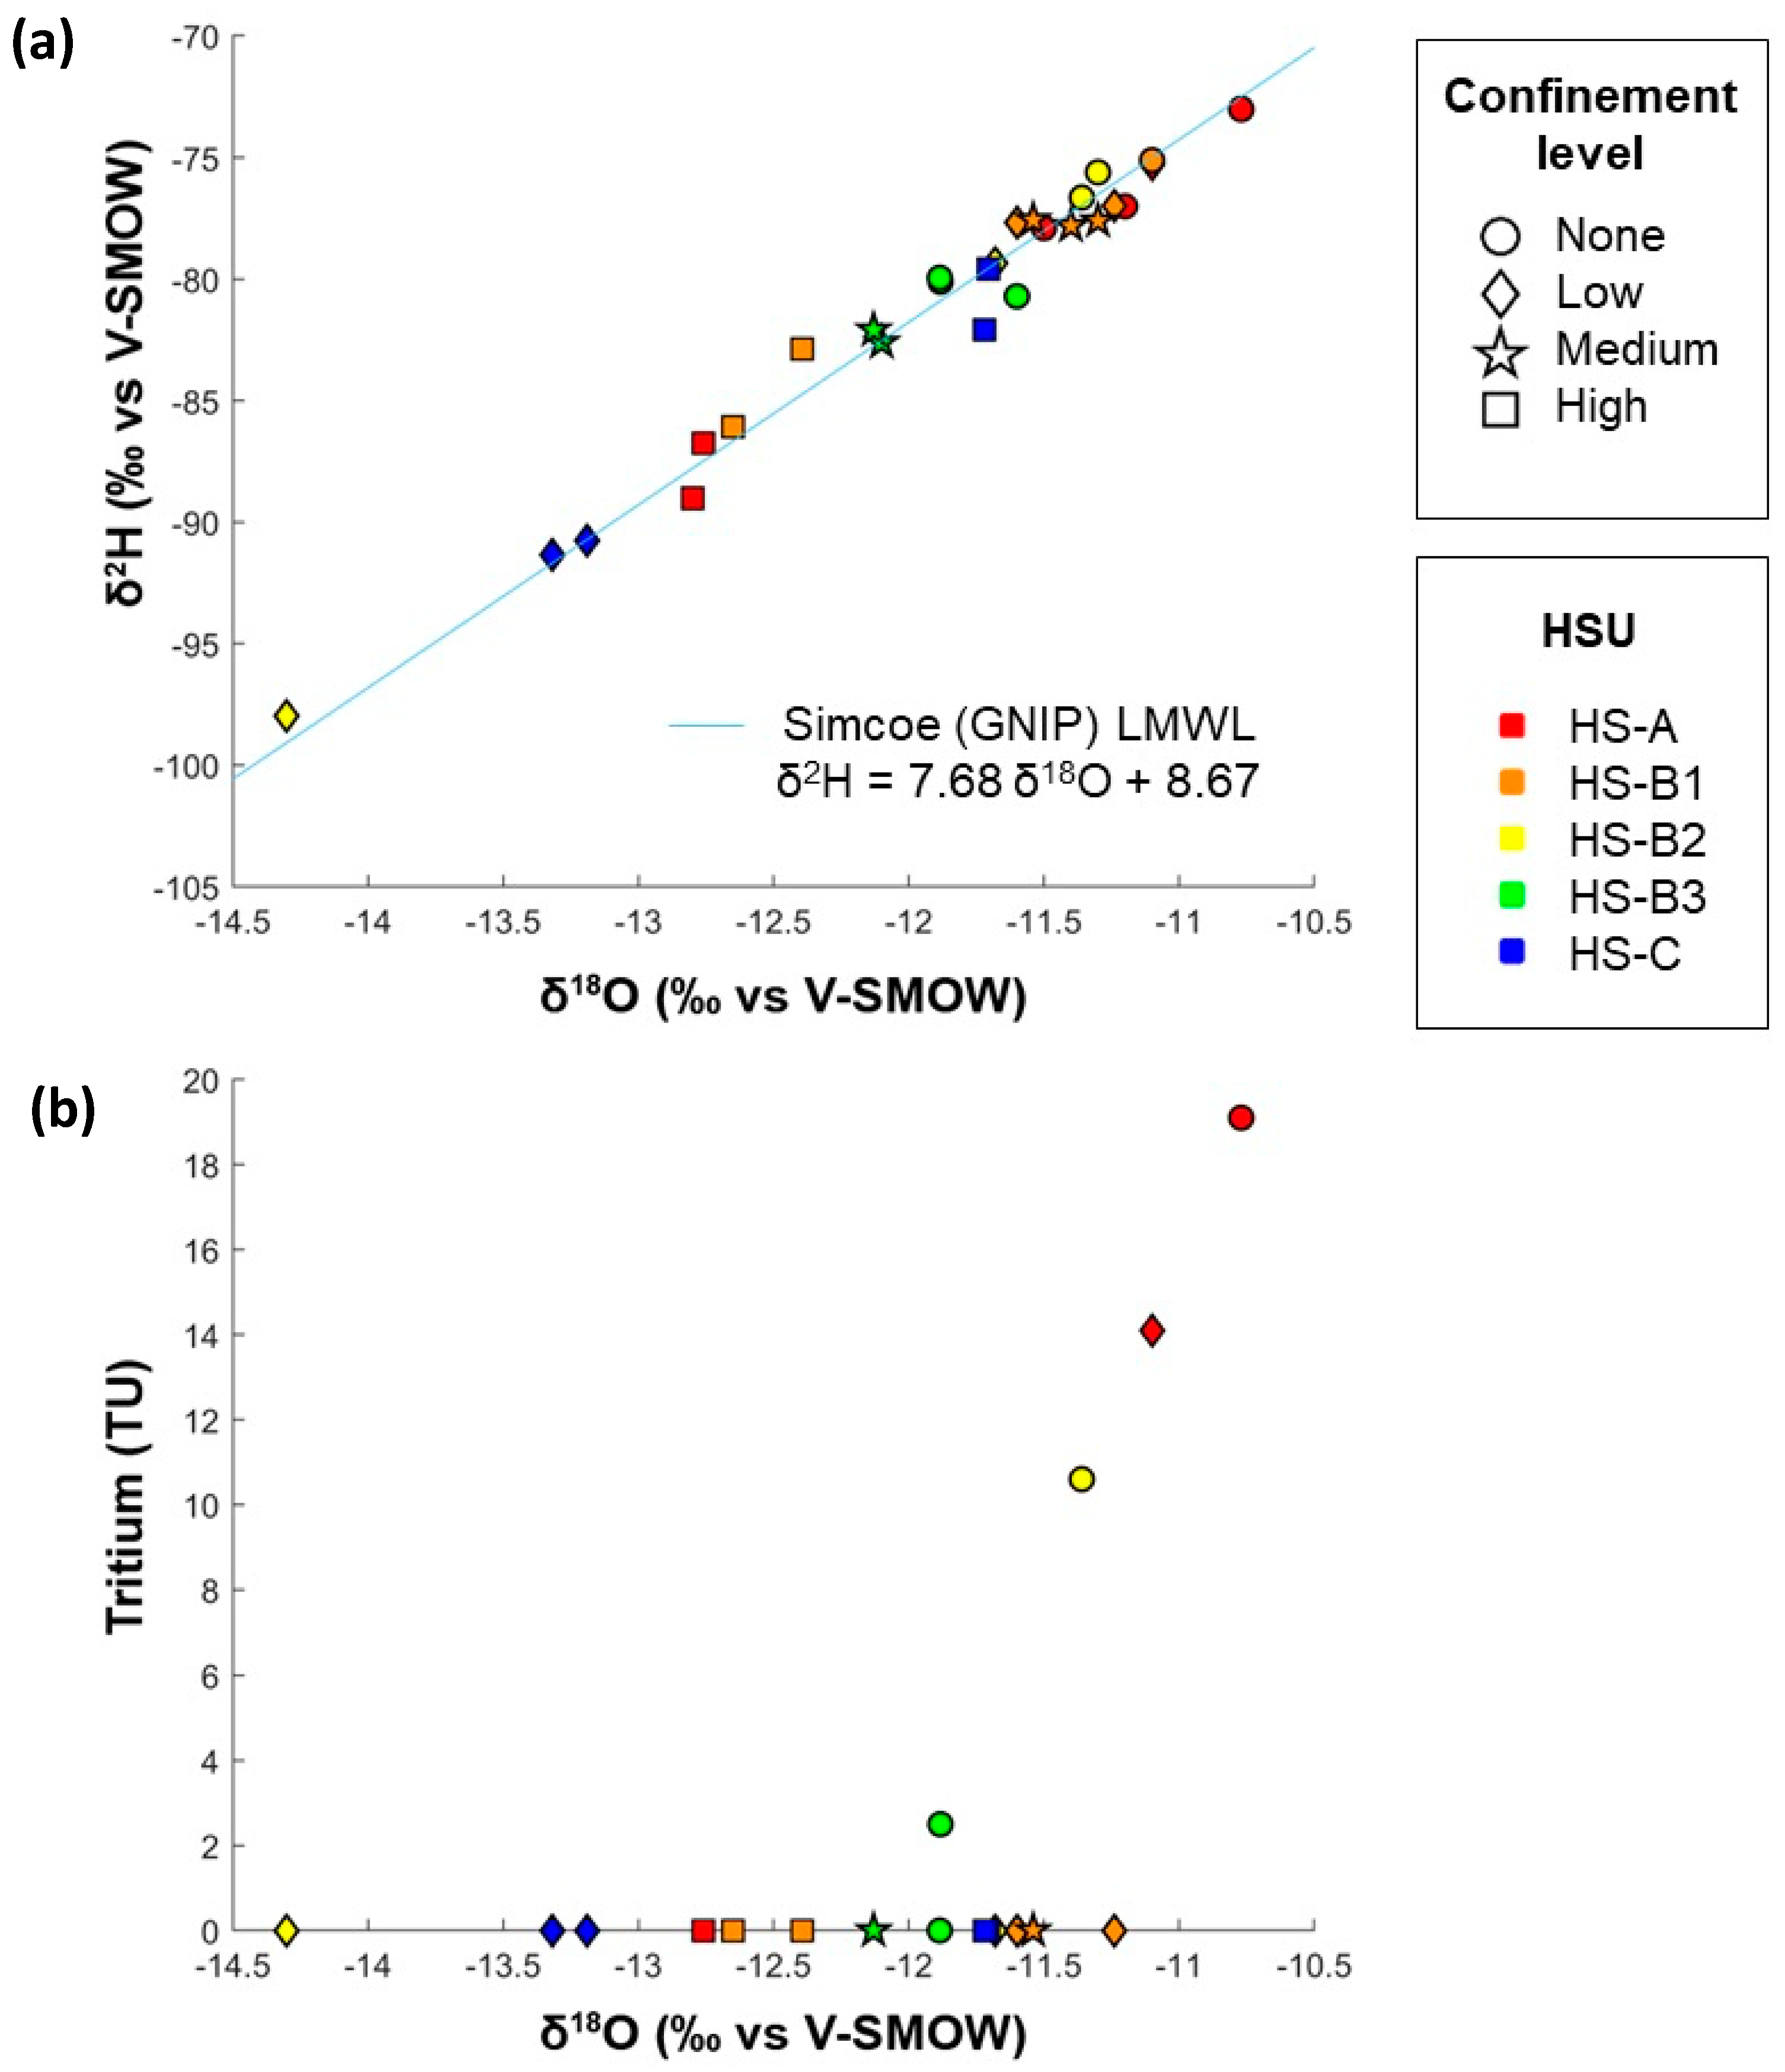
3.3. Modern Groundwater

The highly variable hydrogeochemistry of dissolved constituents reflects the overall geochemical evolution pattern of groundwater and leads to the hypothesis of the uneven distribution of water residence time across the HSUs. A better understanding of the influence of the residence time of groundwater on the general hydrogeochemistry is crucial to build a conceptual model of the groundwater flow. Stable isotopes and tritium concentrations in water help identify the share of the modern water (Ca-HCO3 water type) in the general groundwater flow.
The observed wide distribution of water stable isotopes (Figure 6a) indicates that the recharge of the multi-aquifer system has occurred under different climate conditions. Modern infiltration (<1000 years) in the area is expected to have mean annual values of δ18O between −10.5‰ and −12‰ vs. V-SMOW according to a past isotopic characterization study of confined aquifers in the region [37]. These δ18O ranges match both the low confinement aquifers across the study area and confined aquifers in HS-A, HS-B1, HS-B2 and HS-C. Since the latter aquifers are not expected to have any modern recharge signature, the validation of the results was performed with tritium to add precision to the modern water identification.
Radioactive isotope tritium (3H) has been used extensively as a hydrologic tracer and a qualitative indicator (dating tool) of post 1950s recharges. Although tritium is generated naturally in the atmosphere, its employment as a hydrologic tracer is linked to the introduction of significant quantities of tritium in the atmosphere during atomic bomb testing peaks in the 1950s and early 1960s. These atmospheric peaks therefore constitute useful time markers to estimate water age. Tritium was analysed on 17 groundwater samples, out of which 13 samples showed concentrations below the detection limit and only 4 had concentration greater than the detection limit (>0.5 TU). The analysis of the vertical stratigraphy indicates that all four (4) samples with detected tritium were collected from unconfined or aquifers with low confinement. The highest tritium values of 19.1 TU and 14.1 TU were measured in HS-A samples from unconfined and low confinement conditions, respectively. It is noteworthy that the latter sample was retrieved from a well at 67 m depth, beneath overlying till deposits. The other two water samples were drawn from wells in unconfined aquifers: a water sample from HS-B2 showed 10.6 TU, whereas the lowest tritium concentration of 2.5 TU, close to the detection limit, was observed in a sample from HS-B3 (Figure 6b).

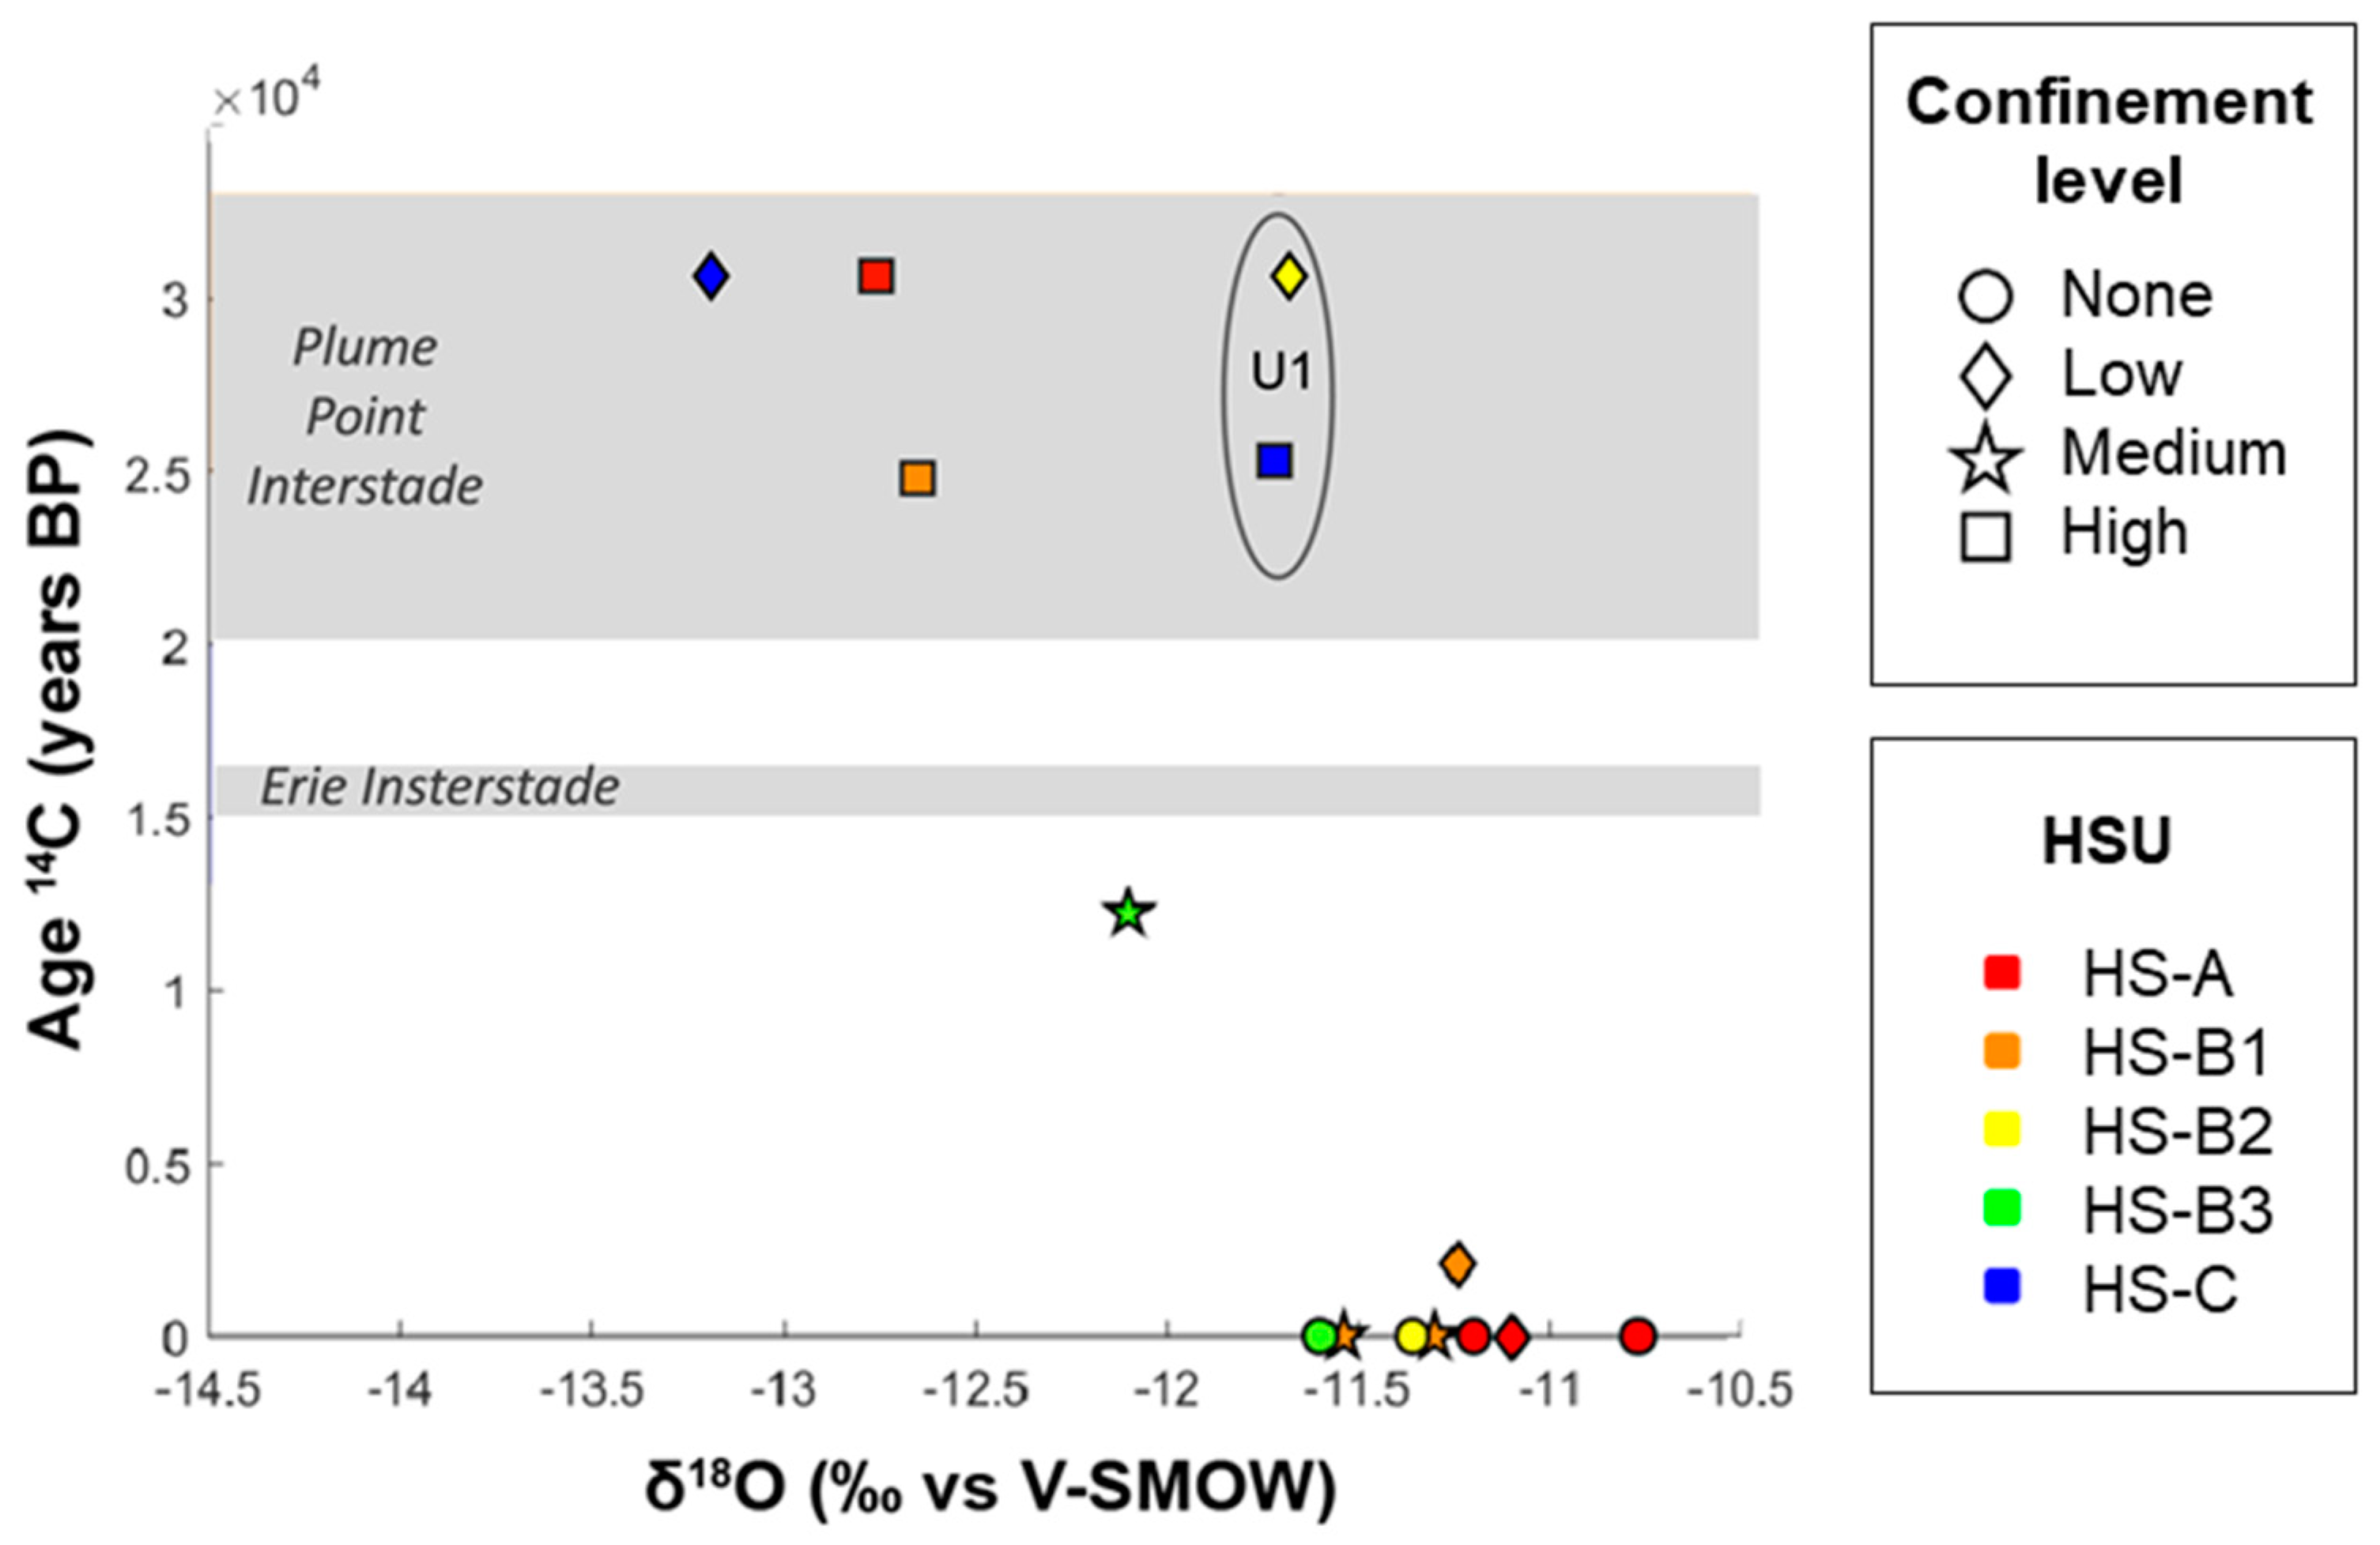
3.4. Old Groundwater

Radiocarbon (14C) is used as a tracer for groundwater flow of up to 30,000 years. Despite the long half-life, it can also help evidence the presence/absence of modern recharge [41]. Radiocarbon analyses were carried out on 16 groundwater samples. Radiocarbon age corrections against reference 14C activity were performed on all samples. Not that methane was not considered in the correction models, despite its potential presence in the area. The exception were three (3) samples with null activity that were considered as indicators of ancient water at least as old as the oldest calculated age, ≥25,000 years BP (Table S1 in Supplementary Materials). Although the relation of 14C age vs. δ18O is not clearly defined, the majority of samples exhibiting medium to high levels of confinement in groundwater flow conditions demonstrate a tendency towards older water ages, i.e., >10,000 years (Figure 7). It can also be observed that modern recharge occurs not only in unconfined aquifer units, but also that modern water constituents can sometimes be found in low- and medium-confined aquifers as well. This finding is supported by both the tritium results (Figure 6) and by radiocarbon results for two of the samples from confined hydrological settings (encircled U1 group in Figure 7). The U1 group may contain old groundwater despite the apparent modern stable isotope signature.
The study by Aravena, Wassenaar [37] presented a groundwater age distribution across the southern Ontario region concluding that it can be linked to three major recharge periods: the current period since the end of the last glaciation (≤13,000 years), the Erie Interstade (during the last glaciation) and the Plum Point Interstade (before the last glaciation). Radiocarbon age dating allowed for the depiction of the relationship between these main recharge periods and the hydrogeological sections (Figure 7): (i) five (5) groundwater samples correspond to the oldest Plum Point Interstade period that occurred 20,000–35,000 years BP and originate from confined aquifers. Three of these samples have depleted δ18O concentrations; however, two of the samples (encircled) do not fit in this definition due to their enriched isotopic signature. The hypothesis of mixing of water between the coarse deposit aquifers with the deep bedrock inflow of ancient water or recharge during the warmer climate conditions of an Interstade could provide a possible explanation; (ii) there seems to be no water sample which could be associated with the Erie Interstade period that occurred 15,000–16,500 years BP; and (iii) the remaining nine (9) samples can be associated with modern recharge. Among them, the groundwater sample from HS-B3 is the oldest and dated to about 12,000 years BP.
As shown in Supplementary Materials, the tritium and radiocarbon age distributions and the degree of confinement show a good relation to aquifer units, with modern water recharge or with dominant contribution of older water. In general, no to low levels of confinement are associated with modern recharge, whereas medium to high levels of confinement are associated with older water with a longer residence time.

4. Discussion

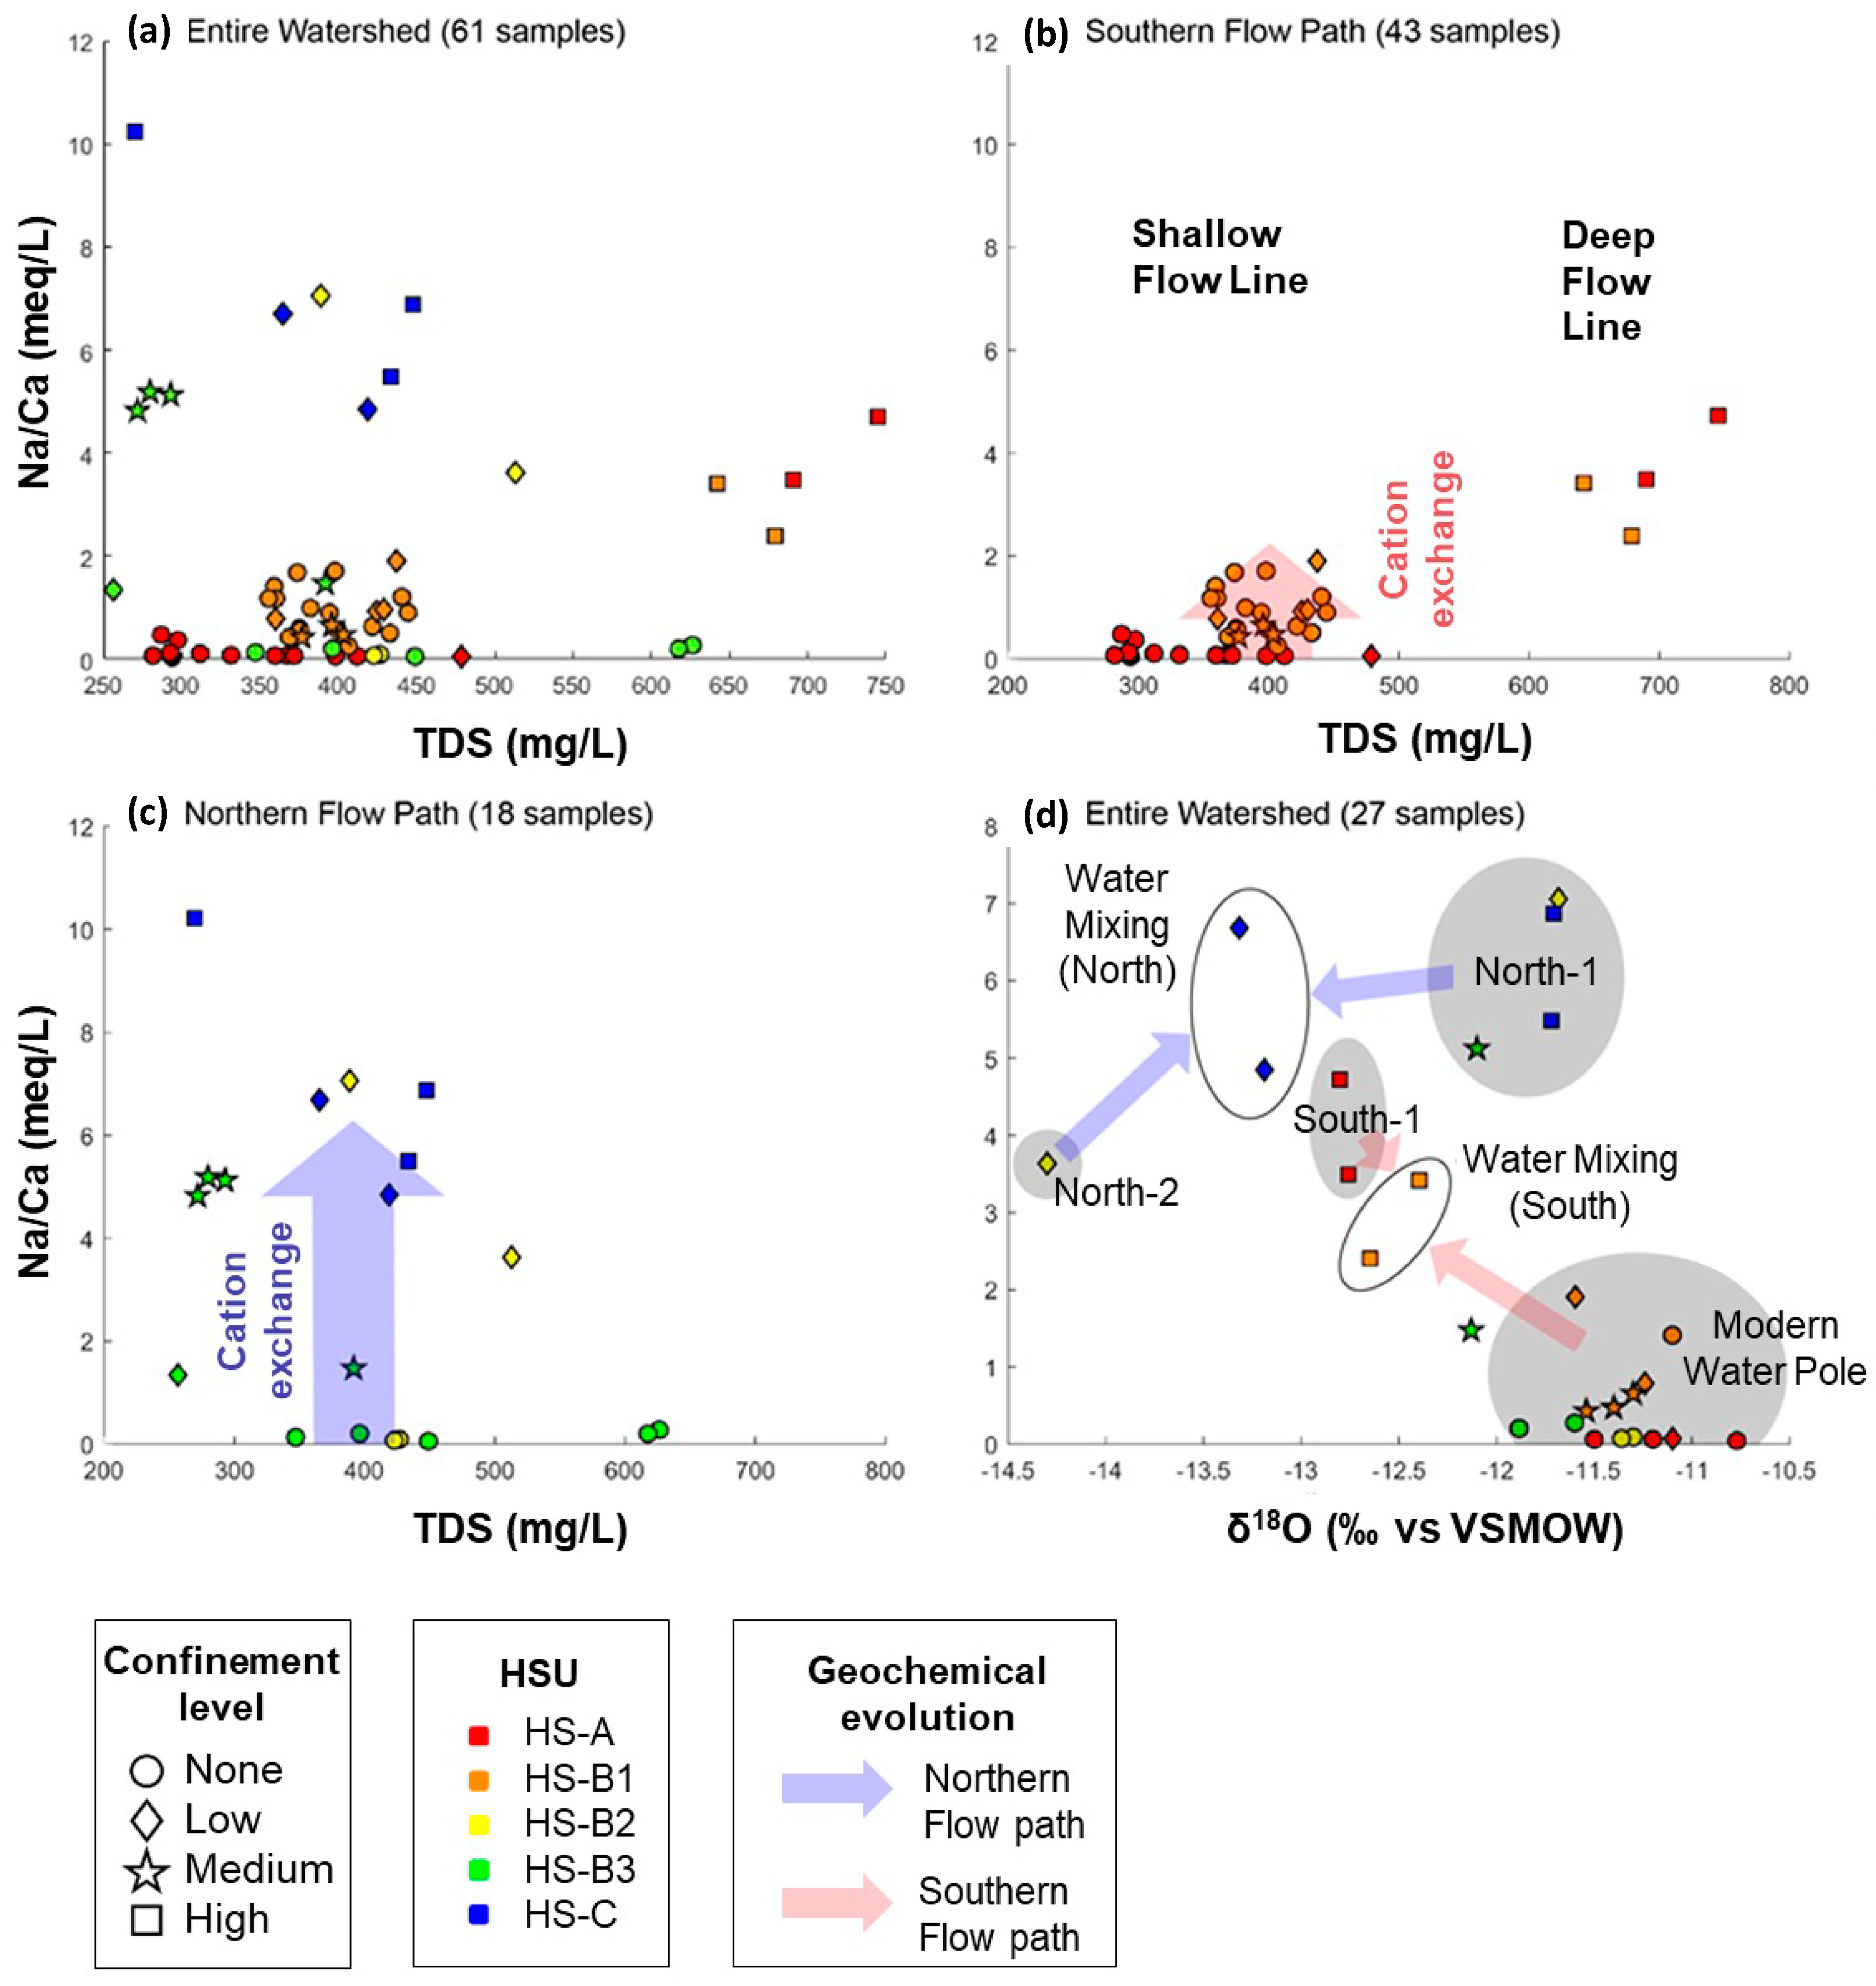
4.1. Main Hydrogeochemical Processes

The complex variations in hydrogeological characteristics across the area, both horizontally and vertically, as well as the uneven distribution of groundwater ages, present challenges in comprehending the flow of groundwater at local and regional scales. It is, however, still possible to evaluate groundwater evolution and to draw certain conclusions with respect to the main hydrogeochemical processes and groundwater dynamics. To this end, two main processes must be addressed: (i) the natural evolution of the initial groundwater chemical composition altered by the effects of a variety of geochemical processes during the groundwater flow from recharge to discharge areas, and (ii) localized mixing between modern and old water, which can eventually accelerate the geochemical evolution. Two major flow paths were defined in the watershed to summarize the major hydrogeochemical processes observed: (i) the northern flow path starting from HS-B2 and HS-B3 to HS-C, and (ii) the southern flow path from HS-A to HS-B1, with the hydrogeological sections being indicated in Figure 4.
The Na/Ca ratio is used herein as a parameter to investigate the potential cation exchange along a flow path. Figure 8 shows the relationship between the Na/Ca ratio and the total dissolved solids (TDS) and δ18O. It can be observed that there is a general increasing trend of the Na/Ca ratio with the increase in TDS (Figure 8b) except for the downgradient-confined aquifer B3 and C (Figure 8a,c). For the latter, the Na/Ca ratio increases independently of the TDS increase. This may suggest that the substitution of calcium with sodium (cation exchange) causes the main variation in the chemical signature of the groundwater rather than the dissolution of other minerals or simple mixing between groundwater masses. In Figure 8d, on the other hand, δ18O is used as a conservative tracer for the mixing process, whereas the Na/Ca ratio helps assess the geochemical evolution of the samples and their location within the watershed. This figure identifies the mixing zones along the northern and the southern flow paths with their respective end-members, where: North-1 and North-2 are end-members along the northern flow line, and South-1 and the modern water pole are the end-members of the southern flow line.
Figure 8b helps identify shallow-water and deep-water flows for the southern flow path. The shallow flow occurs in granular aquifers and is characterized by important modern water infiltration at the beginning of the flow path in both HS-A and HS-B1. The main modern water input occurs in HS-A throughout the granular aquifer. This modern signature is also observed further downgradient on the flow path in HS-B1 and is gradually altered in aquifer units with increased confinement conditions. This contributes to an increase in the TDS content and the cation exchange between Ca and Na as the main geochemical process. The deep-water flow, according to the well logs, considers groundwater flow at the interface between the top portion of fractured aquifers and permeable sediments at the base of the Quaternary sequence. Both the Na/Ca ratio and TDS content decrease at this interface in the downgradient direction.
The groundwater flow along the northern flow path starts in HS-B2 and HS-B3 and continues in HS-C as the main discharge area in the watershed. As illustrated in Figure 8c, the cation exchange process has an important impact on the geochemical evolution of the groundwater. In HS-B2 and HS-B3, modern water dominates in unconfined aquifer units. They overly silt and clay aquitards, which have a major control on the vertical flow toward the lower permeable units. By the time water reaches deeper aquifer units, the cation exchange process advances, and the Na/Ca ratio is at least a few fold higher than the initial values. As well, it seems that the confinement effect is more noticeable in HS-B2 and is characterized by a lower Na/Ca and TDS content than in HS-B3. The cation exchange process illustrates the difference between the low-confinement and high-confinement signatures of the aquifer units. The high confinement conditions require a more comprehensive data acquisition strategy to understand the contribution of the different hydrogeological sections encountered along the flow paths.
The explanation of the geochemical variations observed in Figure 8a–c is evidenced in a different way in Figure 8d. The potential water mixing area along the southern flow path is determined based on two wells in high confined aquifer units located in HS-B1. Their Na/Ca ratio and isotopic signatures are positioned between the confined water of South-1 end-member and the modern water end-member, thus indicating likely mixing between these two types of water. The proposed explanation is that deep aquifer units HS-B1 receive water from two origins: most of recharge corresponds to low-mineralized water originated from HS-A, while a lower proportion comes from direct recharge through occasional windows of more permeable materials embedded in HS-B1 within the low-permeability units that separate the upper unconfined aquifer from lower confined aquifers at increased depths. The end-members along the northern flow path, North-1 and North-2, are both detected in confined aquifers, as illustrated by Figure 8d. Unfortunately, for the time being, there are no δ18O analyses in low-confined or unconfined aquifers. As it was the case with the southern flow path, the respective mixing water area is determined based on two water samples from HS-C. According to the geological cross section, a direct hydraulic connection would exist between the water mixing area and the aquifer unit of North-1.

4.2. Conceptual Model

The identification of some key elements of the complex aquifer system offered the information needed for the creation of a conceptual model for the groundwater flow and geochemical evolution in the Innisfil watershed. As discussed in the previous section, the investigation was conducted on two (2) major flow paths: the southern and the northern flow paths. The conceptual model for the southern flow path is shown in Figure 9. The dominant feature of the shallow flow along the southern flow path is the rapid modern water input in HS-A and the local infiltration recharge through the more permeable windows within the low permeability layers in HS-B1. The low-mineralized water from both sources is then exposed to geochemical processes that take place at increased depths where the geochemical signature gradually evolves from the Ca-HCO3 to Na-HCO3 type. The much slower deep-water flow at the sediment–bedrock interface along the southern flow path is rich in Na and TDS content in both HS-A and HS-B1 with the Na-Cl-dominant water type. The δ18O signature close to modern water observed there indicates an ongoing mixing between older less mobile deep groundwater and modern low-mineralized water recharge.
Figure 10 shows the conceptual model for the northern flow path. The effects of confined groundwater flow are noticeable in the geochemical dataset along the northern flow path. Similarly, to the southern flow path, two distinct water types are identified: modern low-mineralized water from recharge in HS-B2 and HS-B3 and the old slowly moving water found at the soil–bedrock interface. Their flow paths start to converge at the interface with most of the mixing commonly occurring in the confined aquifers at the base of the Quaternary sequence in HS-C. It is supposed herein that the modern water input in fractured aquifers in HS-C is minimal as the influence of a modern water input was unnoticed in the collected water samples. The deep fractured aquifers are recharged mainly in higher grounds of the flow path, where slow percolation through the low permeability layers allows for plenty of time for the cation exchange process to take place. The groundwater in these deep aquifers still has a signature of water from the last glacial era. In HS-C, which is the main discharge area in the watershed, due to the hydraulic gradient, the old water mixes with groundwater from less-confined granular aquifers. This mixed groundwater will slowly end up as a baseflow contribution to the Innisfil Creek.

5. Conclusions

The presented study represents a significant step towards a comprehensive understanding of the intricate groundwater dynamics within the aquifer system of the Innisfil watershed. By employing a multidisciplinary approach that integrates detailed hydrostratigraphy with hydrogeochemical and isotopic tracers, critical insights into the hydrological processes at play in this complex geological setting have been successfully unraveled. A substantial dataset was obtained from 61 groundwater samples collected and analyzed for major ions, among which 27 samples were further scrutinized through water-stable isotopes and/or radiocarbon dating. These analytical results played a pivotal role in discerning the primary hydrogeological pathways that govern groundwater flow within the Innisfil watershed. Two main flow paths with distinct hydrogeochemical evolutions have emerged. In the southern region of the watershed, we observed a complex interplay of unconfined aquifers at higher elevations and confined aquifers in downgradient areas. This juxtaposition of hydrogeological conditions facilitated the examination of shallow flow dynamics within granular aquifers and deep flow interactions, particularly at the interface between fractured rock aquifers and permeable soils situated at the base of the Quaternary sequence. Our findings underscore the intricate nature of the interactions between the shallow and deep flow paths. In the northern part of the watershed, where recharge and discharge areas coexist, we noted the prevalence of modern groundwater mixing with older counterparts. Meanwhile, in the southern flow path, where confined granular aquifers meet fractured aquifers, a distinct blending of waters from these distinct sources was observed. This delineation of major water-mixing zones in the watershed, particularly in interface aquifers (southern flow path) and confined granular aquifers (northern flow path), constitutes a pivotal contribution to our hydrogeological understanding. Looking forward, our conceptual groundwater flow model not only reinforces the identification of key recharge and discharge zones but also underscores their significance in the context of sustainable groundwater resource management. It is crucial to recognize that anthropic activities can exert increasing pressure on these aquifers, potentially jeopardizing their long-term viability as water sources. As such, it is imperative to consider further hydrochemical and stratigraphic research as a means of bolstering our knowledge base. To this end, future studies could benefit from expanded sampling efforts, capturing a more comprehensive spatial and temporal representation of the aquifer system to refine the proposed conceptual model. Moreover, the integration of advanced chemical analysis techniques and numerical modeling approaches could provide deeper insights into the intricacies of groundwater flow and chemical evolution within the watershed. This multifaceted research agenda would not only enhance our understanding of this complex aquifer but also aid in the development of sustainable management strategies to safeguard this critical natural resource for future generations.

Supplementary Materials

The following supporting information can be downloaded at: https://www.mdpi.com/article/10.3390/hydrology10110211/s1, Table S1: Isotopic dataset.

Author Contributions

Conceptualization, P.B. and N.B.; methodology, F.P.-B., P.B., R.P. and N.B.; formal analysis, F.P.-B.; investigation, F.P.-B. and R.P.; resources, P.B. and N.B.; data curation, F.P.-B., P.B. and N.B.; writing—original draft preparation, F.P.-B.; writing—review and editing, P.B., N.B., R.P., J.M.-D. and M.N.; visualization, F.P.-B. and M.N.; supervision, P.B. and N.B.; project administration, P.B. and N.B.; funding acquisition, P.B. and N.B. All authors have read and agreed to the published version of the manuscript.

Funding

This research received no external funding.

Data Availability Statement

The data presented in this study are available in Supplementary Material (Table S1).

Acknowledgments

The authors thank A. Bolduc, Y. Michaud and H. Russell for their support from the Groundwater Geoscience Program, Geological Survey of Canada, Natural Resources Canada. The authors are grateful to the four (4) anonymous reviewers for their insightful and valuable comments and suggestions that contributed to improve the manuscript.

Conflicts of Interest

The authors declare no conflict of interest.

References

  1. Mishra, A.K.; Singh, V.P. A review of drought concepts. J. Hydrol. 2010, 391, 204–216. [Google Scholar] [CrossRef]
  2. Palmer, M.A.; Lettenmaier, D.P.; Poff, N.L.; Postel, S.L.; Richter, B.; Warner, R. Climate Change and River Ecosystems: Protection and Adaptation Options. Environ. Manag. 2009, 44, 1053–1068. [Google Scholar] [CrossRef]
  3. Hoque, M.A.; Burgess, W.G. C-14 dating of deep groundwater in the Bengal Aquifer System, Bangladesh: Implications for aquifer anisotropy, recharge sources and sustainability. J. Hydrol. 2012, 444, 209–220. [Google Scholar] [CrossRef]
  4. Holysh, S.; Gerber, R. Groundwater knowledge management for southern Ontario: An example from the Oak Ridges Moraine. Can. Water Resour. J. 2014, 39, 240–253. [Google Scholar] [CrossRef]
  5. Cloutier, V.; Lefebvre, R.; Savard, M.; Bourque, E.; Therrien, R. Hydrogeochemistry and groundwater origin of the Basses-Laurentides sedimentary rock aquifer system, St. Lawrence lowlands, Quebec, Canada. Hydrogeol. J. 2006, 14, 573–590. [Google Scholar] [CrossRef]
  6. Langman, J.B.; Ellis, A.S. A multi-isotope (delta D, delta O-18, Sr-87/Sr-86, and delta B-11) approach for identifying saltwater intrusion and resolving groundwater evolution along the Western Caprock Escarpment of the Southern High Plains, New Mexico. Appl. Geochem. 2010, 25, 159–174. [Google Scholar] [CrossRef]
  7. Siebert, C.; Rosenthal, E.; Moeller, P.; Roediger, T.; Meiler, M. The hydrochemical identification of groundwater flowing to the Bet She’an-Harod multiaquifer system (Lower Jordan Valley) by rare earth elements, yttrium, stable isotopes (H, O) and Tritium. Appl. Geochem. 2012, 27, 703–714. [Google Scholar] [CrossRef]
  8. Montcoudiol, N.; Molson, J.; Lemieux, J.-M.; Cloutier, V. A conceptual model for groundwater flow and geochemical evolution in the southern Outaouais Region, Québec, Canada. Appl. Geochem. 2015, 58, 62–77. [Google Scholar] [CrossRef]
  9. Scholl, M.A.; Shanley, J.B.; Murphy, S.F.; Willenbring, J.K.; Occhi, M.; Gonzalez, G. Stable-isotope and solute-chemistry approaches to flow characterization in a forested tropical watershed, Luquillo Mountains, Puerto Rico. Appl. Geochem. 2015, 63, 484–497. [Google Scholar] [CrossRef]
  10. Masse-Dufresne, J.; Baudron, P.; Barbecot, F.; Patenaude, M.; Pontoreau, C.; Proteau-Bédard, F.; Menou, M.; Pasquier, P.; Veuille, S.; Barbeau, B. Anthropic and Meteorological Controls on the Origin and Quality of Water at a Bank Filtration Site in Canada. Water 2019, 11, 2510. [Google Scholar] [CrossRef]
  11. Cloutier, V.; Lefebvre, R.; Therrien, R.; Savard, M.M. Multivariate statistical analysis of geochemical data as indicative of the hydrogeochemical evolution of groundwater in a sedimentary rock aquifer system. J. Hydrol. 2008, 353, 294–313. [Google Scholar] [CrossRef]
  12. Beaudry, C.; Lefebvre, R.; Rivard, C.; Cloutier, V. Conceptual model of regional groundwater flow based on hydrogeochemistry (Monteregie Est, Quebec, Canada). Can. Water Resour. J. 2018, 43, 152–172. [Google Scholar] [CrossRef]
  13. Roy, J.W.; Bickerton, G.; Frank, R.A.; Grapentine, L.; Hewitt, L.M. Assessing Risks of Shallow Riparian Groundwater Quality Near an Oil Sands Tailings Pond. Groundwater 2016, 54, 545–558. [Google Scholar] [CrossRef] [PubMed]
  14. Baudron, P.; Sprenger, C.; Lorenzen, G.; Ronghang, M. Hydrogeochemical and isotopic insights into mineralization processes and groundwater recharge from an intermittent monsoon channel to an overexploited aquifer in eastern Haryana (India). Environ. Earth Sci. 2016, 75, 434. [Google Scholar] [CrossRef]
  15. Awaleh, M.O.; Boschetti, T.; Soubaneh, Y.D.; Baudron, P.; Kawalieh, A.D.; Dabar, O.A.; Ahmed, M.M.; Ahmed, S.I.; Daoud, M.A.; Egueh, N.M.; et al. Geochemical study of the Sakalol-Harralol geothermal field (Republic of Djibouti): Evidences of a low enthalpy aquifer between Manda-Inakir and Asal rift settings. J. Volcanol. Geotherm. Res. 2017, 331, 26–52. [Google Scholar] [CrossRef]
  16. Gagne, S.; Larocque, M.; Pinti, D.L.; Saby, M.; Meyzonnat, G.; Mejean, P. Benefits and limitations of using isotope-derived groundwater travel times and major ion chemistry to validate a regional groundwater flow model: Example from the Centre-du-Quebec region, Canada. Can. Water Resour. J. 2018, 43, 195–213. [Google Scholar] [CrossRef]
  17. Walter, J.; Chesnaux, R.; Gaboury, D.; Cloutier, V. Subsampling of Regional-Scale Database for improving Multivariate Analysis Interpretation of Groundwater Chemical Evolution and Ion Sources. Geosciences 2019, 9, 139. [Google Scholar] [CrossRef]
  18. Masse-Dufresne, J.; Barbecot, F.; Baudron, P.; Gibson, J. Quantifying floodwater impacts on a lake water budget via volume-dependent transient stable isotope mass balance. Hydrol. Earth Syst. Sci. 2021, 25, 3731–3757. [Google Scholar] [CrossRef]
  19. Awaleh, M.O.; Baudron, P.; Soubaneh, Y.D.; Boschetti, T.; Hoch, F.B.; Egueh, N.M.; Jalludin, M.; Omar Assowe, D.; Masse-Dufresne, J.; Gassani, J. Recharge, groundwater flow pattern and contamination processes in an arid volcanic area: Insights from isotopic and geochemical tracers (Bara aquifer system, Republic of Djibouti). J. Geochem. Explor. 2017, 175, 82–98. [Google Scholar] [CrossRef]
  20. Masse-Dufresne, J.; Baudron, P.; Barbecot, F.; Pasquier, P.; Barbeau, B. Optimizing short time-step monitoring and management strategies using environmental tracers at flood-affected bank filtration sites. Sci. Total Environ. 2021, 750, 141429. [Google Scholar] [CrossRef]
  21. Labelle, L.; Baudron, P.; Barbecot, F.; Bichai, F.; Masse-Dufresne, J. Identification of riverbank filtration sites at watershed scale: A geochemical and isotopic framework. Sci. Total Environ. 2023, 864, 160964. [Google Scholar] [CrossRef]
  22. Baudron, P.; Barbecot, F.; Aróstegui, J.L.G.; Leduc, C.; Travi, Y.; Martinez-Vicente, D. Impacts of human activities on recharge in a multilayered semiarid aquifer (Campo de Cartagena, SE Spain). Hydrol. Process. 2014, 28, 2223–2236. [Google Scholar] [CrossRef]
  23. Biehler, A.; Chaillou, G.; Buffin-Bélanger, T.; Baudron, P. Hydrological connectivity in the aquifer–river continuum: Impact of river stages on the geochemistry of groundwater floodplains. J. Hydrol. 2020, 590, 125379. [Google Scholar] [CrossRef]
  24. Edmunds, W.; Fellman, E.; Goni, I. Lakes, groundwater and palaeohydrology in the Sahel of NE Nigeria: Evidence from hydrogeochemistry. J. Geol. Soc. 1999, 156, 345–355. [Google Scholar] [CrossRef]
  25. Ma, R.; Zheng, C.; Tonkin, M.; Zachara, J.M. Importance of considering intraborehole flow in solute transport modeling under highly dynamic flow conditions. J. Contam. Hydrol. 2011, 123, 11–19. [Google Scholar] [CrossRef] [PubMed]
  26. Wang, L.; Gao, Z.; Horton, R.; Lenschow, D.H.; Meng, K.; Jaynes, D.B. An Analytical Solution to the One-Dimensional Heat Conduction–Convection Equation in Soil. Soil Sci. Soc. Am. J. 2012, 76, 1978. [Google Scholar] [CrossRef]
  27. Environment and Climate Change Canada Historical Climate Data (a). Available online: https://climate.weather.gc.ca/index_e.html (accessed on 3 November 2023).
  28. Environment and Climate Change Canada Historial Climate Data (b). Available online: https://wateroffice.ec.gc.ca/index_e.html (accessed on 3 November 2023).
  29. Mulligan, R.P.M.; Eyles, C.H.; Bajc, A.F. Stratigraphic analysis of Late Wisconsin and Holocene glaciolacustrine deposits exposed along the Nottawasaga River, southern Ontario, Canada. Can. J. Earth Sci. 2018, 55, 863–885. [Google Scholar] [CrossRef]
  30. Russell, H.A.J.; Arnaud, E.; Bajc, A.F.; Sharpe, D.R. Quaternary geology of southern Ontario and applications to hydrogeology. Can. J. Earth Sci. 2018, 55, V–VIII. [Google Scholar] [CrossRef]
  31. Benoit, N.; Marcotte, D.; Boucher, A.; D’Or, D.; Bajc, A.; Rezaee, H. Directional hydrostratigraphic units simulation using MCP algorithm. Stoch. Environ. Res. Risk Assess. 2018, 32, 1435–1455. [Google Scholar] [CrossRef]
  32. Matrix Solutions; Blumetric Environmental. Innisfil Creek Drought Management Plan Pilot; Matrix Solutions INC.; Blumetric Environmental INC.: Guelph, ON, Canada, 2017. [Google Scholar]
  33. Bajc, A.F.; Mulligan, R.P.M.; Dodge, J.E.P. GRS018: Three-Dimensional Mapping of Surficial Deposits in the Southern Part of the County of Simcoe, South-Central Ontario. 2019. Available online: http://www.geologyontario.mndm.gov.on.ca/mndmfiles/pub/data/records/GRS018.html (accessed on 8 October 2023).
  34. Russell, H.A.J.; Arnott, R.W.C.; Sharpe, D.R. Evidence for rapid sedimentation in a tunnel channel, Oak Ridges Moraine, southern Ontario, Canada. Sediment. Geol. 2003, 160, 33–55. [Google Scholar] [CrossRef]
  35. Proteau-Bedard, F.; Baudron, P.; Benoit, N.; Post, R.; Mills, A. Progressing toward an understanding of groundwater geochemistry of Innisfil Creek watershed, southern Ontario. In Southern Ontario Groundwater Project 2014–2019 Summary Report; Russell, H.A.J., Kjarsgaard, B.A., Eds.; Natural Resources Canada: Ottawa, ON, Canada, 2020. [Google Scholar]
  36. Plummer, L.; Prestemon, E.; Parkhurst, D. Netpath—An interactive code for interpreting net geochemical reactions from chemical and isotopic data along a flow path. In Proceedings of the Water-Rock Interaction, Vols 1 and 2: Vol 1: Low Temperature Environments; Vol 2: Moderate and High Temperate Environments; Kharaka, Y.K., Maest, A.S., Eds.; A A Balkema: Rotterdam, The Netherlands, 1992; pp. 239–242. [Google Scholar]
  37. Aravena, R.; Wassenaar, L.; Plummer, L. Estimating C-14 groundwater ages in a methanogenic aquifer. Water Resour. Res. 1995, 31, 2307–2317. [Google Scholar] [CrossRef]
  38. Han, L.F.; Plummer, L.N. A review of single-sample-based models and other approaches for radiocarbon dating of dissolved inorganic carbon in groundwater. Earth-Sci. Rev. 2016, 152, 119–142. [Google Scholar] [CrossRef]
  39. Vautour, G.; Pinti, D.L.; Méjean, P.; Saby, M.; Meyzonnat, G.; Larocque, M.; Castro, M.C.; Hall, C.M.; Boucher, C.; Roulleau, E.; et al. 3H/3He, 14C and (U–Th)/He groundwater ages in the St. Lawrence Lowlands, Quebec, Eastern Canada. Chem. Geol. 2015, 413, 94–106. [Google Scholar] [CrossRef]
  40. Birks, S.J.; Fennell, J.W.; Gibson, J.J.; Yi, Y.; Moncur, M.C.; Brewster, M. Using regional datasets of isotope geochemistry to resolve complex groundwater flow and formation connectivity in northeastern Alberta, Canada. Appl. Geochem. 2019, 101, 140–159. [Google Scholar] [CrossRef]
  41. Baudron, P. Assessing Groundwater Residence Time in a Highly Anthropized Unconfined Aquifer Using Bomb Peak 14C and Reconstructed Irrigation Water 3H. Radiocarbon 2013, 55, 993–1006. [Google Scholar] [CrossRef]
Figure 1. Innisfil watershed, spatial distribution of the physiographic zones and general flow directions (see Figure 2b for cross-section A-A’).
Hydrology 10 00211 g001
Figure 2. (a) Simplified hydrostratigraphic units distribution of the Innisfil watershed (after Bajc, Mulligan [25] and Benoit, Marcotte [23]), and (b) typical hydrostratigraphic sequences.
Hydrology 10 00211 g002
Figure 3. Location of the groundwater samples (sampled wells) according to the field surveys.
Hydrology 10 00211 g003
Figure 4. Level of confinement in the Innisfil watershed and spatial location of regional hydrogeological physiographic zones.
Hydrology 10 00211 g004
Figure 5. Piper diagram of the dataset. Confinement levels are identified by the different markers, and the hydrostratigraphic units (HSUs) are identified by the different colors. Overall geochemical evolution pattern is depicted by the dashed arrow. Water type evolves from Ca-HCO3 water type (in unconfined to low-confinement aquifers) to Na-HCO3 water type (in medium-confinement aquifers) due to cation exchange, and finally mixes with highly mineralized Na-Cl water type (in high-confinement aquifers).
Hydrology 10 00211 g005
Figure 6. (a) δ18O vs. δ2H; (b) tritium vs. δ18O. Confinement levels are identified by the different markers, and the hydrostratigraphic units (HSUs) are identified by the different colors. Local meteoritic water line (LMWL) from Simcoe station is used as reference and obtained from the Global Network of Isotopes in Precipitation (GNIP).
Hydrology 10 00211 g006
Figure 7. Radiocarbon age vs. δ18O-H2O. Confinement levels are identified by the different markers, and the hydrostratigraphic units (HSUs) are identified by the different colors. Encircled data (U1) denote samples for which mixing between old and modern (i.e., radiocarbon corrected age ~0 years BP) groundwaters is hypothesized.
Hydrology 10 00211 g007
Figure 8. Na/Ca meq/L ratio vs. TDS for the watershed (a), for the southern flow path only (b), for the northern flow path only (c) and Na/Ca meq/L ratio vs. δ18O (d). Confinement levels are identified by the different markers, and the hydrostratigraphic units (HSUs) are identified by the different colors.
Hydrology 10 00211 g008
Figure 9. Conceptual model for the southern flow path.
Hydrology 10 00211 g009
Figure 10. Conceptual model for the northern flow path.
Hydrology 10 00211 g010
Disclaimer/Publisher’s Note: The statements, opinions and data contained in all publications are solely those of the individual author(s) and contributor(s) and not of MDPI and/or the editor(s). MDPI and/or the editor(s) disclaim responsibility for any injury to people or property resulting from any ideas, methods, instructions or products referred to in the content.

