
Locating Potential Groundwater Pathways in a Fringing Reef Using Continuous Electrical Resistivity Profiling
Abstract
:1. Introduction
Geology and Sedimentary Facies of Fringing Reefs
2. Material and Methods
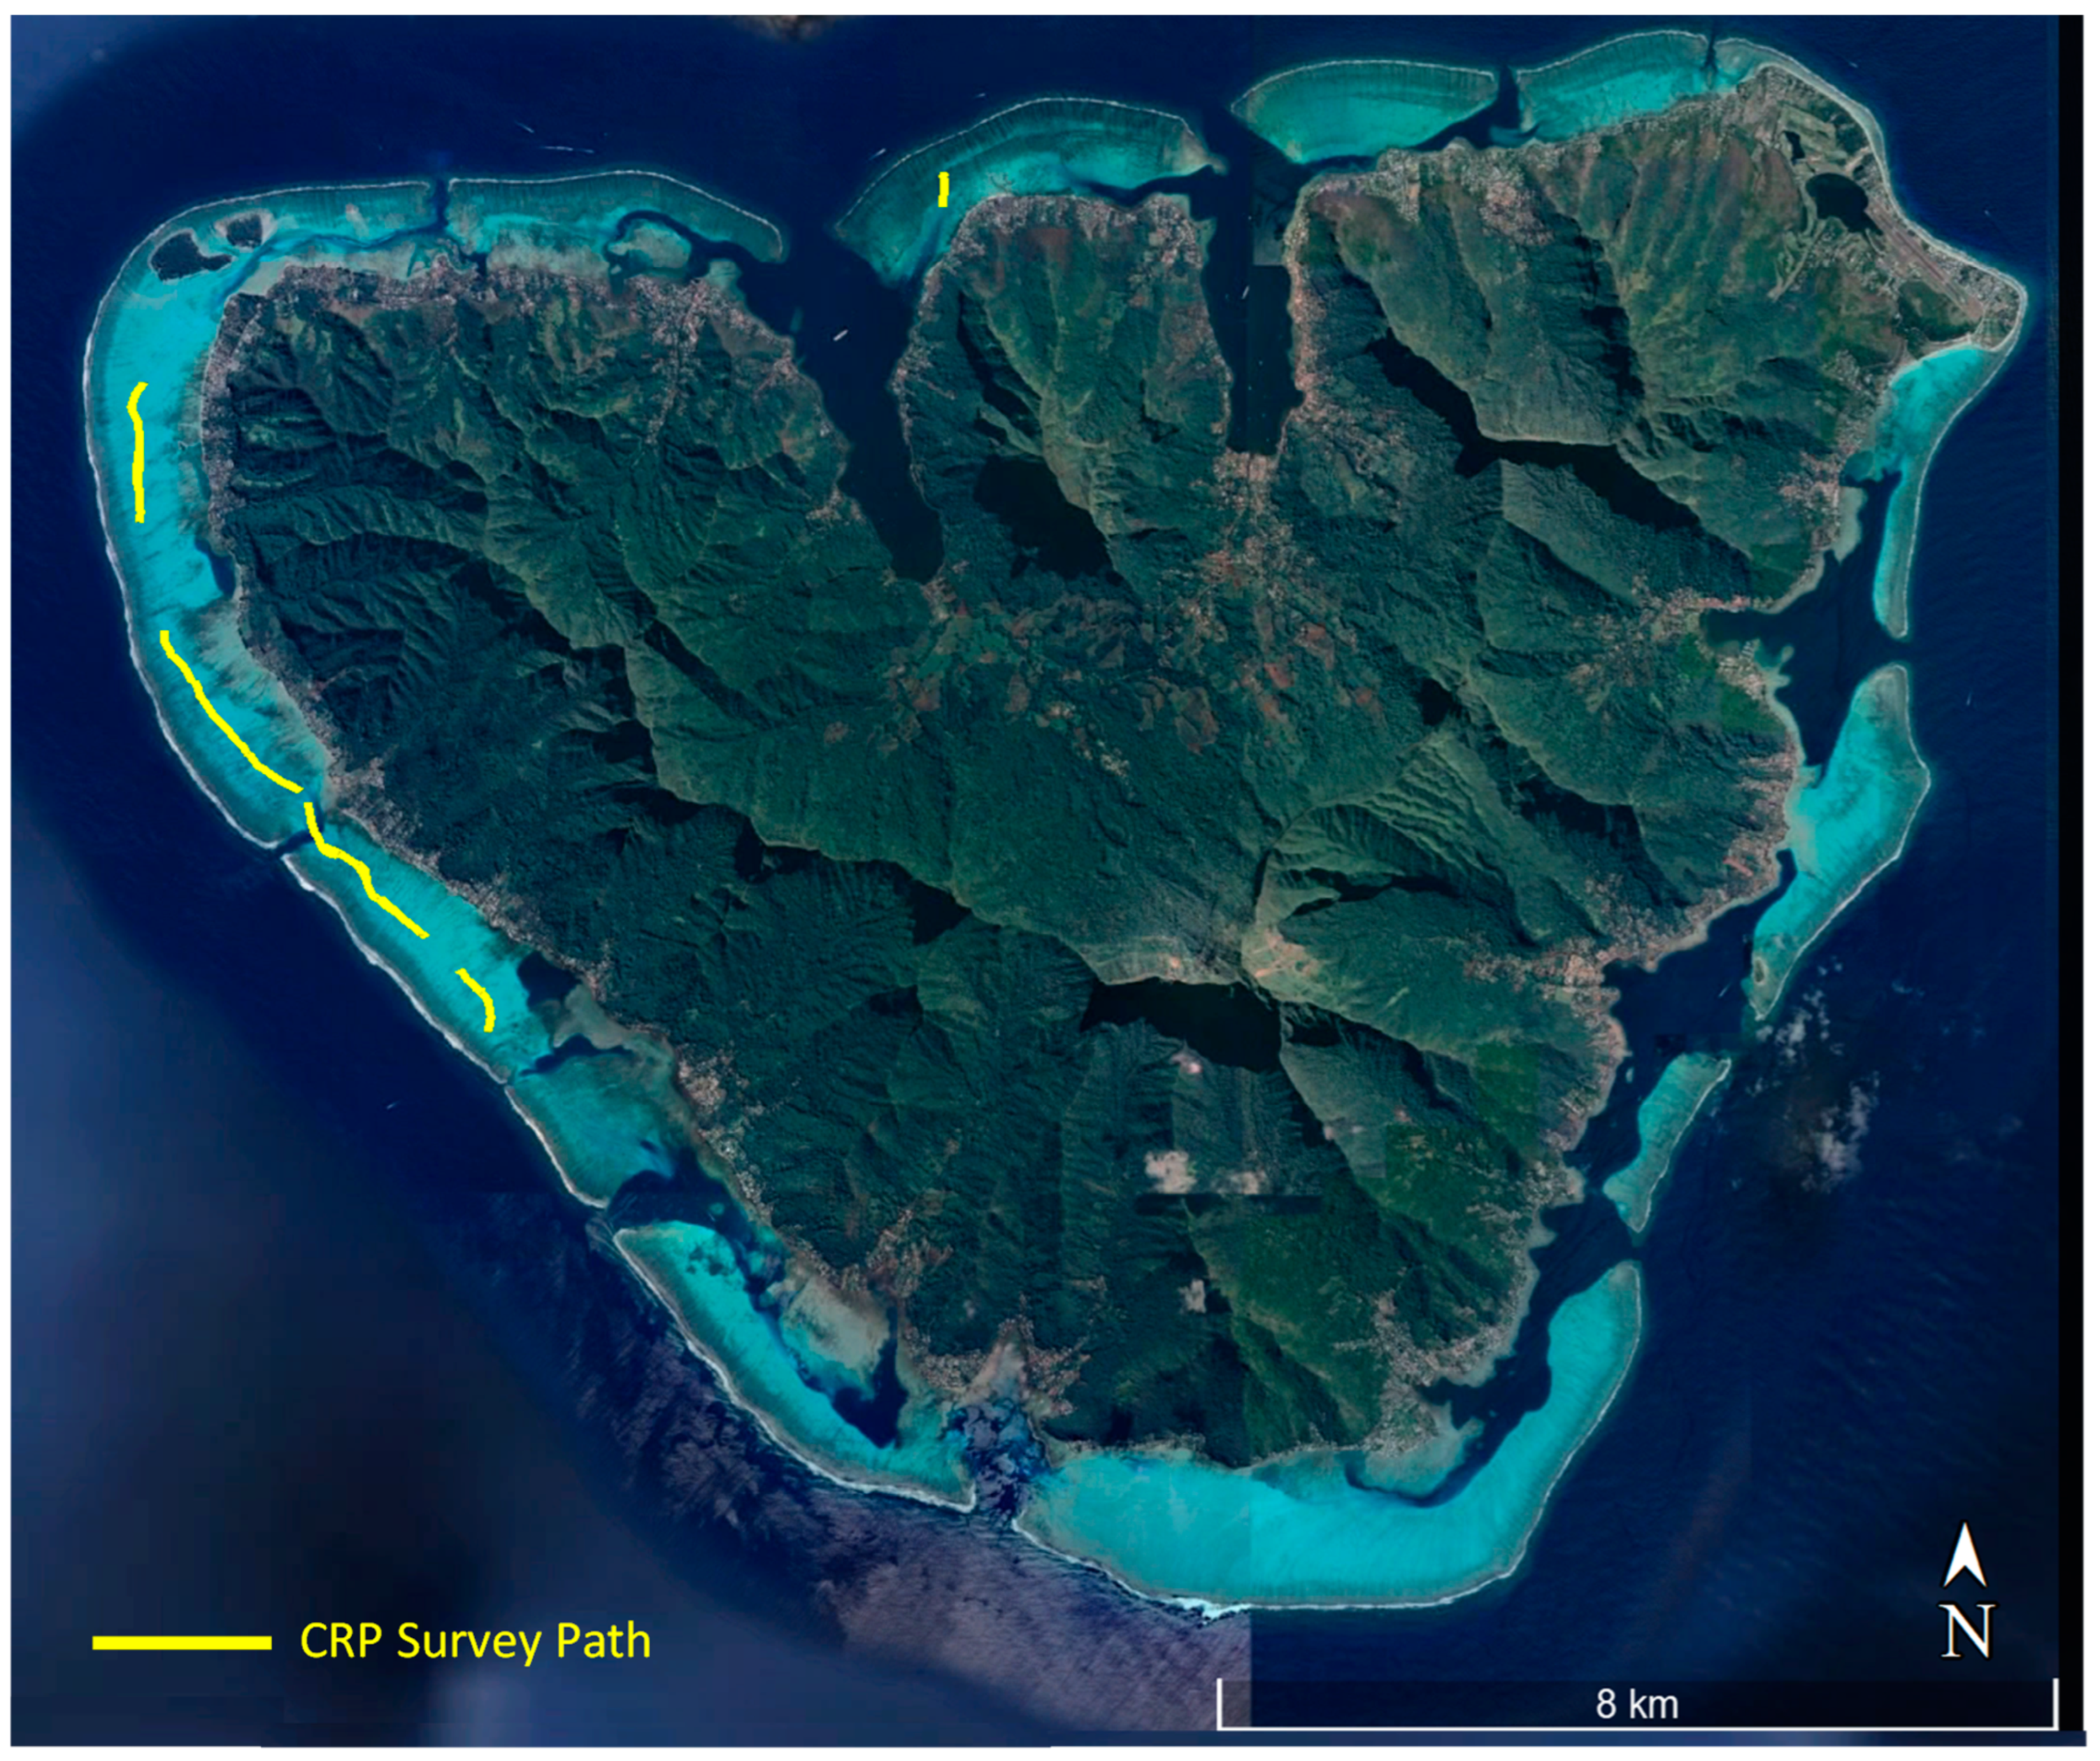
2.1. Study Site
2.2. Electrical Resistivity Tomography
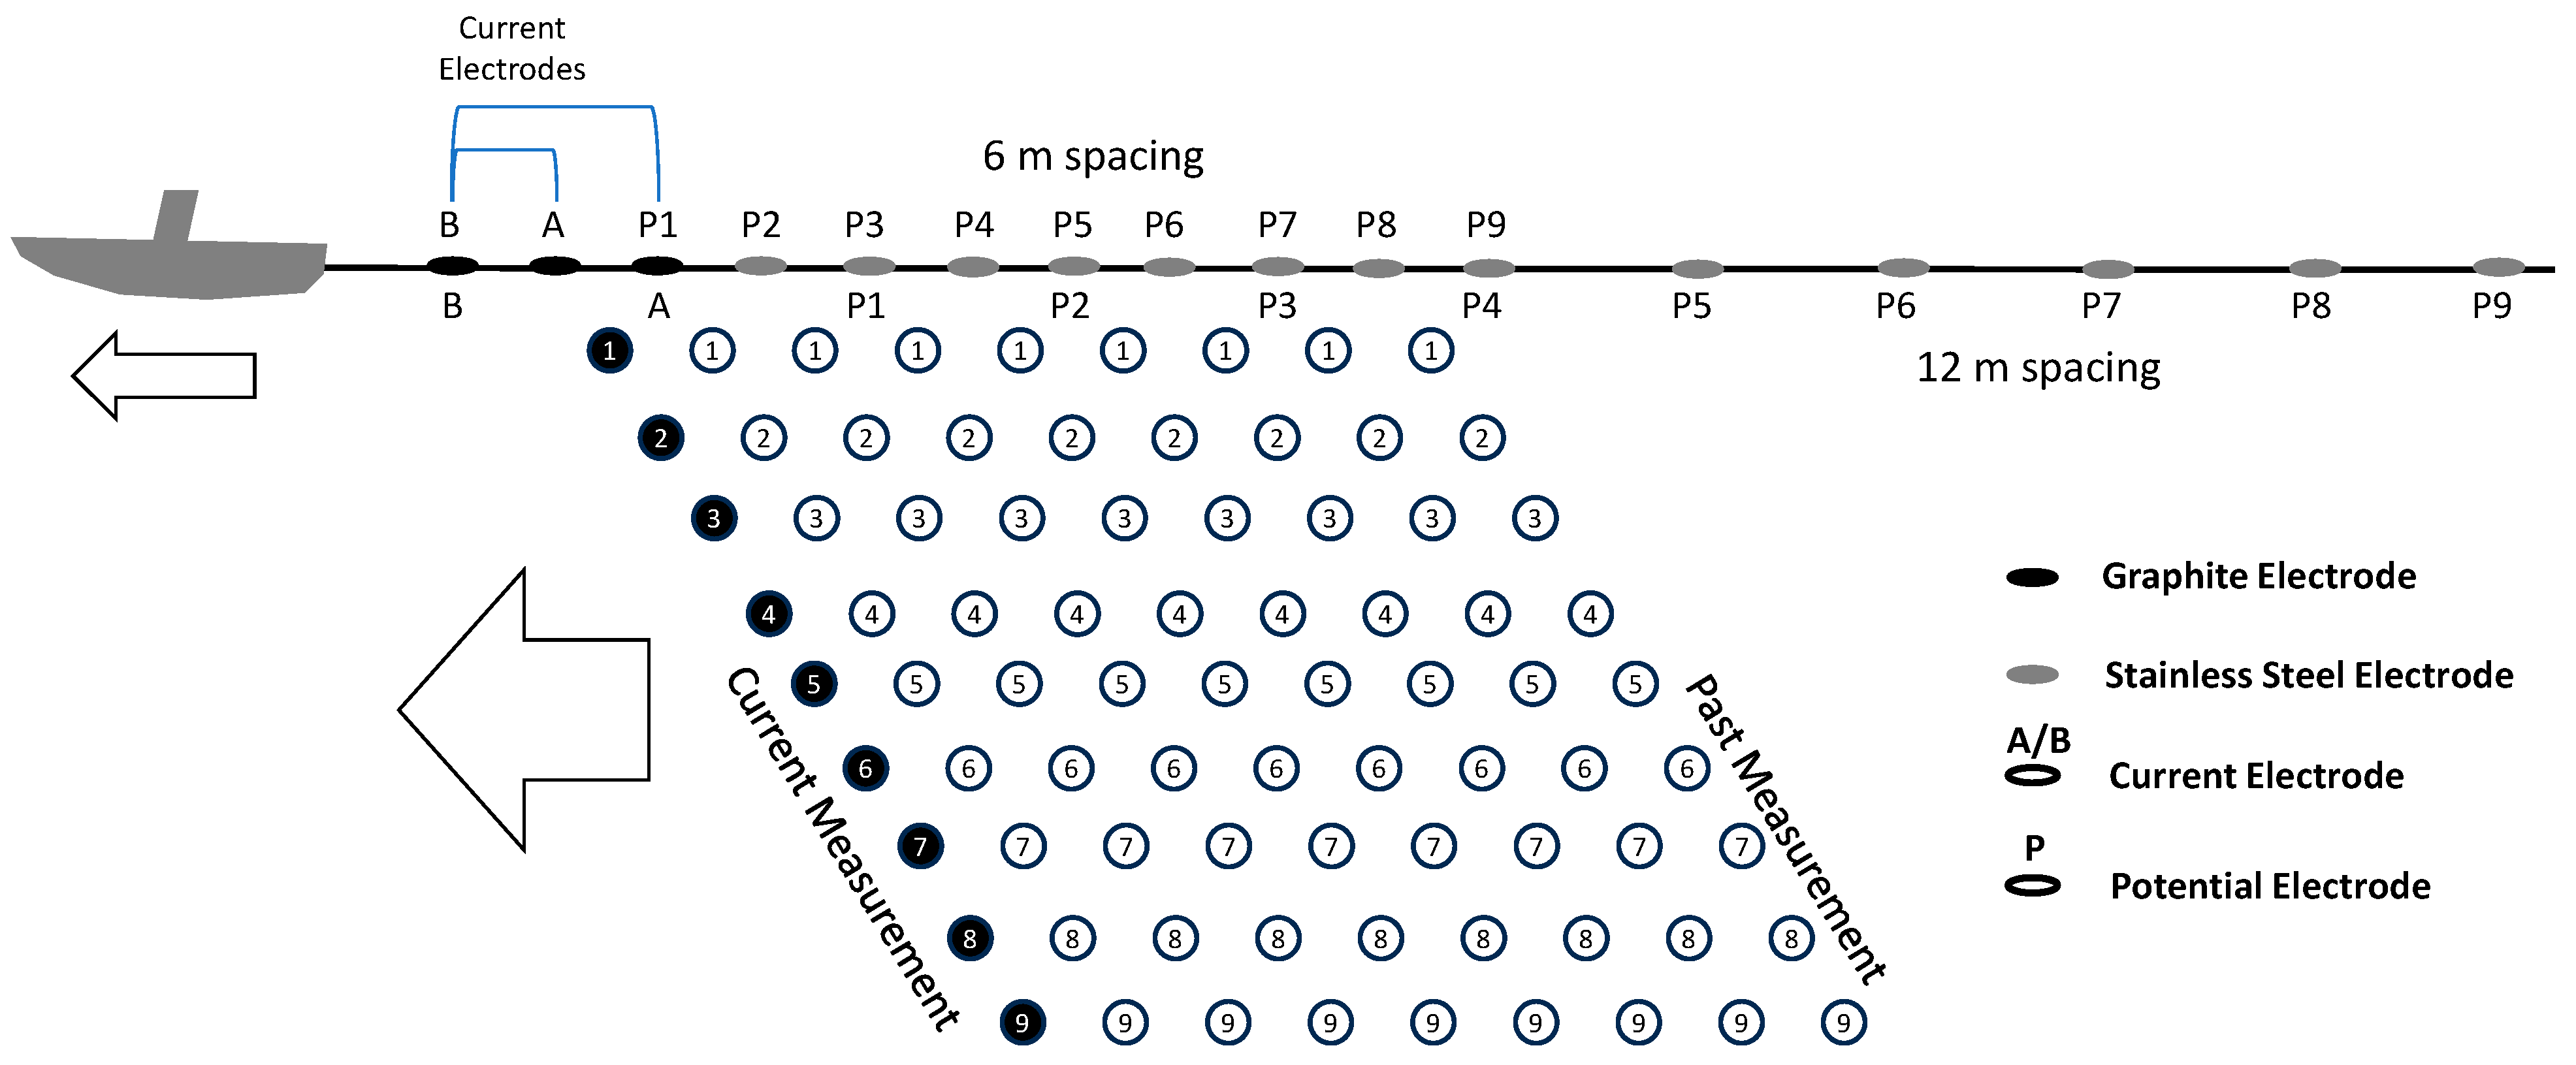
2.3. Boat-Towed Continuous Electrical Resistivity Profiling (CRP)
2.4. Inversion of ER Tomography Data
2.5. Archie’s Law
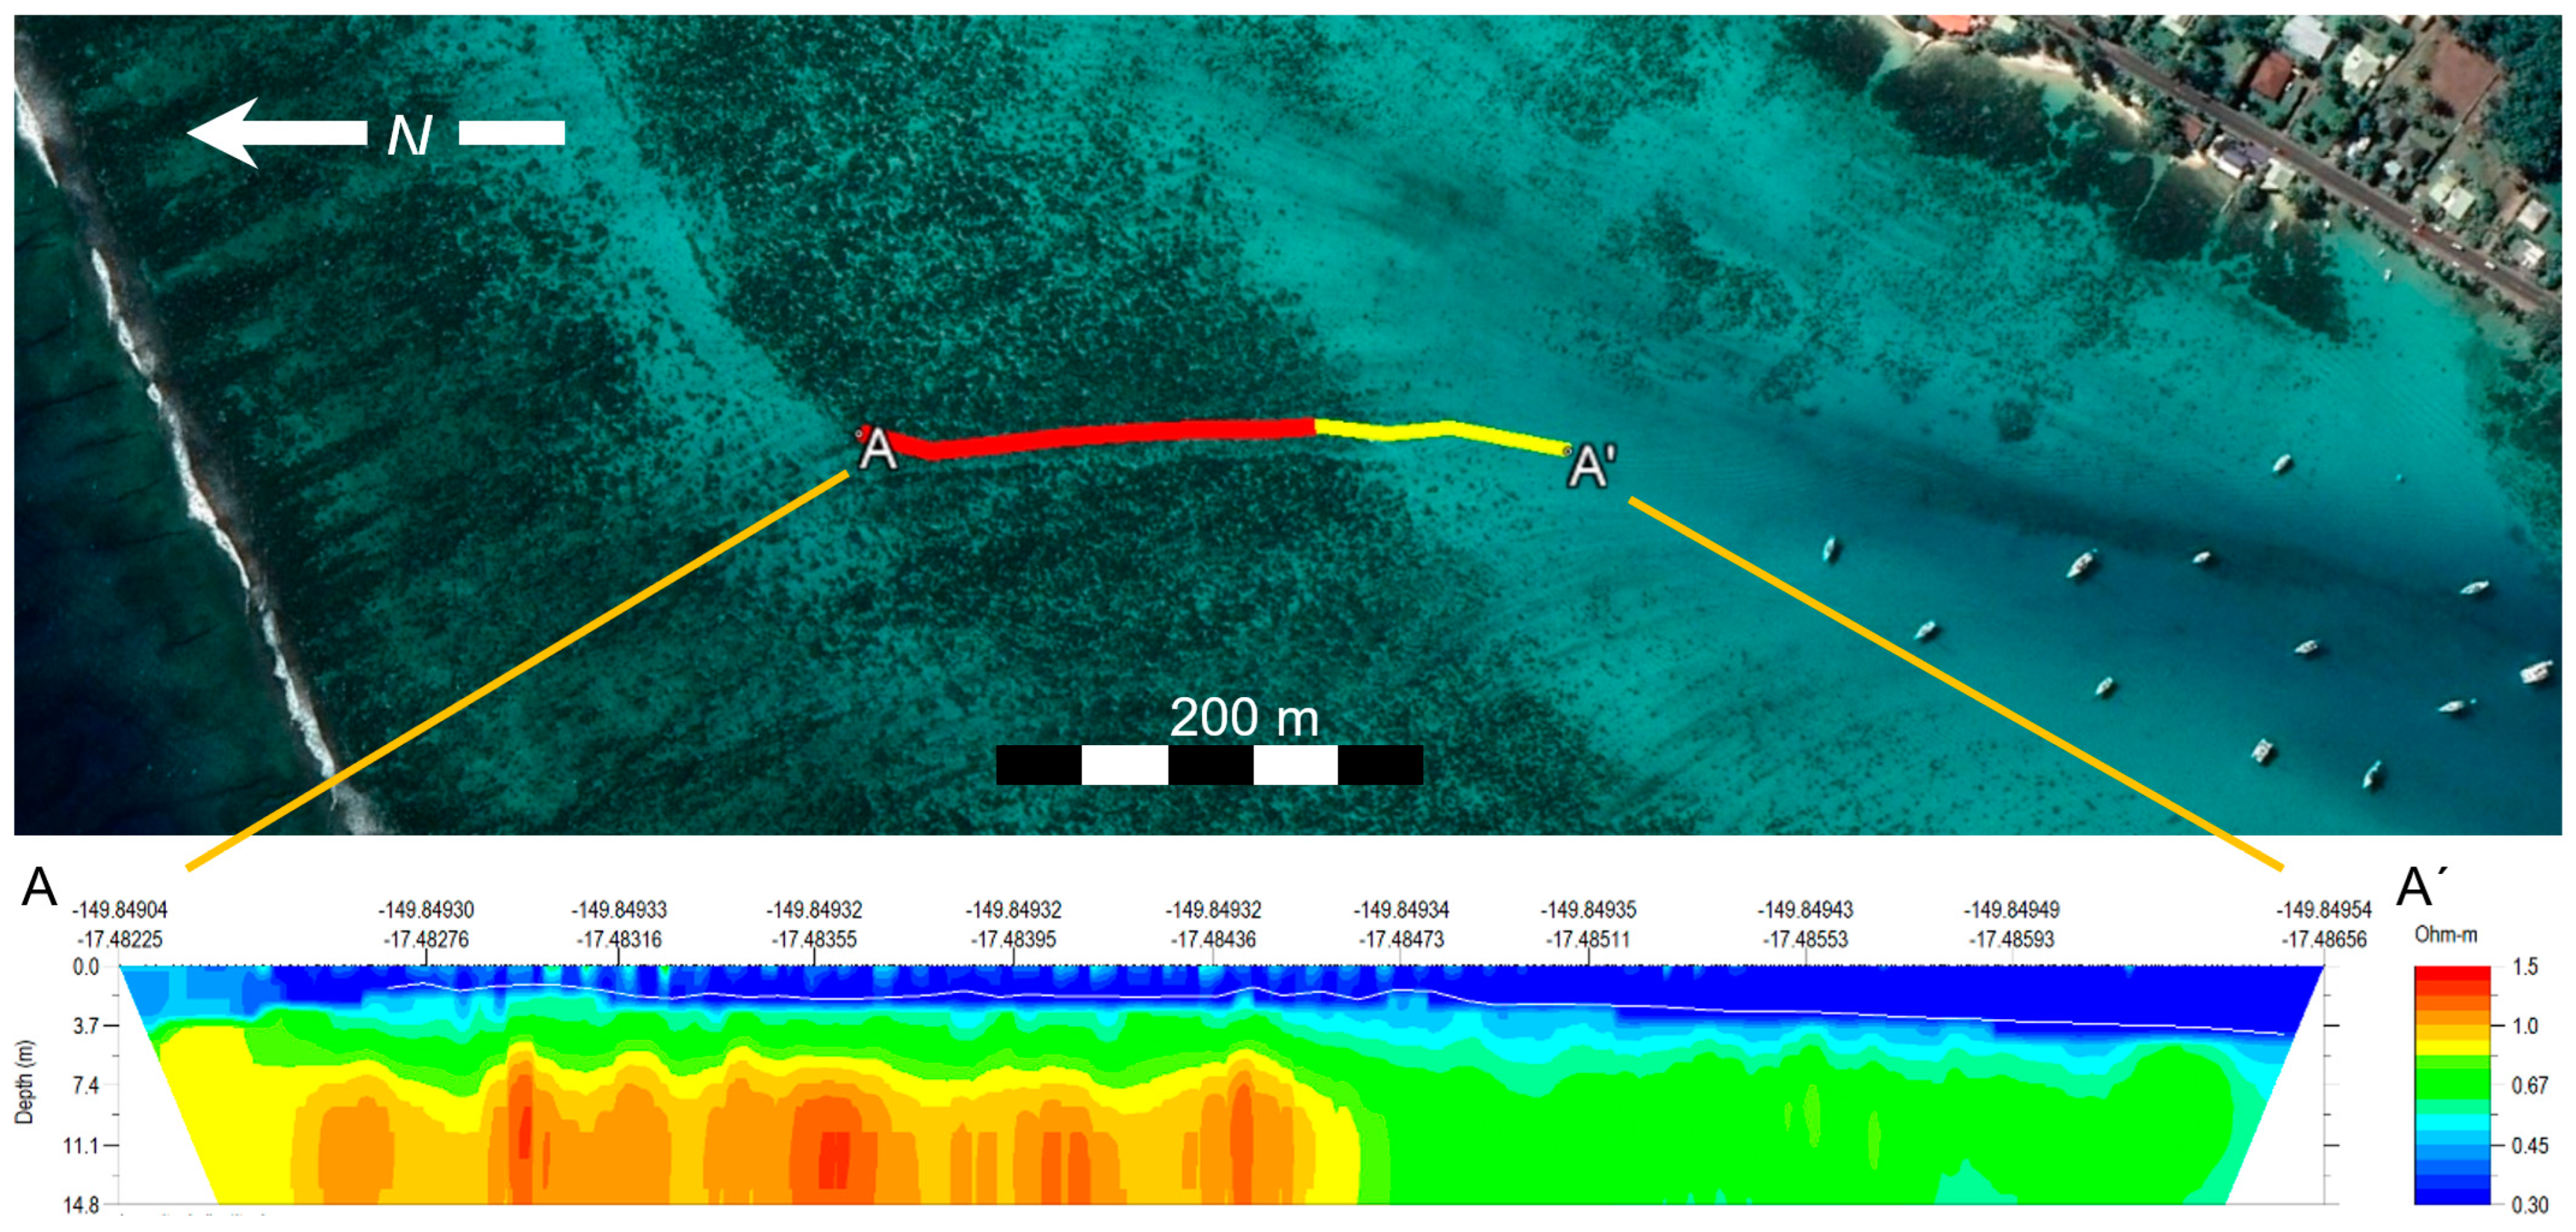
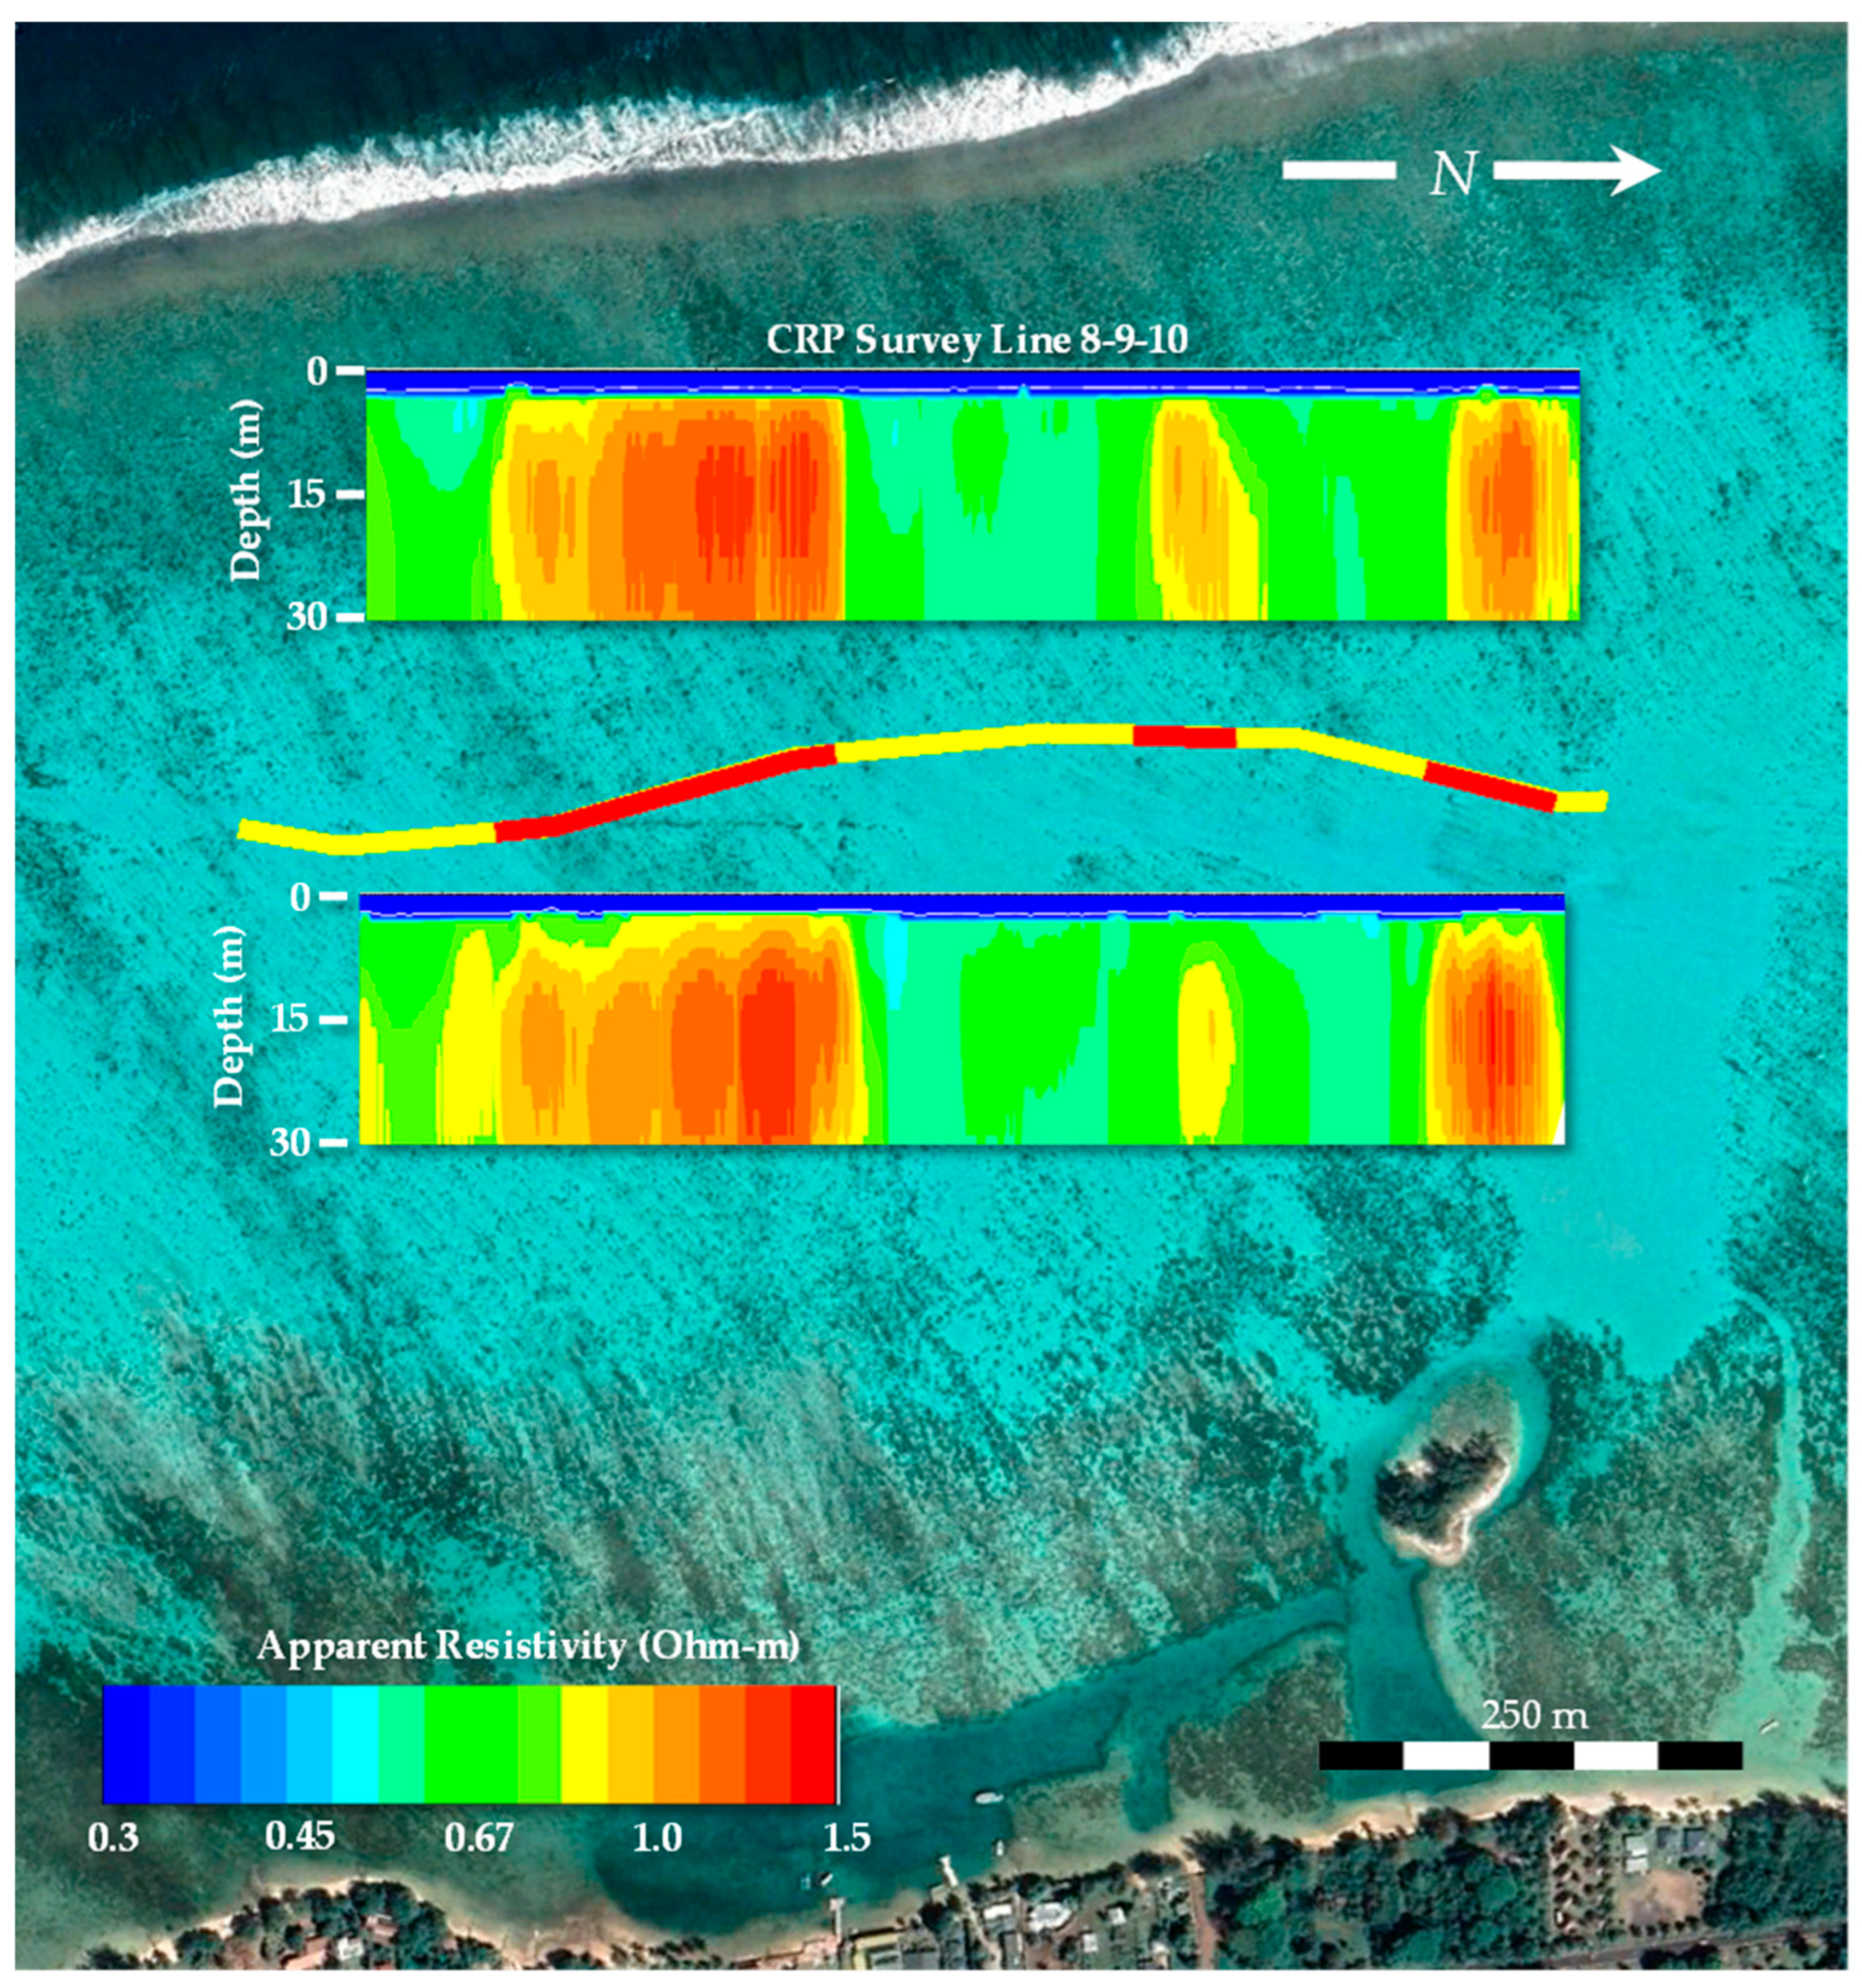
3. Results
4. Discussion
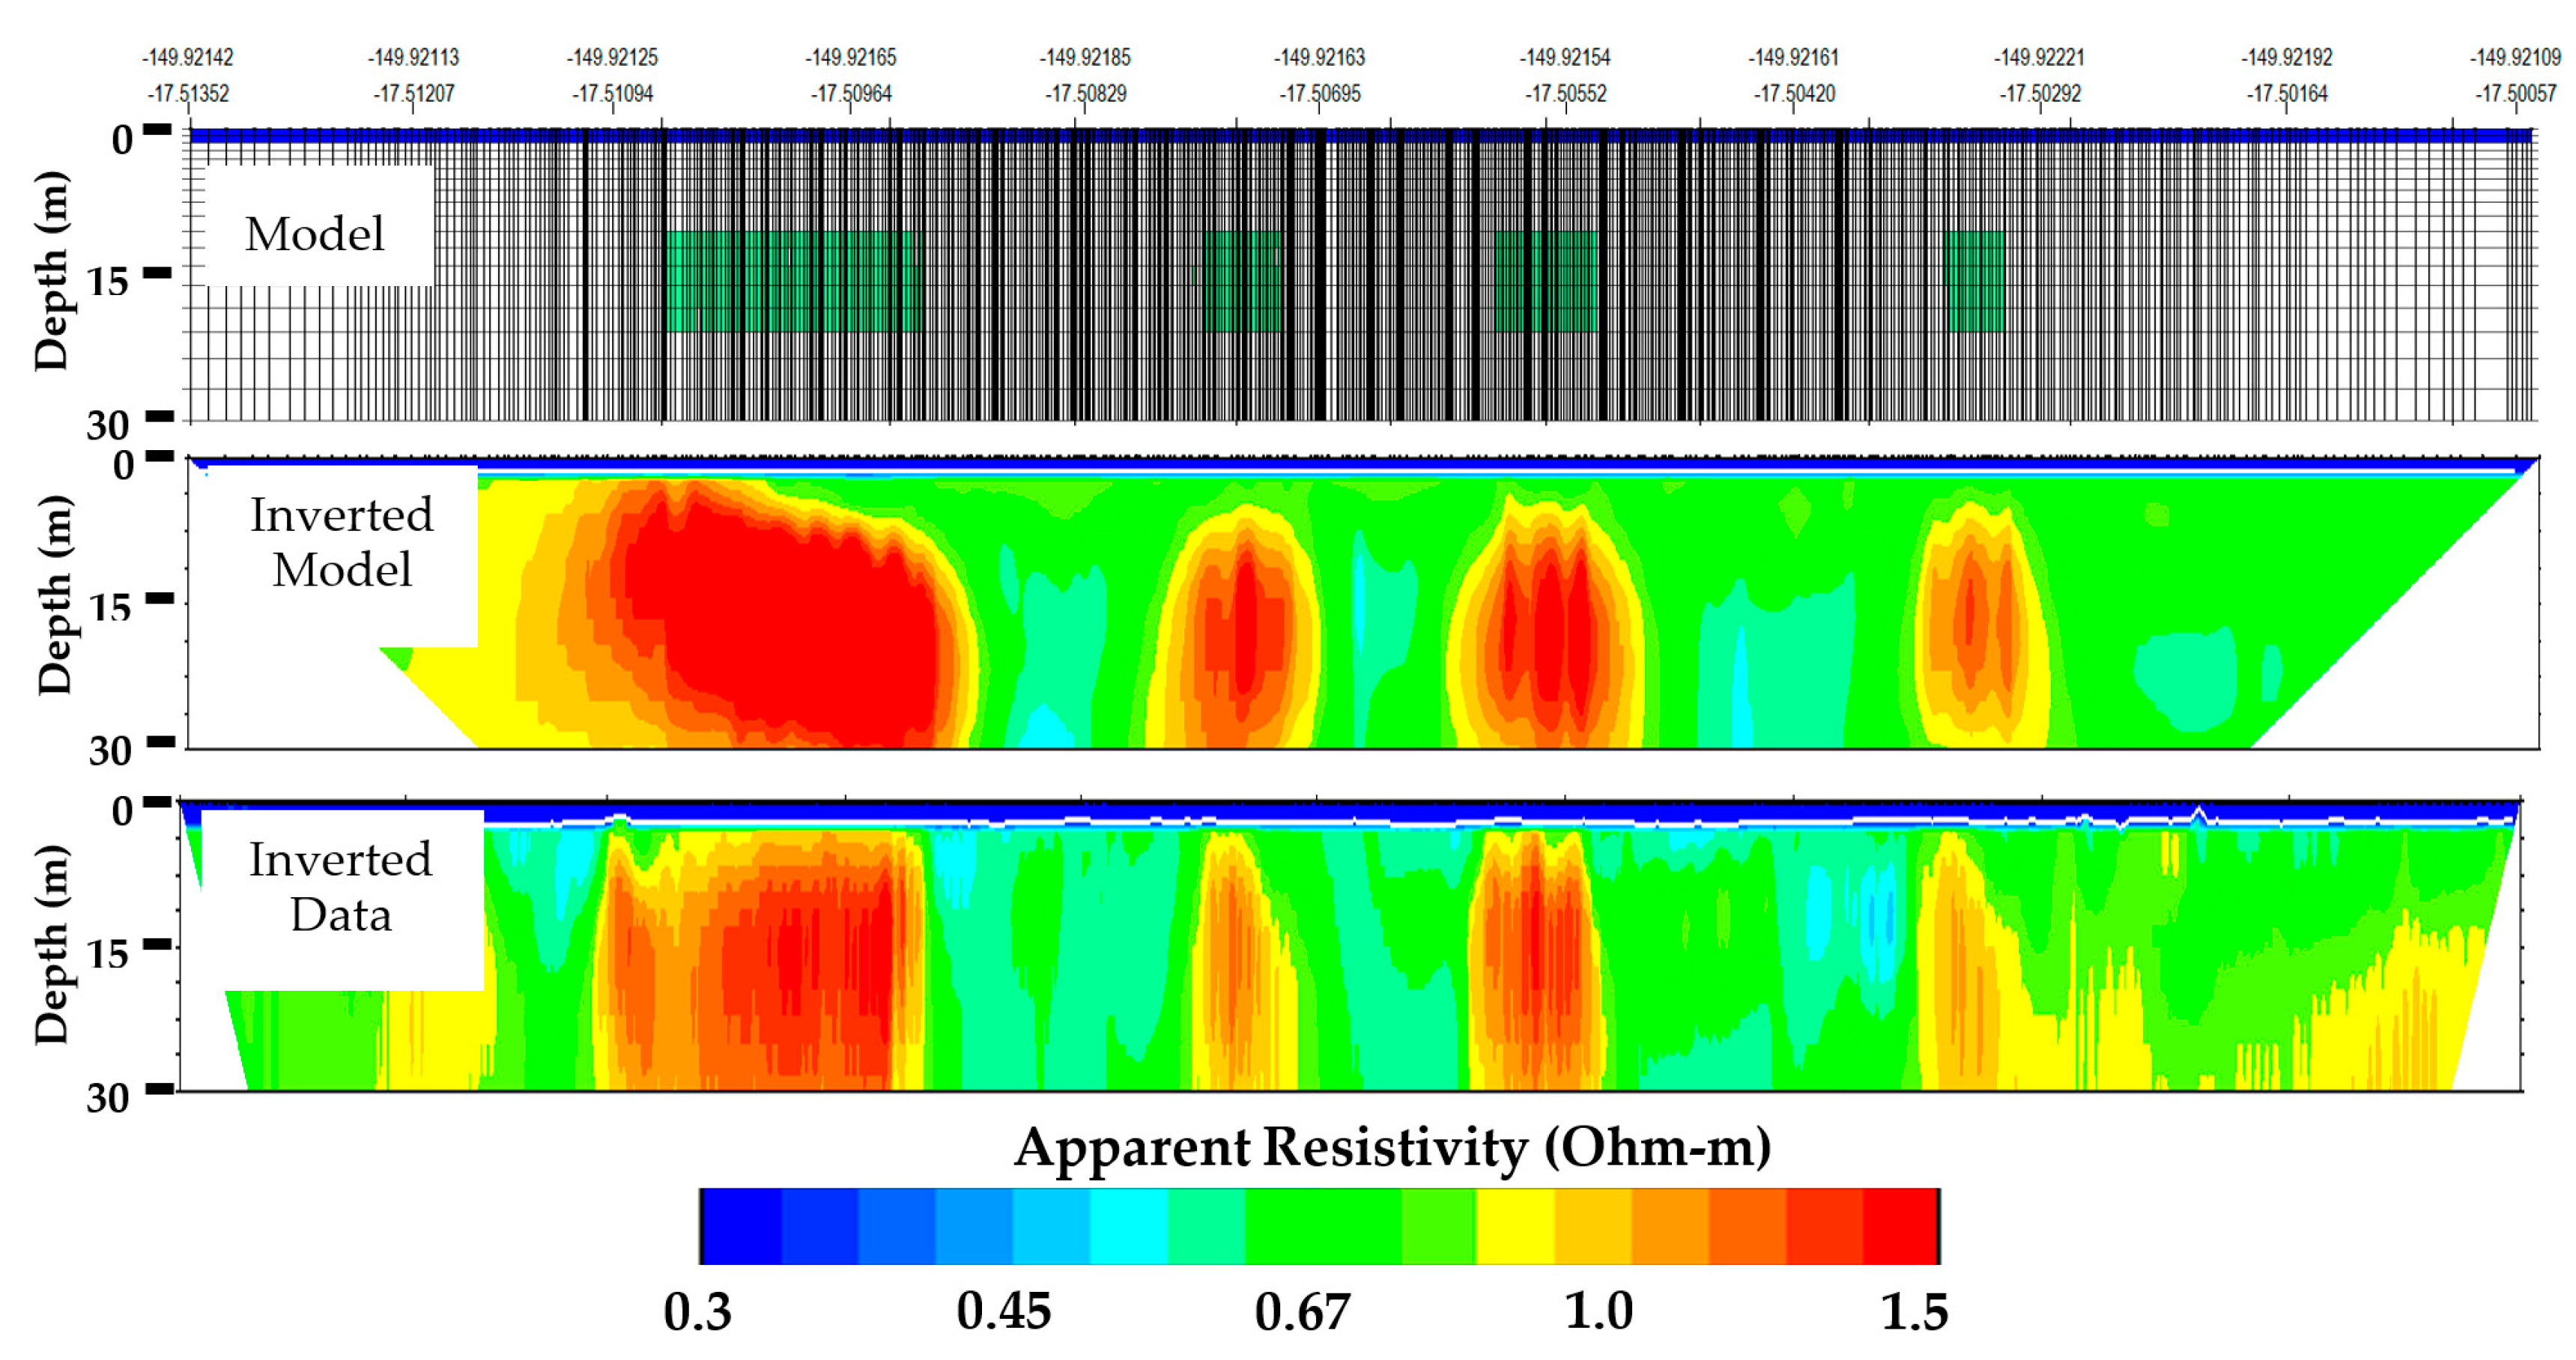
4.1. ERT Sensitivity to Resistivity Anomalies
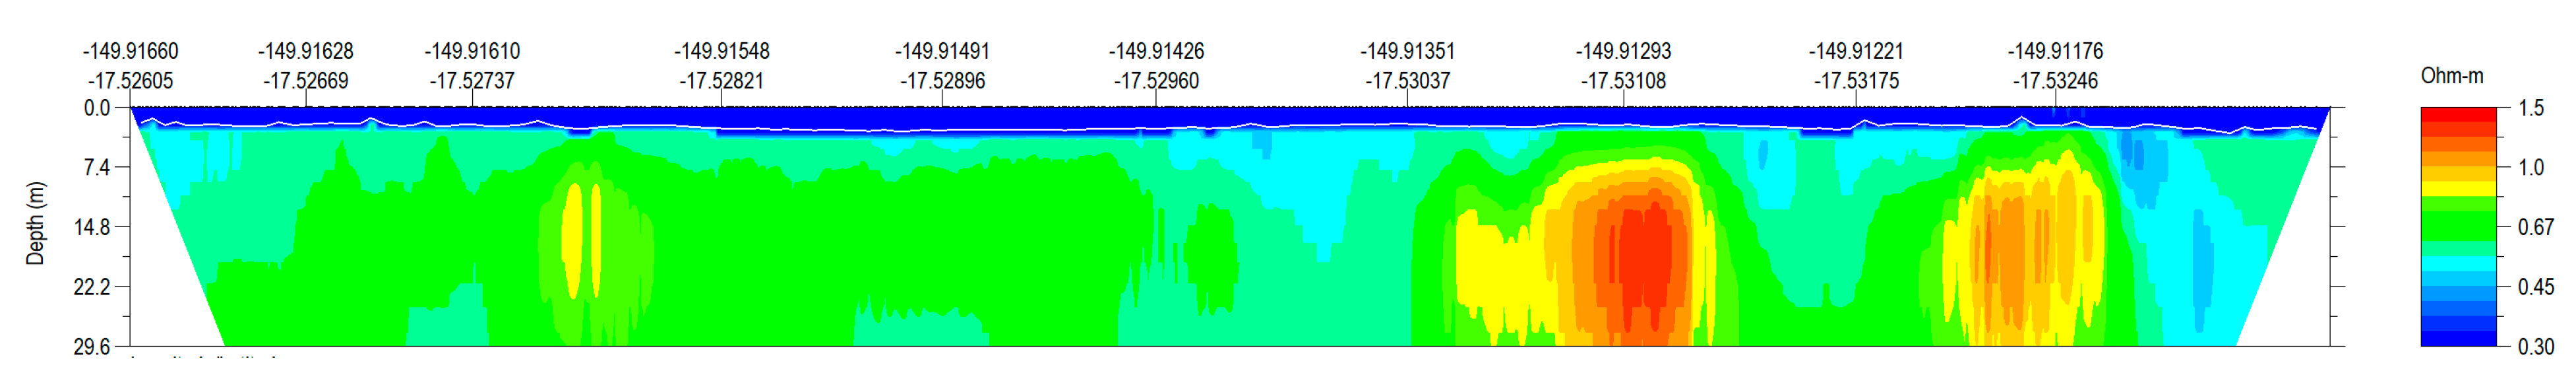
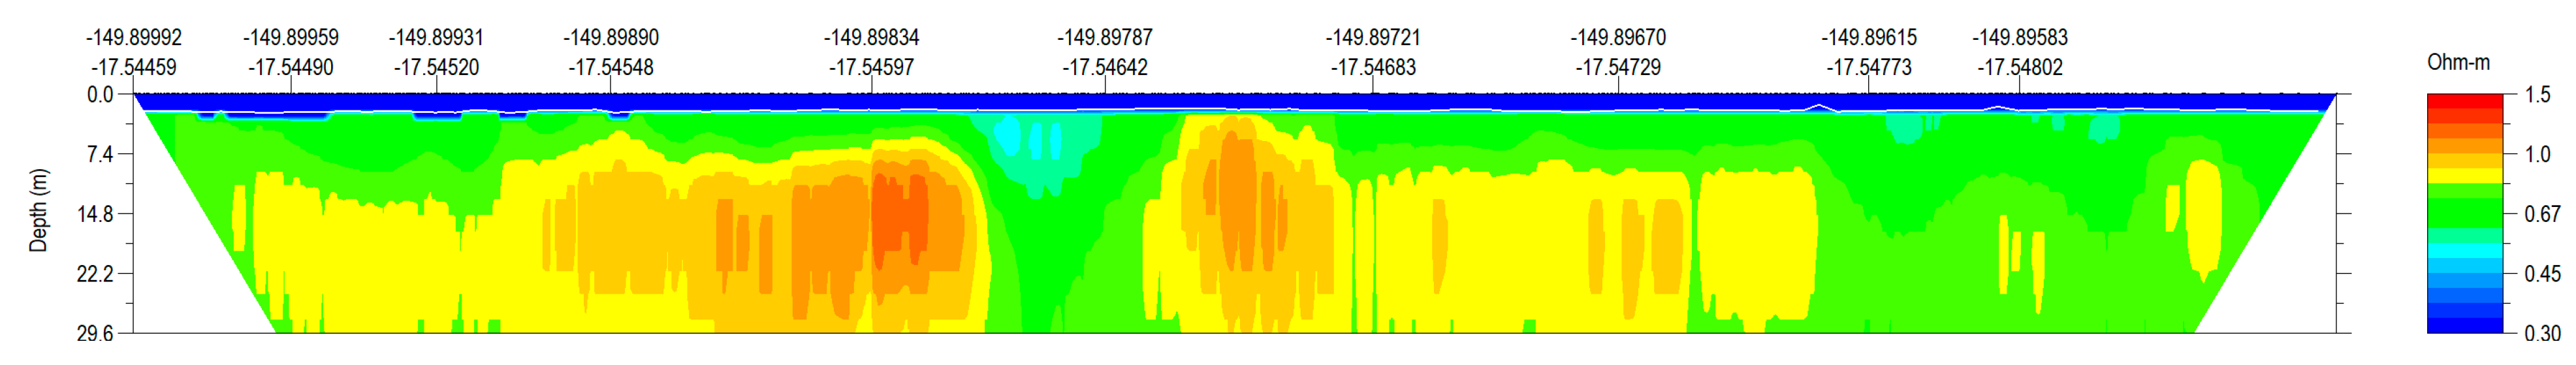
4.2. Interpretation of the CRP Profiles
4.2.1. Resistive Heterogeneity Explained by Porosity Variation
4.2.2. Resistive Heterogeneity Explained by Porewater Salinity
5. Conclusions
Supplementary Materials
Author Contributions
Funding
Data Availability Statement
Acknowledgments
Conflicts of Interest
References
- Starke, C.; Ekau, W.; Moosdorf, N. Enhanced Productivity and Fish Abundance at a Submarine Spring in a Coastal Lagoon on Tahiti, French Polynesia. Front. Mar. Sci. 2020, 6, 809. [Google Scholar] [CrossRef]
- Kennedy, D.; Woodroffe, C. Fringing reef growth and morphology: A review. Earth-Sci. Rev. 2002, 57, 255–277. [Google Scholar] [CrossRef]
- Carlson, R.R.; Foo, S.A.; Asner, G.P. Land Use Impacts on Coral Reef Health: A Ridge-to-Reef Perspective. Front. Mar. Sci. 2019, 6, 562. [Google Scholar] [CrossRef]
- Bishop, J.M.; Glenn, C.R.; Amato, D.W.; Dulai, H. Effect of land use and groundwater flow path on submarine groundwater discharge nutrient flux. J. Hydrol. Reg. Stud. 2017, 11, 194–218. [Google Scholar] [CrossRef]
- Moosdorf, N.; Oehler, T. Societal use of fresh submarine groundwater discharge: An overlooked water resource. Earth-Sci. Rev. 2017, 171, 338–348. [Google Scholar] [CrossRef]
- Johnson, A.G.; Glenn, C.R.; Burnett, W.C.; Peterson, R.N.; Lucey, P.G. Aerial infrared imaging reveals large nutrient-rich groundwater inputs to the ocean. Geophys. Res. Lett. 2008, 35. [Google Scholar] [CrossRef]
- Oehler, T.; Bakti, H.; Lubis, R.F.; Purwoarminta, A.; Delinom, R.; Moosdorf, N. Nutrient dynamics in submarine groundwater discharge through a coral reef (western Lombok, Indonesia). Limnol. Oceanogr. 2019, 64, 2646–122661. [Google Scholar] [CrossRef]
- Brosnan, T.; Becker, M.W.; Lipo, C. Coastal groundwater discharge and the ancient inhabitants of Rapa Nui (Easter Island), Chile. Hydrogeol. J. 2018, 27, 519–534. [Google Scholar] [CrossRef]
- Knee, K.L.; Crook, E.D.; Hench, J.L.; Leichter, J.J.; Paytan, A. Assessment of Submarine Groundwater Discharge (SGD) as a Source of Dissolved Radium and Nutrients to Moorea (French Polynesia) Coastal Waters. Estuaries Coasts 2016, 39, 1651–1668. [Google Scholar] [CrossRef]
- Hagedorn, B.; Becker, M.W.; Silbiger, N.J. Evidence of freshened groundwater below a tropical fringing reef. Hydrogeol. J. 2020, 28, 2501–2517. [Google Scholar] [CrossRef]
- Street, J.H.; Knee, K.L.; Grossman, E.E.; Paytan, A. Submarine groundwater discharge and nutrient addition to the coastal zone and coral reefs of leeward Hawai’i. Mar. Chem. 2008, 109, 355–376. [Google Scholar] [CrossRef]
- Oehler, T.; Tamborski, J.; Rahman, S.; Moosdorf, N.; Ahrens, J.; Mori, C.; Neuholz, R.; Schnetger, B.; Beck, M. DSi as a Tracer for Submarine Groundwater Discharge. Front. Mar. Sci. 2019, 6, 563. [Google Scholar] [CrossRef]
- Nelson, C.E.; Donahue, M.J.; Dulaiova, H.; Goldberg, S.J.; La Valle, F.F.; Lubarsky, K.; Miyano, J.; Richardson, C.; Silbiger, N.J.; Thomas, F.I. Fluorescent dissolved organic matter as a multivariate biogeochemical tracer of submarine groundwater discharge in coral reef ecosystems. Mar. Chem. 2015, 177, 232–243. [Google Scholar] [CrossRef]
- DiNapoli, R.J.; Lipo, C.P.; de Smet, T.S.; Hunt, T.L. Thermal Imaging Shows Submarine Groundwater Discharge Plumes Associated with Ancient Settlements on Rapa Nui (Easter Island, Chile). Remote Sens. 2021, 13, 2531. [Google Scholar] [CrossRef]
- Befus, K.M.; Cardenas, M.B.; Tait, D.R.; Erler, D.V. Geoelectrical signals of geologic and hydrologic processes in a fringing reef lagoon setting. J. Hydrol. 2014, 517, 508–520. [Google Scholar] [CrossRef]
- Tait, D.R.; Santos, I.R.; Erler, D.V.; Befus, K.M.; Cardenas, M.B.; Eyre, B.D. Estimating submarine groundwater discharge in a South Pacific coral reef lagoon using different radioisotope and geophysical approaches. Mar. Chem. 2013, 156, 49–60. [Google Scholar] [CrossRef]
- Mylroie, J.E.; Carew, J.L. Karst Development on Carbonate Islands. In Unconformities and Porosity in Carbonate Strata; Budd, D.A., Saller, A.H., Harris, P.M., Eds.; American Association of Petroleum Geologists: Tulsa, OK, USA, 1995; Volume 63. [Google Scholar] [CrossRef]
- Halliday, W.R. History and status of the Moiliili Karst, Hawaii. J. Cave Karst Stud. 1998, 60, 141–145. [Google Scholar]
- Darwin, C. The Structure and Distribution of Coral Reefs; Smith, Elder & Co.: London, UK, 1842; Volume 12, p. 3. [Google Scholar]
- Guilcher, A. Coral Reef Geomorphology; John Wiley & Sons: New York, NY, USA, 1988. [Google Scholar]
- Ladd, H.S.; Schlanger, S.O. Drilling operations on Eniwetok Atoll, Bikini and Nearby Atolls, Marshall Islands; United States Geological Survey Professional Paper: Reston, VA, USA, 1960; 260-Y; pp. 863–903.
- Quinn, T.M.; Saller, A.H. Chapter 21—Geology of Anewetak Atoll, Republic of the Marshall Islands. In Developments in Sedimentology; Vacher, H.L., Quinn, T.M., Eds.; Elsevier: Amsterdam, The Netherlands, 2004; Volume 54, pp. 637–666. [Google Scholar]
- Ayers, J.F.; Vacher, H.; Clayshulte, R.N.; Strout, D.; Stebnisky, R. Hydrogeology of Deke Island, Pingelap Atoll, Eastern Caroline Islands; School of Geosciences Faculty and Staff Publications: Tampa, FL, USA, 1984. [Google Scholar]
- Vacher, H.L.; Ayers, J.F. Hydrology of small oceanic islands—Utility of an estimate of recharge inferred from the chloride concentration of the freshwater lenses. J. Hydrol. 1980, 45, 21–37. [Google Scholar] [CrossRef]
- Bailey, R.T.; Jenson, J.W.; Olsen, A.E. Estimating the Ground Water Resources of Atoll Islands. Water 2010, 2, 1–27. [Google Scholar] [CrossRef]
- Werner, A.D.; Sharp, H.K.; Galvis, S.C.; Post, V.E.; Sinclair, P. Hydrogeology and management of freshwater lenses on atoll islands: Review of current knowledge and research needs. J. Hydrol. 2017, 551, 819–844. [Google Scholar] [CrossRef]
- Buddemeier, R.W.; Oberdorfer, J.A. Hydrogeology and Hydrodynamics of Coral Reef Pore Waters; 6. International Coral Reef Symposium, No. UCRL-98872; CONF-880873-2, Townsville; Lawrence Livermore National Lab.: Livermore, CA, USA, 1988.
- Oberdorfer, J.A.; Buddemeier, R.W. Coral-reef hydrology: Field studies of water movement within a barrier reef. Coral Reefs 1986, 5, 7–12. [Google Scholar] [CrossRef]
- Mylroie, J.E.; Jenson, J.W.; Taborosi, D.; Jocson, J.M.; Vann, D.T.; Wexel, C. Karst features of Guam in terms of a general model of carbonate island karst. J. Cave Karst Stud. 2001, 63, 9–22. [Google Scholar]
- Parra, S.M.; Valle-Levinson, A.; Mariño-Tapia, I.; Enriquez, C. Salt intrusion at a submarine spring in a fringing reef lagoon. J. Geophys. Res. Ocean. 2015, 120, 2736–2750. [Google Scholar] [CrossRef]
- Houben, G.J.; Stoeckl, L.; Mariner, K.E.; Choudhury, A.S. The influence of heterogeneity on coastal groundwater flow—Physical and numerical modeling of fringing reefs, dykes and structured conductivity fields. Adv. Water Resour. 2018, 113, 155–166. [Google Scholar] [CrossRef]
- Cardenas, M.B.; Zamora, P.B.; Siringan, F.P.; Lapus, M.R.; Rodolfo, R.S.; Jacinto, G.S.; Diego-McGlone, M.L.S.; Villanoy, C.L.; Cabrera, O.; Senal, M.I. Linking regional sources and pathways for submarine groundwater discharge at a reef by electrical resistivity tomography, 222Rn, and salinity measurements. Geophys. Res. Lett. 2010, 37. [Google Scholar] [CrossRef]
- Silbiger, N.J.; Donahue, M.J.; Lubarsky, K. Submarine groundwater discharge alters coral reef ecosystem metabolism. Proc. R. Soc. B Biol. Sci. 2020, 287, 20202743. [Google Scholar] [CrossRef]
- Rougerie, F.; Fichez, R.; Dejardin, P. Geomorphology and Hydrogeology of Selected Islands of French Polynesia: Tikehau (Atoll) and Tahiti (Barrier Reef). In Geology and Hydrogeology of Carbonate Islands. Developments in Sedimentology; Vacher, H.L., Quinn, T.M., Eds.; Elsevier: Amsterdam, The Netherlands, 2004; pp. 475–502. [Google Scholar]
- Orme, G.; Flood, P.G.; Sargent, G. Sedimentation trends in the lee of outer (ribbon) reefs, northern region of the Great Barrier Reef province. Philos. Trans. R. Soc. Lond. Ser. A Math. Phys. Sci. 1978, 291, 85–99. [Google Scholar]
- Gischler, E.; Hudson, J.H.; Humblet, M.; Braga, J.C.; Eisenhauer, A.; Isaack, A.; Anselmetti, F.S.; Camoin, G.F. Late Quaternary barrier and fringing reef development of Bora Bora (Society Islands, south Pacific): First subsurface data from the Darwin-type barrier-reef system. Sedimentology 2016, 63, 1522–1549. [Google Scholar] [CrossRef]
- Toomey, M.R.; Woodruff, J.D.; Donnelly, J.P.; Ashton, A.D.; Perron, J.T. Seismic evidence of glacial-age river incision into the Tahaa barrier reef, French Polynesia. Mar. Geol. 2016, 380, 284–289. [Google Scholar] [CrossRef]
- Grigg, R.; Grossman, E.; Earle, S.; Gittings, S.; Lott, D.; McDonough, J. Drowned reefs and antecedent karst topography, Au’au Channel, S.E. Hawaiian Islands. Coral Reefs 2002, 21, 73–82. [Google Scholar] [CrossRef]
- Woodroffe, C.D. Coasts: Form, Process and Evolution; Cambridge University Press: Cambridge, UK, 2002. [Google Scholar]
- Bailey, R.T.; Jenson, J.W.; Rubinstein, D.; Olsen, A.E. Groundwater Resources of Atoll islands: Observations, Modelling and Management: Technical Report 119; Water and Environmental Research Institute of the Western Pacific, University of Guam: Mangilao, Guam, 2008. [Google Scholar]
- Chevalier, J.; Denizot, M.; Mougin, J.; Plessis, Y.; Salvat, B. Etude Géomorphologique de l’Atoll de Mururoa (Tuamotu); Cah Pac, 12, 1-144; Royal Society of London: London, UK, 1969. [Google Scholar]
- Easton, W.; Olson, E. Radiocarbon profile of Hanauma Reef, Oahu, Hawaii. Geol. Soc. Am. Bull. 1976, 87, 711–719. [Google Scholar] [CrossRef]
- Laurent, V.; Maamaatuaiahutapu, K.; Brodien, I.; Lombardo, S.; Tardy, M.; Varney, P. Atlas Climatologique de la Polynésie Française; Météo France, Délégation Interrégionale de Polynésie Française: Faa’a, Tahiti, French Polynesia, 2019.
- Leichter, J.J.; Stokes, M.D.; Hench, J.L.; Witting, J.; Washburn, L. The island-scale internal wave climate of Moorea, French Polynesia. J. Geophys. Res. Ocean. 2012, 117. [Google Scholar] [CrossRef]
- Hench, J.L.; Leichter, J.J.; Monismith, S.G. Episodic circulation and exchange in a wave-driven coral reef and lagoon system. Limnol. Oceanogr. 2008, 53, 2681–2694. [Google Scholar] [CrossRef]
- Hallmann, N.; Camoin, G.; Eisenhauer, A.; Samankassou, E.; Vella, C.; Botella, A.; Milne, G.; Pothin, V.; Dussouillez, P.; Fleury, J.; et al. Reef response to sea-level and environmental changes in the Central South Pacific over the past 6000 years. Glob. Planet. Chang. 2020, 195, 103357. [Google Scholar] [CrossRef]
- Rashid, R.; Eisenhauer, A.; Stocchi, P.; Liebetrau, V.; Fietzke, J.; Rüggeberg, A.; Dullo, W.-C. Constraining mid to late Holocene relative sea level change in the southern equatorial Pacific Ocean relative to the Society Islands, French Polynesia. Geochem. Geophys. Geosystems 2014, 15, 2601–2615. [Google Scholar] [CrossRef]
- Pirazzoli, P.; Montaggioni, L. Lithospheric deformation in French Polynesia (Pacific Ocean) as deduced from Quaternary shorelines. In Proceedings of the 5th International Coral Reef Congress, Tahiti, French Polynesia, 27 May–1 June 1985. [Google Scholar]
- Mathe, D. Etude Géotechnique Préalable, Mission G1—Phase Principes Généraux de Construction (Norme NF P 94-500 Version de Novembre 2013); Laboratoire de Travaux Publics de Polynesie: Papeete, Tahiti, French Polynesia, 2014. [Google Scholar]
- Ayers, J.F. Groundwater Flow Dynamics Beneath Atoll Islands; IAHS-AISH Publication: Wallingford, UK, 1998; pp. 397–404. [Google Scholar]
- Briggs, M.A.; Cantelon, J.A.; Kurylyk, B.L.; Kulongoski, J.T.; Mills, A.; Lane, J.W. Small atoll fresh groundwater lenses respond to a combination of natural climatic cycles and human modified geology. Sci. Total. Environ. 2021, 756, 143838. [Google Scholar] [CrossRef]
- Maréchal, J.-C.; Hakoun, V.; Corbier, P. Role of Reef-Flat Plate on the Hydrogeology of an Atoll Island: Example of Rangiroa. Water 2022, 14, 2695. [Google Scholar] [CrossRef]
- Breier, J.A.; Breier, C.F.; Edmonds, H.N. Detecting submarine groundwater discharge with synoptic surveys of sediment resistivity, radium, and salinity. Geophys. Res. Lett. 2005, 32. [Google Scholar] [CrossRef]
- Day-Lewis, F.D.; White, E.A.; Johnson, C.D.; Lane, J.W.; Belaval, M. Continuous resistivity profiling to delineate submarine groundwater discharge—Examples and limitations. Geophysics 2006, 25, 724–728. [Google Scholar] [CrossRef]
- Jackson, P.D.; Briggs, K.B.; Flint, R.C.; Holyer, R.; Sandidge, J. Two- and three-dimensional heterogeneity in carbonate sediments using resistivity imaging. Mar. Geol. 2002, 182, 55–76. [Google Scholar] [CrossRef]
- Binley, A.; Slater, L. Resistivity and Induced Polarization: Theory and Applications to the Near-Surface Earth; Cambridge University Press: Cambridge, UK, 2020. [Google Scholar]
- Singha, K.; Johnson, T.; Day-Lewis, F.; Slater, L. Electrical Imaging for Hydrogeology; No. PNNL-SA-159896; Pacific Northwest National Laboratory (PNNL): Richland, WA, USA, 2022.
- LaBrecque, D.J.; Yang, X.; Hermans, T.; Kemna, A.; Terry, N.; Comas, X.; Reeve, A.S.; Schäfer, K.V.R.; Yu, Z.; Mellors, R.; et al. Difference Inversion of ERT Data: A Fast Inversion Method for 3-D In Situ Monitoring. J. Environ. Eng. Geophys. 2001, 6, 83–89. [Google Scholar] [CrossRef]
- Jackson, P.D.; Pearce, J.; Jarrard, R.; Pigram, C. Resistivity/Porosity/Velocity Relationships from Downhole Logs: An Aid for Evaluating Pore Morphology. In Proceedings of the Ocean Drilling Program, Townsville, Australia, 4 August–11 October 1990. [Google Scholar]
- Pain, A.J.; Martin, J.B.; Young, C.R.; Valle-Levinson, A.; Mariño-Tapia, I. Carbon and phosphorus processing in a carbonate karst aquifer and delivery to the coastal ocean. Geochim. Cosmochim. Acta 2020, 269, 484–495. [Google Scholar] [CrossRef]
- Jackson, P.D.; Taylor Smith, D.; Stanford, P.N. Resistivity-porosity-particle shape relationships for marine sands. Geophysics 1978, 43, 1250–1268. [Google Scholar] [CrossRef]
- Gischler, E.; Hudson, J.H.; Humblet, M.; Braga, J.C.; Schmitt, D.; Isaack, A.; Eisenhauer, A.; Camoin, G.F. Holocene and Pleistocene fringing reef growth and the role of accommodation space and exposure to waves and currents (Bora Bora, Society Islands, French Polynesia). Sedimentology 2019, 66, 305–328. [Google Scholar] [CrossRef]
- Cabioch; Camoin; Montaggioni. Postglacial growth history of a French Polynesian barrier reef tract, Tahiti, central Pacific. Sedimentology 1999, 46, 985–1000. [Google Scholar] [CrossRef]
- Weij, R.; Reijmer, J.J.G.; Eberli, G.P.; Swart, P.K. The limited link between accommodation space, sediment thickness, and inner platform facies distribution (Holocene–Pleistocene, Bahamas). Depos. Rec. 2019, 5, 400–420. [Google Scholar] [CrossRef]
- Ayers, J.F.; Vacher, H.L. Hydrogeology of an Atoll Island: A Conceptual Model from Detailed Study of a Micronesian Example. Groundwater 1986, 24, 185–198. [Google Scholar] [CrossRef]


Disclaimer/Publisher’s Note: The statements, opinions and data contained in all publications are solely those of the individual author(s) and contributor(s) and not of MDPI and/or the editor(s). MDPI and/or the editor(s) disclaim responsibility for any injury to people or property resulting from any ideas, methods, instructions or products referred to in the content. |
© 2023 by the authors. Licensee MDPI, Basel, Switzerland. This article is an open access article distributed under the terms and conditions of the Creative Commons Attribution (CC BY) license (https://creativecommons.org/licenses/by/4.0/).
Share and Cite
Becker, M.W.; Cason, F.M.; Hagedorn, B. Locating Potential Groundwater Pathways in a Fringing Reef Using Continuous Electrical Resistivity Profiling. Hydrology 2023, 10, 206. https://doi.org/10.3390/hydrology10110206
Becker MW, Cason FM, Hagedorn B. Locating Potential Groundwater Pathways in a Fringing Reef Using Continuous Electrical Resistivity Profiling. Hydrology. 2023; 10(11):206. https://doi.org/10.3390/hydrology10110206
Chicago/Turabian StyleBecker, Matthew W., Francine M. Cason, and Benjamin Hagedorn. 2023. "Locating Potential Groundwater Pathways in a Fringing Reef Using Continuous Electrical Resistivity Profiling" Hydrology 10, no. 11: 206. https://doi.org/10.3390/hydrology10110206