Article

Enrichment and Temporal Trends of Groundwater Salinity in Central Mexico

by
Claudia Patricia Colmenero-Chacón
1,
Heriberto Morales-deAvila
2,
Mélida Gutiérrez
1,*,
Maria Vicenta Esteller-Alberich
3 and
Maria Teresa Alarcón-Herrera
4
1
Department of Geography, Geology and Planning, Missouri State University, Springfield, MO 65897, USA
2
Unidad Académica de Ingeniería Eléctrica, Universidad Autónoma de Zacatecas Francisco García Salinas, Zacatecas 98160, Mexico
3
Inter-American Institute of Technology and Water Science, Autonomous University of the State of Mexico, Toluca 50120, Mexico
4
Department of Sustainable Energy, Centro de Investigación en Materiales Avanzados S.C. (CIMAV), Calle CIMAV 110, Ejido Arroyo Seco, Colonia 15 de Mayo (Tapias), Durango 34147, Mexico
*
Author to whom correspondence should be addressed.
Hydrology 2023, 10(10), 194; https://doi.org/10.3390/hydrology10100194
Submission received: 20 July 2023 / Revised: 25 September 2023 / Accepted: 27 September 2023 / Published: 30 September 2023
(This article belongs to the Special Issue Advances in Groundwater Salinization Assessment)

Abstract

:
Groundwater salinization is a major threat to the water supply in coastal and arid areas, a threat that is expected to worsen by increased groundwater withdrawals and by global warming. Groundwater quality in Central Mexico may be at risk of salinization due to its arid climate and since groundwater is the primary source for drinking and agriculture water. Only a handful of studies on groundwater salinization have been reported for this region, most constrained to a small area and without trend analyses. To determine the extent of salinization, total dissolved solids (TDS), sodium (Na+), nitrate as nitrogen (NO3-N) and sodium adsorption ratio (SAR) are commonly used. Available water quality data for about 200 wells, sampled annually between 2012 and 2021, were used to map the spatial distribution of NO3-N, TDS, Na+, and SAR. Upward trends and Spearman correlation were also determined. The study area was subdivided into three sections to estimate the impact of climate and lithologies on groundwater salinity. The results showed that human activities (agriculture) and dissolution of carbonate and evaporite rocks were major sources of salinity, and evaporation an enriching factor. Temporal trends occurred in only a few (about 7%) wells, primarily in NO3-N. The water quality for irrigation was generally good, (SAR < 10 in 95% of samples); however, eight wells contained water hazardous to soil (TDS > 1750 mg L−1 and SAR > 9). The results detected one aquifer with consistently high concentrations and upward trends and eight lesser impacted aquifers. Identifying the wells with upward trends is important in narrowing down the possible causes of their concentration increase with time and to develop strategies that will infuse sustainability to groundwater management.

1. Introduction

Groundwater availability is declining worldwide, a decline that is expected to continue due to an increased demand for water used for drinking, irrigation, and industrial purposes [1,2,3,4,5,6]. Concurrent to this decline, groundwater quality is deteriorating in many agricultural and urban areas [3,7,8,9,10,11,12]. One groundwater quality concern is salinization, a common threat to coastal and inland areas under arid and semiarid climates [8,10] as an increase in salts due to evaporation and contact with salts deposited on the upper soil layers. Since many of these areas are important food production centers [8,11], salts will also include those resulting from overfertilization and soil amendments, such as nitrate, phosphate, and gypsum. Groundwater salinization is thus a multifaceted threat that may worsen with increased groundwater withdrawals and by global warming. The interweaving effects of attending to water demand and its consequences to water quality highlights the need to develop clear water management strategies that would assure freshwater availability to future generations [8,9].
Water quality can be measured using a variety of parameters. The chemical parameters commonly monitored include major ions plus any other solutes that pose a hazard to either public health or to irrigated soils and crops in that particular region. The amount of total dissolved salts (TDS) distinguishes between fresh (<1000 mg L−1) and saline water. For agricultural purposes, salinity is expressed in multiple ways: as the individual content of Ca2+, Mg2+, Na+ or K+, as an index, or as a ratio [13,14,15]. The suitability of water for irrigation is determined in various ways as it is a complex determination that depends on multiple factors, among them, the type of soil, particular crop, other ions present, and climate and agricultural practices [15,16]. A few of the most common indexes and ratios used to classify water quality for irrigation purposes are listed in Table 1.
TDS is a parameter that encompasses all the dissolved material and is easy to measure as it is directly proportional to electrical conductivity (EC). Among the dissolved salts, sodium (Na+) is known to degrade soil quality, but the presence of calcium (Ca2+) and magnesium (Mg2+) offset the negative effect of Na+, therefore Na+ is monitored in conjunction with Ca2+ and Mg2+. Under special circumstances, excess potassium (K+), Mg2+, microorganisms, and organic matter also influence soil permeability [13].
Although salinity of groundwater has been reported in temperate regions [7], most reports are issued for arid, semiarid, and coastal areas [4,5,8,13], and these primarily concern their suitability for irrigation [4,14,23]. In recent years, aquifers worldwide have seen an increase in nitrate concentrations and their occurrence traced to an excess of N-fertilizers [12,24]. Nitrate is a soluble salt that has been used as an indicator of emergent contaminants, such as pesticides and pharmaceuticals, since its sources are agricultural waste, sewage, and manure. NO3-N concentrations are associated with health hazards and to eutrophication of water bodies (based on benthic chlorophyl levels) at concentrations above 10 mg L−1 NO3-N and 3 mg L−1 NO3-N, respectively [25]. Table 2 lists the guidelines and potential hazards of the water quality parameters considered here.
Central Mexico is an area where water quality has been given much attention in recent years because of the high As and F concentrations in groundwater [30,31,32]. Due to the predominant semiarid climate and abundance of endorheic basins in Central Mexico, salinization of groundwater is a major concern [24,33,34,35]. Recent local studies of salinization of groundwater include a wellfield in Nuevo Leon [36] and the Calera aquifer in Zacatecas [37]. Although these two studies report no significant differences in water quality with respect to time ((2005–2015) [37], (2006, 2012, 2017) [36], natural sources are reported as the major source, followed by human-induced (agriculture, increased groundwater extraction) sources. In the Calera study, the sodium adsorption ratio (SAR) values varied between 10 and 18, which corresponds to a “good” water category for irrigation; but a positive correlation between SAR and As concentration was observed [37]. Overall, much remains to be known about the extent of salinization, identification of areas at-risk, upward trends, and apportionment of natural and anthropogenic sources in this water-scarce region.
The suitability of water for irrigation purposes has a broad context and is beyond the scope of this study. Rather, we focused on the spatial distribution of water quality parameters that are common indicators of groundwater salinity: nitrate as nitrogen (NO3-N), TDS, Na+, and SAR, and their upward/downward trends from 2012 to 2021. Specifically, the objectives of this study were to: (1) obtain the range of values and spatial distribution of TDS, SAR, Na+, and associated NO3-N concentrations in Central Mexico and determine the effects of topography, climate, and lithology, (2) determine a possible association among the parameters above, and (3) identify the wells that show a statistically significant upward trend in concentration using the Mann–Kendall method and Sen slope.

2. Materials and Methods

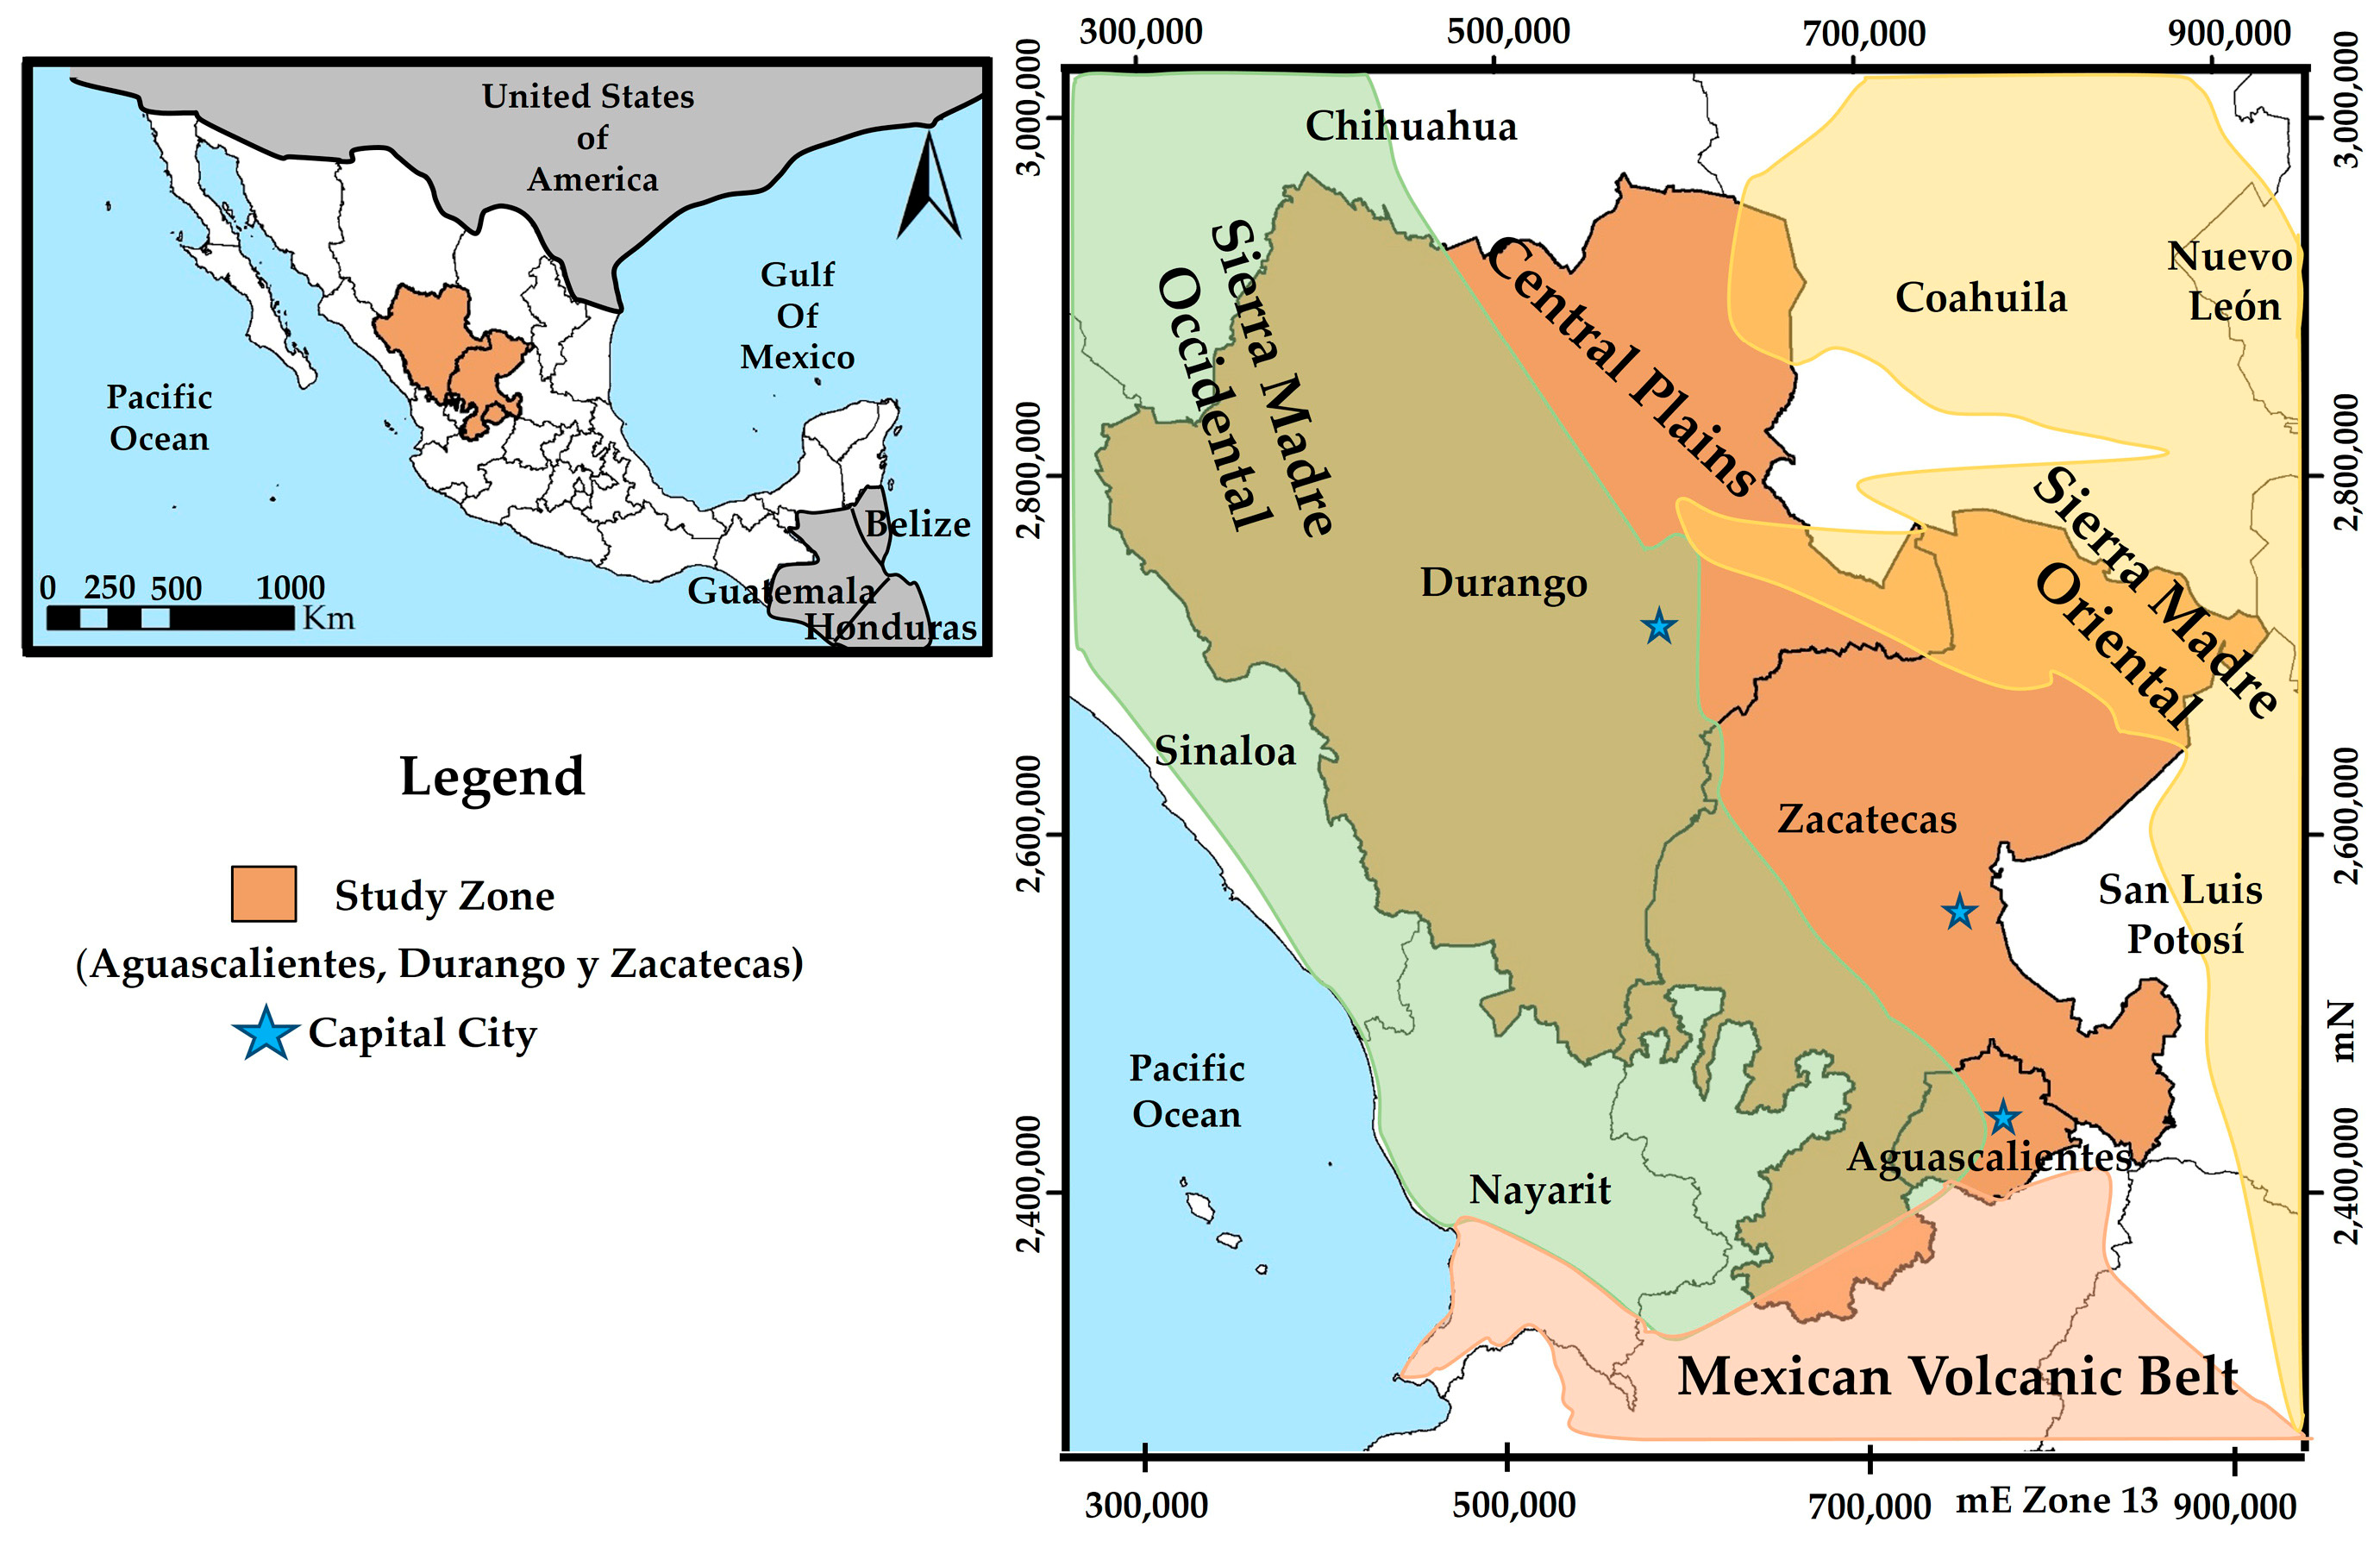
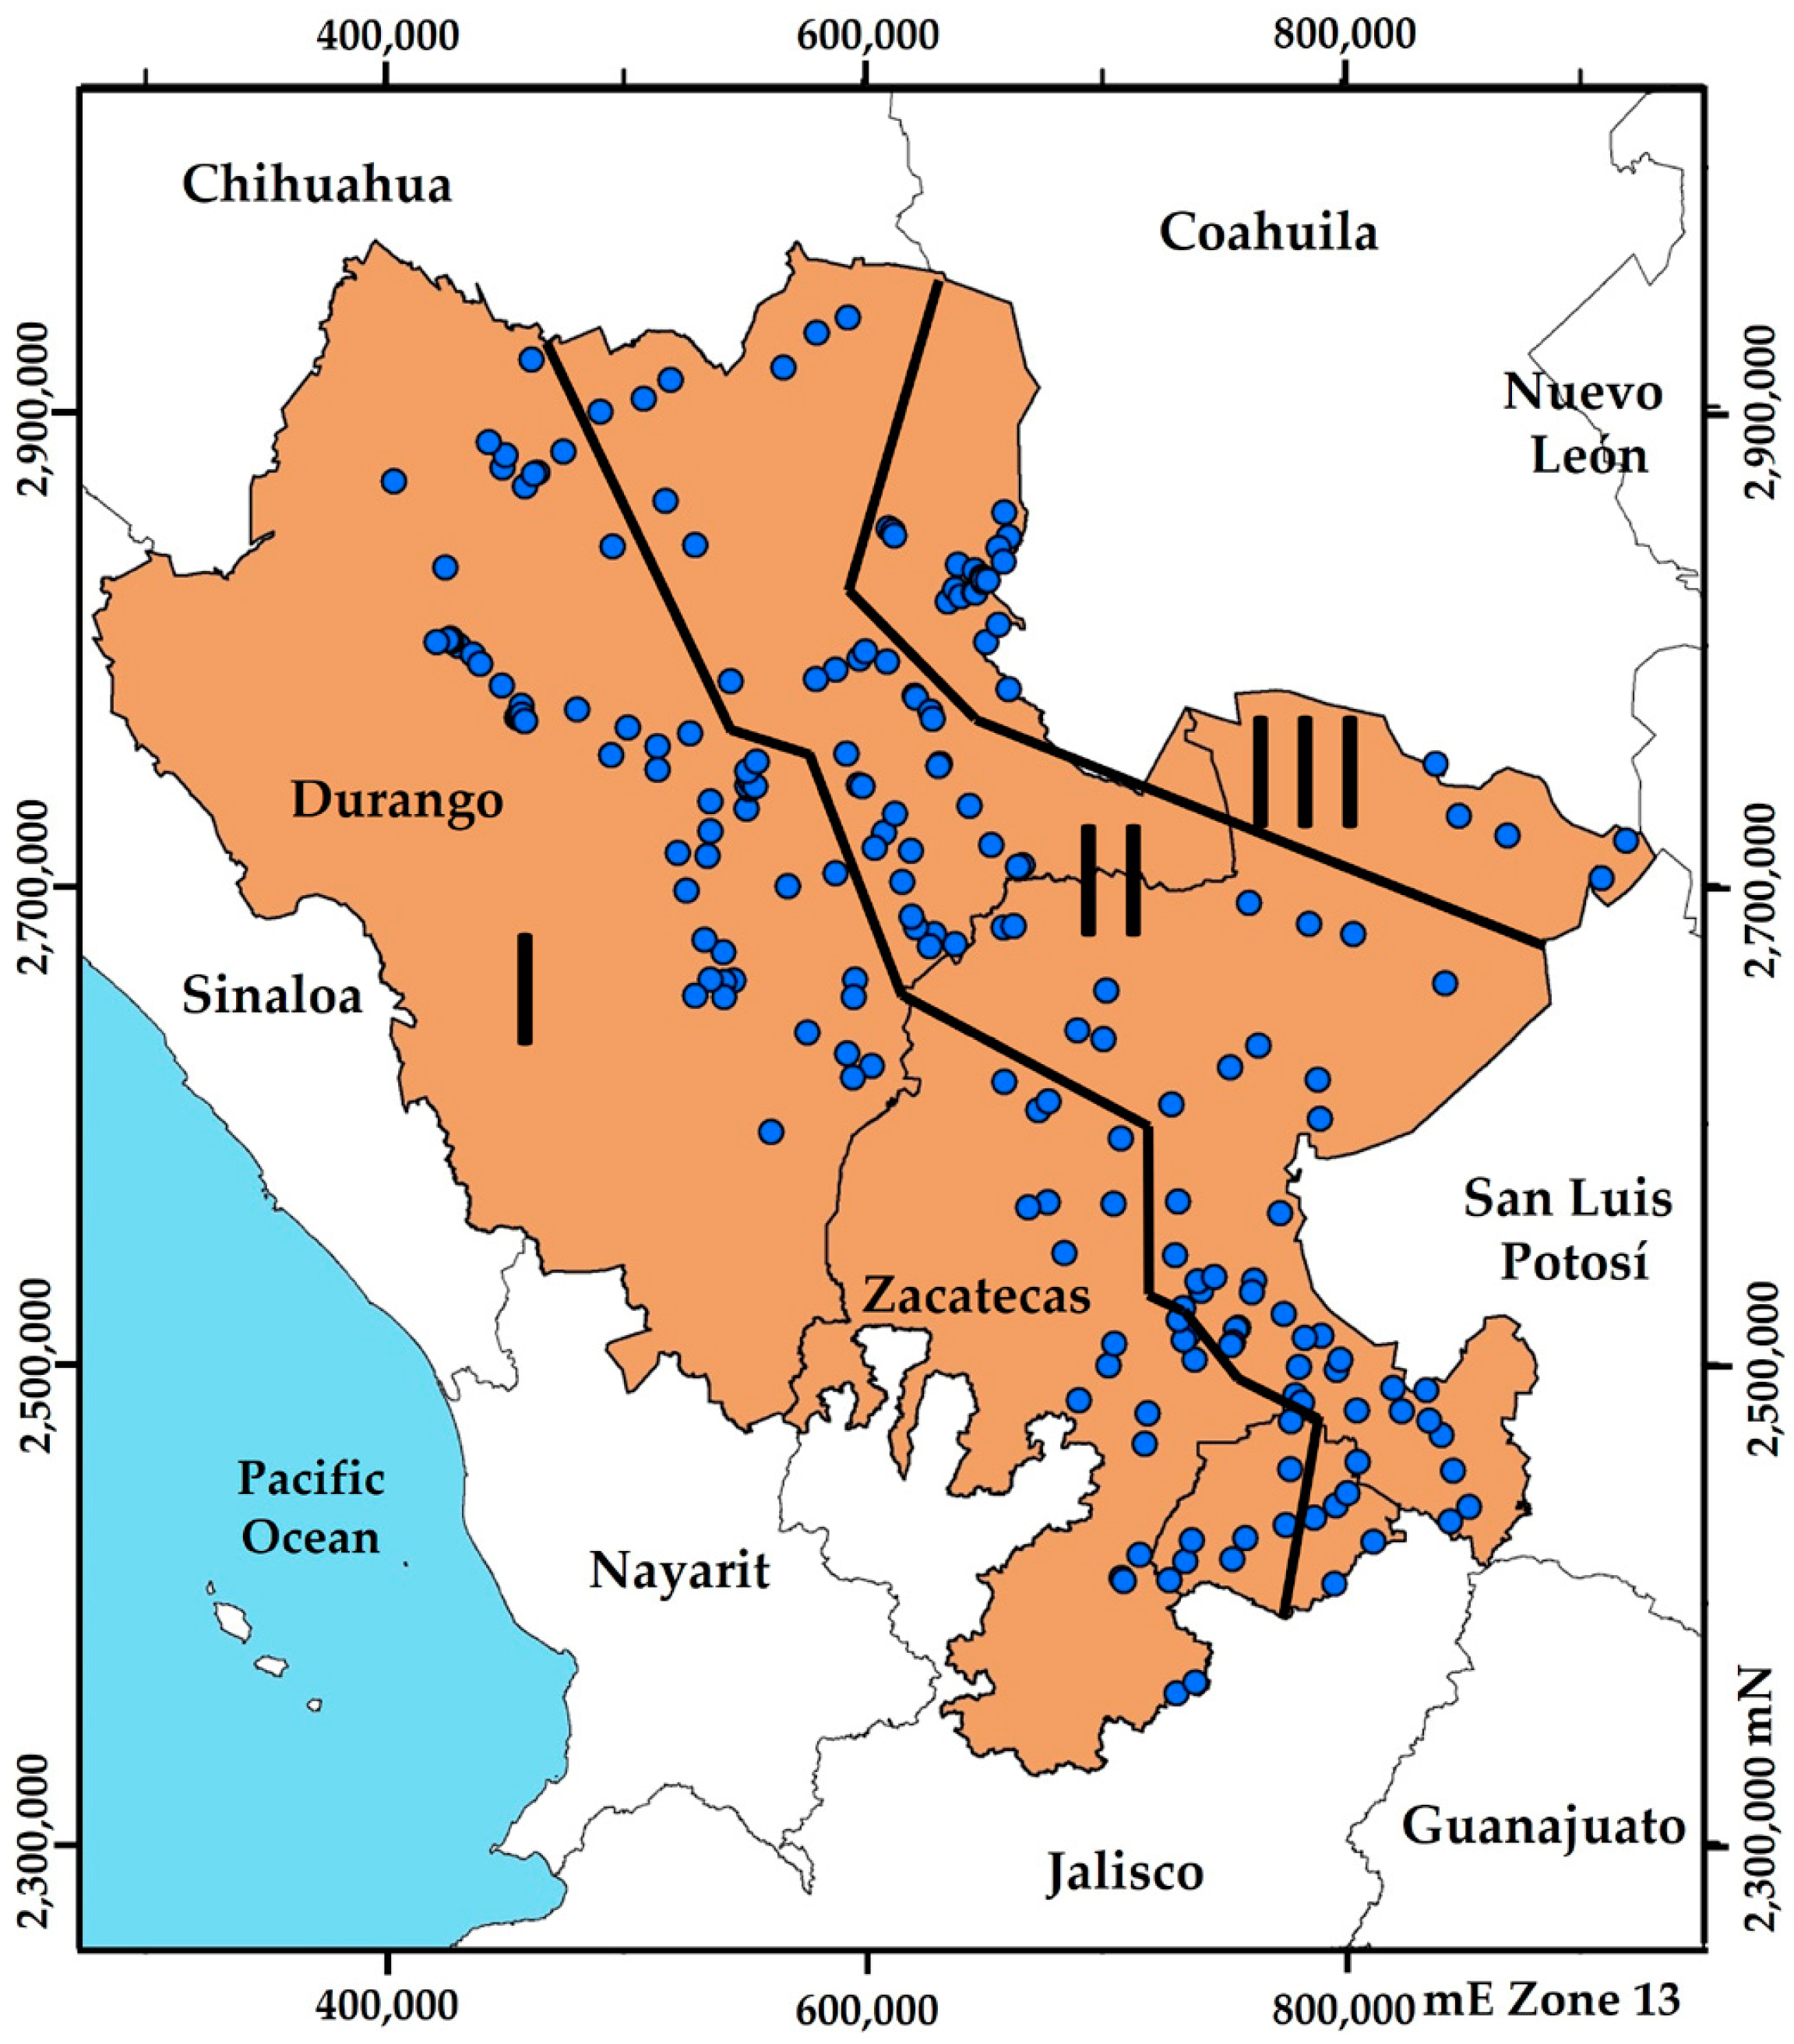
2.1. Description of the Study Area

The study area comprises three Mexican states: Durango, Zacatecas, and Aguascalientes, which together encompass a surface area of 204,218 km2 in Central Mexico (Figure 1). The area is bound by mountains on three sides: to the west by the Sierra Madre Occidental, to the east by the Sierra Madre Oriental, and to the south by the Mexican Volcanic Belt [38]. The terrain within these mountain belts forms an elevated plateau that has an average elevation of 1750 m.a.s.l. in the northern part (Cuencas Centrales del Norte) and 2230 m.a.s.l. in the southern part (Mesa Central). Endorheic basins abound within this elevated plateau.
The predominant climate of this area is arid to semiarid, and the evaporation rate overly exceeds precipitation. Since the study area contains high mountains, valleys, and arid and semiarid basins, the climate is reported for each of these (see Supplementary Material S1). Precipitation averages for these areas are 1100 mm, 450 mm, and 150 mm, respectively, and occur during monsoon season (July–September) [39].
Groundwater quality studies have multiplied in the recent past due to the high concentrations of geogenic arsenic (As) and fluoride (F) present [31,32,37,40,41]. The presence of anthropogenic contaminants associated with urban centers (sewage), agriculture (excess fertilizers), and cattle grazing (manure) are expected, due to the concentration-by-evaporation effect in endorheic basins under an arid/semiarid climate. Therefore, to account for human contribution to groundwater, NO3-N (an anthropic solute) was included as an indicator for contamination, backed up by an increase in Na+, TDS, and SAR for agricultural activities.

2.2. Data Gathering and Data Processing

Water quality data for the states of Aguascalientes, Durango, Zacatecas, and parameters pH, alkalinity, total dissolved solids (TDS), sodium (Na+), calcium (Ca2+), magnesium (Mg2+), chloride (Cl), sulfate (SO42−), and nitrate as nitrogen (NO3-N) were extracted from the National monitoring database RENAMECA hosted by CONAGUA (Mexican Water Agency) [42], which is publicly available online. The CONAGUA website for official water guidelines [43] reports the maximum recommended limits and analytical protocols for each measured parameter. These protocols state the quality control specifications for each determination, including daily instrument calibration, use of quality-grade reagents, and blanks. Information about the aquifers was obtained from CONAGUA sites for Aguascalientes [44], Durango [45], and Zacatecas [46].
The original dataset contained 2126 samples collected between 2012 and 2021 on a yearly basis from a total of 383 wells. From these, 158 wells containing only one sample (one year-data) were removed to add consistency to the dataset. The remaining wells had several year-data; most of them 8–11 year-data. Next, ionic balance (EB%) values were determined to these data and data with EB% above 10% were removed. The remaining 1576 data were then separated into three sections (Figure 2) for further analysis. This step was necessary to group wells into sections of roughly similar topography, climate, and lithology. Section 1 included areas of predominately mountainous topography, temperate climate, and outcropping felsic volcanic rocks (e.g., rhyolite). Section 2 comprised the central plains and arid to semiarid climate covered largely by Quaternary alluvium, whereas Section 3 comprised mountainous topography, although of lesser relief than Section 1, temperate climate, and outcropping sedimentary rocks (carbonates, shales, gypsum). Sections 1, 2, and 3 contained a total of 700, 670, and 206 data points, respectively. The location of wells within each section is shown in Figure 2.
Maps were constructed using ArcGIS version 10.8 with a WGS projection and UTM coordinates (Zone 13). Concentration values of NO3-N, TDS, Na+, and SAR were entered and plotted in the map, using different symbols for each of three concentration ranges: high, intermediate, and low.

2.3. Hydrogeology of the Study Area

Normal faults during Cenozoic extensional episodes formed horsts and graben structures [38]. Through time, erosion filled the grabens (basins) with rock fragments, secondary minerals, among which iron oxyhydroxides were a common component, and clays [32,33]. About half of the basins are endorheic and the rest discharge to the Pacific Ocean. The basins have an average depth of 500 m, are heterogeneous, and generally, highly permeable, although clay lenses may be present [37,38]. Temperature and water quality analysis has identified three main groundwater flows: local, intermediate, and regional [41,45]. More detailed information about the hydrogeology of the area has been reported elsewhere [37,38,39,40,41,47].

2.4. Statistical Analyses
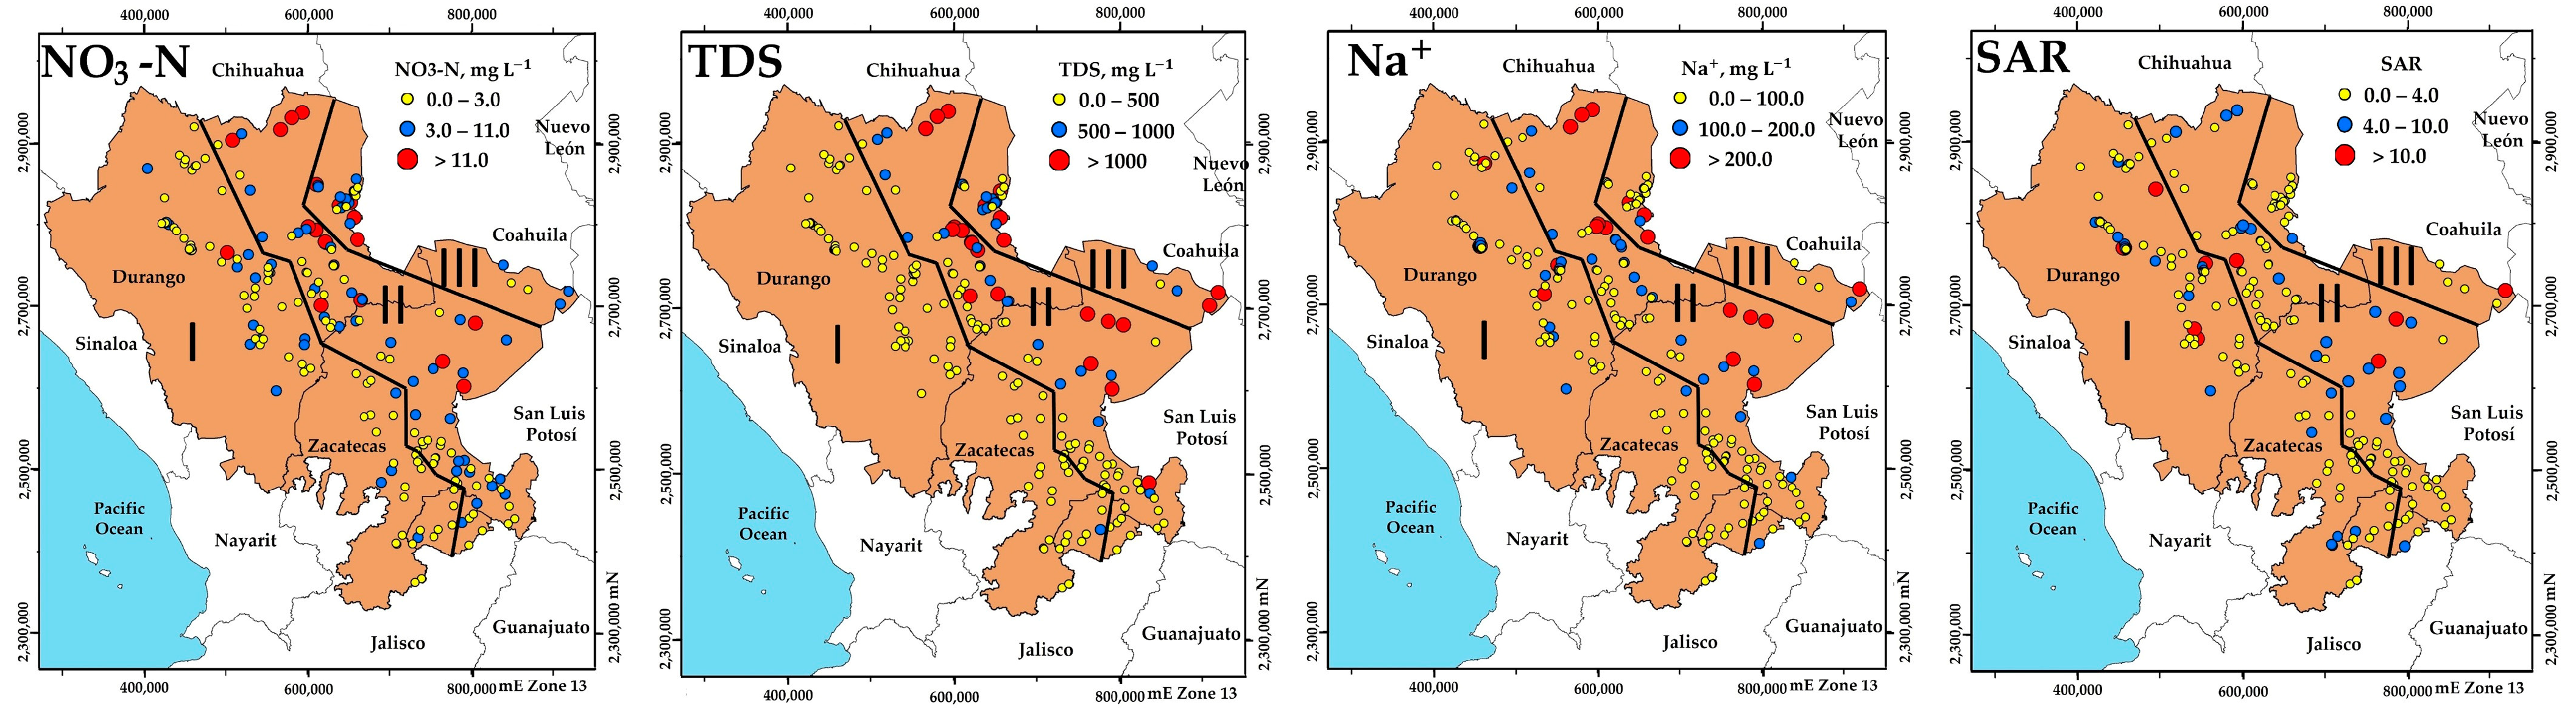
Descriptive statistics were obtained for each parameter of interest in each section, and SAR was calculated according to its formula (Table 1) using MS Excel 2021. Spearman correlation was calculated using MS Excel and its significance obtained from the online calculator socscistatistics.com (accessed on 9 September 2023).
The Mann–Kendall method [48] was utilized to determine upward and downward trends of NO3-N, TDS, Na+, and SAR. This method requires a minimum of 8 to 10 yearly measurements [49,50] and generates a Z value that reflects the upward (positive Z value), downward (negative Z value), or no significant trend (Z value = 0), according to the Equations (1) and (2):
S = i = 1 n 1 j = 1 n s g n ( X j X i )
and
s g n θ = 1     if   θ > 0 0     if   θ = 0 1     if   θ < 0
where Xi and Xj are the values of sequence i, j, and n is the length of the time series, and the significance of the trend is evaluated through the calculation of the variance V(S). The standardized statistic Z is obtained after applying Equation (2).
Z = S 1 V ( S )       S > 0         0           S = 0 S + 1 V ( S )       S < 0
The value of Z was then compared against a critical value (e.g., 1.96 for a probability of 95%) to determine if the trend is meaningful. Z values larger than the critical value indicate that the trend is significant. The statistical package Minitab was utilized to calculate the value of Z directly. Sen slope [51,52] is calculated as the median value of the slopes obtained for all pairs of points. The largest slope value indicates the steepest, strongest trend.

3. Results

As expected, and in accordance with previous studies, concentrations differed with respect to their section, in accordance with their physiographic characteristics: climate, topography, and lithology. The results are listed in Table 3.
The spatial distribution of NO3-N, TDS, Na+, and SAR concentrations for 2020 is shown in Figure 3.
The percentage of samples that exceeded existing guidelines for NO3-N, TDS, SAR, and TDS–SAR in each section is shown in Table 4. The water analysis presented here does not intend to determine the suitability of water for irrigation. Instead, to include a few salinity parameters commonly reported in the literature and to include one of each group of: solute alone (Na+), a salinity index (SAR), and a combination of parameters (TDS–SAR) [15,16].
The Spearman correlation results are shown in Table 5. The small difference between N in Table 4 and Table 5 is due to a few data points that were eliminated in order to keep complete pairs. Spearman correlation, among key parameters (NO3-N, TDS, Na+, SAR), showed no correlation (ρ < 0.4) between NO3-N and any other parameter in Section 3 and a correlation with TDS (ρ(NO3-TDS) = 0.53, 0.74) in Sections 1 and 2, respectively. In contrast, SAR correlated strongly with TDS and Na+ in all three sections. All correlation coefficients above 0.40 were statistically significant at p < 0.001.
Within the database of 225 wells, 99 wells complied with the required minimum number of data (8 or more consecutive years) for TDS and 146 wells had 8 or more consecutive NO3-N year-data (Table 6). Once trends were determined, NO3-N obtained the largest number of trends with a total of seven wells with an upward trend and seven downward trends, corresponding to 14.1% and 6.0% of the total number of analyzed wells.
As shown in Table 6, there were more wells with upward trends for NO3-N concentrations compared to the other tested parameters. A closer inspection of the samples with upward trends and their location is summarized in Table 7 for upward trends and in Table 8 for downward trends. The aquifer identification code [44,45,46] and the section No. within the study area were included in Table 7 to visually detect if two or more upward trending wells were found within the same aquifer, if these trends applied to more than one parameter, and which section accumulated the most upward trends.

4. Discussion

4.1. Water Quality

Except for dissolved silica, solutes increased in concentration from Section 1 to Section 3 (see Table 3), with the levels of NO3-N exceeding the drinking water norm in 15% of the wells in Section 3, which represents a risk to public health. Especially noticeable are the increases in NO3-N, Na+, and SO42− concentrations, as expected due to the aridity and the abundance of soluble rocks on the eastern part of the study area (Sections 2 and 3). Except for SAR, the spatial distribution (Figure 3) shows the highest concentrations of all these parameters clustering in Section 2.
The hazards to agricultural soil, according to SAR and a combination of TDS–SAR, yielded different results. The combined TDS–SAR results seemed to be more sensitive to the salts present. In general, and despite climatic and geological changes between sections, the level of salinity for most wells was suitable for agriculture and relatively stable with respect to time according to SAR (less if a combination of TDS–SAR), in agreement with other studies conducted in this and neighboring areas [37,52,53,54,55,56], as well as other endorheic basins under semiarid climate [57]. The SAR values above the recommended limit of 10 amounted to 75 samples with 54, 15, and 6 found in Sections 1, 2, and 3, respectively, reaching a maximum SAR value of 87.0 in Section 2. In Section 3, high SAR values were less common and of lesser values. Although both Sections 2 and 3 had similar Na+ concentrations (about twice of those of Section 1), the higher Ca+2 and Mg+2 concentrations of Section 3 lowered the SAR value, a benefit to irrigation water quality that did not occur in Section 2.

4.2. Upward Trends and Correlation

Contrary to the expectations for a semiarid area with declining water levels, only a few wells showed an upward trend (Mann–Kendall method) for the parameters of concern. According to Table 7, the aquifer with most upward-trending wells was aquifer No. 523 (Principal) with 6, followed by 3225 (Calera), with 3 and 6 other aquifers with one each. These aquifers spread over the three states (Aguascalientes [44], Durango [45], and Zacatecas [46]. With respect to chemical parameters, only two wells (ZAC3226 and OCC5241)) obtained an upward trend for two or more parameters.
The relative lack of trends for salinity agrees with other, local studies conducted in this area [36,37]. Within the chemical parameters, NO3-N concentrations contributed with most of the upward trends, as was expected due to the increase in concentrations reported for this anthropogenic contaminant in aquifers worldwide [12,24]. Notably, this trend can be lowered or even reversed if proper measures are taken [12]. Although slightly less in number than wells showing an upward trend, downward trends were common for NO3-N and SAR. Among these, aquifer No. 1015 of Durango had a downward trend in three parameters: TDS, Na+, and SAR.

4.3. Implications for Aquifer Management

As mentioned above, the results showed a large variation in water quality within the study area and an increase in salinity in the arid parts of the study area. Nevertheless, most of the groundwater had the quality required for irrigation purposes and only a few wells showed upward trends, a result suggesting that sustainable management is within reach under proper water and soil management, e.g., by growing crops tolerant to saline soils, implementing water-saving irrigation practices, etc. These same recommendations have been issued in other semiarid agricultural areas facing a similar predicament of scarce water resources, fluoride contamination, and climate change [58,59,60]. In contrast, the concentration of NO3-N was found to be on the increase in some wells, which indicated that surface contamination is infiltrating into the deeper aquifer, possibly containing NO3-N associated contaminants, pesticides, and pharmaceuticals. Therefore, a more thorough analysis of potential contaminants should follow in NO3-N affected wells.
Conventional technologies (e.g., adsorption, electrocoagulation, ultrafiltration) to reduce salt content and to sustainably use water with high SAR values are being continuously improved [8], although one needs to recall that these processes generate their own waste, which requires proper disposal. Alternative practices (no tilling, aquifer recharge, planting of salt-tolerant crops) [8,59,60,61,62] are also implemented more often nowadays because of their proven benefits to soil and environment [59,60,61,62]. Helping nature recover and mitigate the environmental impact of groundwater salinization include practices such as maintaining a consistent environmental groundwater depth for groundwater-dependent terrestrial ecosystems [63] and the utilization of alternative sources of energy to assist water treatment, e.g., solar distillers installed in areas of intense solar radiation to obtain salt-free water that can be mixed with existing salt-laden water to reach an acceptable salinity level [64].

5. Conclusions

Groundwater salinization parameters varied widely over the study area and concentrated according to climate (arid areas) and lithology (near soluble carbonate and evaporite rock outcrops). The Mann–Kendall and Sen slope trend analyses identified specific wells with an upward trend of one or more of the above parameters, and a few wells also showed a downward trend. NO3-N was relatively independent from the other parameters (TDS, Na+, and SAR) suggesting two different main sources of origin: human activities for NO3-N and dissolution of carbonate and evaporite rocks for the latter three parameters. Upward trends were observed in a few aquifers (6 out of 59 aquifers), mainly in the form of NO3-N (22% of wells), followed by TDS, SAR, and Na+ (about 4% each). The contribution of evaporation as a concentration effect was observed as an increase in TDS and Na+ in the arid part (Section 2) of the study area, whereas the beneficial effect of Ca+2 and Mg+2 in Sections 2 and 3 reduced SAR.
The above results indicate a relatively stable water quality for most of the study area, although a few wells were impacted by anthropic activities that caused them to develop a steep upward trend. From a total of 54 aquifers, one severely affected aquifer and five other moderately affected aquifers were identified as non-sustainably managed. Further studies about the actions that cause these steep trends are needed. This information could be used not only to reduce the trend but to prevent other wells under similar circumstances from starting to behave unsustainably.

Supplementary Materials

The following supporting information can be downloaded at: https://www.mdpi.com/article/10.3390/hydrology10100194/s1, S1. Seasonality effect on trend analysis. Table S1. Variation of Z (statistics Mann–Kendall trend analysis) with all 10 or more data available (Z all) and with September removed (Z -Sep.). Measurements whose trends switched from significant (Z > 1.98) to not significant, or vice versa, are shown in bold, n.a. = data not reported.

Author Contributions

Conceptualization, C.P.C.-C. and M.G.; methodology, M.V.E.-A.; software, C.P.C.-C. and H.M.-d.; validation, M.V.E.-A. and M.T.A.-H.; formal analysis, C.P.C.-C. and H.M.-d.; investigation, M.V.E.-A., H.M.-d., M.T.A.-H. and C.P.C.-C.; data curation, M.G.; writing—original draft preparation, M.G.; writing—review and editing, M.V.E.-A. and M.T.A.-H.; visualization, M.G.; supervision, M.G. All authors have read and agreed to the published version of the manuscript.

Funding

This research received no external funding.

Data Availability Statement

All data utilized in this study were extracted from Mexico’s National Network for Water Quality (RENAMECA) publicly available from https://www.gob.mx/conagua/articulos/calidad-del-agua (accessed on 9 September 2023). Additional groundwater information (aquifer location and aquifer names) was obtained from Mexico’s Government sites https://www.gob.mx/conagua/acciones-y-programas/aguascalientes-75049 (accessed on 9 September 2023), https://www.gob.mx/conagua/acciones-y-programas/durango-74895 (accessed on 9 September 2023), and https://www.gob.mx/conagua/acciones-y-programas/zacatecas-74771 (accessed on 9 September 2023).

Acknowledgments

We would like to acknowledge the reviewers who kindly provided their time and effort to review this manuscript.

Conflicts of Interest

The authors declare no conflict of interest.

References

  1. Turral, H.; Burke, J.; Faurès, J. Climate Change, Water and Food Security; FAO: Rome, Italy, 2011; Available online: http://www.fao.org/3/i2096e/i2096e.pdf (accessed on 9 September 2021).
  2. Scanlon, B.R.; Fakhreddine, S.; Rateb, A.; de Graaf, I.; Famiglietti, J.; Gleeson, T.; Grafton, R.Q.; Jobbagy, E.; Kebede, S.; Kolusu, S.R.; et al. Global water resources and the role of groundwater in a more resilient water future. Nat. Rev. Earth Environ. 2023, 4, 87–101. [Google Scholar] [CrossRef]
  3. Wada, Y.; van Beek, L.P.H.; Bierkens, M.F.P. Nonsustainable groundwater sustaining irrigation: A global assessment. Water Resour. Res. 2012, 48, W00L06. [Google Scholar] [CrossRef]
  4. Alghamdi, A.G.; Aly, A.A.; Majrashi, M.A.; Ibrahim, H.M. Impact of climate change on hydrochemical properties and quality of groundwater for domestic and irrigation purposes in arid environment: A case study of Al-Baha region, Saudi Arabia. Environ. Earth Sci. 2023, 82, 39. [Google Scholar] [CrossRef]
  5. Islam, M.A.; Hoque, M.A.; Ahmed, K.M.; Butler, A.P. Impact of climate change and land use on groundwater salinization in Southern Bangladesh—Implications for other Asian deltas. Environ. Manag. 2019, 64, 640–649. [Google Scholar] [CrossRef] [PubMed]
  6. Slama, F.; Gargouri-Ellouze, E.; Bouhlila, R. Impact of rainfall structure and climate change on soil and groundwater salinization. Clim. Chang. 2020, 163, 395–413. [Google Scholar] [CrossRef]
  7. Shattuck, M.D.; Fazekas, H.M.; Wymore, A.S.; Cox, A.; McDowell, W.H. Salinization of stream water and groundwater at daily to decadal scales in a temperate climate. Limnol. Oceanogr. Lett. 2023, 8, 131–140. [Google Scholar] [CrossRef]
  8. Etikala, B.; Adimalla, N.; Madhav, S.; Somagouni, S.G.; Kumar, P.L.K.K. Salinity problems in groundwater and management strategies in arid and semi-arid regions. In Groundwater Geochemistry: Pollution and Remediation Methods; Madhav, S., Singh, P., Eds.; John Wiley & Sons Ltd.: Hoboken, NJ, USA, 2021; pp. 42–56. [Google Scholar] [CrossRef]
  9. Greene, R.; Timms, W.; Rengasamy, P.; Arshad, M.; Cresswell, R. Soil and aquifer salinization: Toward an integrated approach for salinity management of groundwater. In Integrated Groundwater Management; Jakeman, A.J., Barreteau, O., Hunt, R.J., Rinaudo, J.D., Ross, A., Eds.; Springer International Publishing AG: Cham, Switzerland, 2016; Volume 2016, pp. 377–412. [Google Scholar] [CrossRef]
  10. Yang, F.; Jia, C.; Yang, H.; Yang, X. Development, hotspots and trend directions of groundwater salinization research in both coastal and inland areas: A bibliometric and visualization analysis from 1970 to 2021. Environ. Sci. Pollut. Res. 2022, 29, 67704–67727. [Google Scholar] [CrossRef]
  11. Pulido-Bosch, A.; Rigol-Sanchez, J.P.; Vallejos, A.; Andreu, J.M.; Ceron, J.C.; Molina-Sanchez, L.; Sola, F. Impacts of agricultural irrigation on groundwater salinity. Environ. Earth Sci. 2018, 77, 197. [Google Scholar] [CrossRef]
  12. Hansen, B.; Thorling, L.; Schullehner, J.; Termansen, M.; Dalgaard, T. Groundwater nitrate response to sustainable nitrogen management. Sci. Rep. 2017, 7, 8566. [Google Scholar] [CrossRef]
  13. Qadir, M.; Sposito, G.; Smith, C.J.; Oster, J.D. Reassessing irrigation water quality guidelines for sodicity hazard. Agric. Water Manag. 2021, 255, 107054. [Google Scholar] [CrossRef]
  14. Abdessattar, A.; Kateb, S. Water quality assessment and reuse potential of groundwater combined saline solution for irrigation. Water Pract. Technol. 2023, 18, 626–646. [Google Scholar] [CrossRef]
  15. Hergert, G.W.; Knudsen, D. G77-328 Irrigation Water Quality Criteria. In Historical Materials from University of Nebraska-Lincoln Extension; Paper 1416; University of Nebraska—Lincoln: Lincoln, Nebraska, 1977; Available online: http://digitalcommons.unl.edu/extensionhist/1416 (accessed on 9 September 2023).
  16. Peterson, H.G. Irrigation and Salinity, WateResearch Corp. and Agriculture and Agri-Food Canada-Prairie Farm; Agriculture and Agrifood Canada: Ottawa, ON, Canada, 1999; 3p.
  17. Richards, L.A. Diagnosis and Improvement of Saline and Alkali Soils; Handbook, No. 60; U.S. Department of Agriculture: Washington, DC, USA, 1954; p. 160.
  18. Raghunath, H.M. Groundwater; Wiley Eastern Ltd.: Delhi, India, 1987; p. 563. [Google Scholar]
  19. Szabolcs, I.; Darab, C. The Influence of Irrigation Water of High Sodium Carbonate Content on Soils; ISSS Trans II.; Research Institute for Soil Science and Agricultural Chemistry of the Hungarian Academy of Sciences: Budapest, Hungary, 1964; pp. 802–812. [Google Scholar]
  20. Kelly, E.W.P. Permissible composition and concentration of irrigated waters. Proc. Am. Soc. Civil Eng. 1940, 66, 607–613. [Google Scholar]
  21. Todd, D.K. Groundwater Hydrology, 1st ed.; John Wiley and Sons, Inc.: Hoboken, NJ, USA, 1960; p. 160. [Google Scholar]
  22. Doneen, L.D. Notes on Water Quality in Agriculture; Department of Water Science and Engineering, University of California: Berkeley, CA, USA, 1964; p. 400. [Google Scholar]
  23. Cruz, R.Y.B.; Liotta, M.; Rodríguez, J.A.B.; Zamora, Y.M.; Kretzschmar, T.G.; Rodríguez, I.M.d.l.G.; Gutiérrez, L.E.C.; Martínez, R.D.; Moreno, J.A.B.; Carmenates, Y.A.; et al. Hydrochemical and isotopic characterization of the Region Carbonífera aquifer: An example of hydrogeological systems in the semi-arid climates of northeastern Mexico. Appl. Geochem. 2022, 141, 105307. [Google Scholar] [CrossRef]
  24. Lassaletta, L.; Einarsson, R.; Quemada, M. Nitrogen use efficiency of tomorrow. Nat. Food 2023, 4, 281–282. [Google Scholar] [CrossRef] [PubMed]
  25. Dodds, W.K.; Welsh, E.B. Establishing nutrient criteria in streams. J. N. Am. Benthol. Soc. 2000, 19, 186–196. [Google Scholar] [CrossRef]
  26. World Health Organization (WHO). Guidelines for Drinking-Water Quality: Fourth Edition Incorporating the First and Second Addenda; WHO: Geneva, Switzerland, 2022; ISBN 978-92-4-004506-4. [Google Scholar]
  27. Diario Oficial de la Federación, Norma Oficial Mexicana NOM-127-SSA1-2021. Mexico. Available online: https://www.dof.gob.mx/nota_detalle.php?codigo=5650705&fecha=02/05/2022#gsc.tab=0 (accessed on 23 June 2023).
  28. Ayers, R.S.; Westcot, D.W. Water Quality for Agriculture; FAO Irrigation and Drainage Paper 29; Revision 1; Food and Agriculture Organization: Rome, Italy, 1994; 174p. [Google Scholar]
  29. Litalien, A.; Zeeb, B. Curing the earth: A review of anthropogenic soil salinization and plant-based strategies for sustainable mitigation. Sci. Total Environ. 2019, 698, 134235. [Google Scholar] [CrossRef] [PubMed]
  30. Mahlknecht, J.; Steinich, B.; de León, I.N. Groundwater chemistry and mass transfers in the Independence aquifer, central Mexico, by using multivariate statistics and mass-balance models. Environ. Geol. 2004, 45, 781–795. [Google Scholar] [CrossRef]
  31. Alarcón-Herrera, M.T.; Martin-Alarcon, D.A.; Gutiérrez, M.; Reynoso-Cuevas, L.; Martín-Domínguez, A.; Olmos-Márquez, M.A.; Bundschuh, J. Co-occurrence, possible origin, and health-risk assessment of arsenic and fluoride in drinking water sources in Mexico: Geographical data visualization. Sci. Total Environ. 2020, 698, 134168. [Google Scholar] [CrossRef]
  32. Gutiérrez, M.; Alarcón-Herrera, M.T.; Gaytán-Alarcón, M.P. Arsenic and fluorine in northern Mexico, spatial distribution and enrichment factors. Environ. Monit. Assess. 2023, 195, 212. [Google Scholar] [CrossRef]
  33. Lopez-Alvarez, B.; Ramos-Leal, J.A.; Morán-Ramírez, J.; Arango-Galvan, C. Edaphological and water quality conditions that limit agricultural development in semi-arid zones of Northeastern Mexico. Environ. Monit. Assess. 2021, 193, 40. [Google Scholar] [CrossRef]
  34. Santacruz-De León, G.; Morán-Ramírez, J.; Ramos-Leal, J.A. Impact of drought and groundwater quality on agriculture in a semi-arid zone of Mexico. Agriculture 2022, 12, 1379. [Google Scholar] [CrossRef]
  35. Mora, A.; Torres-Martínez, J.A.; Moreau, C.; Bertrand, G.; Mahlknecht, J. Mapping salinization and trace element abundance (including As and other metalloids) in the groundwater of north-central Mexico using a double-clustering approach. Water Res. 2021, 205, 117709. [Google Scholar] [CrossRef] [PubMed]
  36. Torres-Martinez, J.A.; Dorjderem, B.; Mahlknecht, J. Revisiting groundwater chemical processes in a rapidly urbanizing basin. Energy Rep. 2020, 6, 868–873. [Google Scholar] [CrossRef]
  37. Ortiz-Letechipia, J.; González-Trinidad, J.; Júnez-Ferreira, H.E.; Bautista-Capetillo, C.; Dávila-Hernández, S. Evaluation of groundwater quality for human consumption and irrigation in relation to arsenic concentration in flow systems in a semi-arid Mexican region. Int. J. Environ. Res. Public Health 2021, 18, 8045. [Google Scholar] [CrossRef]
  38. Nieto-Samaniego, A.F.; Alaniz-Alvarez, S.A.; Camprubí Cano, A. La Mesa Central: Estratigrafía, estructura y evolución tectónica cenozoica. Bol. Soc. Geol Mex. 2005, 57, 285–318. [Google Scholar] [CrossRef]
  39. CONABIO. La Biodiversidad en Durango, Estudio de Estado, 1st ed.; Comisión Nacional para el Conocimiento y Uso de la Biodiversidad: Ciudad de México, Mexico, 2017; p. 38. ISBN 978-607-8328-97-0. [Google Scholar]
  40. Cauich-Kau, D.A.; Cardona-Benavides, A.; Castro-Larragoitia, J.; Rüde, T.R. Understanding Co-Occurrence and Mobility of Uranium and Arsenic Sources in Groundwater Flow Systems in Semi-Arid Zones in the Mexican Altiplano; EGU2020-461; European Geosciences Union: Munich, Germany, 2020. [Google Scholar] [CrossRef]
  41. Cauich Kau, D.; Rüde, T.R.; Cardona Benavides, A.; Castro Larragoitia, J. Natural occurrence and controls of arsenic in groundwater in a semiarid basin in the Mexican Altiplano. Hydrogeol. J. 2022, 30, 2459–2477. [Google Scholar] [CrossRef]
  42. Comisión Nacional del Agua. Mexico’s National Network for Water Quality (RENAMECA). Available online: https://www.gob.mx/conagua/articulos/calidad-del-agua (accessed on 9 July 2023).
  43. Gobierno de México. Comisión Nacional del Agua, Normas Mexicanas Vigentes del Sector Hídrico. Available online: https://www.gob.mx/conagua/acciones-y-programas/normas-mexicanas-83266 (accessed on 31 August 2023).
  44. Gobierno de México. Comisión Nacional del Agua. Available online: https://www.gob.mx/conagua/acciones-y-programas/aguascalientes-75049 (accessed on 8 July 2023).
  45. Gobierno de México. Comisión Nacional del Agua. Available online: https://www.gob.mx/conagua/acciones-y-programas/durango-74895 (accessed on 8 July 2023).
  46. Gobierno de México. Comisión Nacional del Agua. Available online: https://www.gob.mx/conagua/acciones-y-programas/zacatecas-74771 (accessed on 8 July 2023).
  47. de Ávila, H.M.; Júnez-Ferreira, H.E.; Gonzalez-Trinidad, J.; Esteller-Alberich, M.V.; Silva-Ávalos, R.U.; Dávila-Hernández, S.; Cázares-Escareño, J.; Bautista-Capetillo, C.F. Schematization of converging groundwater flow systems based on 3D geostatistics. Water 2022, 14, 3169. [Google Scholar] [CrossRef]
  48. Mann, H.B. Non-parametric tests against trend. Econometrica 1945, 13, 245–259. [Google Scholar] [CrossRef]
  49. Ducci, D.; della Morte, R.; Mottola, A.; Onorati, G.; Pugliano, G. Evaluating upward trends in groundwater nitrate concentrations: An example in an alluvial plain of the Campania region (Southern Italy). Environ. Earth Sci. 2020, 79, 319. [Google Scholar] [CrossRef]
  50. Wang, F.; Shao, W.; Yu, H.; Kan, G.; He, X.; Zhang, D.; Ren, M.; Wang, G. Re-evaluation of the power of the Mann-Kendall test for detecting monotonic trends in hydrometeorological time series. Front. Earth Sci. 2020, 8, 14. [Google Scholar] [CrossRef]
  51. Jurgens, B.C.; Fram, M.S.; Rutledge, J.; Bennett, V.G.L. Identifying areas of degrading and improving groundwater-quality conditions in the State of California, USA, 1974-2014. Environ. Monit. Assess. 2020, 192, 250. [Google Scholar] [CrossRef] [PubMed]
  52. Ghosh, S.; Jha, M.K. Analysis of trend in groundwater-quality parameters: A case study. In Proceedings of the 2nd International Conference on Recent Advances in Water Science and Technology (ICRAWST-2022), Coimbatore, India, 7–9 December 2022; Volume 4, pp. 17–45. [Google Scholar] [CrossRef]
  53. Guerrero, M.A.O.; Castellanos, J.Z.; Aguilar, R.; Alarcón, A.V.; Alanis, E.; Vargas, C.; Urrutia, F. A conceptual model for increases of sodium, SAR, alkalinity and pH at the Independence aquifer in Guanajuato. Terra Latinoam. 2002, 20, 199–207. [Google Scholar]
  54. Roy, P.D.; Selvam, S.; Gopinath, S.; Lakshumanan, C.; Muthusankar, G.; Quiroz-Jiménez, J.D.; Venkatramanan, S. Hydro-geochemistry-based appraisal of summer-season groundwater from three different semi-arid basins of northeast Mexico for drinking and irrigation. Environ. Earth Sci. 2021, 80, 529. [Google Scholar] [CrossRef]
  55. Ortega-Guerrero, A. Evaporative concentration of arsenic in groundwater: Health and environmental implications, La Laguna Region, Mexico. Environ. Geochem. Health 2017, 39, 987–1003. [Google Scholar] [CrossRef] [PubMed]
  56. Dorjderem, B.; Torres-Martinez, J.A.; Mahlknecht, J. Intensive long-term pumping in the Principal-Lagunera Region aquifer (Mexico) causing heavy impact on groundwater quality. Energy Rep. 2020, 6 (Suppl. S1), 862–867. [Google Scholar] [CrossRef]
  57. Knappett, P.S.; Li, Y.; Loza, I.; Hernandez, H.; Avilés, M.; Haaf, D.; Majumder, S.; Huang, Y.; Lynch, B.; Piña, V.; et al. Rising arsenic concentrations from dewatering a geothermally influenced aquifer in central Mexico. Water Res. 2020, 185, 116257. [Google Scholar] [CrossRef]
  58. Wang, F.; Yang, H.; Zhang, Y.; Wang, S.; Liu, K.; Qi, Z.; Chai, X.; Wang, L.; Wang, W.; Banadkooki, F.B.; et al. Solute geochemistry and water quality assessment of groundwater in an arid endorheic watershed on Tibetan Plateau. Sustainability 2022, 14, 15593. [Google Scholar] [CrossRef]
  59. Palmer, J. Preparing for a drier future in the Colorado Basin; American Geophysical Union: Washington, DC, USA; Wiley: Hoboken, NJ, USA, 20 June 2023; 3p. [Google Scholar]
  60. Noori, R.; Maghrebi, M.; Mirchi, A.; Tang, Q.; Bhattarai, R.; Sadegh, M.; Noury, M.; Haghighi, A.T.; Kløve, B.; Madani, K. Anthropogenic depletion of Iran’s aquifers. PNAS 2021, 118, e2024221118. [Google Scholar] [CrossRef]
  61. Yang, H.; Xiao, Y.; Hao, Q.; Wang, L.; Zhang, Y.; Liu, K.; Zhu, Y.; Liu, G.; Yin, S.; Xie, Z. Geochemical characteristics, mechanisms and suitability for sustainable municipal and agricultural water supply of confined groundwater in central North China Plain. Urban Clim. 2023, 49, 101459. [Google Scholar] [CrossRef]
  62. Bhatnagar, A.; Sillanpää, M. A review of emerging adsorbents for nitrate removal from water. Chem. Eng. J. 2011, 168, 493–504. [Google Scholar] [CrossRef]
  63. Huang, F.; Zhang, Y.; Zhang, D.; Chen, X. Environmental groundwater depth for groundwater-dependent terrestrial ecosystems in arid/semiarid regions: A review. Int. J. Environ. Res. Public Health 2019, 16, 763. [Google Scholar] [CrossRef] [PubMed]
  64. Wu, P.; Wu, X.; Wang, Y.; Xu, H.; Owens, G. Towards sustainable saline agriculture: Interfacial solar evaporation for simultaneous seawater desalination and saline soil remediation. Water Res. 2022, 212, 118099. [Google Scholar] [CrossRef] [PubMed]
Figure 1. Location of study area and the surrounding mountain belts: Sierra Madre Occidental (green), Sierra Madre Oriental (orange), and Mexican Volcanic Belt (pink).
Hydrology 10 00194 g001
Figure 2. Study area divided into sections 1, 2, and 3. Circles show the location of sampled wells.
Hydrology 10 00194 g002
Figure 3. Spatial distribution of NO3-N, TDS, Na+, and SAR concentrations for 2020.
Hydrology 10 00194 g003
Table 1. Formula indexes for irrigation water quality.
IndexFormula
(Concentrations Are Expressed in meq L−1, Except TH in mg L−1)
Classification
and Recommended Limits
Source
SAR
Sodium Adsorption ratio
N a + C a 2 + + M g 2 + 2 <10 excellent; 10–18 good;
>18 doubtful
[17]
RSC
Residual Sodium Carbonate
[ H C O 3 + C O 3 2 ] [ C a 2 + + M g 2 + ] <1.25 good; 1.25–2.5 doubtful[18]
MAR
Magnesium Hazard index
M g 2 + C a 2 + + M g 2 + 100<50 suitable; >50 unsuitable[19]
KI
Kelly Index
N a + C a 2 + + M g 2 + <1 good; >1 unsuitable[20]
TH
Total Hardness
2.497   C a 2 + + 4.11   M g 2 + <75 soft 75–150 semi hard;
150–300 hard; >300 very hard
[21]
PI
Permeability Index
N a + + H C O 3 C a 2 + + M g 2 + + N a + × 100 >75% good class I
25%–75% good class II
<25% unsuitable
[22]
Residual Ratio M g 2 + C a 2 + <1.5 good; 1.5–3 moderate;
>3 unsuitable
[22]
Na%
Sodium Percentage
N a + + K + C a 2 + + M g 2 + + N a + + K + <20 excellent; 20–40 good
40–60 doubtful; >80 unsuitable
[21]
Table 2. Health and soil and crop hazards of water parameters in this study.
ParameterType of HazardRecommended GuidelinePotential Effects
NO3-NPublic Health, drinking water50 mg L−1 as nitrate ion (equivalent to about 10 mg L−1 NO3-N, WHO [26]
11 mg L−1, Mexico [27]
Methemoglobinemia (Blue Baby Syndrome)
Gastrointestinal Disturbances,
Thyroid Malfunction [26].
TDSPublic Health, drinking water<500 mg L−1 sweet
500–1000 mg L1 fresh
>1000 mg L1 saline
TDS is not considered a health hazard, but an elevated TDS level can affect taste [26]. Scaling in water pipes and appliances may occur at high TDS.
Na+Public Health, drinking water200 mg L−1 for tasteNot of health concern at levels found in drinking-water. The contribution from drinking water to daily intake is generally small [26].
ClPublic Health, drinking water250 mg L−1 for tasteTaste detects Cl at 200–250 mg L−1. No health-based guideline has been proposed [26].
SARSoil and crop>6
>9
Chances for decreased soil permeability increases. High SAR produces a breakdown in the physical structure of the soil; SAR hazard varies according to soil permeability and TDS [15,28,29].
Na+Soil and cropSodium hazard is calculated as SAR (see above)Na+ causes dispersion of soil particles and the soil to be increasingly impervious to water penetration. Reduces osmotic pressure lessening the water intake by roots [28,29]. Toxic to sensitive crops.
ClSoil and cropMany tree crops start to show injury at 0.3% Cl (dry weight) Cl is not adsorbed by soils, therefore it is taken up by the crop and accumulates in the leaves. Once the tolerance of the crop is exceeded, injury occurs [28].
Table 3. Median and range of values of the chemical parameters in each section. Values include data reported from 2012 to 2021. N = number of measurements.
Section 1
N = 700, 98 Wells
Section 2
N = 670, 94 Wells
Section 3
N = 206, 33 Wells
NO3-N, mg L−1 1.31(0.01–17.5) 2.59(0.01–67.3) 5.00(0.03–53)
TDS, mg L−1 313(91–1,004) 408(76–3810) 604(121–2646)
SAR 2.3(0.2–34.7) 2.3(0.1–89) 1.6(0.12–7.1)
Na+, mg L−1 54.0(5.0–359) 64.2(5.0–641) 63.4(5.0–492)
Ca2+, mg L−1 36.3(2.2–117) 50.4(2.0–596) 104.9(27.6–423)
Mg2+, mg L−1 2.4(0.06–83) 8.3(0.5–97) 18.0(0.5–90.0)
pH 7.70(6.70–9.40) 7.70(6.60–9.30) 7.60(6.70–8.70)
HCO3, mg L−1 114.5(37.0–368) 127.6(24.0–511) 127.0(55.2–246)
SO42−, mg L−1 17.9(0.4–329) 46.4(0.6–1775) 183.6(0.6–1206)
Cl, mg L−1 5.0(5.0–68) 17.4(5.0–587) 23.5(5.0–192)
SiO2, mg L−1 62.2(15.0–155) 60.0(0.02–300) 34.6(6.6–75.2)
Table 4. Results in number of samples under each category and in percentage of the total number of samples of each section, NTOT. Data correspond to samples collected between 2012 and 2021.
Section 1
NTOT = 700
Section 2
NTOT = 670
Section 3
NTOT = 206
NO3-N
   >11 mg L−1 NO3-N, Mexican norm [27]50.7%7611.3%3115.0%
   >3 mg L−1 NO3-N, eutrophication [25]10014.3%28141.9%13264.1%
TDS
   >1000 mg L−1, saline water10.1% 9414.0%4521.7%
   <1000 mg L−1, fresh water69999.9%57686.0% 16178.2%
SAR
   <10 excellent 64592.1%65497.6%20097.1%
   10–18 good466.6%91.3% 63.0%
   >18 doubtful91.3%60.9% 00%
Combination TDS and SAR
   TDS < 700 and SAR < 4, safe50371.9% 43364.6% 15160.0%
   700 < TDS < 1750 and 4 < SAR < 9, possibly safe19728.1% 23735.4%10936.9%
   TDS > 1750 and SAR > 9, hazardous00% 10.1% 72.9%
Table 5. Spearman correlation coefficients ρ. Values in bold represent strong correlation (ρ > 0.40) and significant at p < 0.001.
Section, No. Data NO3-NTDSNa+SAR
1NO3-N 1.000.530.330.28
N = 696TDS 1.000.780.66
Na+ 1.000.96
SAR 1.00
2NO3-N1.000.740.710.67
N = 667TDS 1.000.910.83
Na+ 1.000.97
SAR 1.00
3NO3-N1.000.310.180.18
N = 206TDS 1.000.880.79
Na+ 1.000.96
SAR 1.00
Table 6. Summary of number of wells with upward and downward trends (2012–2021). The number of wells available for determination of trends was constrained by having 8 or more yearly data.
No. Wells AvailableUpward Trend,
No.
Upward Trend,
%
Downward Trend, No.Downward Trend, %
NO3-N, mg L−18279.867.3
TDS, mg L−18344.811.2
Na+, mg L−15024.024.0
SAR4924.1510.2
Table 7. Location of wells reporting upward trends and their Z (Mann–Kendall) and Sen’s slope values. NO3-N in mg L−1, Sen slope is calculated based on values reported in mg L−1. The larger the value of Z (Mann–Kendall) and Sen’s slope, the steeper and better-defined the trend [49].
Well No.Aquifer,
Section
ZSen SlopeWell No.Aquifer, SectionZSen Slope
NO3-N TDS
   ZAC26273227, 13.090.17   ZAC26223226, 12.1010.5
   ZAC26353231, 12.100.31   DUR6781020, 22.3542.5
   ZAC26443219, 32.100.52   OCC5241  523, 32.2222.7
   AUG19  101, 12.590.07   OCC5247  523, 32.8148.5
   OCC5246  523, 32.590.23Na+
   OCC5247  523, 33.020.66   ZAC25893226, 12.8616.1
   OCC5249  523, 32.591.35   DUR8331009, 12.593.60
SAR
   ZAC26233226, 12.190.06
   OCC5241  523, 32.840.06
Table 8. Location of wells reporting downward trends and their Z (Mann–Kendall) and Sen’s slope values. NO3-N in mg L−1, Sen slope is calculated based on values reported in mg L−1. The larger the value of Z (Mann–Kendall) and Sen’s slope, the steeper and better-defined the trend [49].
Well No.Aquifer,
Section
ZSen SlopeWell No.Aquifer, SectionZSen Slope
NO3-N TDS
   ZAC26103210, 4−2.35−0.05   DUR8371015, 2−2.32−46.5
   ZAC26123210, 4−1.98−0.03Na+
   ZAC26293227, 1−1.98−0.15   DUR8371015, 2−3.21−13.2
   AGU49  104, 1−2.32−0.05SAR
   AGU50  101, 1−1.98−0.05   ZAC25993212, 4−2.10−0.03
   DUR7661016, 1−2.35−0.09   ZAC26523225, 1−2.19−0.03
   OCC5263  523, 3−2.81−0.18   DUR8231028, 2−2.35−0.01
   DUR8371015, 2−3.04−0.37
   OCC52441022, 3−1.98−0.02
Disclaimer/Publisher’s Note: The statements, opinions and data contained in all publications are solely those of the individual author(s) and contributor(s) and not of MDPI and/or the editor(s). MDPI and/or the editor(s) disclaim responsibility for any injury to people or property resulting from any ideas, methods, instructions or products referred to in the content.

