Article

Effect of Inserting Baffles on the Solid Particle Segregation Behavior in Fluidized Bed Reactor: A Computational Study

by
Suchart Kreesaeng
1,
Benjapon Chalermsinsuwan
1,2,3 and
Pornpote Piumsomboon
1,2,*
1
Fuels Research Center, Department of Chemical Technology, Faculty of Science, Chulalongkorn University, 254 Phayathai Road, Wangmai, Patumwan, Bangkok 10330, Thailand
2
Center of Excellence on Petrochemical and Materials Technology, Chulalongkorn University, 254 Phayathai Road, Wangmai, Patumwan, Bangkok 10330, Thailand
3
Advanced Computational Fluid Dynamics Research Unit, Chulalongkorn University, 254 Phayathai Road, Wangmai, Patumwan, Bangkok 10330, Thailand
*
Author to whom correspondence should be addressed.
ChemEngineering 2024, 8(1), 7; https://doi.org/10.3390/chemengineering8010007
Submission received: 10 November 2023 / Revised: 20 December 2023 / Accepted: 25 December 2023 / Published: 1 January 2024
(This article belongs to the Topic Advances in Chemistry and Chemical Engineering)

Abstract

:
In multi-solid, particle-size fluidized bed reactor systems, segregation is commonly observed. When segregation occurred, small solid particles were entrained to the top of the bed and escaped from the reactor. During the combustion process, the small solid particles that escaped from the boiler were burned and subjected to damage around the cyclone separator. This study then employed a computational fluid dynamics approach to investigate solid particle behavior in the reactor using three different sizes of solid particles. The effects of baffle insertion, baffle angle, stage number, and its arrangement were examined. The percentage of segregation was calculated to compare behavior among different reactor systems. The insertion of 45-degree baffles resulted in reduced segregation behavior compared to cases without baffles and with 90-degree baffles, attributed to solid hindering and collision phenomena. Additionally, a double-stage baffle with any arrangement could reduce segregation behavior. The best arrangement was “above-arrangement” due to particles hindering, swirling, and accumulating between the baffle stages. Therefore, to diminish segregation behavior and enhance combustion chemical reactions, the insertion of baffles in the reactor zone is recommended.

1. Introduction

Fluidization is a phenomenon in which solid particles exhibit fluid-like properties when suspended in an upward-flowing airstream. This phenomenon finds conventional application in various industrial processes such as fluid catalytic cracking, melamine production, polymer production, and power plants.
In power plant applications, the fluidized bed reactor plays a crucial role in the boiler’s combustion process. The fluidized bed combustor (FBC) accommodates a wide range of solid particle sizes, supporting both coal and biomass fuels. Typically, sand is used as the inert bed material. Due to the efficient mixing of solid particles within the system, the fluidized bed reactor facilitates excellent heat transfer between gas–solid and solid–solid particles. Consequently, the temperature in the FBC reactor is lower compared to conventional processes, while maintaining comparable combustion efficiency. This lower temperature reduces issues like slagging and fouling from ash fusion, as well as lowering NOx emissions [1].
The use of a mixed-solid fuel in the FBC reactor impacts solid particle mixing within the system. Hence, studying solid particle behavior is a critical step in improving FBC reactors. Numerous researchers have delved into this topic, focusing on enhancing mixing and segregation behavior [2,3,4,5,6,7,8,9,10,11,12,13,14,15]. One approach has been the development of multi-stage fluidized bed reactors. For instance, Wu et al. [2] investigated the multi-stage fluidized bed in desulfurization applications, integrating two enlarged sections into the fluidized bed. The results indicated enhanced gas–solid particle mixing in the enlarged zone, with back-mixing occurring in the lower cone zone.
Kersten et al. [3] examined the multi-stage fluidized bed for biomass gasification, employing two opposite cones as a segment and integrating seven segments into the riser. Their results showed no back-mixing of gas and solid particles between segments. Due to a higher ratio between solid and gas residence times compared to that of a normal fluidized bed, carbon conversion and gasification efficiency were improved. In a multi-stage countercurrent fluidized bed reactor, Li et al. [4] studied desulfurization and denitration. They employed a distributor to separate each stage, providing weak back-mixing of solid particles and extended gas–solid particle contact time. This increased the number of stages, leading to higher NO conversion with complete SO2 removal in the first stage. Davarpanah et al. [5] explored the adsorption of 1,2,4-trimethylbenzene on activated carbon in a multi-stage countercurrent fluidized bed adsorber. Similar to Li et al., their results demonstrated increased removal efficiency with additional stages. However, after adding two more stages (from four to six), the removal efficiency decreased to 3.4% due to slow kinetics and small concentration differences between the adsorbate and adsorbent sites. For coal pyrolysis with char gasification, Chen et al. [6] also investigated these reactions in a similar fluidized bed reactor. As the number of stages increased, a temperature gradient was established, leading to increased carbon conversion, gas yield, and tar yield.
Additionally, some researchers improved gas–solid particle mixing by inserting baffles into the reactor. Yang et al. [7] used perforated plates as baffles and gas redistributors to study flow characteristics in bubbling fluidized bed reactors. They found that average solid velocity was lower compared to freely bubbling fluidized beds, and solid particle back-mixing was prevented by the addition of baffles.
Hyun et al. [8] examined mixing/segregation behavior in the fluidized bed reactor of a binary system of solid particles with different densities. The first solid particle was sand (as jetsam), and the second one was polymethylmethacrylate (PMMA). The results demonstrated the effect of superficial gas velocity on segregation behavior, with increasing inlet velocity leading to decreased segregation degrees. Zhang et al. [9] focused on the effect of exit geometries on the segregation of binary solid particles in the circulating fluidized bed system. Three exit geometries (C-shape, T-shape, and L-shape) were studied, and, similar to Hyun et al., they found that increasing superficial gas velocity reduced solid segregation. Furthermore, Park et al. [10] studied the effect of a column shape on the segregation behavior of char and sand. Circular, square, and rectangular columns were investigated. Their study showed that the maximum segregation was observed at a ratio between superficial gas velocity and minimum fluidization velocity of 1.14. In the mixing region, the column shape affected the mass fraction of char at the top of the bed. The char mass fractions were 0.53, 0.60, and 0.45 for circular, rectangular, and square shapes, respectively. The rectangular shape exhibited the smallest mixing index. Zhao et al. [11] investigated the utilization of louver baffles in gas–solid separation fluidized beds (GSSFBs) to ameliorate fluidization quality and coal separation efficiency. Complementing experimental and numerical simulations, their findings highlighted a significant enhancement in fluidization characteristics and coal separation efficiency, attributing these improvements to the louver baffle’s ability to reduce pressure drop and optimize gas–solid flow.
In parallel, Oloruntoba et al. [12] explored the application of baffles in mitigating gas maldistribution within low-velocity fluidized beds. Employing multi-phase particle-in-cell simulations, their research showcased how strategically placed baffles improved hydrodynamics, reduced gas channeling, and augmented gas–solid contact efficiency. Notably, the study underscored the pivotal role of proper baffle design, with the single-turn Louvre baffle exhibiting optimal performance for reactor enhancement.
Furthermore, Phuakpunk et al. [13] delved into the impact of bubble coalescence in bubbling bed gasifiers and the potential use of louver baffles to mitigate this effect. Their computational fluid dynamics (CFD) simulations elucidated the significant role of baffle configuration in reducing bubble size and enhancing gas–solid contact, thereby bolstering gasifier performance. Additionally, their investigation into multilayered louver baffles in biomass gasifiers highlighted the improved biomass distribution while preserving total pressure drop and identified the optimal gas inlet velocity for enhanced performance [14].
Moreover, N. Liu et al. [15] contributed to this domain by examining louver baffles’ unique impact on the hydrogenation of silicon tetrachloride within fluidized beds. Their study demonstrated louver baffles’ superiority in achieving uniform gas-solids flow, reduced gas back-mixing, and promoting catalytic hydrogenation, leading to increased gaseous reactant conversion.
In actual industrial settings, a variety of fuels are fed into the fluidized bed boiler. Differences in size and density among the mixed fuels lead to particle segregation in the system. Controlling segregation behavior in the fluidized bed reactor can help prevent damage to the boiler system. In this study, a fluidized bed reactor with three different sizes of solid particles was selected to investigate solid particle behavior using a computational fluid dynamics approach. Baffles with different baffle angles were inserted into the reactor, and the segregation behavior of solid particles was investigated and compared for each baffle angle by calculating the percentage of segregation of the system.

2. Materials and Methods

In this study, the computational domain was constructed based on the dimensions of the fluidized bed reactor, as outlined by Akbari et al. [16]. The aim was to analyze the impact of the distributor on the hydrodynamic performance of industrial polydisperse gas-phase fluidized bed polymerization reactors. Additionally, the reactor was utilized to investigate both the hydrodynamics and mixing/segregation behaviors across a wide range of particle size distributions within an industrial gas-phase polymerization reactor [17]. Furthermore, the study aimed to explore the behavior of a gas-phase fluidized bed polymerization reactor using a 2D CFD-PBM-coupled model [18]. The reactor had a height of 33.9 m and a diameter of 5 m, with a reaction zone of 20.5 m in height. The employed computational domain is illustrated in Figure 1. Gas was introduced into the reactor at the bottom of the reactor as the inlet boundary condition. The outlet boundary condition was settled at the top of the reactor. The other boundary condition was settled as the wall boundary condition.
Before initiating the simulation, consideration had been given to both the mesh size and the Courant number. The Courant number, represented as Nc, was determined as a dimensionless number computed from the time-step size, mesh dimensions, and inlet velocity [19]. The corresponding equation is as follows:
N c = U d t d x
It was recommended that the Courant number range be maintained between 0.03 and 0.30 [20]. The simulation results were unaffected by the variations in mesh, time step, and convergence criteria. Grid sizes of 0.10, 0.075, and 0.05 m were employed in this study, resulting in grid numbers of 19,225 (coarse grid), 34,128 (medium grid), and 76,581 (fine grid), respectively. Consequently, Courant numbers of 0.031, 0.042, and 0.062 were obtained for each corresponding grid size.

2.1. Mathematical Model

In this study, a transient computational fluid dynamics model was employed to investigate the segregation of solid particles within the reactor. A two-dimensional model utilizing the Euler–Euler approach was implemented to simulate this multi-fluid system. The model encompassed a set of equations, including a continuity equation, momentum equations, and constitutive equations. A simulation incorporating a four-phase model was conducted, encompassing one gas phase and three solid particle phases. According to the literature [18], to encompass a wide range of particle size distribution (385–1520 microns), each solid particle phase was characterized by different sizes: specifically, 385, 765, and 1520 microns, to allow for distinct consideration of their effects. Nevertheless, the density of all solid particles remained constant at 910 kg/cu.m. Furthermore, the standard k-ε model was adopted as the turbulence model. The modified Gidaspow drag model, with a modification factor of 0.45, was employed for the calculation of drag forces between gas and solid particles. Moreover, the interaction of particles with each other was controlled by a solid–solid exchange coefficient, with a restitution coefficient of 0.8.

2.1.1. Governing Equations and Constitutive Equations

  • Continuity equations of gas and solid phases
t α g ρ g + α g ρ g v g = 0
t α s i ρ s i + α s i ρ s i v s i = 0
where
α g + i = 1 3 α s i = 1
  • Momentum equation of gas and solid phases
t α g ρ g v g + α g ρ g v g v g = α g p + τ ¯ ¯ g + α g ρ g g + i = 1 3 K g s i v g v s i
t α s i ρ s i v s i + α s i ρ s i v s i v s i = α s i p p s i + τ ¯ ¯ s i + α s i ρ s i g
+ K g s i v g v s i + k = 1 3 K s i s k v s i v s k
  • Fluid—solid exchange coefficient
Gidaspow drag model
K g s i = 150 α s i 1 α g μ g α g d s i 2 + 1.75 ρ g α s i v g v s i d s i , α s i 0.8
K g s i = 3 4 C D α g α s i ρ s i v g v s i d s i α s i 2.65 , α s i > 0.8
C D = 24 α g R e s i 1 + 0.15 α g R e s i 0.67
  • Drag modification factor
K g s i ' = η K g s i
  • Solid–solid exchange coefficient
K s i s k = 3 1 + e s i s k π 2 + C f r , s i s k π 2 8 α s i ρ s i α s k ρ s k d s i + d s k 2 g 0 , s i s k 2 π ρ s i d s i 3 + ρ s k d s k 3 v s i v s k

2.1.2. Boundary and Initial Conditions

Three boundary conditions were applied to the model, encompassing the inlet, outlet, and wall. The system’s inlet was positioned at the lower section of the reactor, while the outlet was situated at the uppermost part. Each boundary condition was specified as follows:
  • The inlet boundary condition entailed the introduction of gas into the reactor at a velocity of 0.312 m/s. To represent the real condition at 2000 kPa, an introduced gas maintained a constant density and viscosity of 20 kg/m3 and 1.2 × 10⁻⁵ Pa.s, respectively.
  • The outlet boundary condition was characterized by a constant pressure setup, designated as the pressure outlet. The pressure was set to 2000 kPa.
  • Regarding the wall boundary condition, the gas phase was established under a no-slip condition, while all solid particle phases were configured to exhibit a partially slipped condition.
As for the initial condition, well-mixed solid particles were introduced into the reactor, filling to a height of 10 m from the bottom, with a volume fraction of 0.23 assigned to each solid particle size.
The minimum fluidization velocity, calculated using the Wen and Yu equation (Equation (12)), is detailed in Table 1 alongside the corresponding fluidization numbers for each particle size. The fluidization number was defined as the ratio of the superficial gas velocity to the minimum fluidization velocity. This parameter is crucial in determining the fluidization regime and mixing behavior within the fluidized bed. This range of fluidization numbers between 2 and 7 indicates that the gas velocity applied to the bed falls within the necessary range to sustain the particles in a fluidized state. Such a range typically characterizes a condition where the bed behaves akin to a bubbling, fluidized bed.
U m f = μ d p ρ f 33.7 2 + 0.0408 d p 3 ρ f ρ s ρ f g μ 2 33.7

2.2. The Percentage of Segregation

This study examined the effects of inserting baffles and varying baffle angles on segregation behavior in the fluidized bed reactor. To facilitate a clear comparison of particle segregation among the study cases, the percentage of segregation was introduced as a representative measure of the segregation behavior by Goldschmidt et al. [21]. It was used by Fan et al. [22] to investigate the segregation and mixing behavior of particles in polydispersed, fluidized beds. Typically, this rate falls within the range of 0 to 1. A value of s = 0 indicates the perfect mixing of solid particles, while s = 1 signifies complete segregation. The calculation of the percentage of segregation was performed using Equation (13):
s = S 1 S m a x 1
where S = h s m a l l h l a r g e and S m a x = 2 x s m a l l 1 x s m a l l .

2.3. Investigating Parameters

In this study, three parameters were investigated, consisting of baffle angle, baffle stage number, and stage arrangement. Each parameter had two values. There were two different baffle angles in the study, as shown in Figure 2a,b, corresponding to baffle angles of 45° and 90°, respectively. Stage numbers were investigated by comparing single- and double-stage baffles. Finally, the double-stage number was varied with two arrangements: above and below arrangements from the reference position.
To explore the effect of stage number and its configuration on the segregation of solid particles within the reactor, a single baffle stage consisting of 9 baffles set at a 45-degree angle was employed. Single and double stages were utilized, and two types of stage arrangements were encompassed. The first arrangement, denoted as the “above arrangement” and displayed in Figure 3a, featured the insertion of an additional baffle stage above the base stage, positioned at a height of 15 m from the reactor’s bottom. The second arrangement, termed the “below arrangement” and depicted in Figure 3b, involved the insertion of an additional baffle stage below the base stage, situated at a height of 5 m from the reactor’s bottom.

3. Results and Discussion

3.1. Grid Independency Test

In the simulation study, ensuring the accuracy of the results was a primary concern. Therefore, grid independence tests and Courant number comparisons were investigated before adjusting the model and validating its results in this study. The investigation considered both the grid number and the Courant number to determine the most suitable grid configuration for the simulation. The system’s pressure drop was computed and compared across three different grid numbers. Figure 4 depicts the transient pressure drop for each grid size scenario. The findings demonstrated that the pressure drop values were closely aligned across all grid sizes and achieved a quasi-steady state after 150 s.
Furthermore, an examination of Courant numbers was conducted by comparing the average pressure-drop values calculated between 200 and 250 s. Table 2 presents the averaged pressure drop alongside the Courant number for each grid size. According to the table, a 0.20% reduction in pressure drop was observed as the grid number increased from 19,225 to 34,128. Subsequently, a further 0.11% decrease occurred when the grid number was increased from 34,128 to 76,581. As mentioned earlier, all grid configurations yielded Courant numbers within the 0.03 to 0.30 range. This indicated that the simulation outcomes remained independent of mesh, time-step, and convergence criteria. Consequently, to conserve computational resources, a grid number of 34,128 was deemed appropriate for subsequent use in this study. To maintain the effect of the accepted Courant number and grid independence in the other cases, a grid size of 0.075 m was used to create the grid for all cases. The grid number of each case is shown in Table 3.

3.2. Model Validation

To ascertain the accuracy of the model, a comparison was made between the pressure drop and bed height values obtained in this study and the literature data sourced from Akbari et al. [16,17,18], which pertained to actual industrial operation records. According to the literature, the reactor’s pressure drop was approximately 58.8 kPa, while the final bed height was 20 m. Figure 5a illustrates the juxtaposition of pressure drop values derived from the model and those from the literature. The acquired pressure drop closely approximated 58.4 kPa, exhibiting only a 0.70% deviation from the literature data. Furthermore, as depicted in Figure 5b, the determined bed height aligned well with the literature data.
Because the model is a solid–fluid multiphase model, it needs to account for forces acting on the particles, such as drag force and gravity force, whether in solid–gas or solid–liquid interactions, as investigated by Brazhenko et al. [23]. Furthermore, drag force remains a key consideration in the gas–solid–liquid model investigated by Zhan et al. [24], as well as in the CSTR model by Kou et al. [25]. From Figure 5b, the increased diameter beyond the reaction zone resulted in a decrease in gas velocity. Consequently, this reduction in gas velocity caused a decrease in the drag force acting upon the object, prompting its upward movement. Eventually, as the drag force diminished to a value lower than the gravity force, the particles fell from the top of the bed.

3.3. Segregation Behavior

To examine the segregation behavior, the simulation results were assessed after 200 s. Figure 6 displays the solid volume fraction of the small solid particles at intervals of 1, 50, 100, 150, 200, 250, and 300 s, respectively. It was observed from the figure that the small solid particles tended to aggregate at the upper section of the bed. When segregation occurred within the system, the mixing of solid particles in the fluidized bed reactor was diminished. This reduction in mixing led to a decrease in heat transfer between gas–solid particles and solid–solid particles, potentially resulting in a hot spot within the system. Additionally, there was a possibility of small solid particles escaping from the fluidized bed reactor. During the combustion process, the fine solid particles that escaped from the power plant boiler underwent combustion and incurred damage around the cyclone separator [1]. To mitigate segregation behavior within the fluidized bed system, baffles with varying angles were introduced into the fluidized bed reactor.

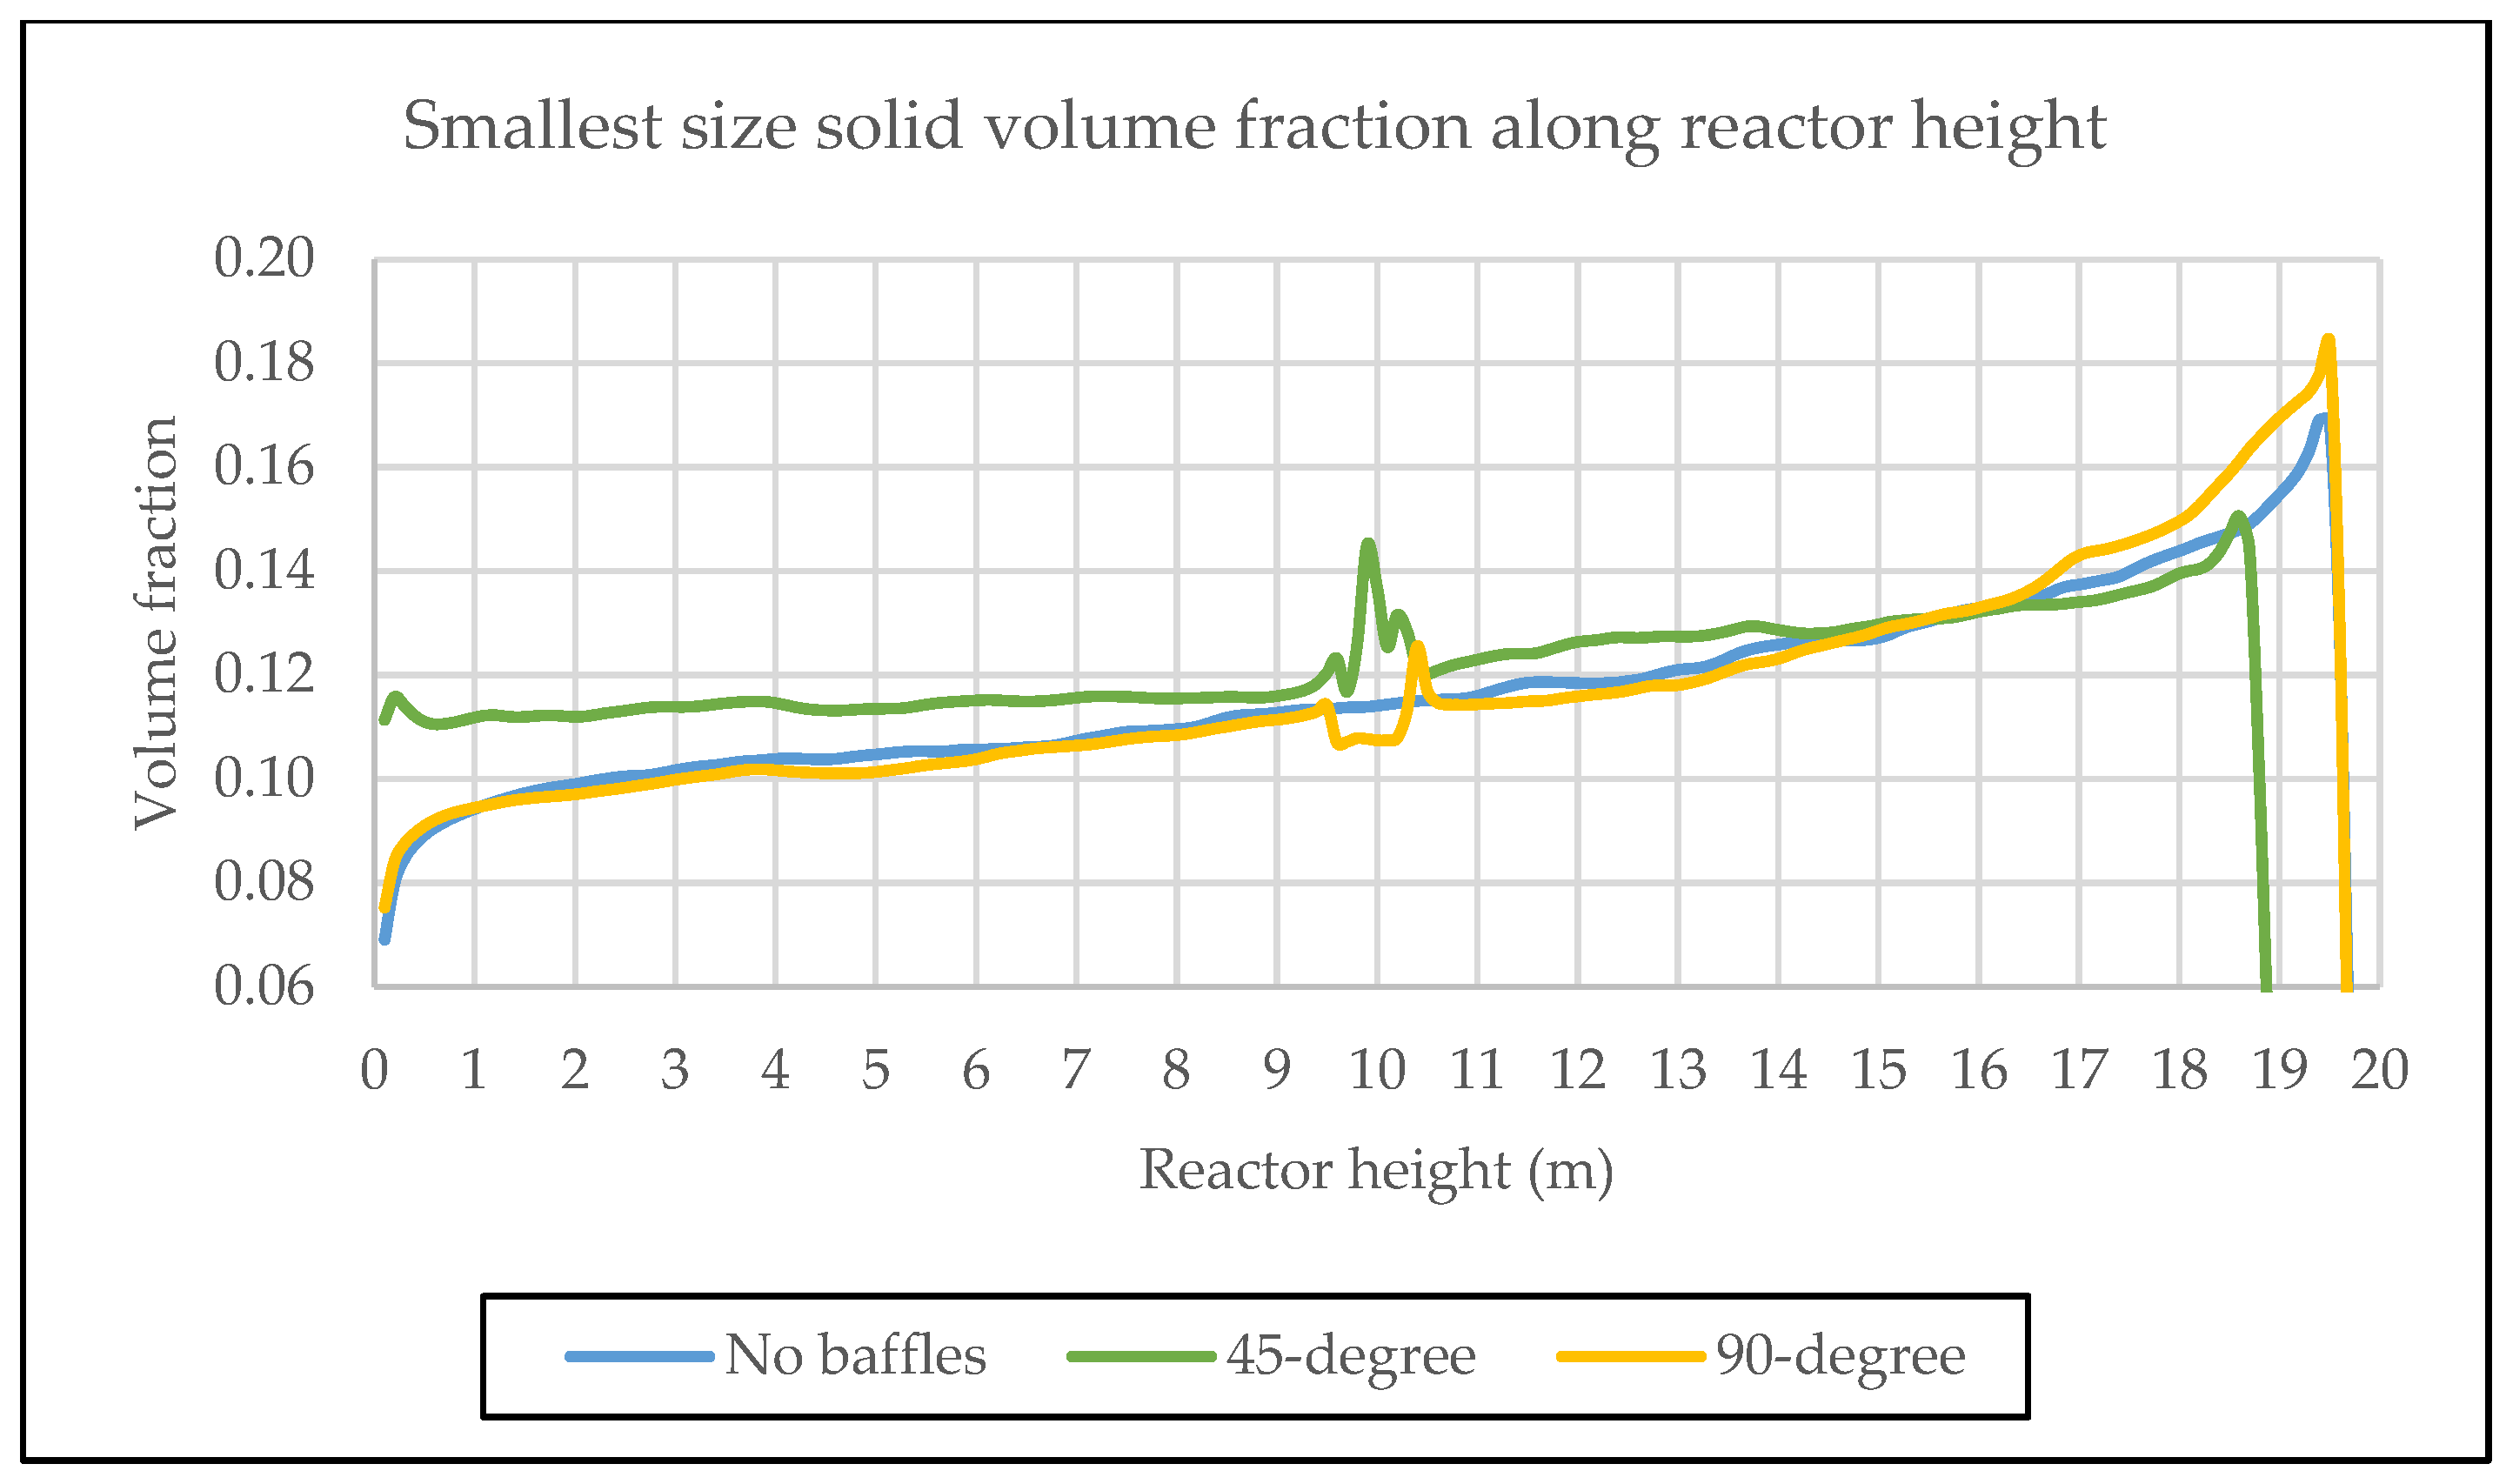
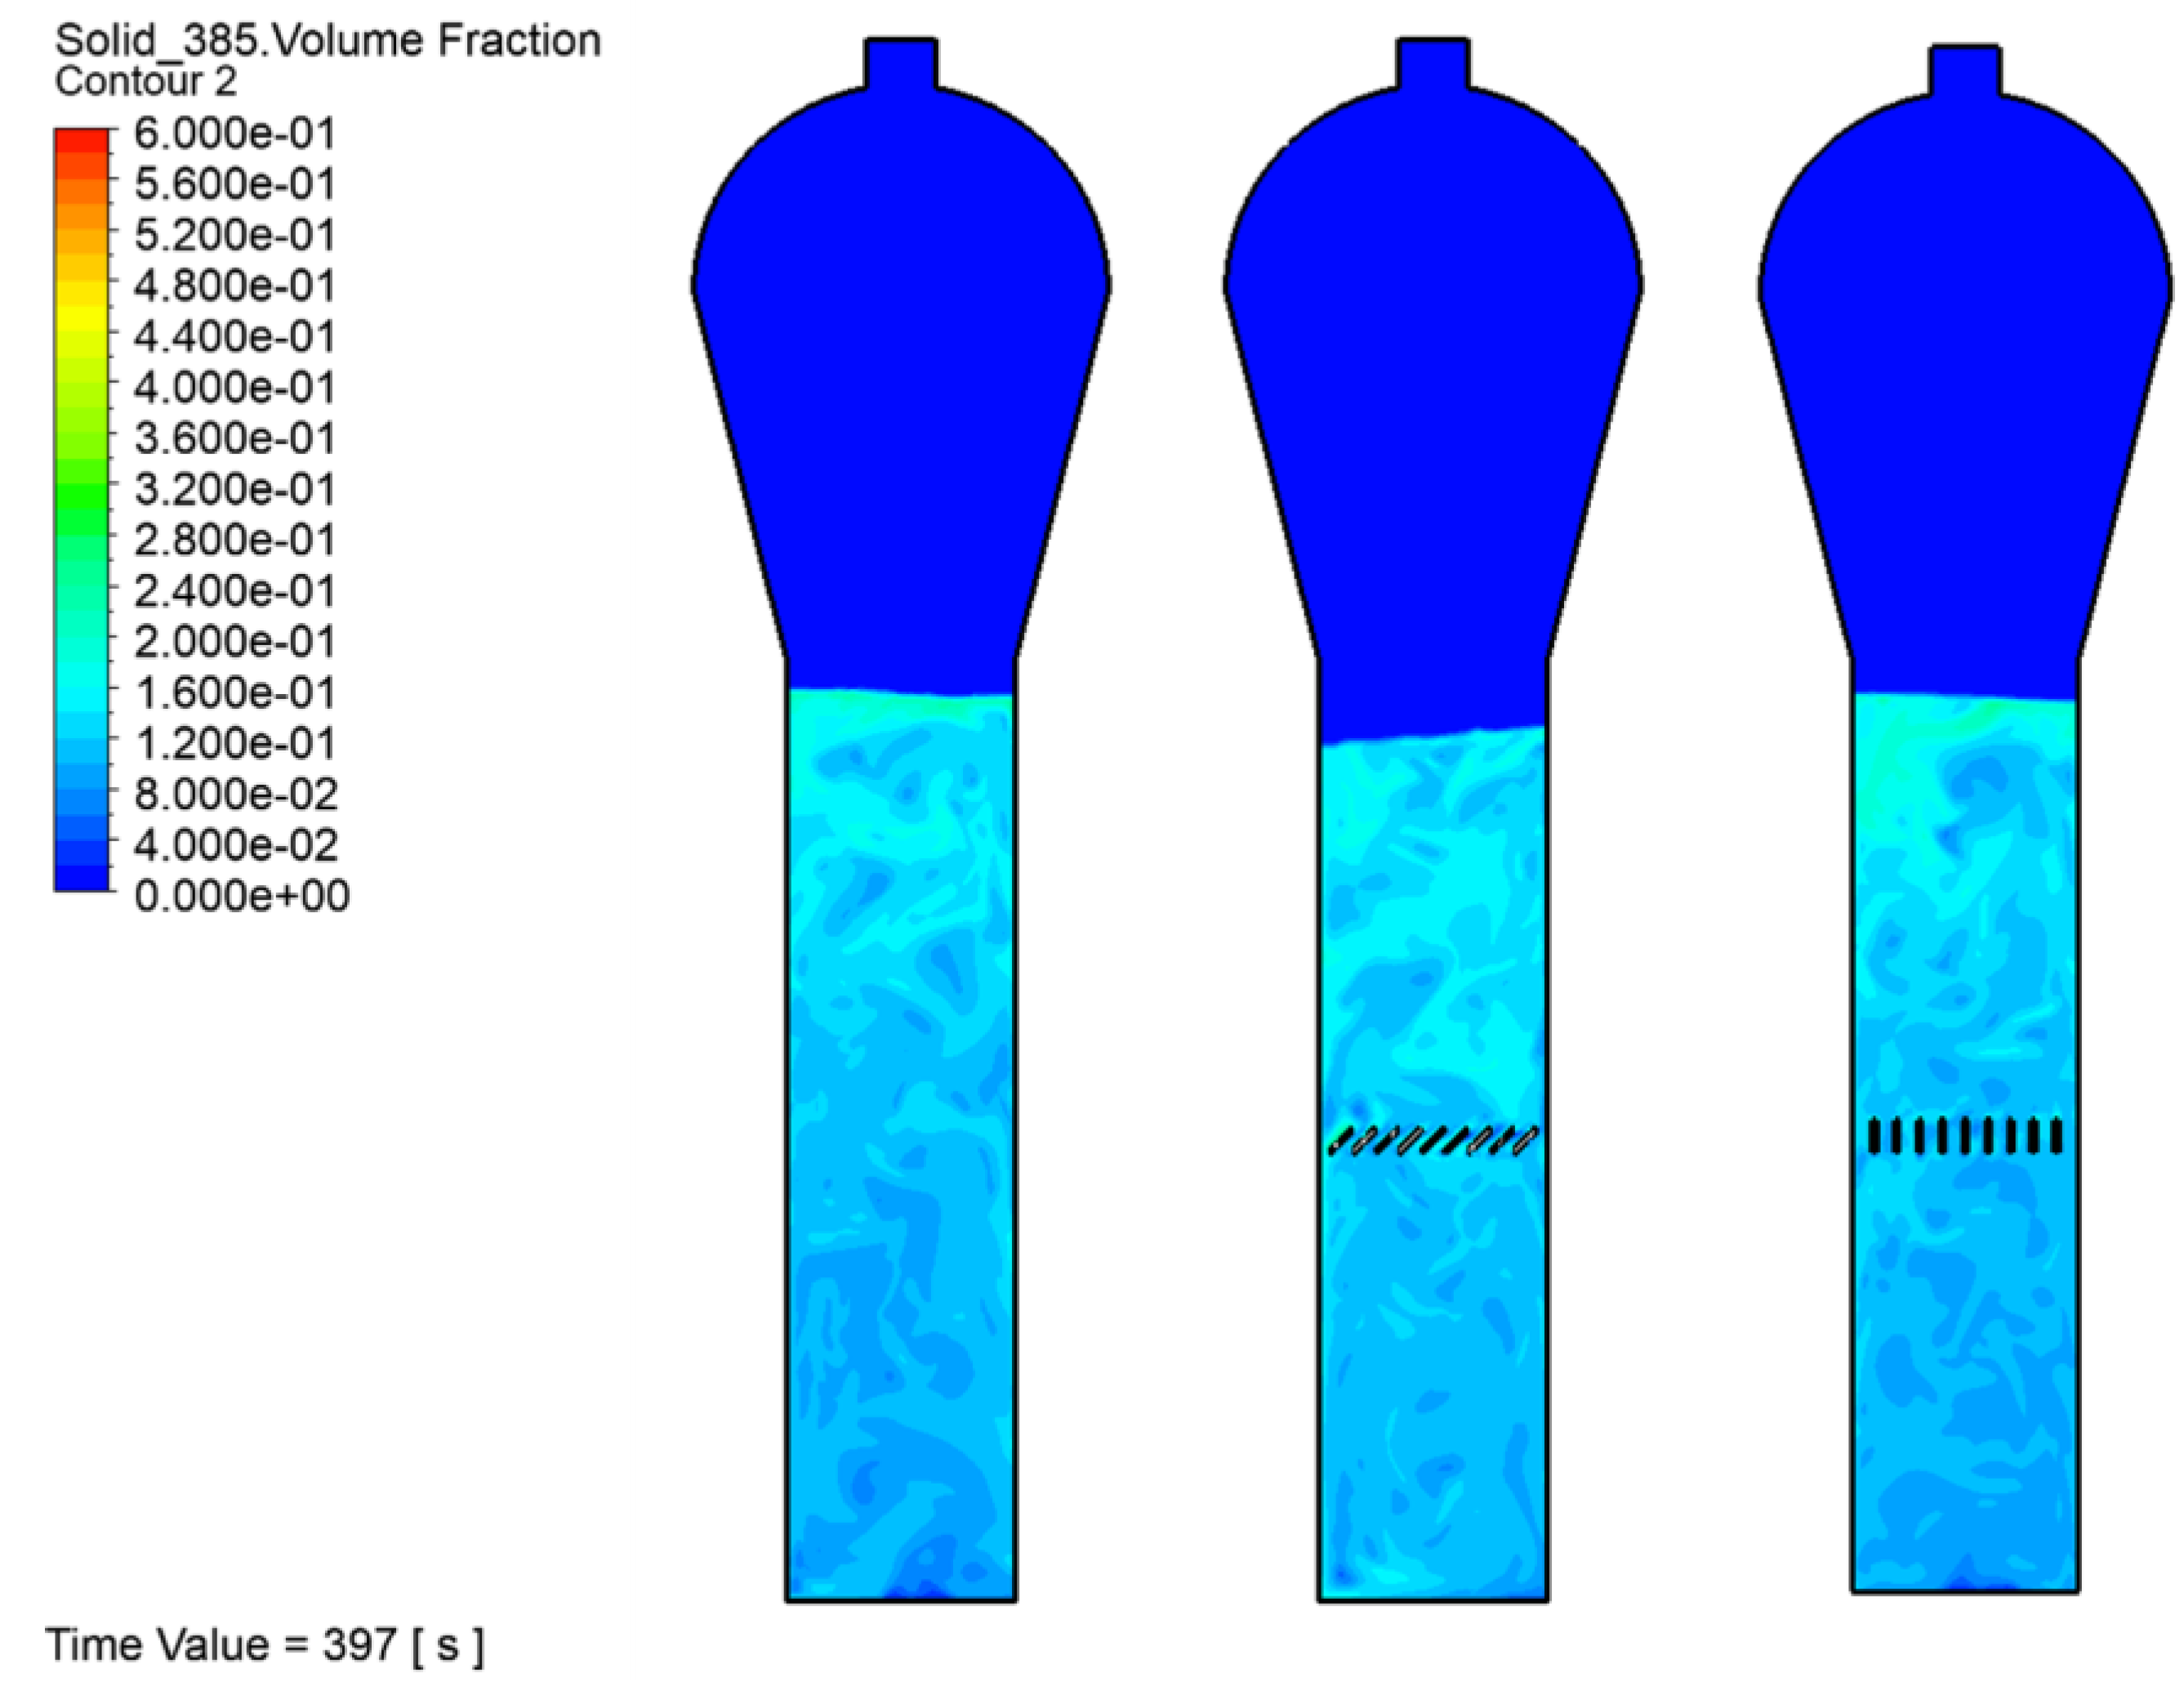
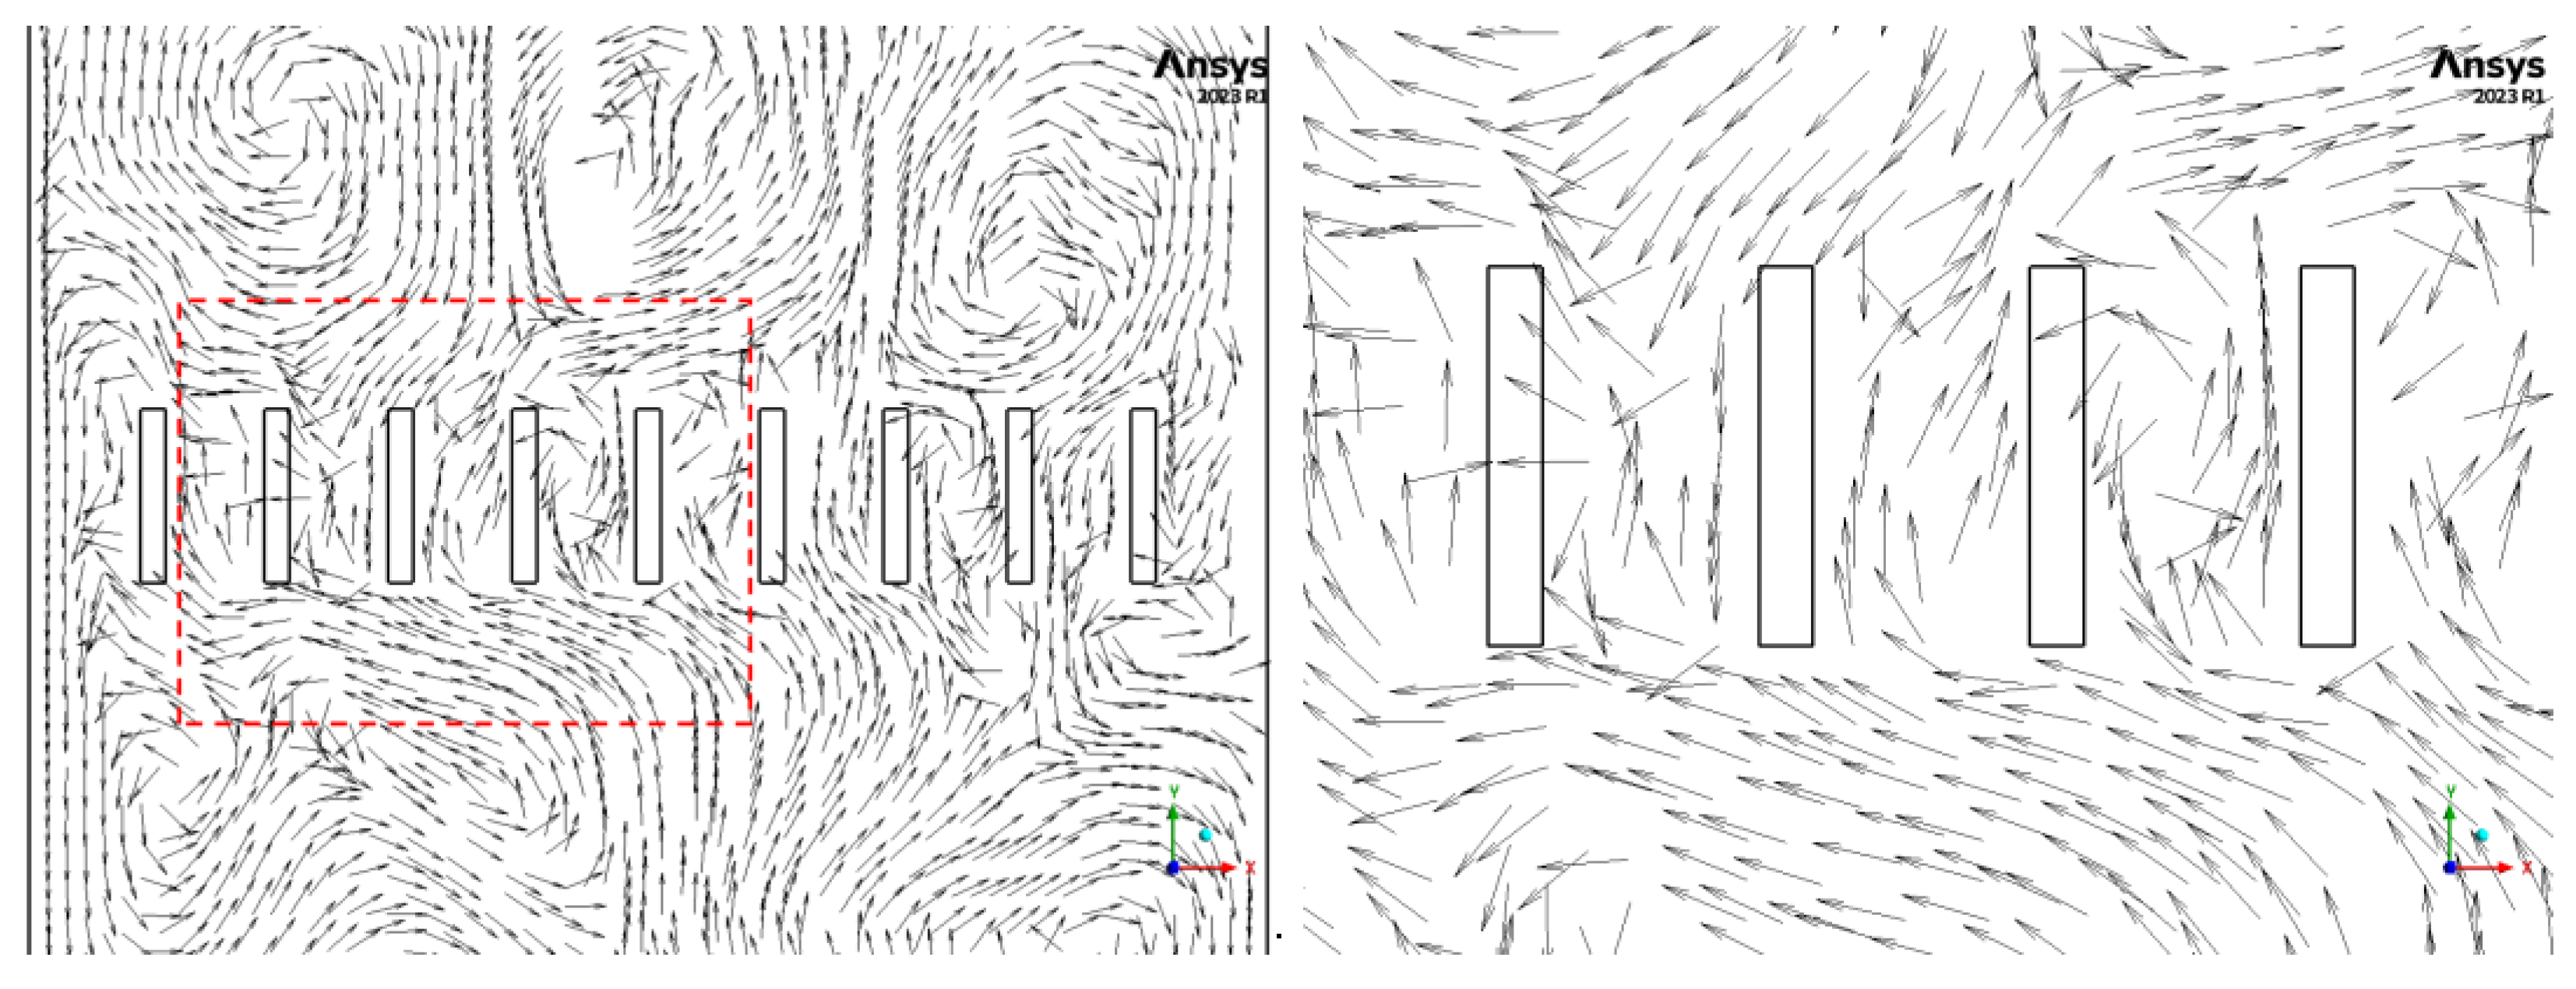
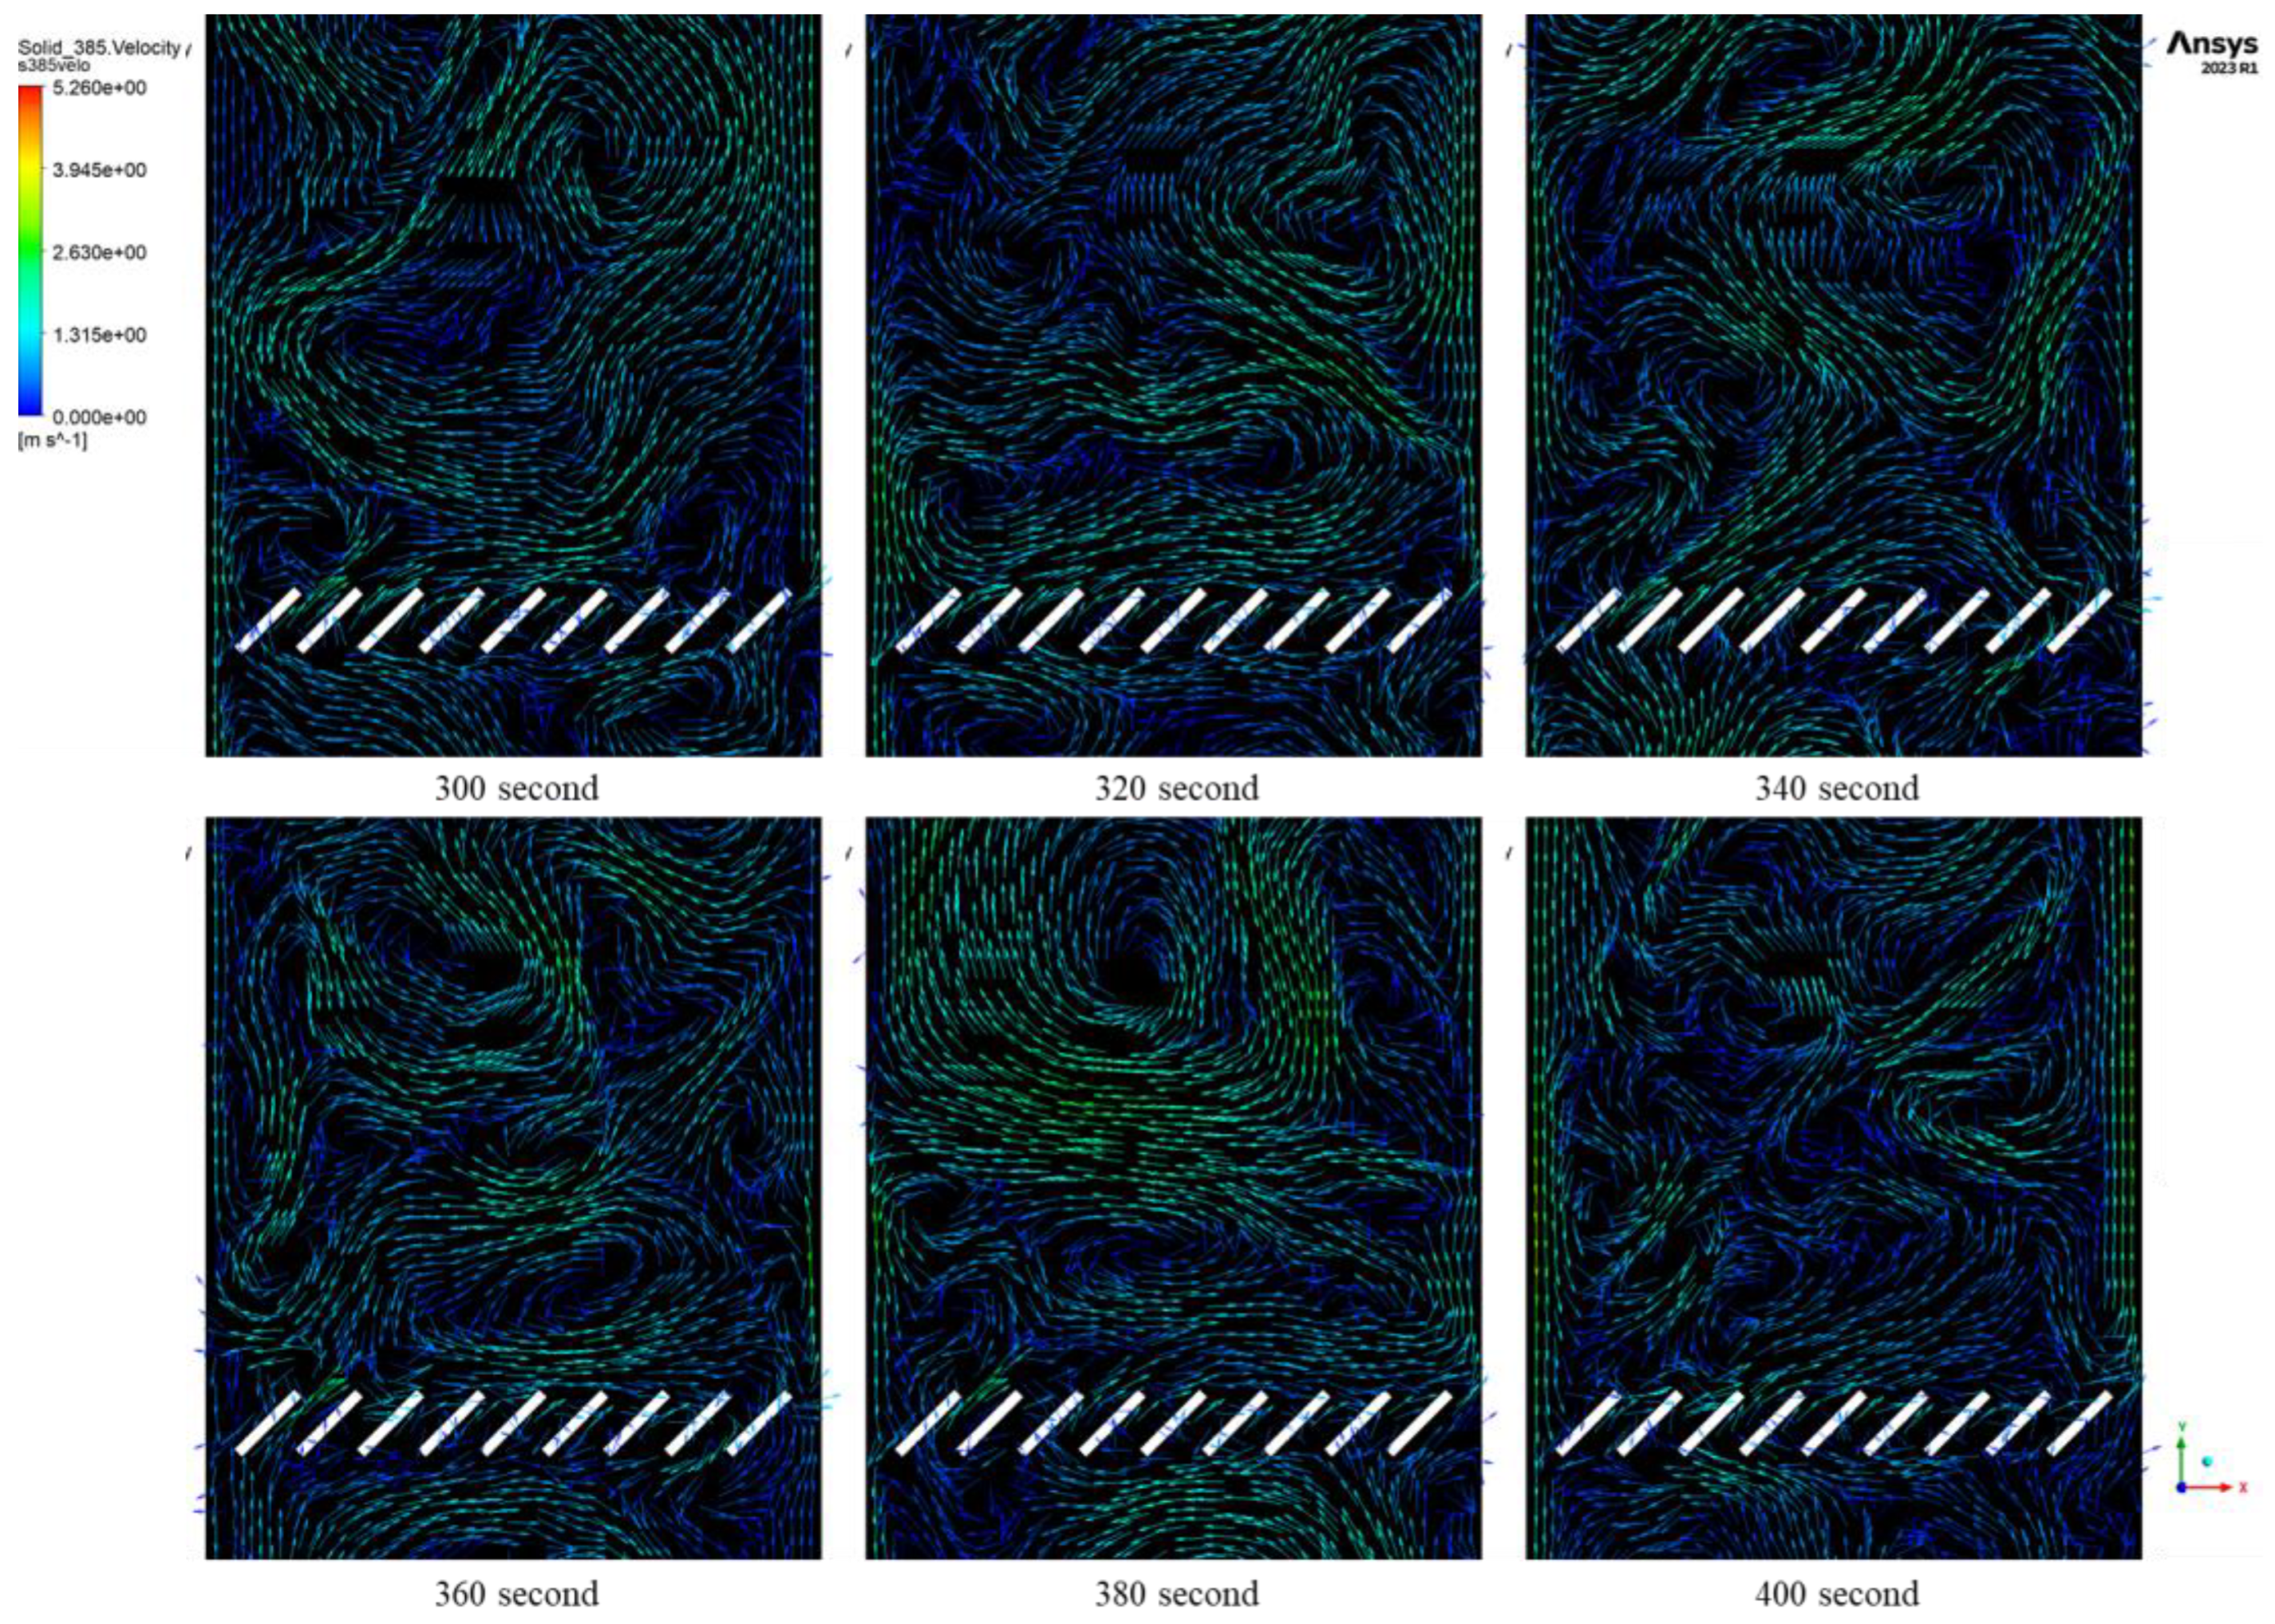
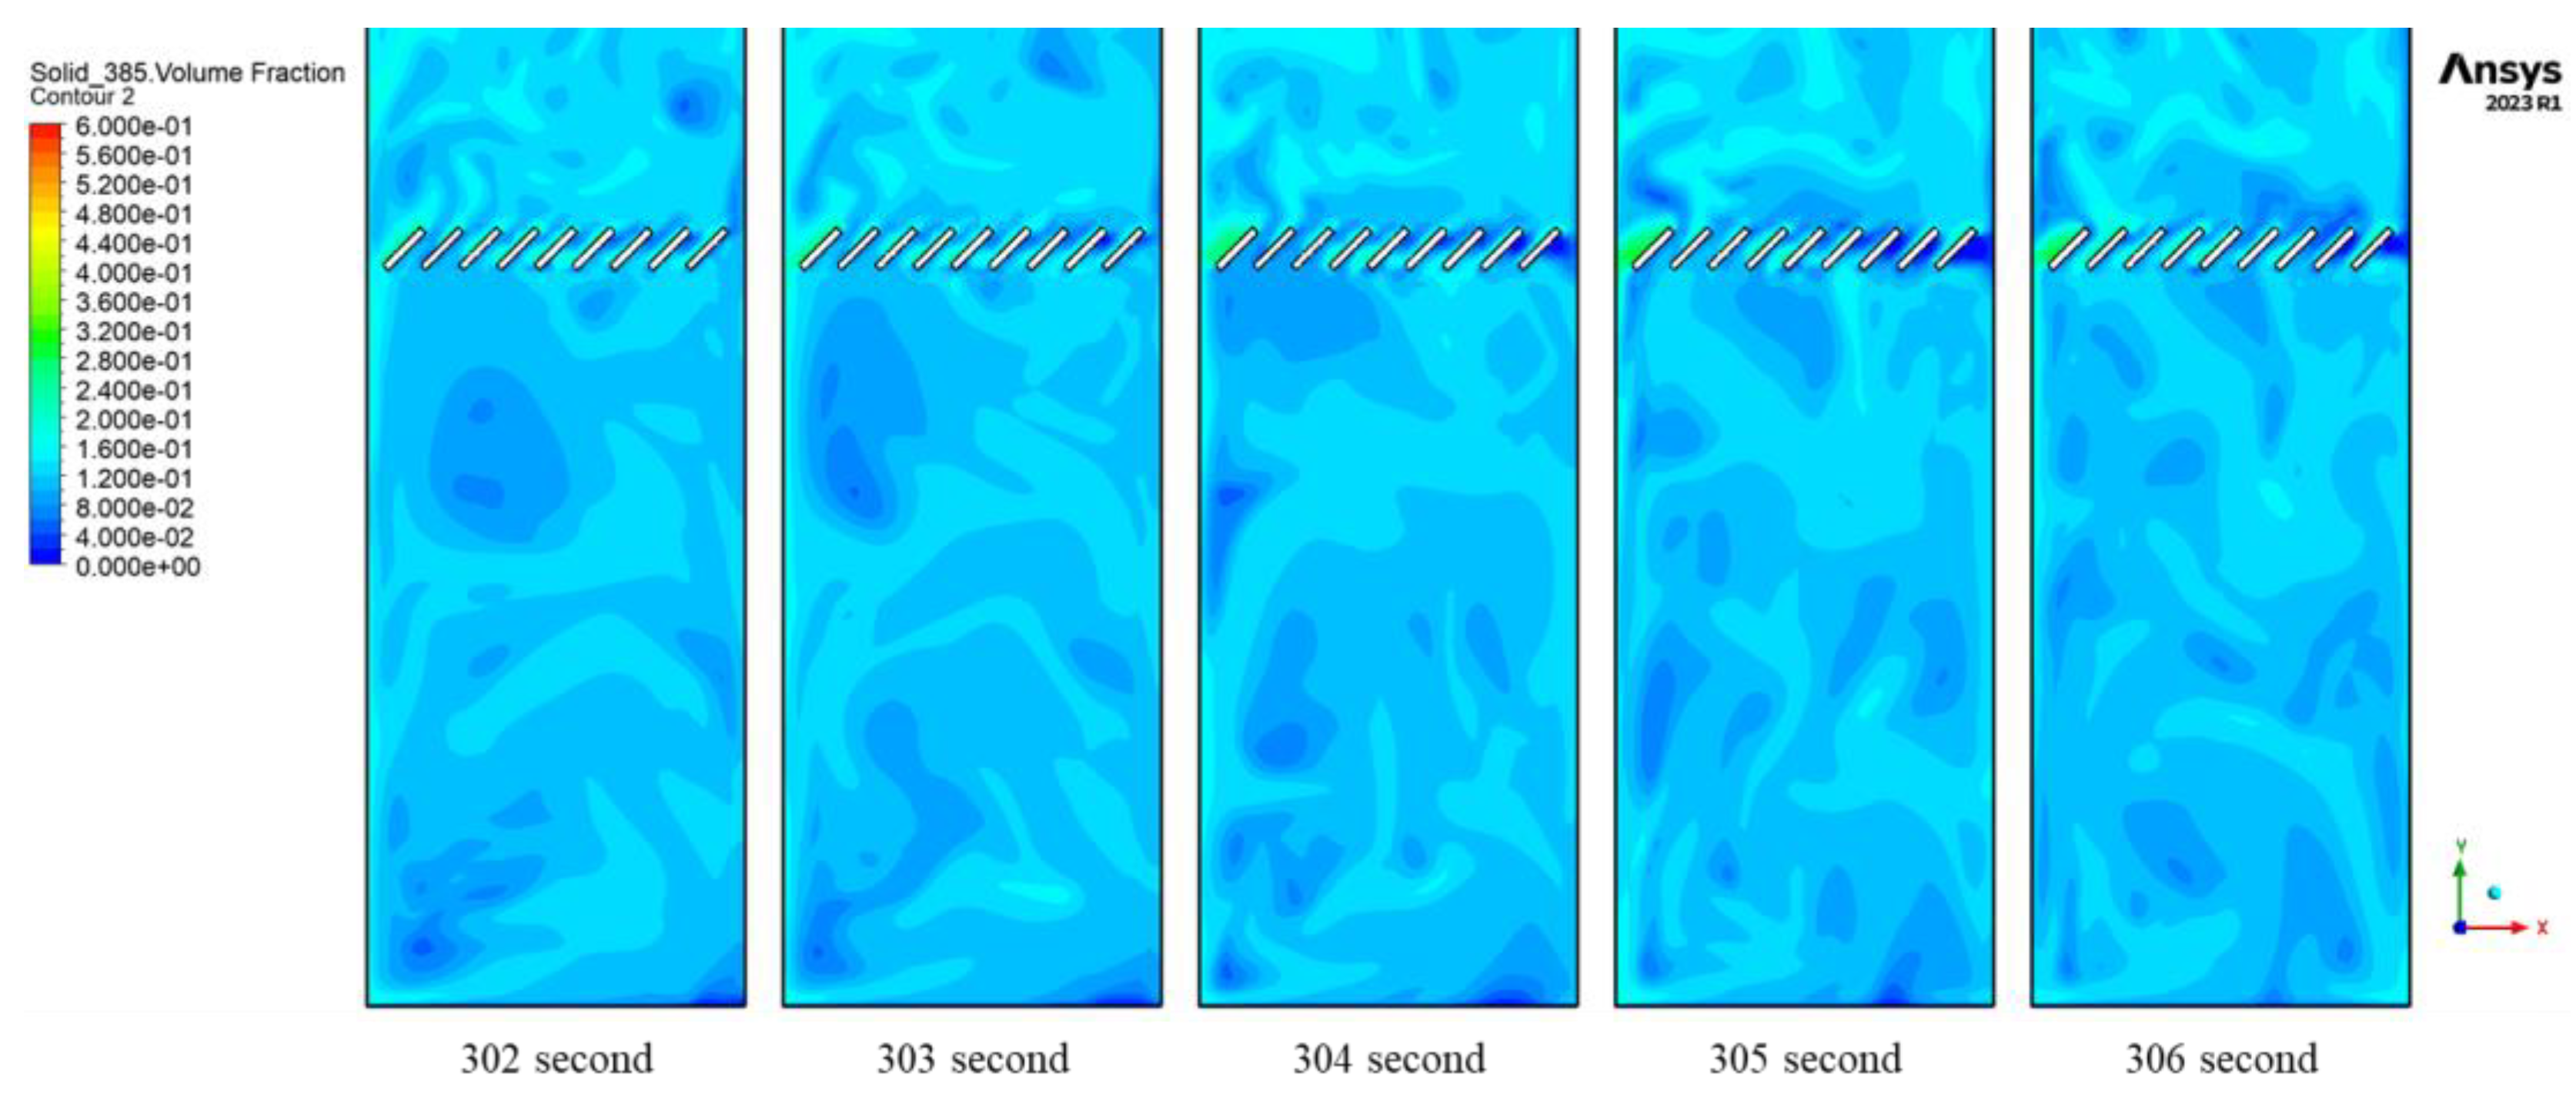
3.4. Effect of Baffles and Baffle Angles

In this section, the simulation outcomes were determined based on the quasi-steady-state results. Figure 5a illustrates that the pressure drop results stabilized at a constant value after 300 s of simulation time. The simulation outcomes were obtained by averaging the data from 300 s to 400 s. The comparison of segregation behaviors was facilitated through the utilization of the percentage of segregation.
In Figure 7, the percentage of segregation for three scenarios was presented: no-baffles, 45-degree baffles, and 90-degree baffles. The incorporation of 90-degree baffles at the center of the reaction zone yielded no notable impact on solid behavior; furthermore, the percentage of segregation closely approximated that observed in the absence of baffles. Conversely, the introduction of 45-degree baffles brought about a substantial reduction in the percentage of segregation and facilitated improved mixing of the particles within the system. When the solid volume fraction was taken into account along the height of the reactor, this further affirmed improved segregation behavior with the appropriate baffles integrated into the system.
For a clearer observation of this behavior, Figure 8 illustrates the distribution of solid volume fraction for small solid particles along the height of the reactor. At the upper section of the bed, the solid volume fraction of small particles exceeded that in the lower zone. However, upon incorporating 45-degree baffles, the volume fraction of small solid particles in the lower region of the reactor increased. The spikes observed at the 10 m height from the bottom of the reactor were caused by the accumulation of solid particles at the baffles’ walls. Additionally, the distribution of small solid particle volume fractions with 45-degree baffles tended to be more uniform compared to configurations without baffles and 90-degree baffles.
According to Jin et al. [26], inserting baffles into the system led to an improvement in fluidization quality and divided the system into a multistage configuration to facilitate smooth, fluidized bed operation. Moreover, baffles impeded bubble growth in the system and decreased solid elutriation from it. Due to solid hindrance, the system with baffles had a lower bed height. In line with Jin et al., the solid bed height in this study decreased, while the 45-degree baffles were inserted, as shown in Figure 8 and Figure 9.
To consider solid hindrance in the system, the movement of the solid particles in the system was examined by considering the solid velocity vectors. Figure 10, Figure 11 and Figure 12 depict the velocity vectors of the smallest particles for three scenarios: no baffles, 45-degree baffles, and 90-degree baffles.
The findings revealed that in a system without baffles and one with 90-degree baffles, solids were able to ascend freely to the uppermost part of the bed. Conversely, in the system equipped with 45-degree baffles, the passage of solids through the baffles was impeded due to the angled configuration of the baffles. This led to a more intricate flow pattern, introducing additional resistance that obstructed the passage of solids through the baffles. The majority of particles were obstructed and compelled to move around horizontally, in parallel with the layout of the baffles. Moreover, some particles collided with the baffles and deflected towards the walls of the baffles, subsequently passing through the gap between the baffles, as shown in Figure 13, and entering the reaction zone above them. Both particle movements resulted in a reduction of velocity in the y direction as they traversed the baffles, as illustrated in Figure 14. The y-direction velocity was determined by calculating the average value, accounting for the respective areas in the calculation (Equation (14)).
A v e r a g e   v v e l o c i t y = ( v v e l o c i t y ) ( A r e a ) ( A r e a )
According to Zhang et al. [27], they conducted experiments and observed that when the superficial gas velocity reached approximately 0.4 m/s, there was a distinct internal circulation of solids observed above the louver baffles. As depicted in Figure 9, due to the slant of the baffle blades, bubbles were directed towards one side as they passed through the louver baffle, resulting in an area with higher voidage on that side and an area with lower voidage on the opposite side. The contrast in voidage between these two areas led to solids circulating above the louver baffle, with solids descending in the low-voidage region and rising in the high-voidage region. These two regions are referred to as the “bubble-laden” and “emulsion-downflow” areas, respectively. This particle behavior was observed in this study, as shown in Figure 15.
In this study, the velocity pattern of the small particles demonstrated a pattern similar to that observed in Zhang’s experiment. The gas transported the solid particles, causing an upward flow on the right side of the reactor and, conversely, a downward movement of some small particles on the left side. The circulation of the solid particles above the baffles was observed. This was made evident by examining the streamline of the small particle velocities.
Even though solid particles within the fluidized bed may undergo continuous changes over time, the primary solid behaviors remain discernible, particularly when the system reaches a quasi-steady state. Figure 16 shows the small solid velocity vector after the system reaches the quasi-steady state. It shows that the main behaviors involve solid particles predominantly exhibiting an upward flow on the right side of the reactor and a downward motion on the left side. Additionally, during this phase, there is an observable circulation of solid particles above the baffles.
According to Zhang et al. [28] and Yang et al. [29], both investigations showed that bubbles might break up when moving through the baffles, and this was also observed in this study, as shown in Figure 17.
When the large bubble reached the bottom of the baffle, it fragmented, spreading into the nearby baffle channels and passing through them to create smaller bubbles above. Some portions of the initial bubble dispersed into more distant channels, possibly dividing into smaller bubbles that swiftly merged back together after emerging from the top of the louver baffle, ultimately resulting in a new bubble with minimal alteration in size.
However, considering the small solid volume fraction in Figure 8, it was shown that small solids also tend to migrate to the top of the bed after passing through the 45-degree baffles. The small solid volume fraction graph of the 45-degree baffles case showed the same trend as the case with no baffles after passing through the baffles. It could be concluded that segregation behavior occurred in the region above the 45-degree baffles; thus, the multistage baffle was investigated to reduce this behavior.

3.5. Effect of Stage Number

The segregation behavior in the system was confirmed to be reducible by the additional baffle stage through the percentage of segregation chart in Figure 18. It was observed that the relative segregation rate of the single stage was higher than that of the two-stage baffles with any arrangement. Furthermore, the lowest relative segregation rate was observed in the above arrangement, followed by the below arrangements. To facilitate clear observation, the 45-degree baffle case was considered a single-stage baffle and compared to the above case, which was a double-stage baffle.
Based on the results shown in Figure 19, the single-stage baffle exhibited a lower-volume fraction of the smallest particles below the first stage compared to the above arrangement, while both cases showed a similar trend. However, when a second stage was added above the base stage, it hindered particle flow and caused swirling and particle accumulation between the first and second stages, as shown in Figure 20, which led to a higher-volume fraction.
The swirling particles also hindered particle flow, resulting in a lower flow rate of the smallest particles through the first stage, as illustrated in Figure 21. This caused a higher-volume fraction of the smallest particles below the first stage of the double-stage baffle. Furthermore, the volume fraction of the smallest particles above the second stage was lower than in the other zones and the single-stage case, due to the second stage and the hindrance caused by the swirling particles.

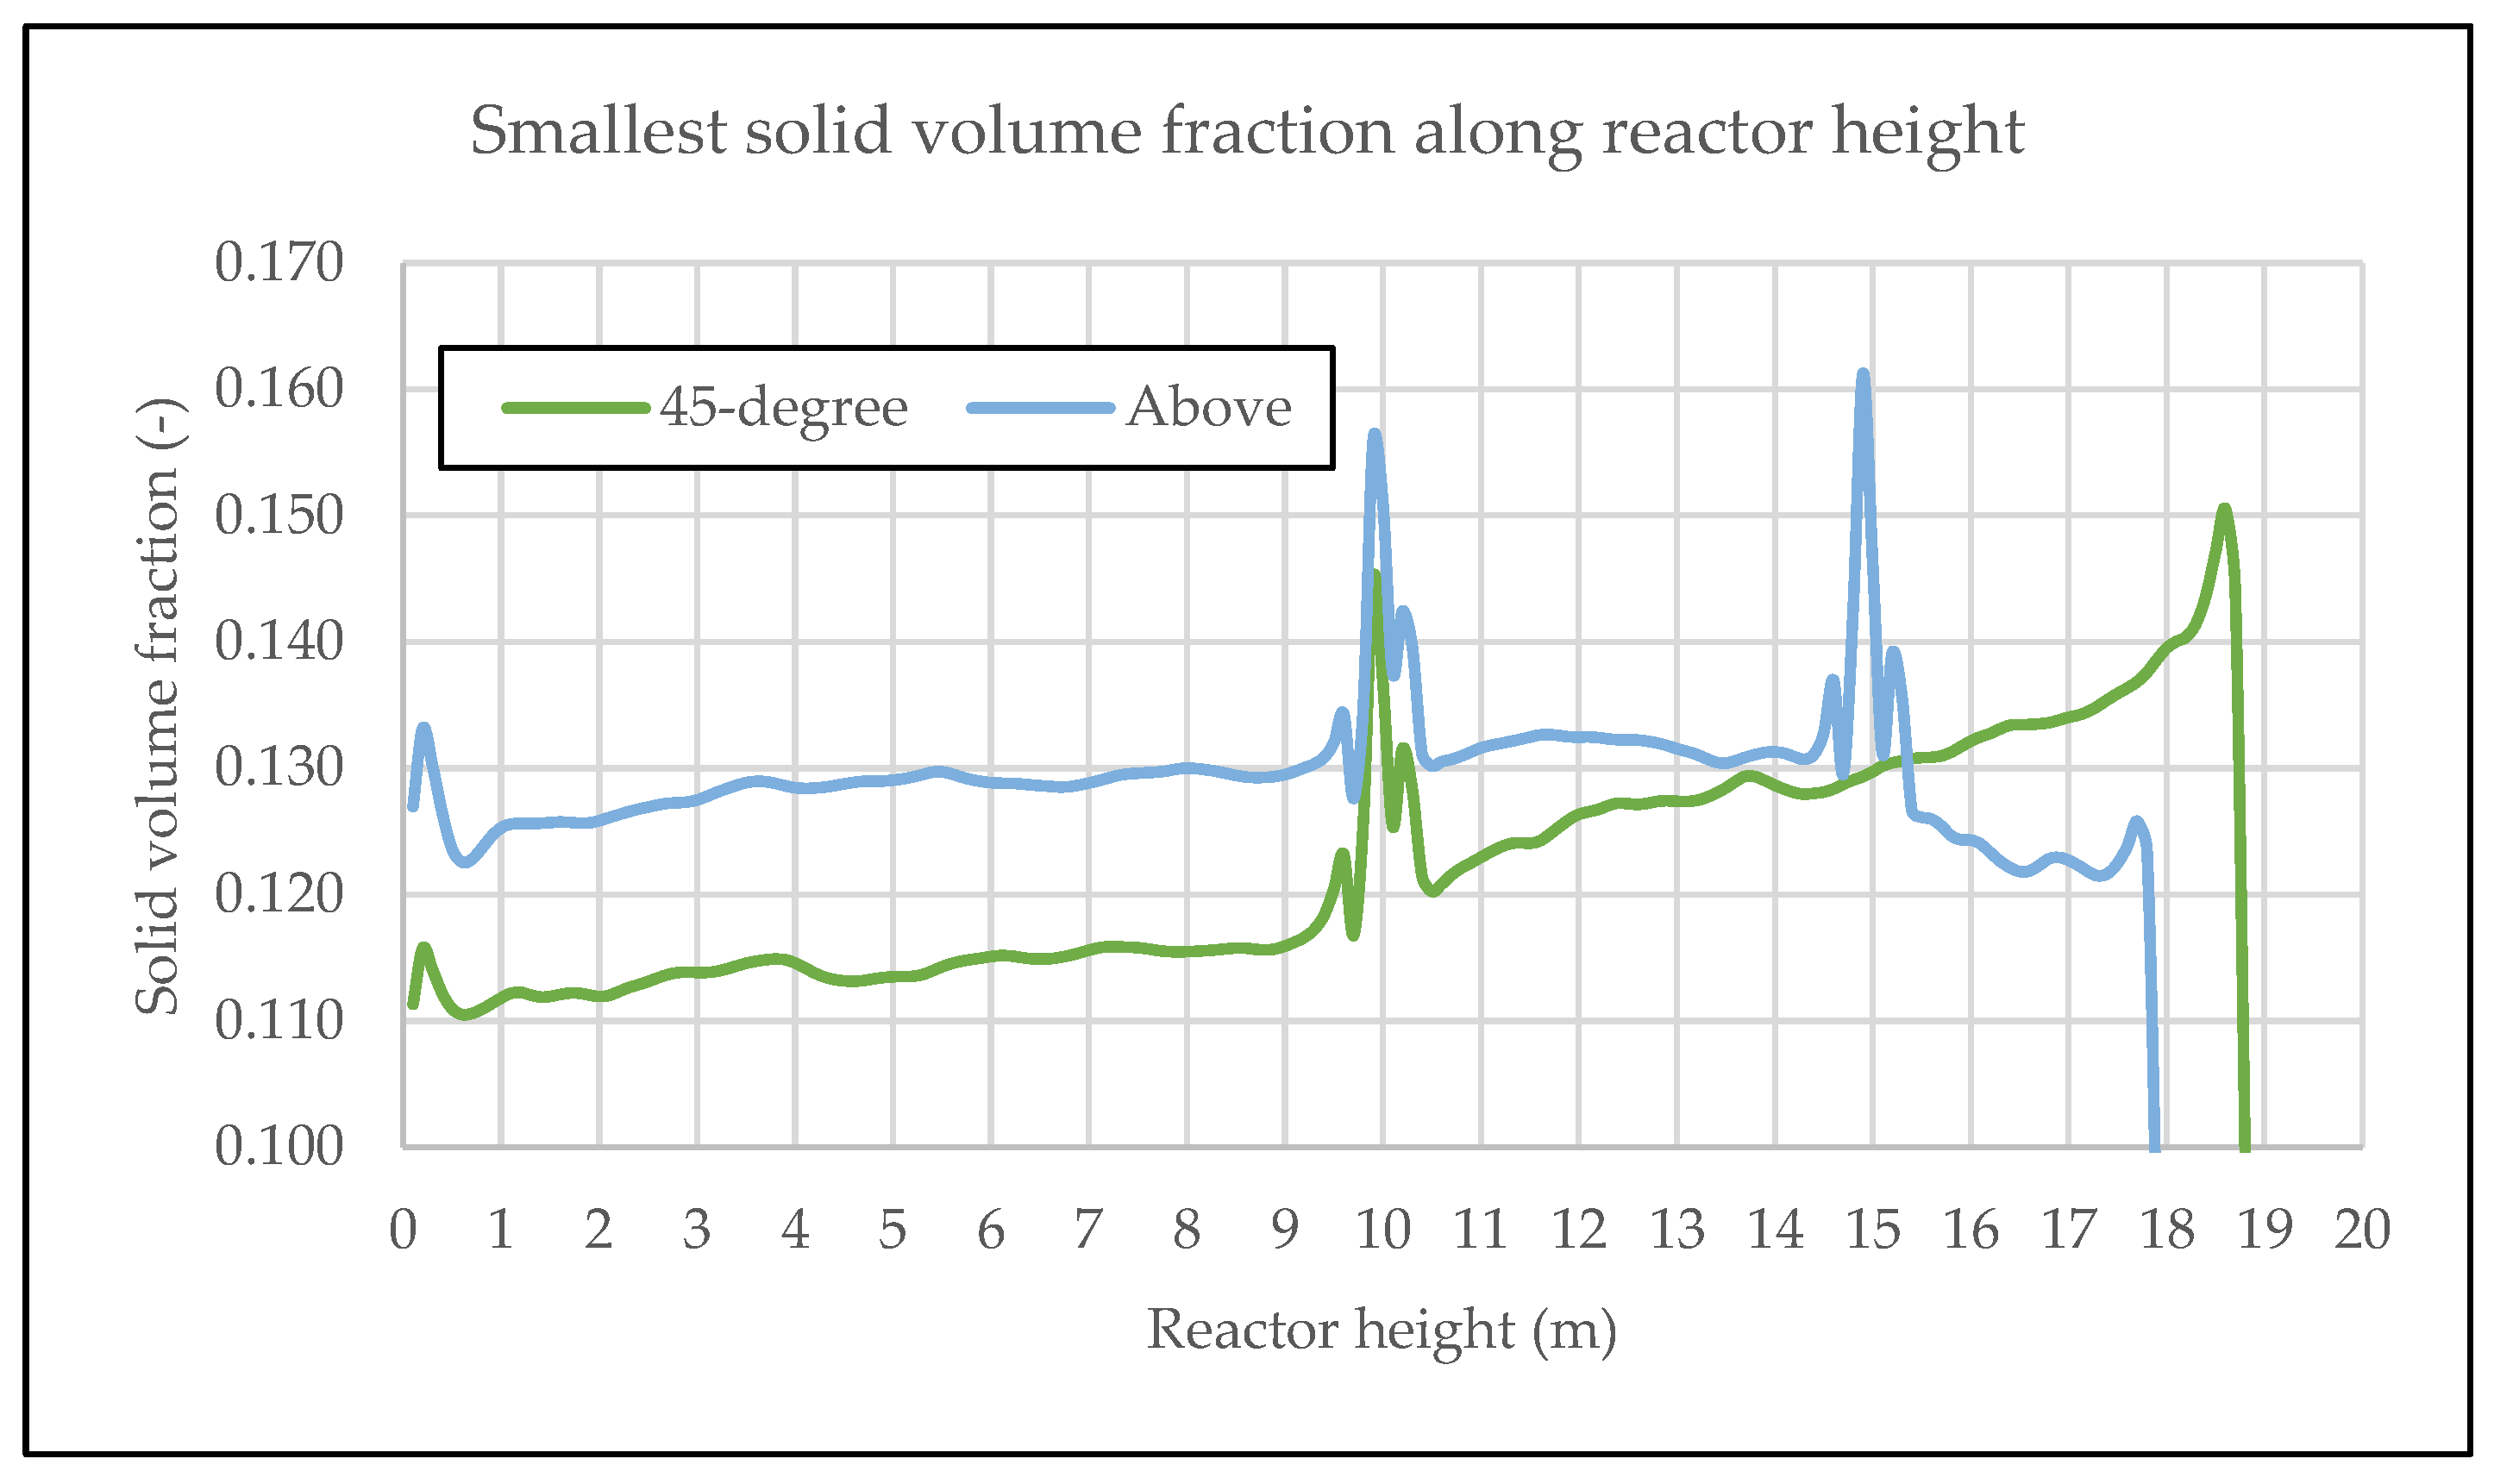
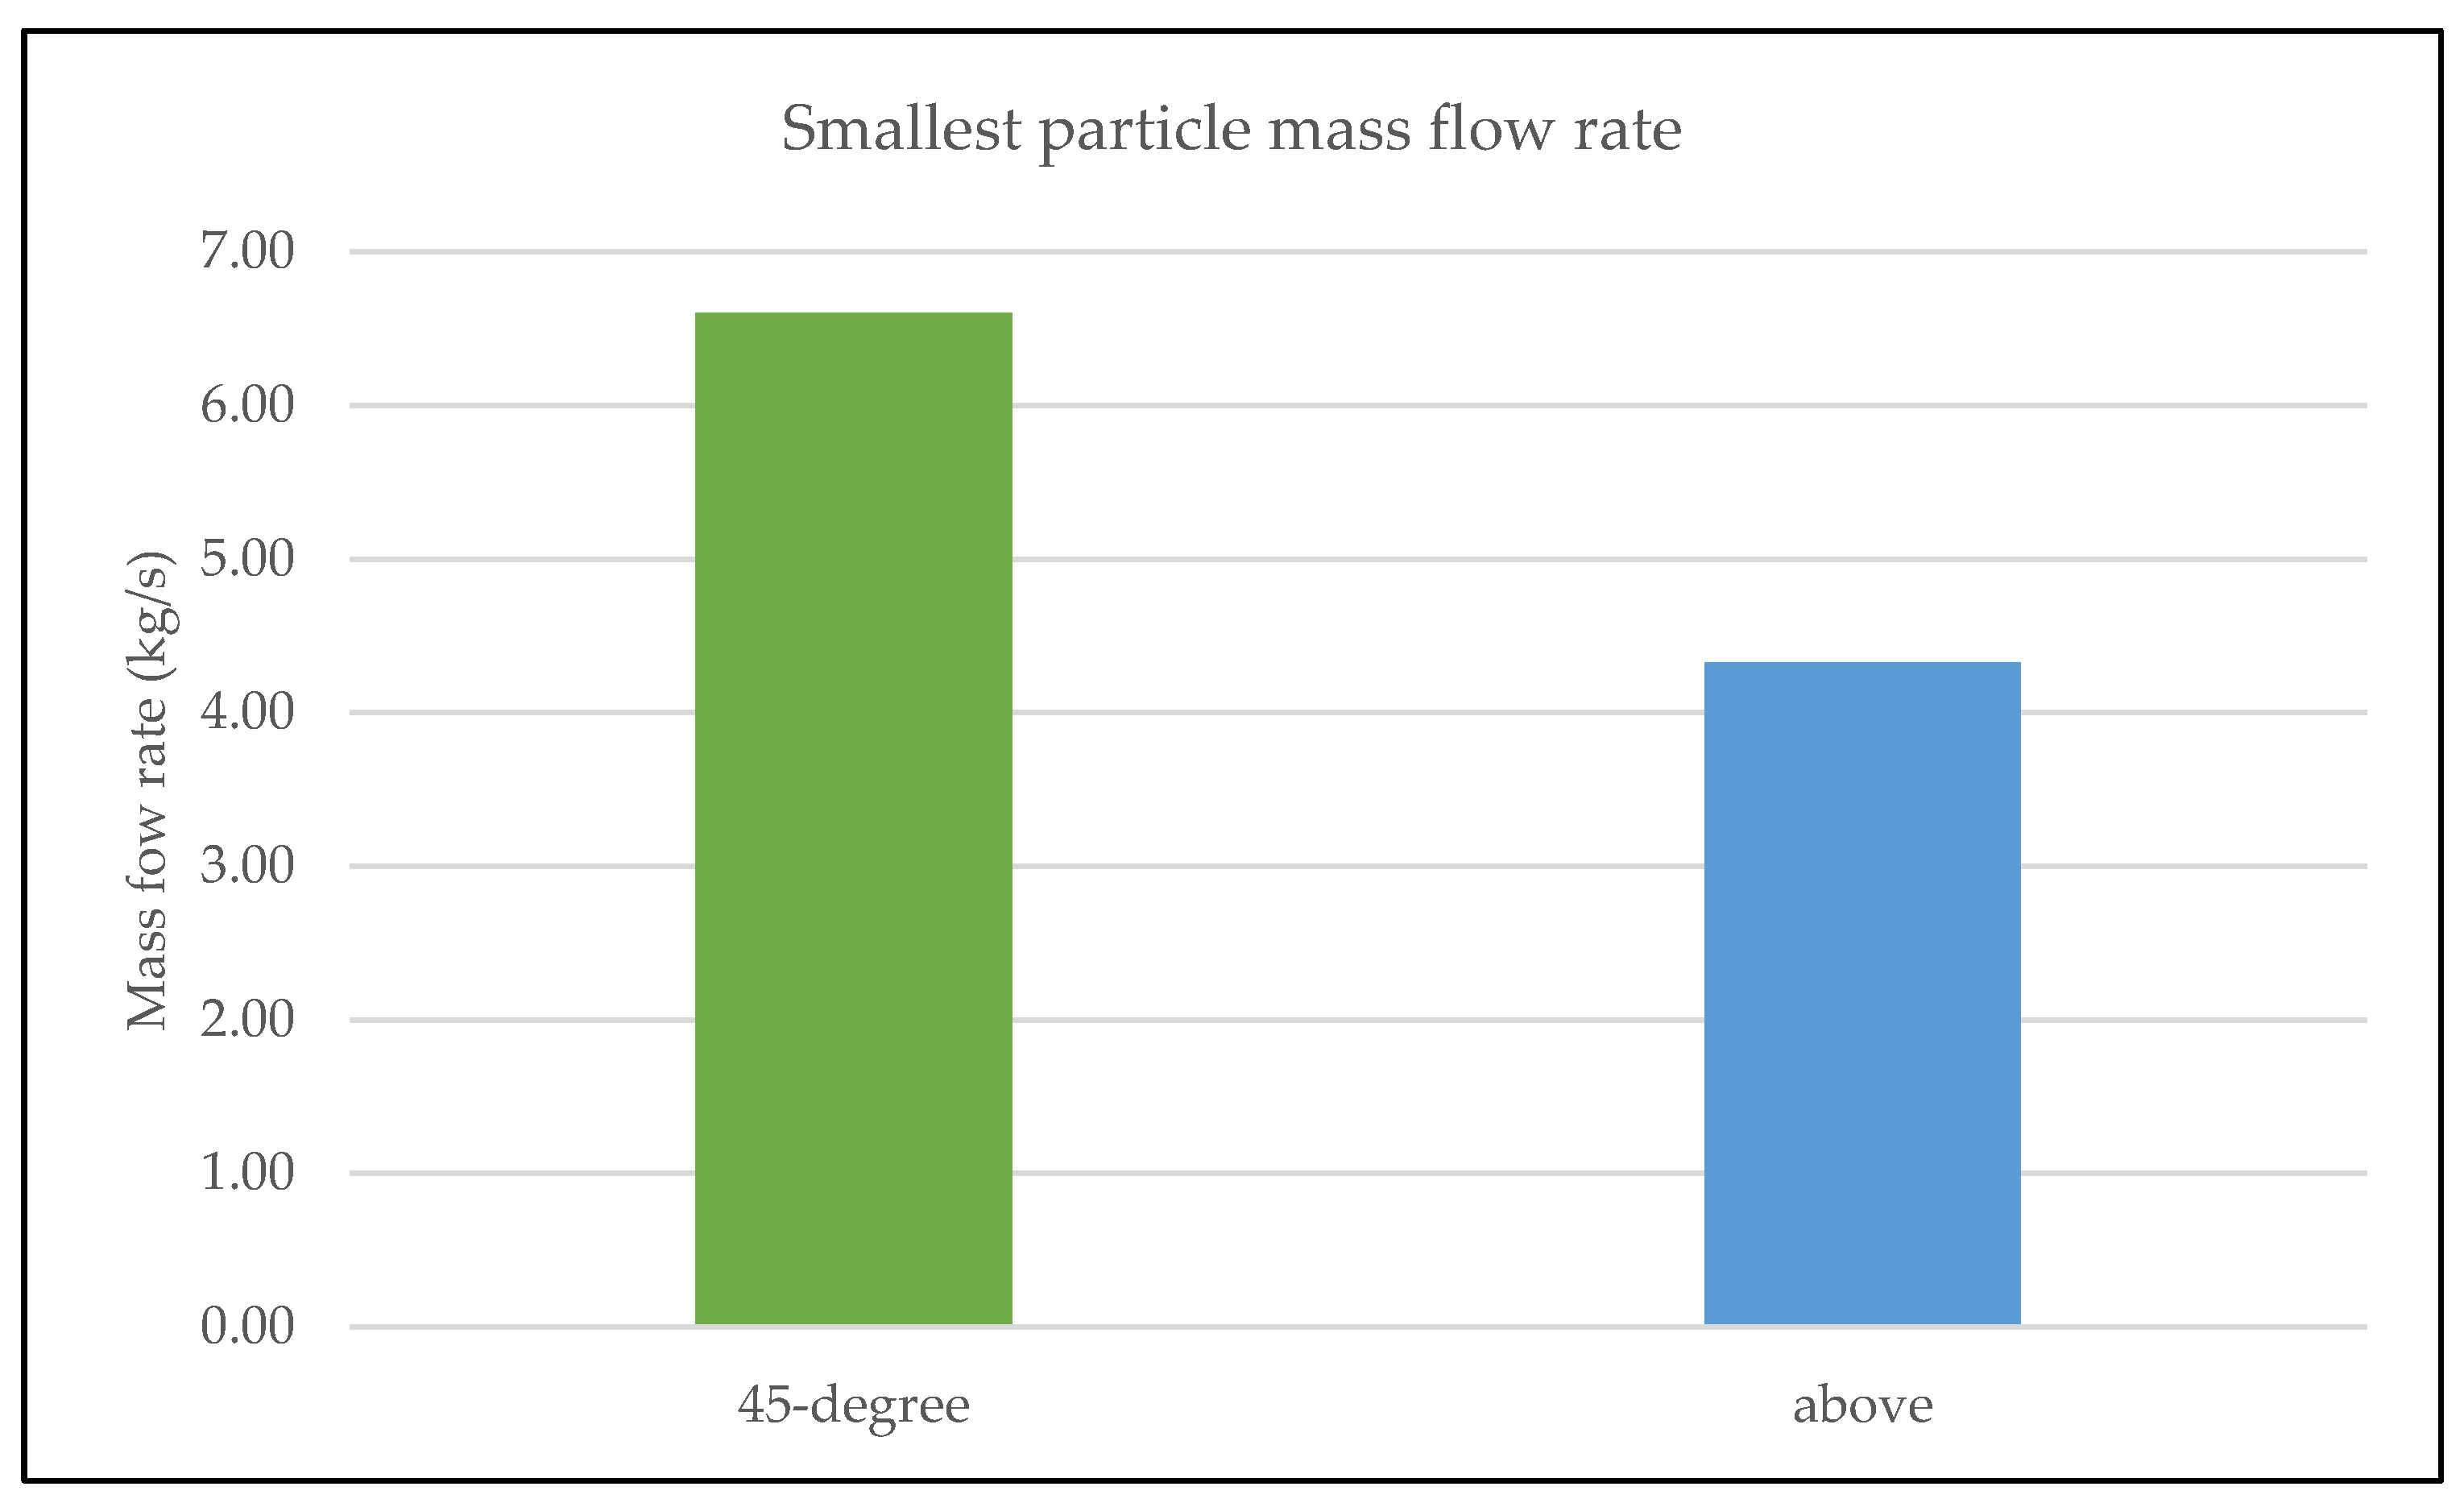
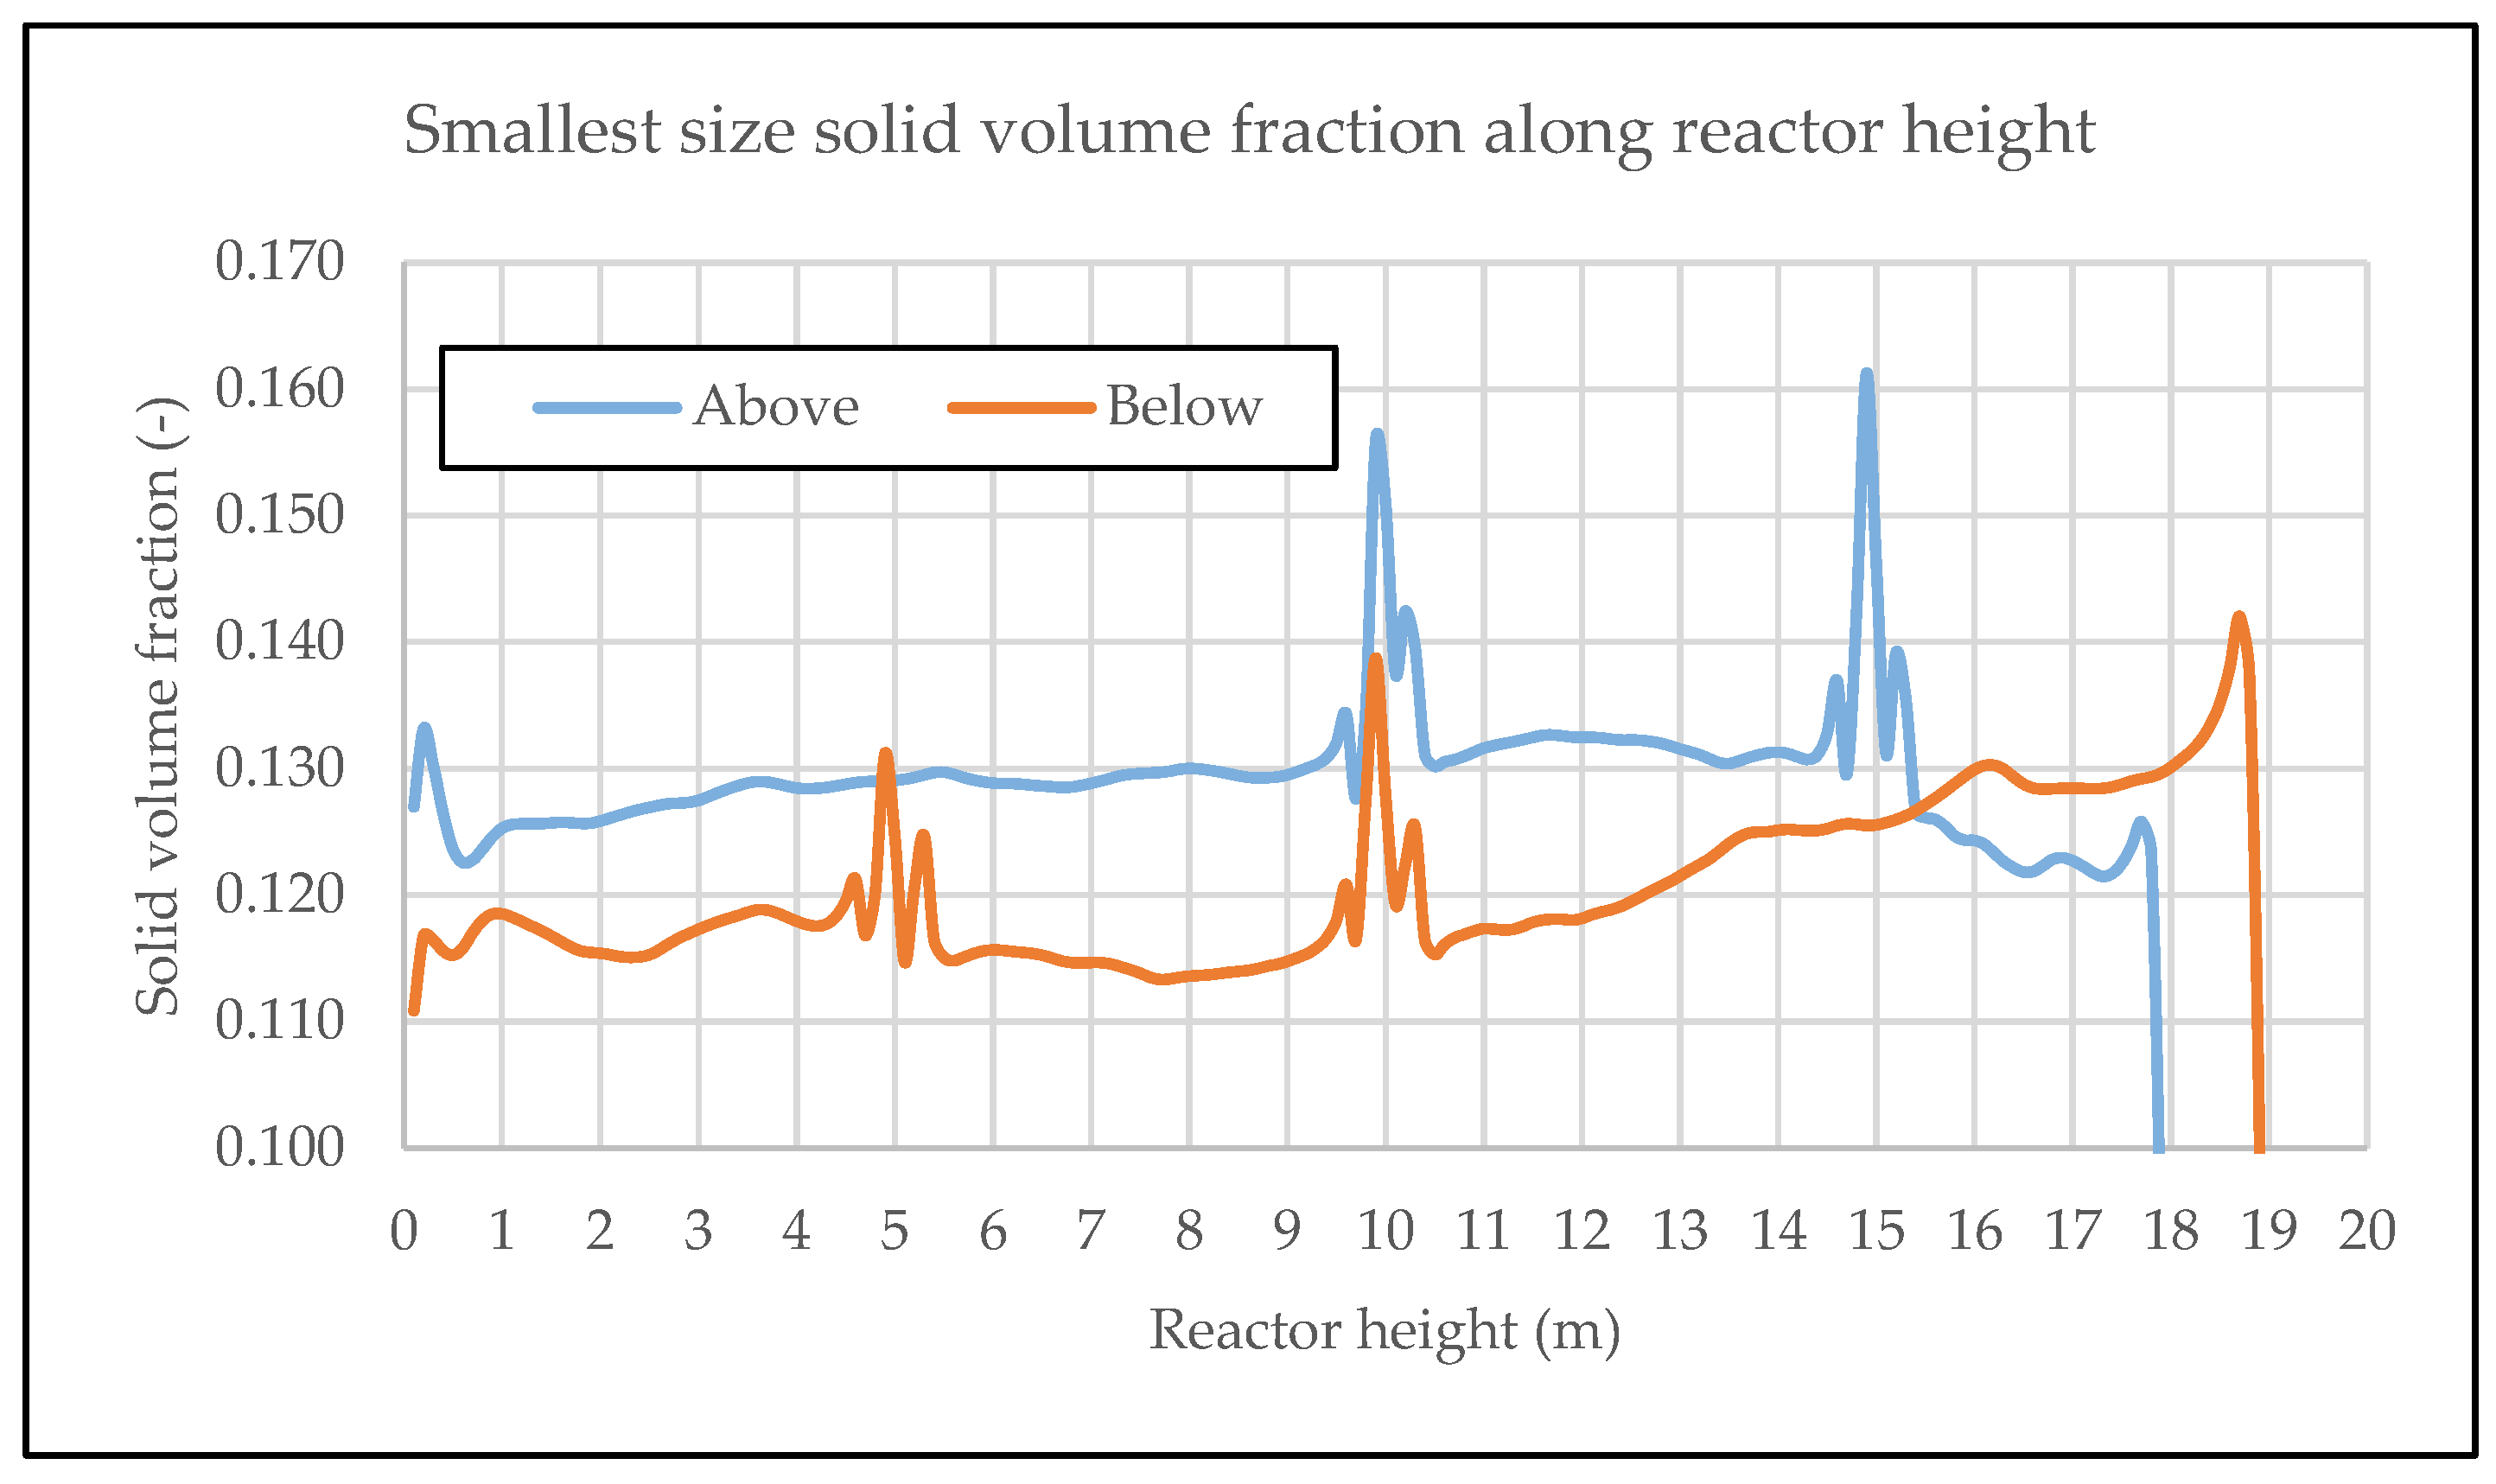
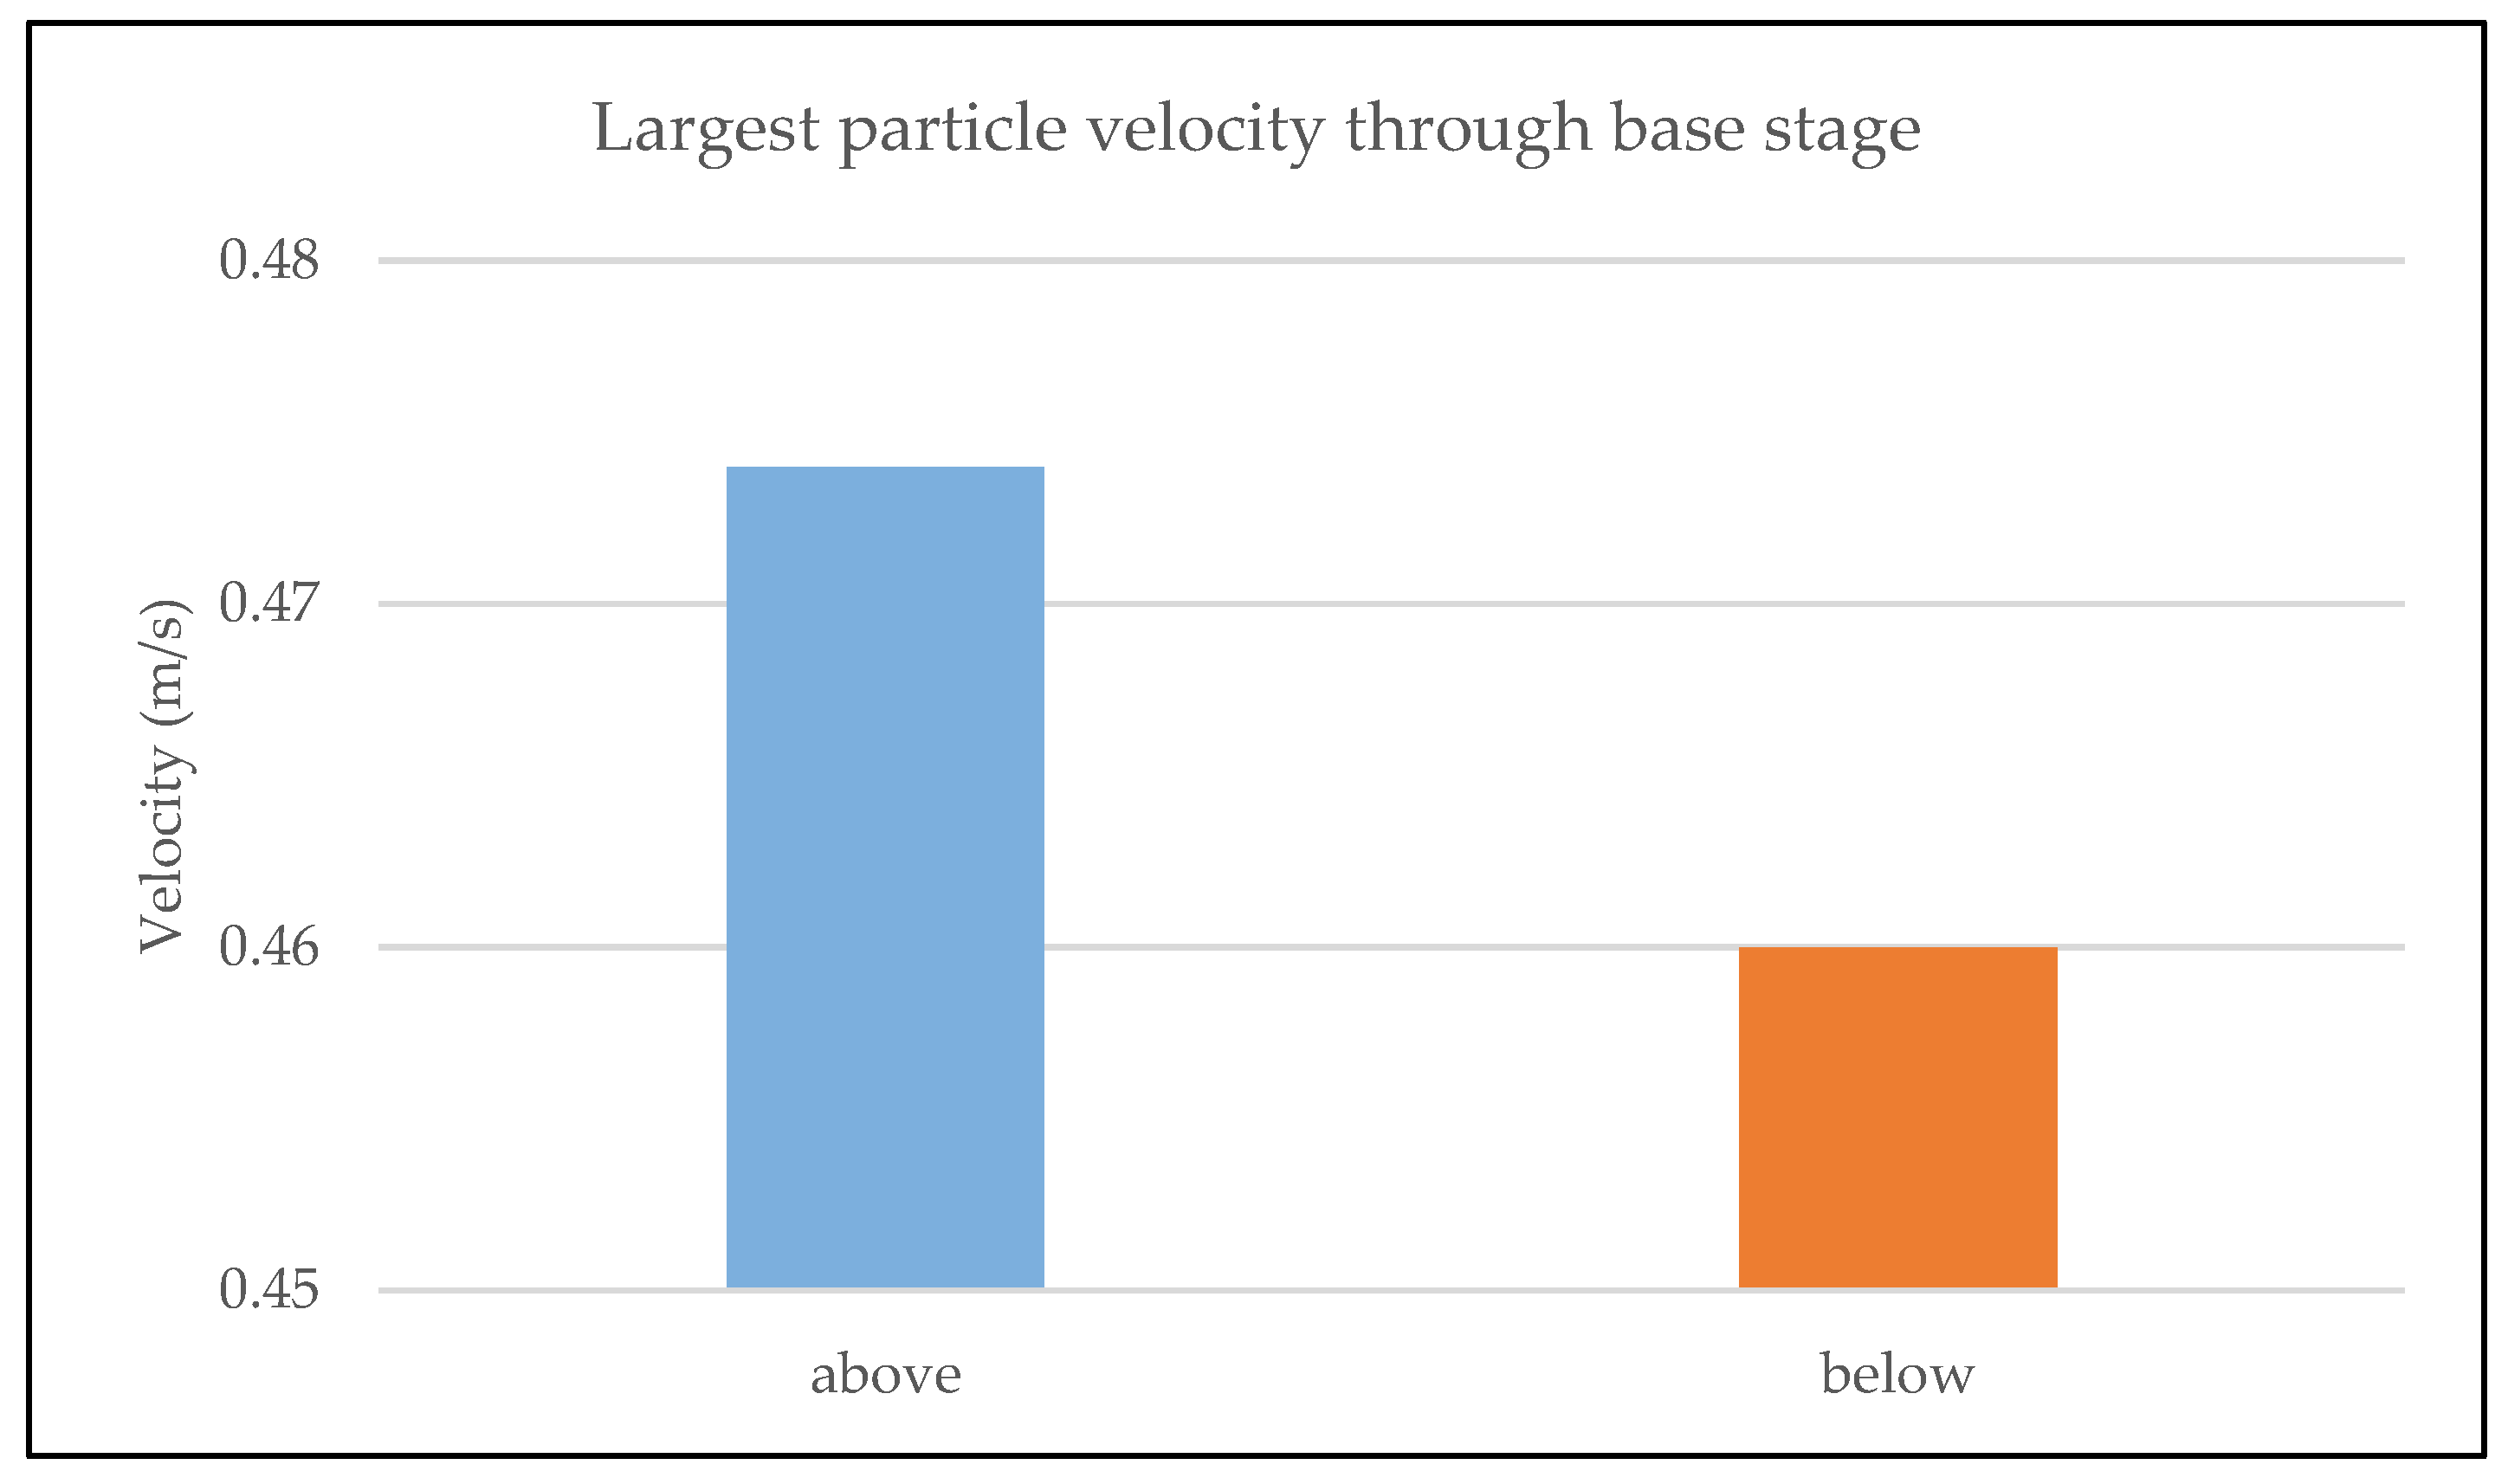
3.6. Effect of Stage Arrangement

From the relative segregation rate chart in Figure 18, it can be concluded that segregation behavior in the system was reduced due to the insertion of a second baffle stage. Inserting second-stage baffles affected both the smallest and largest particle sizes, resulting in differences in the smallest and largest particle volume fractions in the system, as shown in Figure 22 and Figure 23, respectively.
In both cases, the additional stage was located closer to the first stage. This proximity caused the largest particles to accumulate and swirl in most of the area between the two stages, impeding their movement through the additional stage that is shown in Figure 24. This swirling behavior led to a higher volume fraction of the largest particles under the upper stage.
In the ‘below arrangement’ case, the additional stage was located closer to the bottom of the reactor than in the ‘above arrangement’ case. This proximity caused the largest particles to accumulate and swirl in most of the area between the bottom of the reactor and additional stages, impeding their movement through the first stage. This swirling behavior led to a higher-volume fraction of the largest particles under the additional stage. In contrast, in the ‘above arrangement’ case, with a larger area between the bottom of the reactor and the first stage baffles, particles could move upward more easily, resulting in a higher solid velocity through the middle stage that is shown in the streamlined color and average velocity chart in Figure 25 and a more uniform particle volume fraction in this zone. However, the additional stage still caused swirling and hindered particle movement, resulting in a lower particle volume fraction at the top of the bed.

4. Conclusions

In the multi-solid, particle-size fluidized bed reactor system, segregation was observable. When segregation occurred, the small solid particles were inclined to be entrained at the uppermost part of the bed and were susceptible to escaping from the reactor. During the combustion process, the small solid particles that managed to escape from the boiler underwent combustion and incurred damage around the cyclone separator. This behavior resulted in an undesirable elevation of the flue gas temperature. By calculating the percentage of segregation, comparisons could be made regarding the segregation behavior along the reactor system. The insertion of 45-degree baffles at a height of 10 m from the bottom of the reactor was found to diminish the segregation behavior. Due to collisions, the number of small solid particles tended to diminish in the upper region of the reactor. Additionally, inserting second-stage baffles with any configuration could reduce segregation behavior. The best configuration was found to be the “above arrangement” due to particles hindering, swirling, and accumulating between the baffle stages. Even though the baffles can offer benefits, such as improved mixing and residence time distribution within a fluidized reactor, they also pose challenges, such as increased pressure drop, potential particle attrition, maintenance requirements, and the risk of affecting fluidization uniformity. Proper design and consideration of these factors are crucial to leveraging the advantages while minimizing the drawbacks. However, a rough estimate for the insertion of baffles in a fluidized bed reactor with a 5 m diameter could range from $10,000 to $50,000 or more, depending on the aforementioned factors. Finally, it should be noted that there remain numerous parameters related to baffle insertion that warrant further investigation to gain a comprehensive understanding of their effects on the segregation behavior within the fluidized bed reactor.

Author Contributions

Methodology; investigation; validation, writing—original draft preparation, S.K.; Conceptualization; supervision; writing—review and editing, B.C. and P.P. All authors have read and agreed to the published version of the manuscript.

Funding

This research was funded by the 100th Anniversary Chulalongkorn University Fund for Doctoral Scholarship and the 90th Anniversary of Chulalongkorn University Fund (Ratchadaphiseksomphot Endowment Fund). In addition, Thailand Science Research and Innovation Fund, Chulalongkorn University was partially acknowledged.

Data Availability Statement

The data presented in this study are available on request from the corresponding author.

Conflicts of Interest

The authors declare no conflicts of interest.

Nomenclature

Symbols
C D drag coefficient
C f r friction coefficient
d s particle diameter, m
d t time-step size, s
d x mesh size, m
e restitution coefficient
g gravitational acceleration, m/s2
g 0 the radial distribution coefficient
h s m a l l average bed height of small solid particles, m
h l a r g e average bed height of large solid particles, m
K interphase momentum exchange coefficient
N c Courant number
p gas pressure, Pa
p s i solid pressure, Pa
R e particle Reynolds number
s percentage of segregation
S actual degree of segregation
S m a x maximum degree of segregation
Ugas velocity, m/s
v velocity, m/s
x s m a l l mass fraction of small solid particles
Greek symbols
α volume fraction
η drag modification factor
μ dynamic viscosity kg/m-s
τ ¯ ¯ stress tensor Pa
ρ density, kg m−3
Subscripts
g gas phase
s i ith particle phase
i, kgeneric particle phase

References

  1. Sarkar, D.K. Fluidized-Bed Combustion Boilers. Therm. Power Plant 2015, 159–187. [Google Scholar] [CrossRef]
  2. Wu, G.; Chen, W.; He, Y. Investigation on gas–solid flow behavior in a multistage fluidized bed by using numerical simulation. Powder Technol. 2020, 364, 251–263. [Google Scholar] [CrossRef]
  3. Kersten, S.R.A.; Prins, W.; van der Drift, B.; van Swaaij, W.P.M. Principles of a novel multistage circulating fluidized bed reactor for biomass gasification. Chem. Eng. Sci. 2003, 58, 725–731. [Google Scholar] [CrossRef]
  4. Li, Y.; Zhang, X.; Huangfu, L.; Yu, F.; Chen, Z.; Li, C.; Liu, Z.; Yu, J.; Gao, S. The simultaneous removal of SO2 and NO from flue gas over activated coke in a multi-stage fluidized bed at low temperature. Fuel 2020, 275, 117862. [Google Scholar] [CrossRef]
  5. Davarpanah, M.; Hashisho, Z.; Phillips, J.H.; Crompton, D.; Anderson, J.E.; Nichols, M. Modeling VOC adsorption in a multistage countercurrent fluidized bed adsorber. Chem. Eng. J. 2020, 394, 124963. [Google Scholar] [CrossRef]
  6. Chen, Z.; Li, Y.; Lai, D.; Geng, S.; Zhou, Q.; Gao, S.; Xu, G. Coupling coal pyrolysis with char gasification in a multi-stage fluidized bed to co-produce high-quality tar and syngas. Appl. Energy 2018, 215, 348–355. [Google Scholar] [CrossRef]
  7. Yang, S.; Li, H.; Zhu, Q. Experimental study and numerical simulation of baffled bubbling fluidized beds with Geldart A particles in three dimensions. Chem. Eng. J. 2015, 259, 338–347. [Google Scholar] [CrossRef]
  8. Jang, H.T.; Park, T.S.; Cha, W.S. Mixing-segregation phenomena of binary system in a fluidized bed. J. Ind. Eng. Chem. 2010, 16, 390–394. [Google Scholar] [CrossRef]
  9. Zhang, Y.; Zhang, M.; Yao, X.; Lyu, J.; Yang, H. The exit impact on segregation of binary particles in the CFB system. Powder Technol. 2018, 339, 930–938. [Google Scholar] [CrossRef]
  10. Park, H.C.; Choi, H.S. The segregation characteristics of char in a fluidized bed with varying column shapes. Powder Technol. 2013, 246, 561–571. [Google Scholar] [CrossRef]
  11. Zhao, S.; Xu, X.; Chen, Z.; Fan, R.; Zhou, E.; Duan, C. Effect of louver baffle on the stability and separation performance of the gas-solid separation fluidized bed. Chem. Eng. Res. Des. 2023, 192, 582–592. [Google Scholar] [CrossRef]
  12. Oloruntoba, A.; Zhang, Y.; Li, S. Performance evaluation of gas maldistribution mitigation via baffle installation: Computational study using ozone decomposition in low-velocity dense fluidized beds. Chem. Eng. Res. Des. 2023, 195, 38–53. [Google Scholar] [CrossRef]
  13. Phuakpunk, K.; Chalermsinsuwan, B.; Assabumrungrat, S. Reduction of bubble coalescence by louver baffles in fluidized bed gasifier. Energy Rep. 2022, 8, 96–106. [Google Scholar] [CrossRef]
  14. Phuakpunk, K.; Chalermsinsuwan, B.; Assabumrungrat, S. Effect of louver baffles installation on hydrodynamics of bubbling fluidization in biomass gasifier. Sci. Rep. 2022, 12, 14891. [Google Scholar] [CrossRef]
  15. Liu, N.; Liu, X.; Wang, F.; Xin, F.; Sun, M.; Zhai, Y.; Zhang, X. Chinese Journal of Chemical Engineering CFD simulation study of the effect of baffles on the fluidized bed for hydrogenation of silicon tetrachloride. Chin. J. Chem. Eng. 2022, 45, 219–228. [Google Scholar] [CrossRef]
  16. Akbari, V.; Borhani, T.N.G.; Godini, H.R.; Hamid, M.K.A. Model-based analysis of the impact of the distributor on the hydrodynamic performance of industrial polydisperse gas phase fluidized bed polymerization reactors. Powder Technol. 2014, 267, 398–411. [Google Scholar] [CrossRef]
  17. Akbari, V.; Nejad Ghaffar Borhani, T.; Shamiri, A.; Hamid, M.K.A. A CFD-PBM coupled model of hydrodynamics and mixing/segregation in an industrial gas-phase polymerization reactor. Chem. Eng. Res. Des. 2015, 96, 103–120. [Google Scholar] [CrossRef]
  18. Akbari, V.; Borhani, T.N.G.; Shamiri, A.; Aramesh, R.; Hussain, M.A.; Hamid, M.K.A. 2D CFD-PBM simulation of hydrodynamic and particle growth in an industrial gas phase fluidized bed polymerization reactor. Chem. Eng. Res. Des. 2015, 104, 53–67. [Google Scholar] [CrossRef]
  19. Coroneo, M.; Mazzei, L.; Lettieri, P.; Paglianti, A.; Montante, G. CFD prediction of segregating fluidized bidisperse mixtures of particles differing in size and density in gas-solid fluidized beds. Chem. Eng. Sci. 2011, 66, 2317–2327. [Google Scholar] [CrossRef]
  20. Cornelissen, J.T.; Taghipour, F.; Escudié, R.; Ellis, N.; Grace, J.R. CFD modelling of a liquid-solid fluidized bed. Chem. Eng. Sci. 2007, 62, 6334–6348. [Google Scholar] [CrossRef]
  21. Goldschmidt, M.J.V.; Link, J.M.; Mellema, S.; Kuipers, J.A.M. Digital image analysis measurements of bed expansion and segregation dynamics in dense gas-fluidised beds. Powder Technol. 2003, 138, 135–159. [Google Scholar] [CrossRef]
  22. Fan, R.; Fox, R.O. Segregation in polydisperse fluidized beds: Validation of a multi-fluid model. Chem. Eng. Sci. 2008, 63, 272–285. [Google Scholar] [CrossRef]
  23. Brazhenko, V.; Qiu, Y.; Mochalin, I.; Zhu, G.; Cai, J.C.; Wang, D. Study of hydraulic oil filtration process from solid admixtures using rotating perforated cylinder. J. Taiwan Inst. Chem. Eng. 2022, 141, 104578. [Google Scholar] [CrossRef]
  24. Zhan, X.; Yu, L.; Jiang, Y.; Jiang, Q.; Shi, T. Mixing Characteristics and Parameter Effects on the Mixing Efficiency of High-Viscosity Solid–Liquid Mixtures under High-Intensity Acoustic Vibration. Processes 2023, 11, 2367. [Google Scholar] [CrossRef]
  25. Kou, B.; Hou, Y.; Fu, W.; Yang, N.; Liu, J.; Xie, G. Simulation of Multi-Phase Flow in Autoclaves Using a Coupled CFD-DPM Approach. Processes 2023, 11, 890. [Google Scholar] [CrossRef]
  26. Jin, Y.; Wei, F.; Wang, Y.; Yang, W.C. Handbook of Fluidization and Fluid Particle Systems; CRC Press: Boca Raton, FL, USA, 2003; p. 171. [Google Scholar]
  27. Zhang, Y.; Lu, C.; Grace, J.R.; Bi, X.; Shi, M. Gas Back-Mixing in a Two-Dimensional Baffled Turbulent Fluidized Bed. Ind. Eng. Chem. Res. 2008, 47, 8484–8491. [Google Scholar] [CrossRef]
  28. Zhang, Y.; Grace, J.R.; Bi, X.; Lu, C.; Shi, M. Effect of louver baffles on hydrodynamics and gas mixing in a fluidized bed of FCC particles. Chem. Eng. Sci. 2009, 64, 3270–3281. [Google Scholar] [CrossRef]
  29. Yang, Z.; Zhang, Y.; Zhang, H. CPFD simulation on effects of louver baffles in a two-dimensional fluidized bed of Geldart A particles. Adv. Powder Technol. 2019, 30, 2712–2725. [Google Scholar] [CrossRef]
Figure 1. Computational domain of fluidized bed reactor without baffles.
Chemengineering 08 00007 g001
Figure 2. Computational domain of fluidized bed reactor: (a) 45-degree baffles, and (b) 90-degree baffles.
Chemengineering 08 00007 g002
Figure 3. Computational domain of fluidized bed reactor: (a) above arrangement, and (b) below arrangement.
Chemengineering 08 00007 g003
Figure 4. Pressure drops across the bed.
Chemengineering 08 00007 g004
Figure 5. (a) Pressure drop across the bed, and (b) solid volume fraction of small, solid particle comparison between model and literature data [16,17,18].
Chemengineering 08 00007 g005aChemengineering 08 00007 g005b
Figure 6. Solid volume fraction of the small particles at 1, 50, 100, 150, 200, 250, and 300 s.
Chemengineering 08 00007 g006
Figure 7. Time-averaged percentage of segregation.
Chemengineering 08 00007 g007
Figure 8. Small solid particle volume fraction along reactor height.
Chemengineering 08 00007 g008
Figure 9. Solid volume fraction of the small particles in the system at 397 s.
Chemengineering 08 00007 g009
Figure 10. Solid velocity vector within the no-baffles reactor at 10 m from the base of the reactor at 400 s.
Chemengineering 08 00007 g010
Figure 11. Solid velocity vector at 10 m from the base of the reactor with the 90-degree baffles at 400 s.
Chemengineering 08 00007 g011
Figure 12. Solid velocity vector at 10 m from the base of the reactor with the 45-degree baffles at 400 s.
Chemengineering 08 00007 g012
Figure 13. Calculation area of solid v-velocity through the baffles.
Chemengineering 08 00007 g013
Figure 14. Solid v-velocity through the baffles.
Chemengineering 08 00007 g014
Figure 15. Small solid velocity vector and streamline of a 45-degree case.
Chemengineering 08 00007 g015
Figure 16. Small solid velocity vector from 300 s to 400 s.
Chemengineering 08 00007 g016
Figure 17. Contour plot of small solid volume fraction in the system.
Chemengineering 08 00007 g017
Figure 18. Time-averaged percentage of segregation of single-stage compared with double-stage baffles.
Chemengineering 08 00007 g018
Figure 19. Time-averaged smallest particle volume fraction of single-stage and 2-stage cases.
Chemengineering 08 00007 g019
Figure 20. Smallest particle streamlines of single-stage and 2-stage cases at 300 s.
Chemengineering 08 00007 g020
Figure 21. Time-averaged smallest particle mass flow rate through the first stage.
Chemengineering 08 00007 g021
Figure 22. Time-averaged smallest particle volume fraction along reactor height comparison.
Chemengineering 08 00007 g022
Figure 23. Time-averaged largest particle volume fraction along reactor height comparison.
Chemengineering 08 00007 g023
Figure 24. Largest particle streamlines of both double-stage cases at 300 s.
Chemengineering 08 00007 g024
Figure 25. Time-averaged largest particle velocity through base stage of both double-stage cases.
Chemengineering 08 00007 g025
Table 1. The minimum fluidization velocity and fluidization numbers.
Particle Size
(Micron)
Umf
(m/s)
Fluidization Number
3650.0466.85
7650.0933.35
15200.1522.06
Table 2. Average pressure drop and the Courant number of each grid number.
Grid Size
(m)
Grid NumberCourant NumberPressure Drop (kPa)%Difference
0.10019,2250.03145.69-
0.07534,1280.04645.600.20
0.05076,5810.05245.650.11
Table 3. Average pressure drop and the Courant number of each grid number.
CaseGrid Number
45-degree baffles34,232
90-degree baffles34,356
Above arrangement36,617
Below arrangement34,842
Disclaimer/Publisher’s Note: The statements, opinions and data contained in all publications are solely those of the individual author(s) and contributor(s) and not of MDPI and/or the editor(s). MDPI and/or the editor(s) disclaim responsibility for any injury to people or property resulting from any ideas, methods, instructions or products referred to in the content.

