Article

Chemical Composition of Different Extracts from Echinacea purpurea (L.) Moench Roots and Evaluation of Their Antimicrobial Activity

1
Department of Organic Chemistry and Inorganic Chemistry, Technological Faculty, University of Food Technologies, 26 Maritza Blvd., 4002 Plovdiv, Bulgaria
2
Laboratory of Biologically Active Substances, Institute of Organic Chemistry with Centre of Phytochemistry, Bulgarian Academy of Sciences, 139 Ruski Blvd., 4000 Plovdiv, Bulgaria
3
Department of Microbiology, University of Food Technologies, 26 Maritza Blvd., 4002 Plovdiv, Bulgaria
4
AgroBioInstitute, Agricultural Academy, 8 Dragan Tsankov Blvd., 1164 Sofia, Bulgaria
*
Author to whom correspondence should be addressed.
ChemEngineering 2023, 7(5), 94; https://doi.org/10.3390/chemengineering7050094
Submission received: 6 August 2023 / Revised: 15 September 2023 / Accepted: 28 September 2023 / Published: 9 October 2023

Abstract

:
This research aimed to reveal the chemical composition of different fractions obtained by sequential extraction of purple coneflower (Echinacea purpurea) roots and to evaluate the antimicrobial activity of some of them. Hexane, chloroform, ethyl acetate, and water were used as solvents to obtain the corresponding extracts. A GC-MS analysis was employed to reveal the chemical composition of hexane, chloroform, and ethyl acetate fractions. Conventional and ultrasound-assisted water extraction was performed to isolate inulin-type polysaccharides. Eighteen microorganisms were used for testing the antimicrobial activity of the obtained organic extracts. From GC-MS analysis more than forty compounds were detected in the fractions, including fatty acids, organic acids, fatty alcohols, sterols, and terpenes. Only in ethyl acetate extract were found mannitol and fructose isomers, while in chloroform extract were detected α- and β-amyrin, and betulin. Ethyl acetate fraction demonstrated the highest antimicrobial activity against 11 microorganisms (Bacillus cereus, B. amyloliquefaciens, Staphylococcus aureus, Listeria monocytogenes, Salmonella enteritis, Escherichia coli, Enterococcus faecalis, Pseudomonas aeruginosa, Candida albicans, Saccharomices cerevisiae, and Peniclium sp.). The polysaccharide fractions were structurally characterized by FT-IR and NMR studies as linear inulin having β-(2→1)-linked Fru units and a T-Glc unit linked α-(1→2). Inulin from coneflower roots showed poor flowability, promising bulk and tapped density, swelling properties, and better oil-holding than water-holding capacity. This study demonstrated the potential of coneflower root fractions as a rich source of phytochemicals with antimicrobial activities and potential prebiotic activity due to inulin content (15% yield) and echinacea root as a useful biobased industrial crop/material.

1. Introduction

Purple coneflower (Echinacea purpurea (L.) Moench.), a species of the family Asteraceae, is an herbaceous perennial plant, which is cultivated mostly due to its well-known health-promoting properties. Parts of the plant are used in the treatment of infectious diseases of the respiratory tract [1]. An echinacea-containing pharmaceutical preparation is often composed of extract prepared by decocting or macerating the dried, whole, or cut parts of the plant. To conduct the extraction by these techniques the plant material is soaked/heated with a solvent (water, alcohol) for some time. Despite their simplicity, traditional techniques have drawbacks, including lower yields, the use of large quantities of solvents, a negative environmental effect, and the degradation of heat-sensitive compounds during high-temperature treatment. These problems are largely overcome by developing more efficient, selective, sustainable, and ‘green’ extraction methods. On the one hand, these techniques (supercritical fluid, microwave-assisted, and ultrasound-assisted extraction, etc.) frequently offer high yields, saving time, energy, and solvents, but on the other, they require specialized equipment, thus increasing the cost of the process [2,3,4,5].
Although several modern ‘green’ extraction methods are available, they are not yet actively used in the preparation of echinacea extracts. This is probably due to the lack of information about the effect of these approaches on the quantity and quality of echinacea constituents which necessitates further investigation.
Many research studies provide valuable insight into a low number of important constituents of the purple coneflower roots. Reports noted that roots and their extracts are a source of constituents different in nature such as alkamides, caffeic acid derivatives, essential oils, polysaccharides, and glycoproteins [1,6,7,8]. In addition, studies on the evaluation of consecutively obtained extracts from the roots are still scarce or completely missing in the available literature. The fact remains that scientists examined only a very low number of phytochemicals (phenolic components, etc.) but more exhaustive phytochemical composition analyses of different organic extracts have not been carried out. Moreover, the antimicrobial activity and an evaluation of the potential healthy properties of echinacea extracts seemed not to be performed.
Another important constituent of echinacea root is polysaccharide inulin. According to different reports, the juice of the echinacea plant contains heterogeneous polysaccharides (MW < 10 kDa), inulin-type fructans (MW = 4–6 kDa), and an acidic arabinogalactan polysaccharide (MW = 70 kDa) [9,10]. It is known that E. purpurea inulin-type fructans mainly comprise β-(2→1)-linked fructosyl units, terminal glucose, and terminal fructose, and a minor portion of β-(2→1; 2→6)-linked branch point [11]. Fructans in the plant showed many biological activities such as immunomodulatory, antioxidant, and antiviral activity [12]. Therefore, isolation of inulin-type fructans remains a challenge.
The search for appropriate ‘green’ methods for the extraction of inulin included the application of different approaches such as microwave and ultrasonic irradiation, pressure-liquid extraction, and others that save time and cost and improve the yield of the obtained inulin [2,3,4,5,13]. Although echinacea is widely exploited as a herbal supplement, there are insufficient data in the available literature on the application of ‘green’ methods for the extraction of inulin from echinacea plants. There are no reports in the literature, to our knowledge, focused on investigating the effectiveness of ultrasound-assisted extraction. Moreover, until now detailed characteristics about the physicochemical and powder flowability properties of inulin from echinacea are still absent.
Therefore, the study was concerned essentially with investigating phytochemical constituents of different (n-hexane, chloroform, ethyl acetate, and water) extracts. The selected extract was subsequently obtained and characterized in a detailed way, including phytochemical composition, using GC-MS, and antimicrobial activity. Additionally, spectroscopic and chromatographic techniques were employed to characterize inulin polysaccharides obtained from conventionally and ultrasonic-treated water extract. The result of the study could be useful in the practical application of E. purpurea-constituents as food supplements and nutraceuticals.

2. Materials and Methods

2.1. Plant Material

Dry echinacea roots were purchased from an herbal drugstore in Plovdiv, Bulgaria. The plant material was produced by Bilki Ltd. (Krasno Selo, Sofia, Bulgaria). The roots were pulverized with a laboratory grinder and the powder material was then sieved through 0.5 mm.

2.2. Fractional Extraction of Purple Coneflower Roots

Ground echinacea roots (100 g) were successively extracted by maceration for 24 h with each of the following solvents: hexane, chloroform, and finally with ethyl acetate (Figure S1 and Scheme S1). The solid-to-solvent ratio was 1:5 (w/v). The solids were separated through a Buchner funnel filtration. The extracts were evaporated to dryness using a rotary vacuum evaporator and stored under nitrogen.

2.3. Gas Chromatography-Mass Spectrometry (GC-MS) Analysis

The dry echinacea extracts obtained as described above (Section 2.2) were saponified with an ethanolic solution of 2 M KOH under reflux for 1.5 h. After cooling, the obtained extracts were separated in triplicate by liquid–liquid extraction with n-hexane. GC-MS analysis was conducted on gas chromatograph Agilent Technology Hewlett Packard 7890 A, connected with mass detector Agilent Technology 5975 C inert XL EI/CI MSD at 70 eV, under conditions as previously described [14]. The obtained mass spectra were examined using 2.64 AMDIS (Automated Mass Spectral Deconvolution and Identification System), National Institute of Standardization and Technology, USA.

2.4. Nutritional Indexes Calculation

A polyunsaturated-to-saturated fatty acids (PUFA/SFA) ratio, an index of atherogenicity (IA), an index of thrombogenicity (IT), a hypocholesterolemic/hypercholesterolemic ratio (HH), a health-promoting index (HPI), and a linoleic acid/linolenic acid (LA/ALA) ratio were calculated from the GC-MS composition data following the formulas described in Chen and Liu [15].

2.5. Determination of Antimicrobial Activity of Extracts

2.5.1. Test Microorganisms

Eighteen microorganisms (Gram-positive and -negative bacteria, yeasts, and fungi) were picked out from the collection of the Department of Microbiology at the University of Food Technologies, Plovdiv, Bulgaria, for the investigation of antimicrobial activity [16].

2.5.2. Culture Media

For the cultivation of test bacteria, a Luria–Bertani agar medium was used, while for the cultivation of yeasts and fungi malt extract agar was employed. The culture media were prepared according to the manufacturer’s instructions (Scharlab SL, Barcelona, Spain) and autoclaved at 121 °C for 20 min before use.

2.5.3. Antimicrobial Activity Assay

The antimicrobial activity of purple coneflower extracts was determined by the conventional agar well diffusion method as described previously by Tumbarski et al. [16].

2.6. Isolation of Polysaccharide from Purple Coneflower Roots

The defatted residue obtained as described above (Section 2.2) was further extracted using distilled water as a solvent (1:10 w/v). Conventional extraction was conducted under reflux at 100 °C for 60 min under constant stirring. In an additional experiment, ultrasound-assisted extraction was conducted in the ultrasonic bath IsoLab (Wertheim, Germany) under constant ultrasonic frequency 40 kHz, 120 W powers at a temperature of 80 °C for 20 min. The water extracts were recovered through Buchner funnel filtration. The extraction was repeated twice. The combined extracts were precipitated with the addition of four volumes of acetone, then cooled at −18 °C for 24 h and filtration was carried out. The crude polysaccharide was dried and dissolved in hot water, precipitated, and washed with acetone. The resulting precipitate was vacuum-dried (Scheme S1).

2.7. High-Performance Liquid Chromatography Analysis of Polysaccharide

The purity of polysaccharide was analyzed by HPLC instrument Elite Chrome Hitachi with a Shodex® Sugar SP0810 (300 × 8.0 mm i.d.) with Pb2+ and a guard column at 85 °C, coupled with a refractive index detector (VWR Hitachi Chromaster, 5450, Tokyo, Japan) [17].

2.8. Spectroscopic Characterization of Polysaccharide

The IR spectra (2 mg) were collected on a Fourier transform infrared (FT-IR) spectrophotometer VER-TEX 70v (Bruker, Bremen, Germany) in KBr pellets. The spectra were recorded in the 4000–400 cm−1 range at 64 scans with a resolution of 2 cm−1.
1H and 13C NMR spectra of polysaccharide samples (20 mg/0.6 mL 99.95% D2O) were recorded using a Bruker AVIII 500 MHz spectrometer. The degree of polymerization (DP) was determined by end-group analysis from the 1H-NMR spectrum, as previously described [18]. Two-dimensional hetero-nuclear multiple quantum correlation spectroscopy (HSQC) and heteronuclear multiple bond correlation spectroscopy (HMBC) were used to assign the signals and showed the inter-residue linkages and sequence, respectively.

2.9. Molecular Weight Distribution Analysis

Polysaccharide samples (3 mg/mL) were solubilized in deionized water and further run on a Nexera–i LC-2040C Plus UHPLC system (Shimadzu Corporation, Kyoto, Japan) attached with a 20A refractive index detector employing an Agilent Bio SEC-3 (300 Å, 4.6 × 300 mm, 3 μm) column. A mobile phase composed of 0.15 M NaH2PO4 (pH 7.0) and a flow rate of 0.5 mL/min was used for the separation of samples and standards. A P-82 kit of pullulans (Shodex 159, Showa Denko, Kawasaki, Japan) having molecular mass range (0.59–78.8) × 104 g/mol and Orafti® inulin (DP 25) from chicory were employed for the building of a calibration curve.

2.10. Melting Point and Functional Characterization of Isolated Polysaccharide

The melting point of polysaccharide was measured on a melting point apparatus Kofler.

2.10.1. Color

Color measurement of the inulin samples was undertaken with a portable colorimeter Model WR-10QC D 65 lighting, a 10° standard observer angle, and an 8-mm aperture in the measuring head colorimeter, following the CIELAB (L*, a*, b*) system, where L*, a*, and b* are lightness (0 = black, 100 = white), coordinate for green, and coordinate for blue color, respectively. An inulin standard was used for calibration. The following equations were used to compute the Hue angle and Chroma:
h * = t a n 1 ( b * / a * ) ,
C * a b = a * 2 + b * 2

2.10.2. Swelling Properties, Water- and Oil-Holding Capacity

The capacities of water-holding and oil-holding of echinacea polysaccharides together with their swelling properties were evaluated according to Robertson et al. [19].

2.10.3. Angle of Repose

Five grams of polysaccharides was used for the procedure for measuring the angle of repose. All experiments were performed according to the procedure described by Sharma et al. knowing the height (H) and the radius of the cone (R) [20].

2.10.4. True, Bulk, Tapped Densities, and Flowability

Polysaccharide sample (10 g) was transferred to a 50 mL measuring cylinder. The volume of the sample was estimated. The cylinder was then tapped 500 times, and the final volume of the sample was recorded. The bulk and tapped density were computed as a weight-to-volume ratio [21]. The values of the calculated parameters were employed for the determination of the Carr index and Hausner ratio giving the flowability and cohesiveness of the powdered samples [21].

2.10.5. Wettability

To determine wettability, a method by A-sun et al. was used with modification consisting in mass and volume change [22]. Wettability represents the time(s) required for a powdered mass (50 mg) to submerge completely by being introduced on the surface of distilled water with known volume, and temperature (20 mL and 20 °C) without agitation.

2.11. Statistical Analysis

All extractions were carried out in duplicates. All chromatographic analyses were carried out in duplicates, while the other analyses were performed in triplicates. All results were presented with the means and standard deviations (if applicable and except for otherwise stated).

3. Results

3.1. Characterization of Echinacea Root Extracts

Initially, we obtained hexane, chloroform, and ethyl acetate extracts of echinacea roots. Amongst them, the chloroform extract was obtained with the highest yield (4.6%), while the hexane (0.3%) and ethyl acetate (0.4%) fractions were obtained with considerably lower yields. As a next step, we carried out a GC-MS analysis of the obtained three extracts. The results are summarized in Table 1. It can be seen that forty-nine compounds were detected in different fractions, as ethyl acetate one contained the most representatives—44 compounds (including alcohols, organic acids, alkanes, sugars, fatty alcohols, fatty acids, and phytosterols). In this fraction only, five alcohols (propylene glycol, butane-2,3-diol, glycerol, phenylethyl alcohol, mannitol), six organic acids (β-hydroxybutyric, benzoic, succinic, fumaric, malic and pyroglutamic acids), n-tetradecane, and fructose isomers were found. Fatty alcohols, fatty acids, and phytosterols were detected in all fractions, while triterpenes were found only in the hexane fraction. Thirty-two compounds were detected in the chloroform fraction, while thirty-three compounds comprised the n-hexane fraction. Mainly, phytosterols, unsaturated fatty acids, and triterpenes dominated in the hexane fraction. Fatty acids were major constituents of the chloroform fraction—82.46% of total ion current (TIC), followed by the hexane fraction 76.28% of TIC. However, alcohols, organic acids, sugars, and triterpenes did not constitute the chloroform fraction. The highest content of saturated fatty acid (SFA) was detected in the chloroform fraction—46.29% of TIC, as 50% was due to palmitic acid C16:0. Another interesting finding of the study was that essential unsaturated linoleic acid C18:2 and α-linolenic acid C18:3 dominated in the n-hexane and ethyl acetate fractions, as linoleic acid C18:2 represented more than 50%.

3.1.1. Healthy Indices of Extracts

Since fatty acids were the major constituents of examined extracts, we used the fatty acid composition data to calculate the ΣPUFA/ΣSFA ratio, IA, IT, HH, HPI, and LA/ALA indexes (Table 2). Thus, the potential health benefits of the different lipid constituents/fractions can be evaluated and compared with those available in the literature. Due to the high PUFA content, the hexane fraction was characterized by the highest ΣPUFA/ΣSFA ratio (≈1.3) by comparison with the other two. It seems reasonable to suggest that a suitable supplementation may lessen the risk of cardiovascular disease. Moreover, this fraction was also characterized by lower values of IA (0.44), and IT (0.42), and a higher HH ratio (2.34) indicating that the atherogenic, thrombogenic, and hypercholesterolemic fatty acids comprised negligible amounts of the hexane extract. This suggested that the hexane fraction possessed a higher ‘quality’ of the lipid constituents than chloroform and ethyl acetate fractions which may contribute to the minimization of atherogenic and thrombogenic factors. The higher HPI value of hexane extract than those of the chloroform and ethyl acetate extracts appeared to indicate a positive effect of this fraction on health consisting in reducing the risk of cardiovascular disease and inflammation.
Concerning the LA/ALA index, the hexane fraction had the lowest ratio, while the other two extracts were characterized by higher values. Although this ratio has a lower reference value when concerning the nutritional value of food for adults, it is assumed that lower values are nutritionally adequate.

3.1.2. Antimicrobial Activity of Extracts

The antimicrobial activity of hexane, chloroform, and ethyl acetate extracts, all in a concentration of 10 mg/mL, was tested against eighteen microorganisms (Table 3). All fractions demonstrated antimicrobial activity against 11 microorganisms (B. cereus, B. amyloliquefaciens, L. monocytogenes, S. aureus, S. enteritis, E. coli, E. faecalis, P. aeruginosa, C. albicans, S. cerevisiae, and Peniclium sp.), as ethyl acetate fraction demonstrated the highest activity, followed by n-hexane fraction. Interestingly, the chloroform fraction showed the lowest antimicrobial activity most probably because of a lack of alcohols, organic acids, and triterpenes constituents in the fraction. By contrast, the presence of organic acids, short- and medium-chain fatty acids could explain the higher activity of ethyl acetate extract. The activity of the hexane fraction most probably was due to the presence of a higher amount of triterpenes. In general, all echinacea extracts were inactive against fungi such as Asp. niger ATCC 1015, Asp. flavus, Rhizopus sp., F. moniliforme ATCC 38932, and Mucor sp.); however, they showed low activity against Penicillium sp. and yeasts as C. albicans NBIMCC 74 and S. cerevisiae.

3.2. Physicochemical Characteristics of Polysaccharide

Physicochemical characteristics of isolated inulin from Echinacea purpurea roots were presented in Table 4. Interestingly, the yield of polysaccharide obtained by classical extraction was higher than that obtained by the ultrasound-assisted extraction method. However, classically extracted polysaccharide was characterized by lower purity (58%) by comparison. It appears that the high purity of polysaccharide led to an increase in the melting point of polysaccharide extracted by ultrasound-assisted water extraction. Both polysaccharides were characterized by a molecular mass of 4.0–4.5 kDa which was very close to the molecular mass of the used inulin standard (4.0 kDa). Polydispersity is used to indicate the broadness of molecular weight distribution. This index was calculated as Mw/Mn = 1.04, which further confirmed the homogeneity of echinacea polysaccharide. Additionally, the DP was estimated using the mean ratio between the integrals of proton signals (H3-Fru and H4-Fru) and the integrals of the anomeric H1-Glc in the 1H-NMR spectrum. The additional calculation was performed from molecular weight divided by 162 g/mol. By our calculation, it was found that the DP of isolated polysaccharides was in a range of 13–16 which was slightly lower than the chromatographically determined (Section 3.3; Figure 1).
The results on the color characteristics are indicated in Table 4. The color characteristics of polysaccharide obtained by classical extraction were very close to that of polysaccharide extracted by ultrasound. The data showed a decrease in lightness (L*) and an increase in redness (a*) and yellowness (b*) of the samples. It can be seen that the red component predominates in the isolated inulin from echinacea by ultrasonic extraction. For comparison, the data for color characteristics of chicory inulin Raftiline HPX were as follows: L = 99.87 ± 0.23; a = 24.66 ± 6.07; b = −3.87 ± 6.77; C = 28.75 ± 6.36 and h° = 26.11, which showed that isolated echinacea inulin was near to commercial inulin, but was darker and yellow.
The various physical and functional parameters of inulin isolated by classical and ultrasonic extraction are also summarized in Table 4. Higher values of the Hausner ratio (>1.4), Carr’s index (25), and the angle of repose (20°) pointed out that the polysaccharide samples had fair to bad flowability and high cohesiveness. Table 4 also shows that a difference between bulk and tapped densities occurred, which suggested that this powder sample exhibited very poor flowability. However, inulin from echinacea showed short wetting times and promoted inulin particle solubility. These parameters tend to be influenced by moisture, particle characteristics, and the adhesiveness of the material.

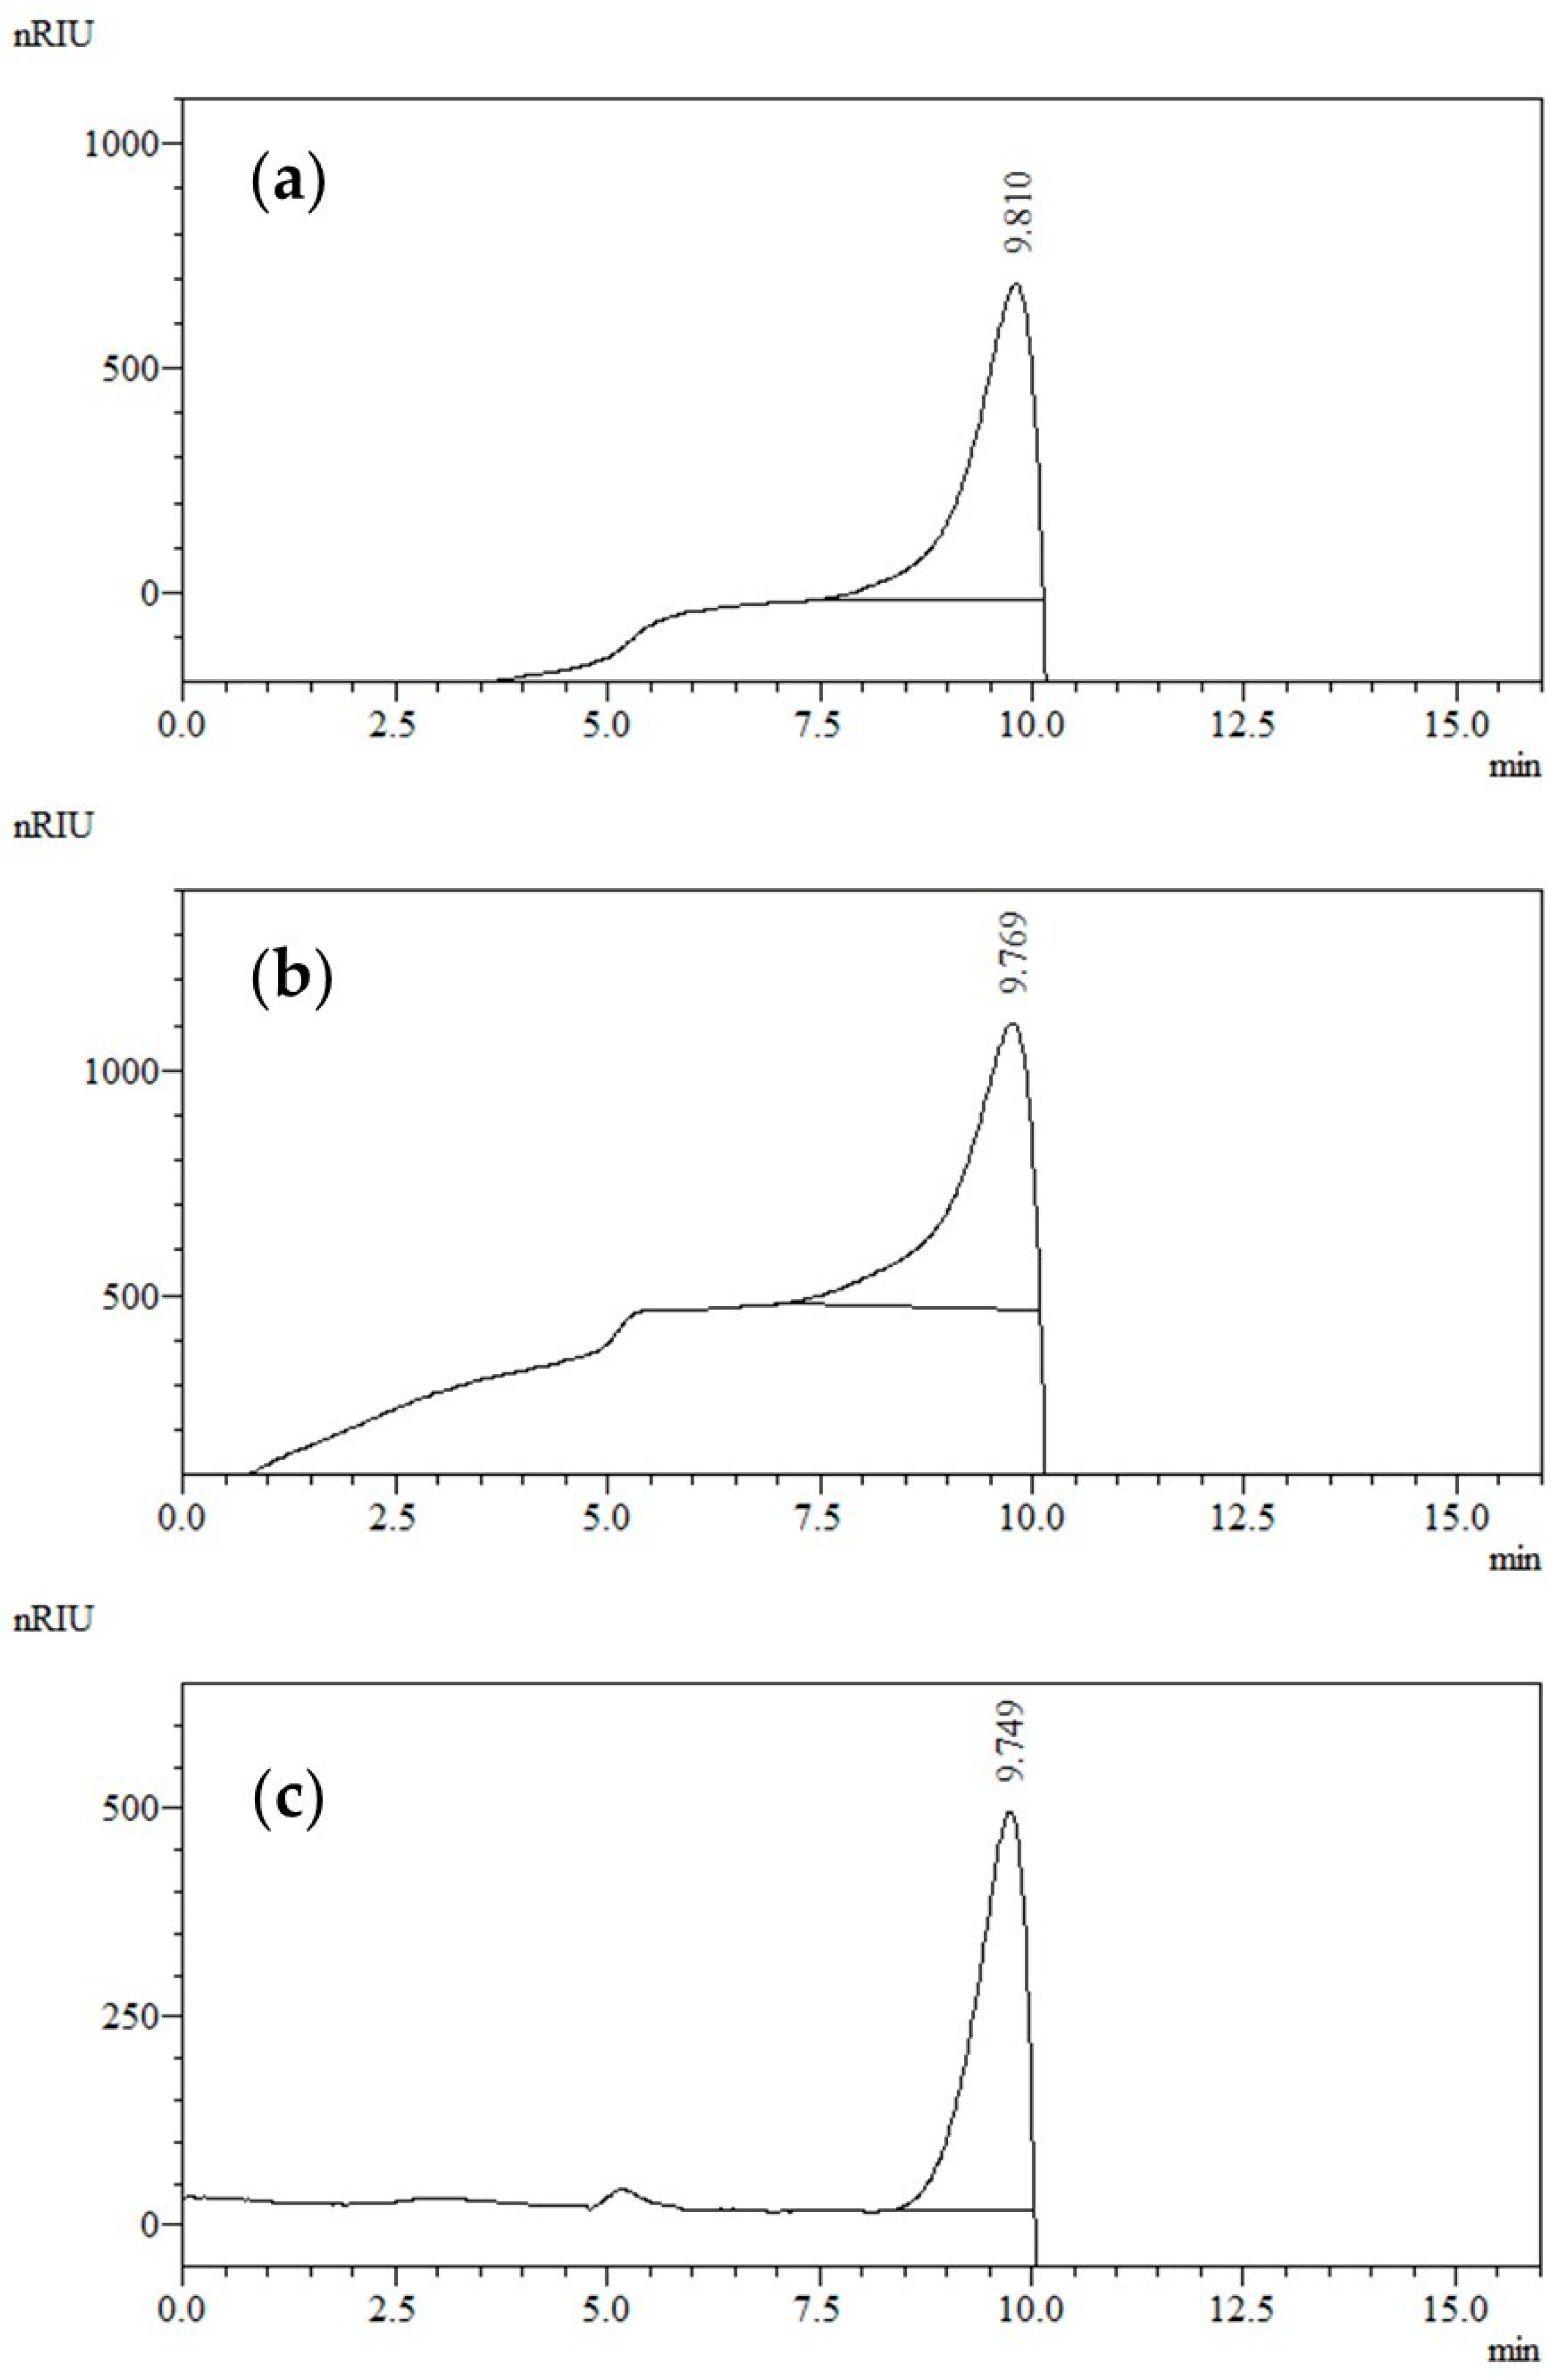
3.3. Molecular Weight Distribution Analysis of Polysaccharide

The molecular weight distribution pattern of the isolated polysaccharides is represented in Figure 1 below. It can be seen that the elution profile of conventionally extracted polysaccharide (Figure 1a) looked remarkably similar to that of the polysaccharide obtained by ultrasound-assisted water extraction (Figure 1b). The polysaccharides comprised low molecular weight populations having a molecular weight in the range of the inulin standard (DP 25) used (Figure 1c). The peaks were eluted (7.5–10 min) without a pronounced tailing implying that there was no heterogeneity within the samples. Bearing in mind the data for purity (Table 4) and the retention time, the corresponding peaks can be attributed largely to inulin fractions that occupied a very high percentage (100%) of the total peak area, and thus a higher part of the isolated polysaccharides.

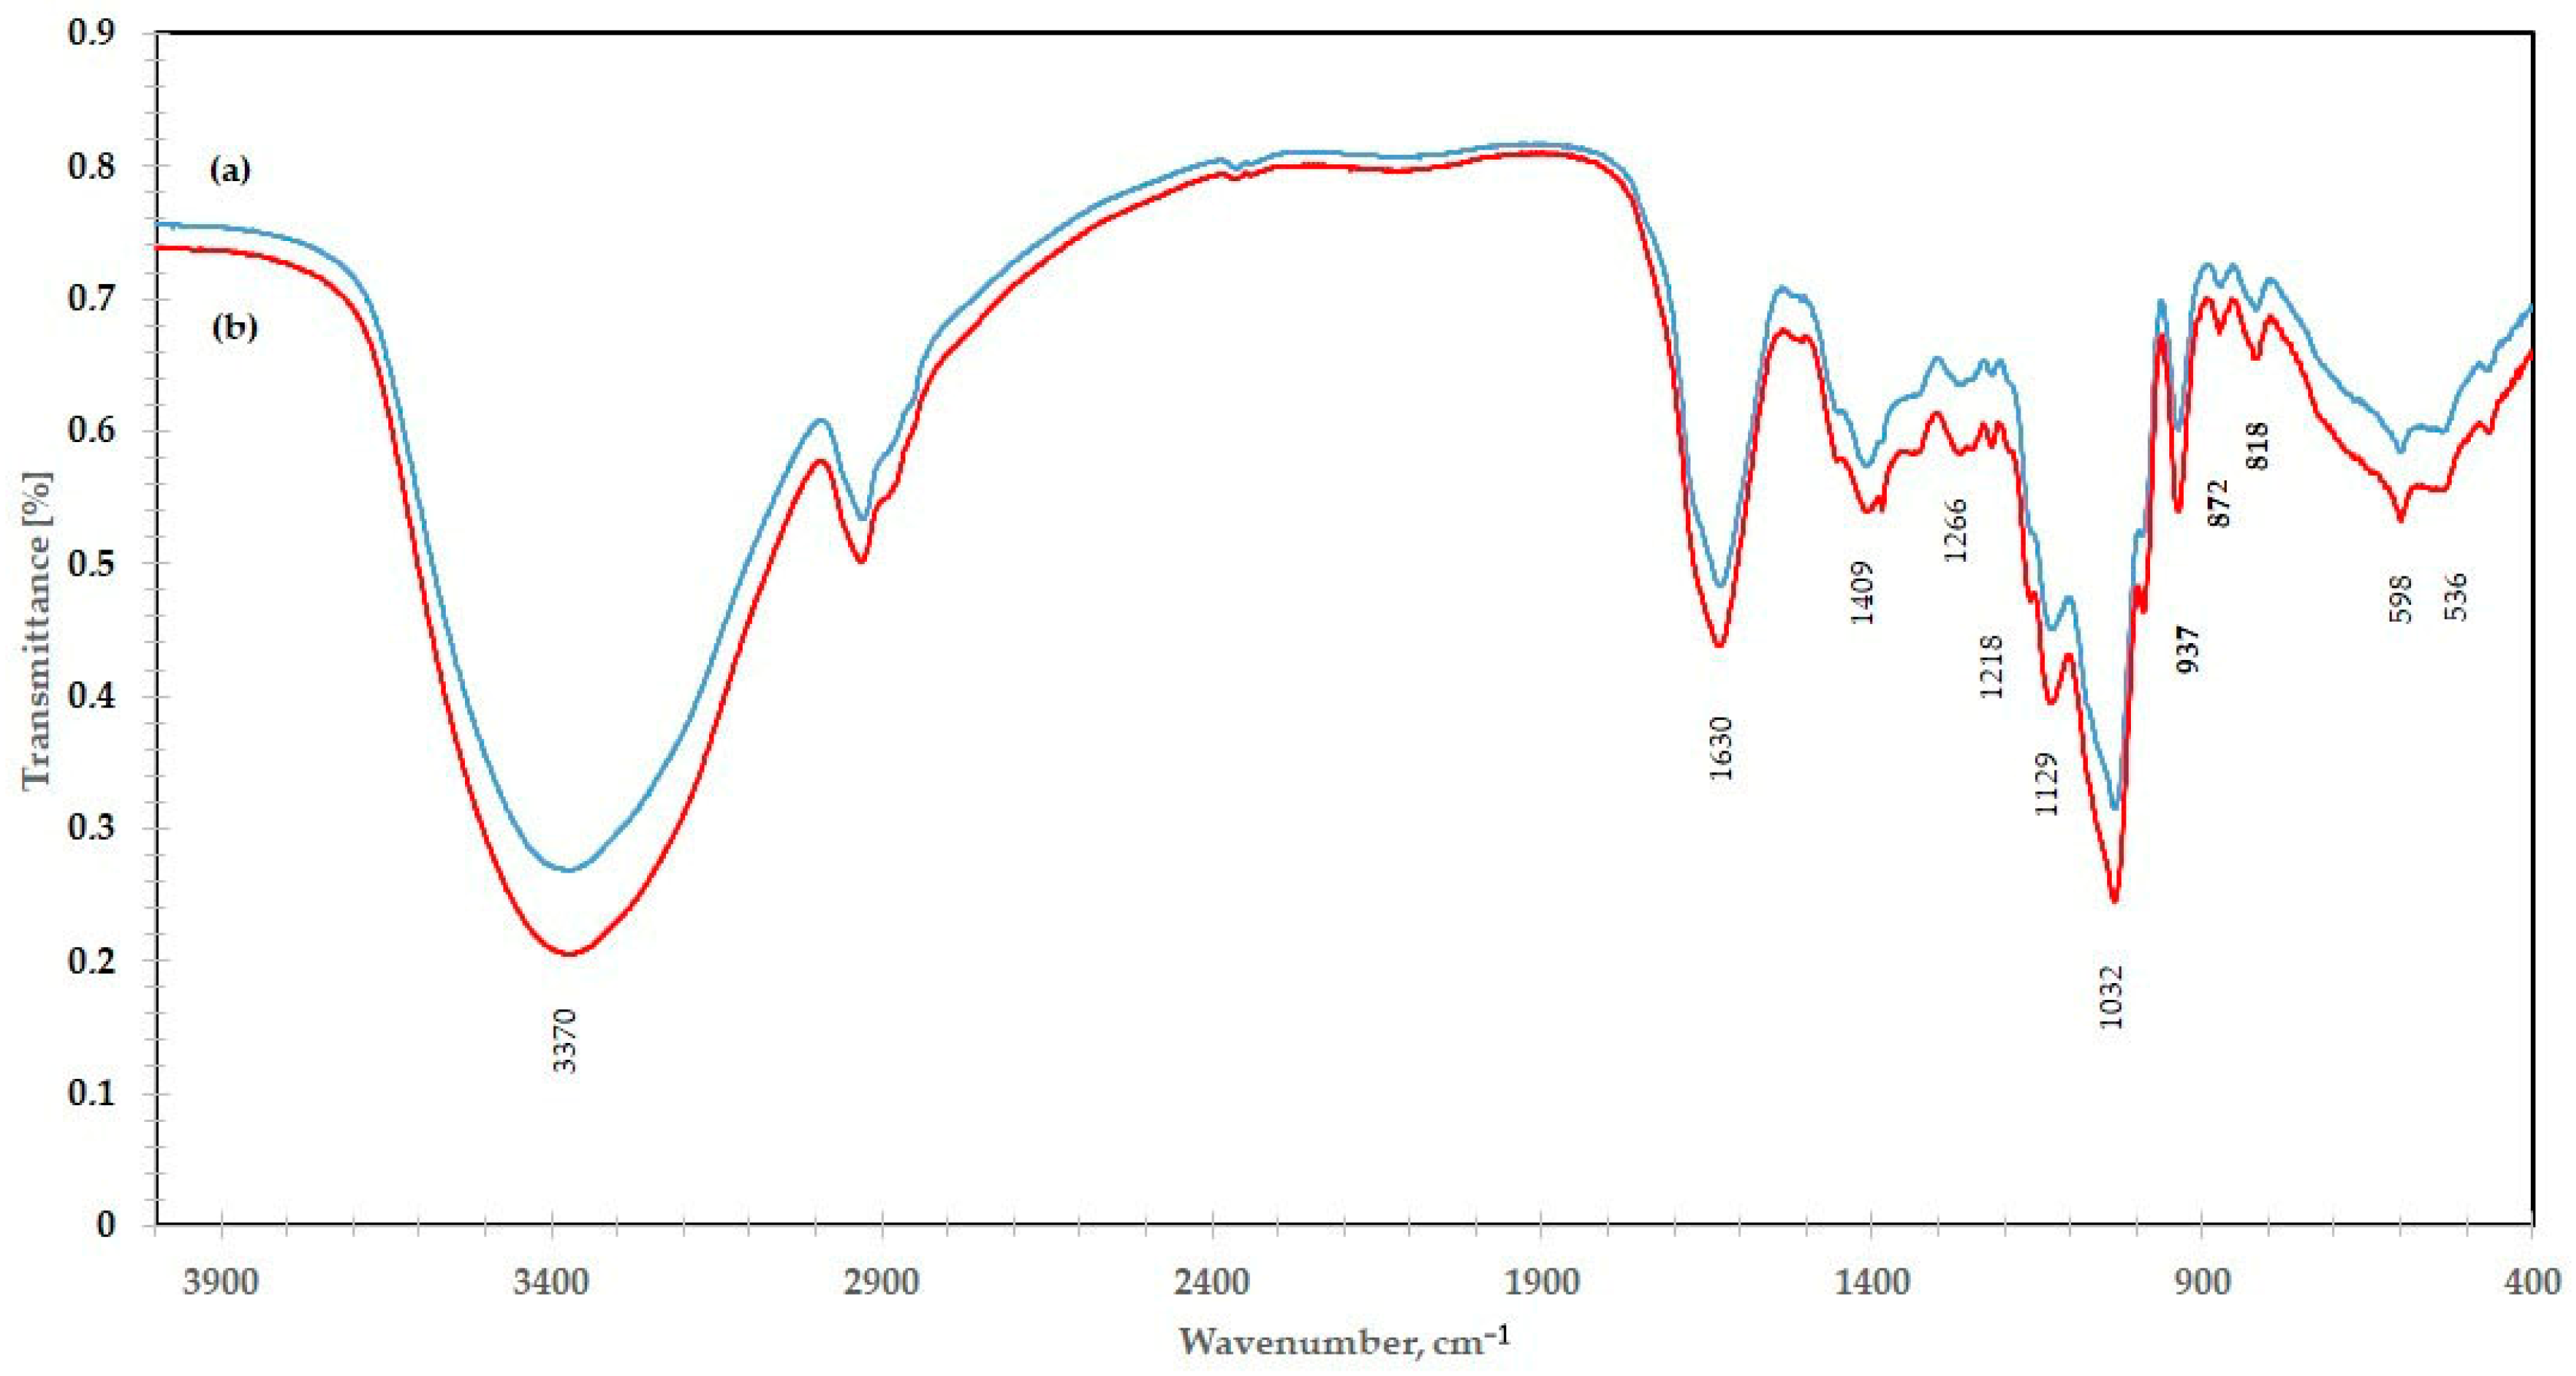
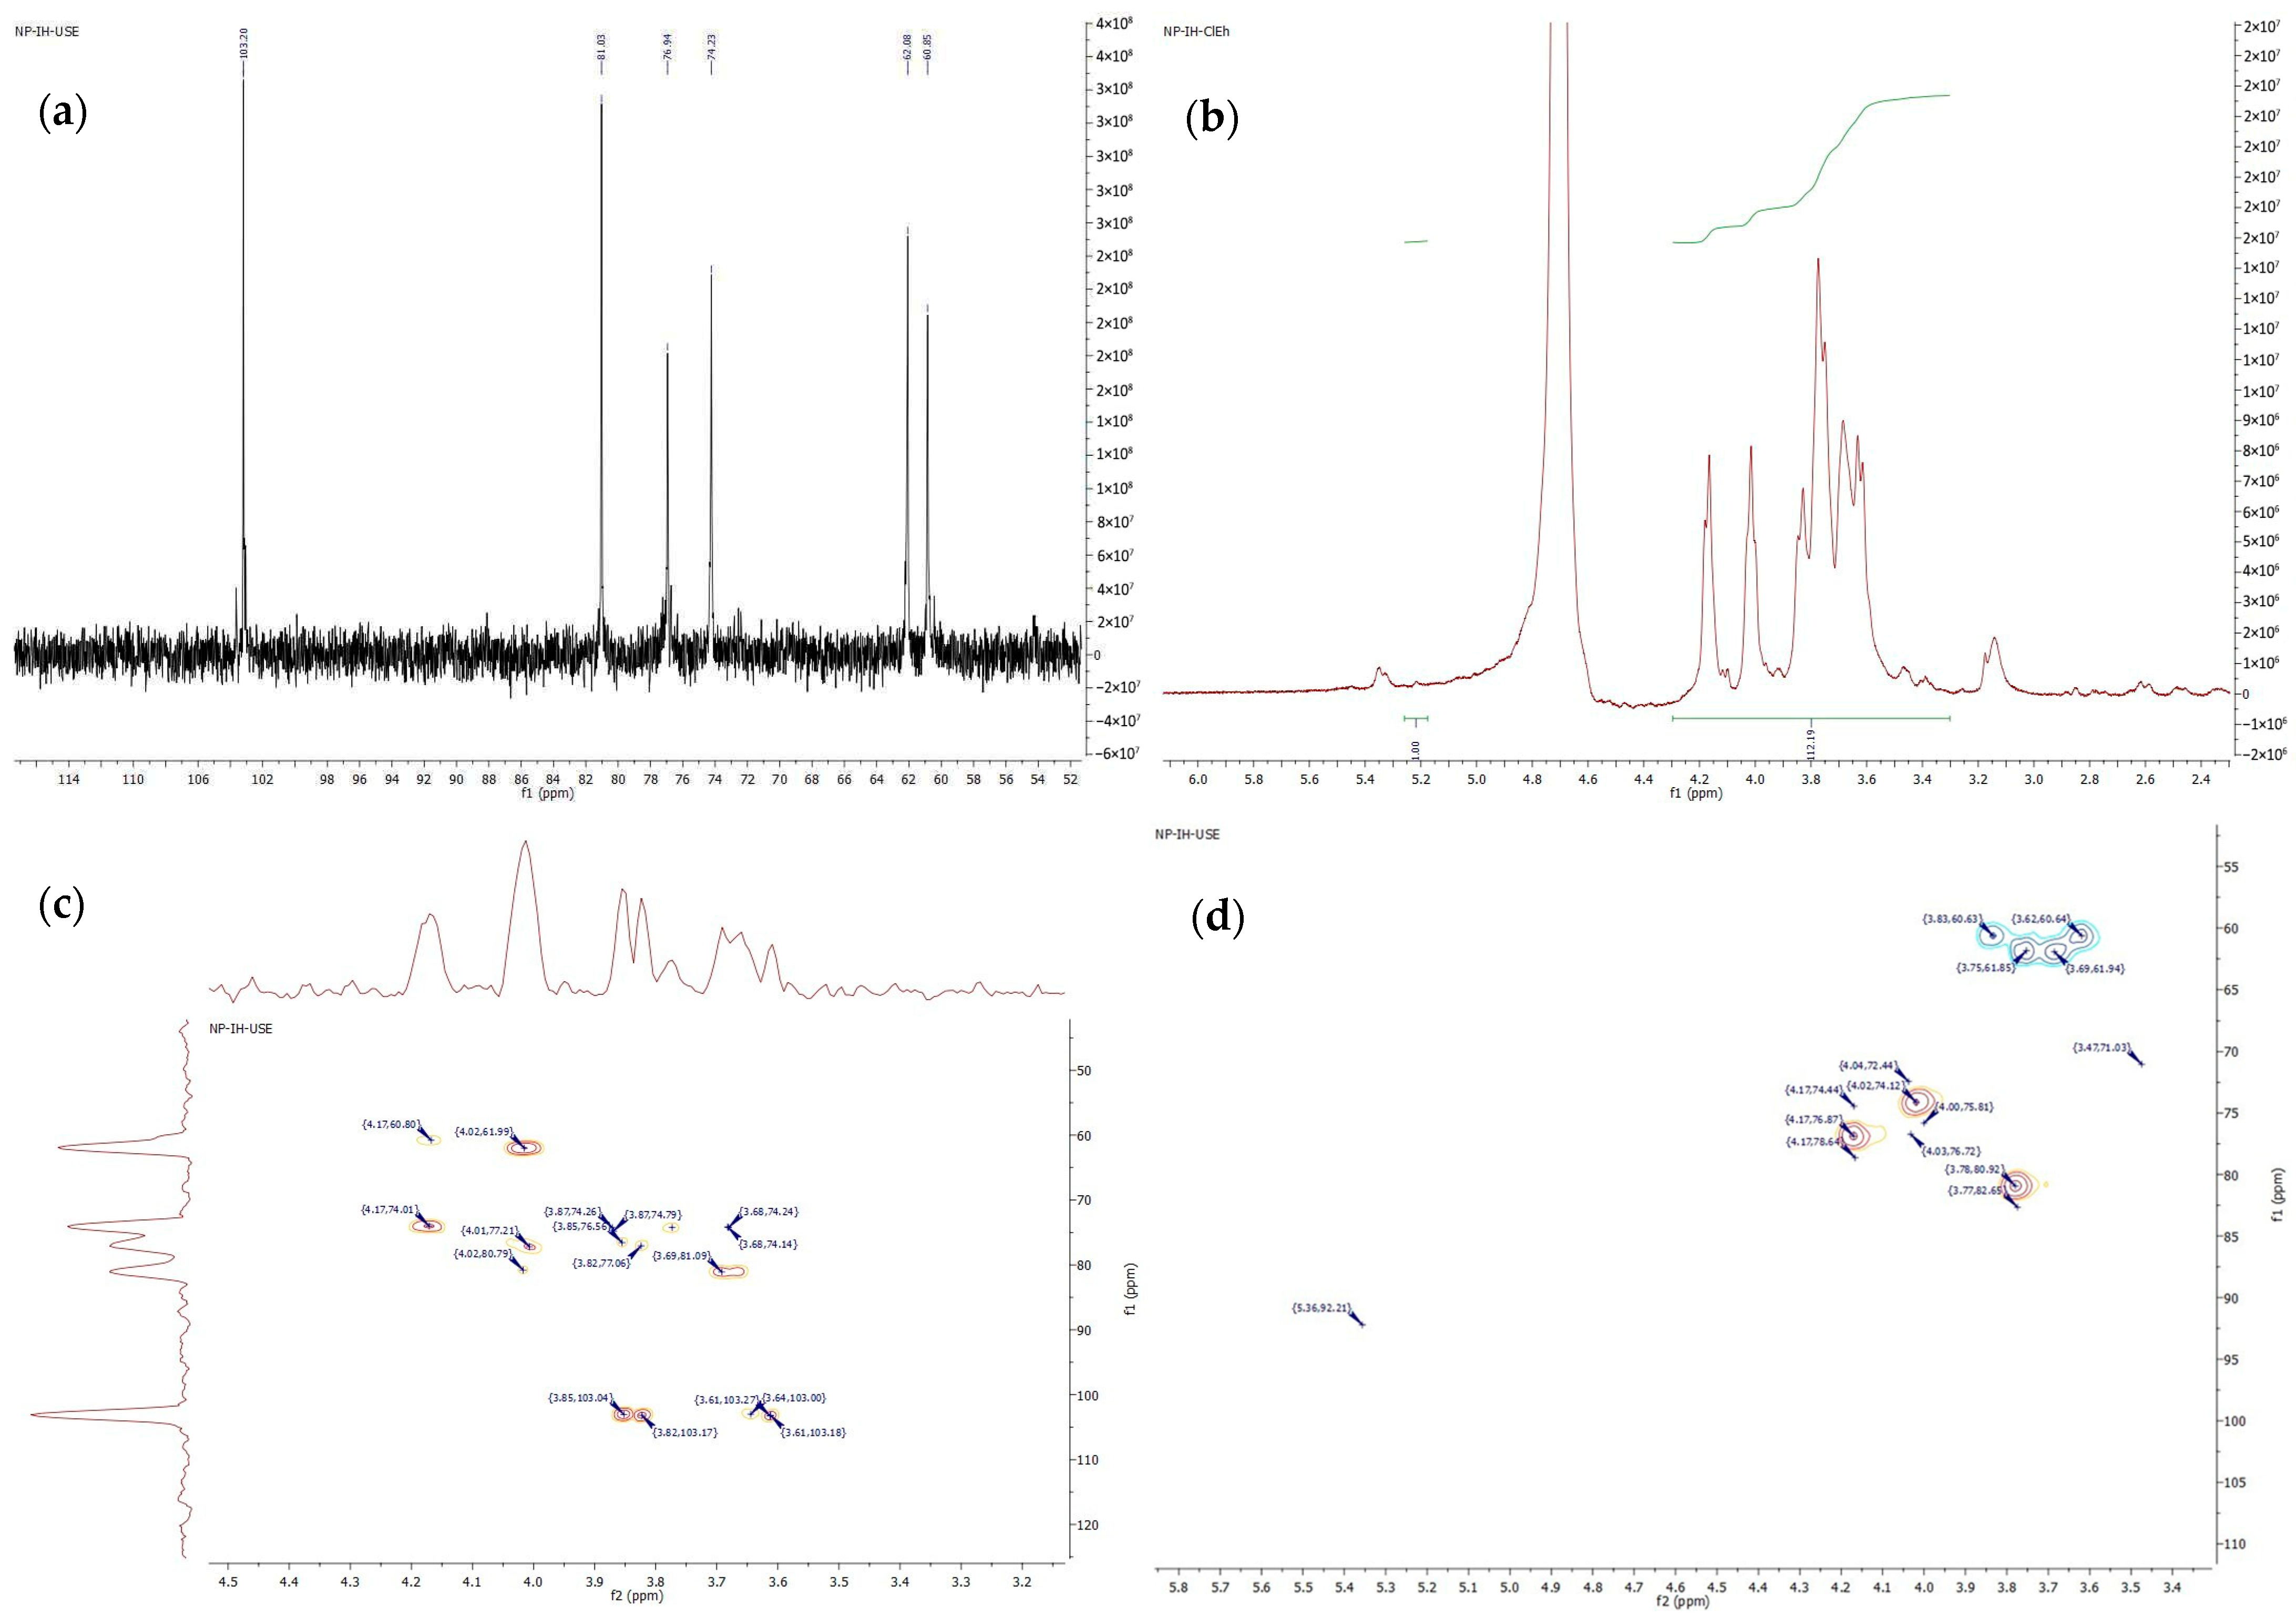
3.4. FT-IR and NMR Spectroscopic Analyses of Polysaccharide

To reveal more structural information about isolated polysaccharides, different spectroscopic techniques were employed. The obtained FT-IR spectra of isolated polysaccharides after classical and ultrasonic extraction are shown in Figure 2. It was found that both spectra contained main bands characteristic of inulin-type fructan. FT-IR spectra clearly showed a broad band at about 3370 cm−1 typical for stretching vibrations of OH groups, and molecular hydrogen bonds. Additionally, it was observed a band at 1033 cm−1 with two shoulders at about 1129 cm−1 and 989 cm−1. Similar characteristic bands were described by Grube et al. for Raftiline inulin [26]. The bands at 1129 cm−1 were characteristic of C—O—C ring stretching vibrations and the bands at 1027 cm−1 were assigned with C—O stretching vibrations in the furanose ring, and the band at around 937 cm−1 may be due to the presence of an α-glucopyranosyl unit in the inulin molecule [26]. Olennikov et al. identified the band at 937 cm−1 as characteristic of a furanose ring [27]. Absorption bands at about 874 cm−1 and 819 cm−1 were strongly indicative of 2-ketoses in furanose form and proved the CH2 ring vibration of β-anomer and the presence of 2-ketofuranose [28]. The presence of bands in the IR spectrum was close to the reported 818, 874, and 937 cm−1 for inulin indicating the presence of a β-(2→1) glycosidic bond [27].
Concerning NMR data, in the 1H-NMR spectrum (Figure 3b) of polysaccharide from echinacea roots shifts at δ 4.11 (H3f), δ 4.27 (H4f) and those at 3.71 to 3.94 (H1f, H5f, and H6f) together with one isolated resonance for the single anomeric α-glucose proton (H1g) at 5.36 ppm were diagnostic of the skeleton protons of fructose ring. The integration ratio between 3.3 ppm to 4.2 ppm of fructofuranose and H-1 of glucopyranose could be used to calculate the DP of inulin-type fructan. The 13C-NMR spectrum (Figure 3a) contained six peaks, originating from carbon from the fructose unit, which were observed at 103.20 (C2f), 81.03 (C5f), 76.94 (C3f), 74.23 (C4f), 62.08 (C6f), and 60.85 (C1f) ppm. However, the signals from the glucose unit were not observed in this spectrum. The common situation for the superposition of glucose shifts was reported for inulin from echinacea and burdock [10,11]. In the 13C-NMR spectra were noticed one signal (103.20 ppm) assigned to the C-2 carbon that participated in β-(2→1)-D-fructofuranosyl-fructose bonds. The data from 1D-NMR (1H and 13C) spectra proved the linear structure of inulin from echinacea roots. Additionally, fructose units linked with β-(2→1) bonds and only one terminal glucose residue linked α-(1→2) comprised the polysaccharides. Five shifts were found in the non-numeric region of the DEPT135 spectrum (Figure S2). The other well-resolved signals at 62.07 and 60.84 ppm were due to two CH2 atoms from C1 and C6 from fructose units, while three other resonating at 81.03, 76.94, 74.23 ppm were assigned to CH- groups from C3, C4, and C5 atoms of fructofuranosyl ring. To deduce the structure of glycosyl residues HMBC experiments were conducted (Figure 3c). The HMBC spectrum confirmed a correlation between the H1-Fru/C2-Fru of fructosyl residues thus supporting the proposal that (2→1)-linked-β-D-fructofuranosyl units were present as previously described [10,29,30]. This experiment further proved the existence of a linear chain. The HSQC spectrum of the polysaccharide (Figure 3d) contained a weak cross-peak between δ 5.36 and 92.21 ppm that arose from the H-1 resonance of α-D-Glcp unit and corresponded to the C-1 of glucose at 92.28 ppm. Due to very weak signals, the assignment of other protons occurring in the range of 3.5–4.0 ppm was not completed.

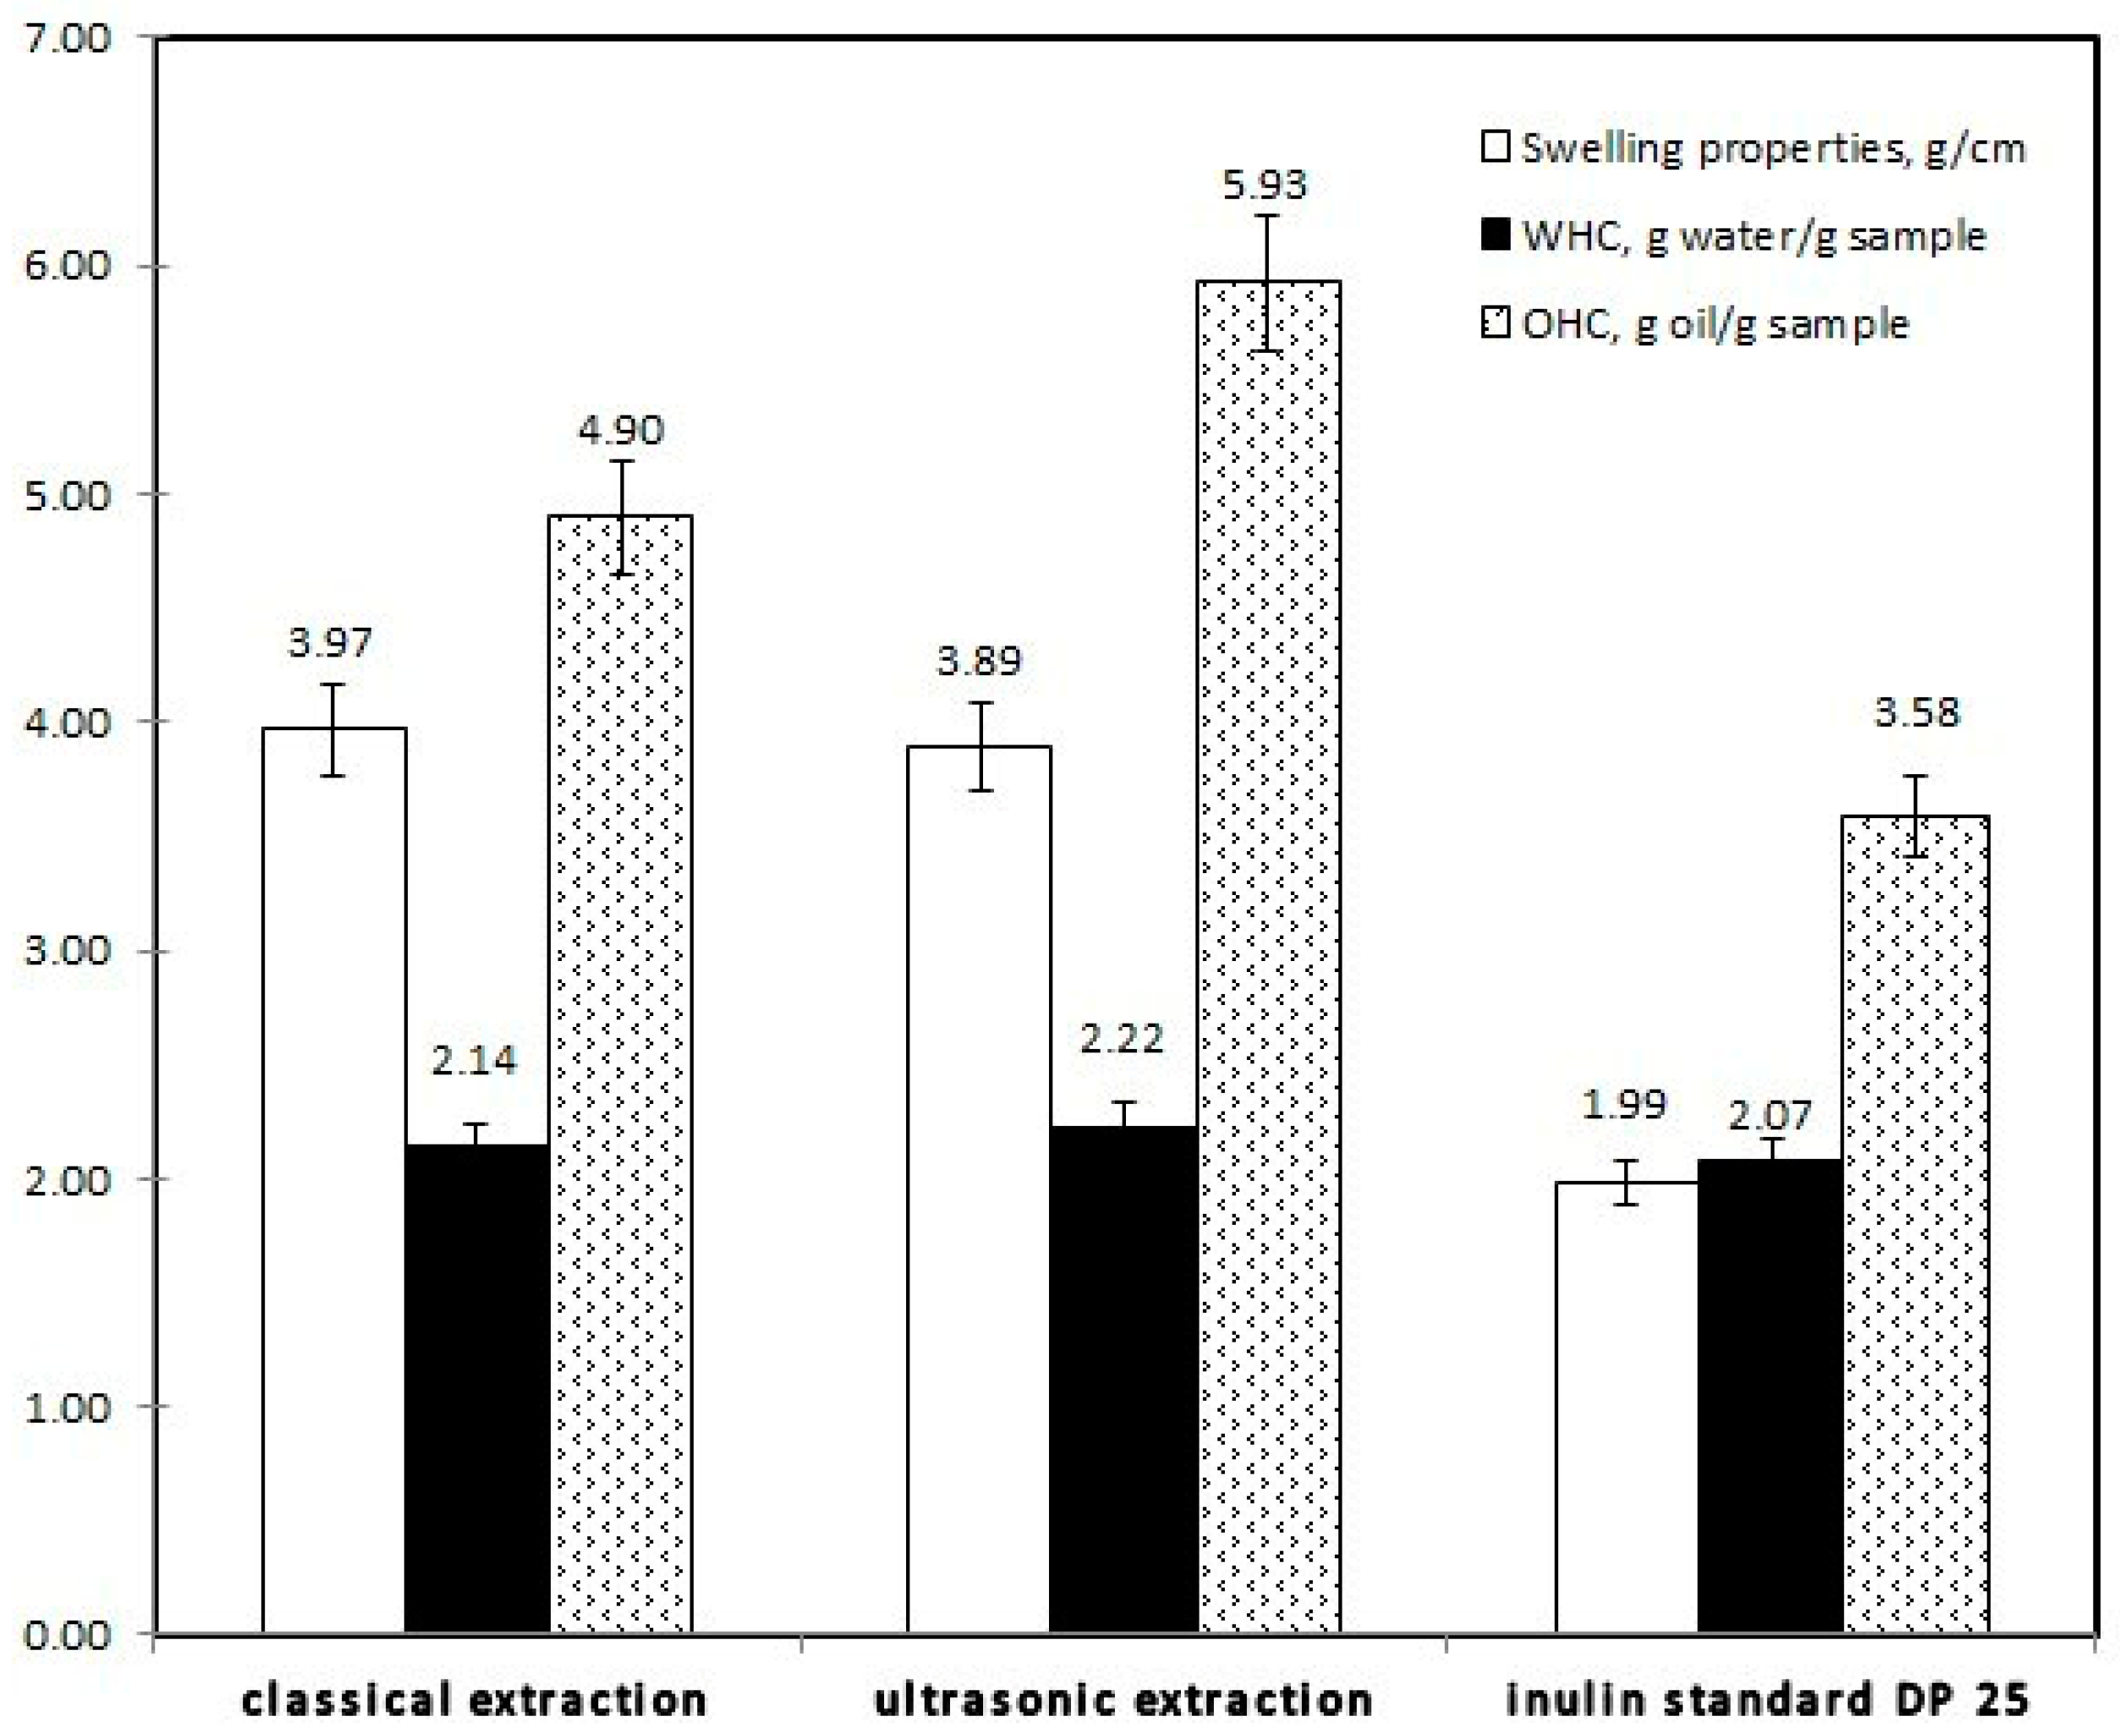
3.5. Functional Properties of Polysaccharides

The results on functional properties (swelling properties, oil, and water-holding capacity) of the isolated inulins are shown in Figure 4. From the data in the graph, it is apparent that samples have better oil-holding capacity than water-holding capacity. In general, the inulin obtained by ultrasonic extraction was distinguished by the highest oil holding capacity (5.93 g oil/g sample), as well as with good swelling capacity–3.89 g/cm3. All inulins exhibited a similar water-holding capacity of about 2 g water/g sample.

4. Discussion

4.1. Characterization of Echinacea Root Extracts

The current study focuses on different echinacea root extracts and reveals their phytochemical constituents. Based on GC-MS analysis, it was revealed the presence of different organic compounds (alcohols, organic acids, sugars, fatty acids and alcohols, triterpenes, phytosterols, polysaccharides, etc.). Amongst phytochemicals, fatty acids were the most abundant. Palmitic acid, linoleic acid, α-linolenic acid were the major fatty acid components. Similar findings were made in an earlier study. For example, some authors also found domination of linoleic acid, in the fatty oil of Echinacea purpurea fruits and roots obtained by n-hexane extraction [31,32]. Our findings for saturated fatty acids, phytosterols, and terpenes in n-hexane fraction were in good agreement with the reported data in the literature. Coelho et al. found sixty-four non-polar compounds in hexane and dichloromethane extracts of E. purpurea (L.) Moench roots evaluated by GC/MS equipment. The most abundant compounds were sterols, fatty acids, and long-chain hydrocarbons [29]. Their study stated that the most distributed compounds in the n-hexane echinacea root extract were fatty acids, mainly saturated–palmitic acid (C16:0) and stearic acid (C18:0), unsaturated–9,12-octadecadienoic acid (linoleic acid, C18:3, long-chain hydrocarbons (14.6%) and sterols (13.9%). However, in our case, phytosterols in the hexane fraction were 15.36% of TIC, as β-sitosterol represented 79% of the total detected sterols. In our case, five triterpenes (α- and β-amyrin, lanosterol, cycloartenyl acetate, and betulin) were found in the n-hexane fraction, while in chloroform only lanosterol was found. To the best of our knowledge, for the first time, two dicarboxylic acids (suberic and pimelic acid) and three odd-chain fatty acids (enanthic acid C7:0, pelargonic acid C9:0, margaric acid C17:0) and elaidic acid C18:1 were found in extracts. Pelargonic acid (C9:0) dominated in all extracts in comparison to other odd-numbered fatty acids. The presence of dicarboxylic azelaic acid and other odd-numbered fatty acids (n-undecanoic acid C11:0, pentadecylic acid C15:0, n-heneicosanoic acid C21:0) was reported earlier by Coelho et al. [32].
The hexane fraction was in contrast to chloroform and ethyl acetate fractions as regards the lipid health indices. The value of the hexane ΣPUFA/ΣSFA ratio (1.3) fell within the recommendable range of 1.0 to 1.5. Although there is no specific value for the n-6/n-3 ratio, it is recommended the optimal value of this ratio be 1:1 to 4–5:1 [15,33]. Our calculation revealed that the hexane, chloroform, and ethyl acetate values fell within the recommended range (Table 2, LA/ALA ratio). Regarding IA and IT, it is assumed that lower values of these indices correspond to a lower risk of cardiovascular disease. By using IA and IT indices for different kinds of fats and oils (seed, fruit, nut, etc.), it can be assessed the potential effects of fatty acid constituents on cardiovascular disease [15,33]. Our calculations about IA and IT indices were consistent with the previous findings on some plant oils. Interestingly, IA and IT were identical to those of argan and avocado oils and comparable with those of some crops such as cumin, and guar seed [15] but bear no comparison with rapeseed, sunflower, almond, and pecan oils [33].
Our research findings indicated that hexane, chloroform, and ethyl acetate extracts possessed moderate antimicrobial activity against different microorganisms. Our observations were in line with those of earlier studies [32,34,35]. For example, Stanisavljević et al. reported that 70% aqueous ethanol echinacea extracts showed considerable growth inhibition on Candida albicans and Saccharomyces cerevisiae, while no growth inhibition zones were observed for Aspergillus niger [34]. Different commercially existing extracts of different species and parts (including roots) of coneflower together with their fractions showed comparable phototoxic activity against fungi and yeasts (Candida spp. and S. cerevisiae). The exhibited activity was largely due to the presence of ketoalkenes and ketoalkynes in the extracts [35]. In our case, ethyl acetate fraction showed moderate antimicrobial activity against Gram-negative microorganisms, such as P. aeruginosa ATCC 9027 and E. coli ATCC 25922 as well as against Gram-positive (S. aureus ATCC 25923 and B. subtilis ATCC 6633). Our findings were in good agreement with the data obtained by Coelho et al. [32]. These researchers reported that the highest antimicrobial activity was displayed by the dichloromethane, ethyl acetate, and acetone echinacea root extracts. In our study, the increased potential of inhibiting Gram-positive bacteria showed not only the n-hexane extract but also the ethyl acetate fraction. The antibacterial activity of E. purpurea root extracts against Gram-negative bacteria such as P. aeruginosa and E. coli was also confirmed by other reports [36].

4.2. Characterization of Echinacea Root Polysaccharides

Based on chromatographic and spectral analyses both polysaccharides were characterized as typical inulin-type fructans. However, the extraction method seems to influence the yield of polysaccharide material since polysaccharides differ in yield. Despite ultrasound having a cell wall-breaking effect, causing an easier extraction of constituents, the yield of inulin obtained by ultrasonic extraction (15.4%) was lower than classically extracted (18.7%). It may be that a short time (20 min) and a lower temperature (80 °C) employed for ultrasound-assisted extraction by comparison with classical extraction (60 min, 100 °C) resulted in a lower yield of polysaccharide. However, this yield of polysaccharide obtained by ultrasound-assisted extraction was higher than reported earlier for inulin isolated after microwave-assisted extraction (12%) [10]. The extraction conditions determine not only the yield but also the purity of isolated polysaccharides. For example, the purity of inulin obtained by ultrasound- (72%) and microwave-assisted extractions (82%) was higher than classical extraction (57%) [10]. Therefore, the higher yields and reduced time of extraction, together with improved efficiency of the extraction process were a clear advantage of ultrasound-assisted extraction over classical extraction.
There were similarities in the molecular weight distribution patterns of both polysaccharides, although different extraction approaches were employed (Figure 1). Our findings about molecular mass were in agreement with previous studies on inulin type-fructan from echinacea root [10,24,25,37]. In the current study, we also used the 1H-NMR spectrum to evaluate the DP of extracted polysaccharides followed by the calculation of molecular weight. However, these results differed somewhat from those determined by the chromatographic method. The lower values of molecular weight and degree of polymerization in our case could be explained with specifics of the used analytical technic (e.g., solubility of the sample and complexity caused by the overlapping resonances). Nevertheless, we can compare our results with a previously published study on echinacea polysaccharide. For example, Wack and Blaschek obtained three polysaccharide fractions characterized by a higher DP: 80% ethanol-insoluble fructan (DP 35), 60% ethanol-insoluble fructan (DP 44), and 40% ethanol-insoluble fructan (DP 55). Polysaccharides were also purified from the juice of aerial parts of this plant, as it was found that inulin-type fractions had a molecular weight of 6 kDa corresponding to DP 37 [9,37]. Our previous study reported on the isolation of inulin-type fructan with an average DP of 27 (4.3 kDa) from echinacea roots by microwave-assisted water extraction [10]. Other scientists found inulin from echinacea roots with 4.5 kDa molecular mass [24]. An important point to remember is that inulin-type fructan from echinacea roots has a significant biological function and that its chain length (DP) and molecular weight have an impact on these properties [12,38,39].
Since this study set out to characterize mainly echinacea polysaccharide constituent, we conducted not only chemical characterization of the polysaccharide but also investigated its flow properties—the angle of repose, Carr’s index, and Hausner ratio. These indices were very important for the packaging and transportation of powdered pharmaceutical and food additives. According to Nandi’s classification, both polysaccharides possessed very poor/very cohesive flow because Carr’s index and Hausner’s ratio had values of 32–37% and 1.46–1.59, respectively [40]. Moreover, Sherrington and Sherrington mentioned that a poor-flowing material (e.g., a fine powder) should be characterized by the existence of larger interparticle interactions, and thus much difference between bulk and tapped density values, and therefore a larger Carr’s index should be observed as in our case [41]. A high number of hydrophilic groups in inulin gives an adequate explanation for the observed short wetting times and promoted inulin particle solubility [42]. To the best of our knowledge, this is the first detailed report about the functional and physicochemical properties of inulin from echinacea roots.
As regards color characteristics, our data for the lightness of inulin were comparable with some data for other inulin isolated from different plant sources such as chicory, Jerusalem, and globe artichoke [43,44].
The investigation of the functional properties of the isolated polysaccharides revealed that both polysaccharides exhibited better oil-holding capacity than water-holding capacity. These results did not contradict our previous findings. For example, functional properties regarding swelling properties only 4.2 mL/g sample, the oil-holding capacity of this polysaccharide (3.0 g oil/g sample), and the water-holding capacity (1.7 g water/g sample) were similar to those of echinacea inulin obtained by microwave-assisted extraction [10]. By comparison, the obtained values for water- and oil-holding capacities of echinacea inulin were close to previously reported data for long-chained chicory (1.59 g water/g sample and 3.4 g oil/g sample, respectively) [45]. However, our results on the oil-holding capacity of echinacea inulin were more than twice time higher than the reported values for Asparagus falcatus inulin (101.62 g corn oil/100 g dw inulin), Taraxacum javancium inulin (72.50 g corn oil/100 g dw inulin) [46], commercial chicory inulin and globe artichoke inulin (1.37 and 1.38 g oil/g sample, respectively) [44] and Jerusalem artichoke 1.02 g oil/g sample [47].
Therefore, we can safely draw conclusions from our discussion, that due to the better oil-holding properties, echinacea inulin can be used as a functional ingredient to improve taste, consistency, and other sensory properties of the formulated product, reduce syneresis, and modify texture.
The current study provided compositional information about different organic extracts and examined their antimicrobial activity. We obtained different fractions from one plant source having different compositions and displaying different properties. In addition, a comparison between traditional and a ‘green’ ultrasound-assisted extraction technique for inulin extraction was performed. Although, in our case, ultrasound-assisted extraction did not provide a higher yield, the resulting polysaccharide was characterized by a higher purity in contrast to conventionally extracted one. Moreover, this study yielded detailed characteristics of the physicochemical and powder flowability properties of inulin from echinacea. However, further study should express an interest in examining a wide range of biological activity (anticancer, immunomodulatory, etc.) not only of organic extracts but also of the obtained inulin. Thus, information about the influence of extraction techniques on biological properties will be gathered.

5. Conclusions

We performed a detailed study on the phytochemical composition of different echinacea root extracts. It was found that fatty acids were the major components whereas fatty alcohols, phytosterols, sugars, and triterpenes were minor constituents. Amongst all extracts, hexane extract had a high ΣPUFA/ΣSFA ratio, HH ratio HPI value, and lower values of IA and IT suggesting that it exhibited a good ‘quality’ of the lipid constituents. Ethyl acetate extract, on the other hand, demonstrated better antimicrobial activity than the other extracts. It was revealed that ultrasonic-treated water extract contained linear inulin composed of fructose units linked with β-(2→1) bonds and a terminal glucose unit linked α-(1→2) having DP and molecular-wight properties similar to the standard used. Both polysaccharides had very poor/very cohesive flowability contrary to the better oil-holding capacities. Our findings point to the possibility of incorporating inulin as a functional ingredient to improve taste, consistency, and other sensory properties of the formulated product, reduce syneresis, and modify texture. The main conclusion to be drawn from this study is that extracts are a rich source of different phytochemicals (lower and higher molecules) and that echinacea roots can be used as a useful pharmaceutical and biobased material.

Supplementary Materials

The following supporting information can be downloaded at: https://www.mdpi.com/article/10.3390/chemengineering7050094/s1, Figure S1: Picture of the plant material (echinacea root) used for extraction in this study. Scheme S1: Illustration of extract preparation from echinacea roots. Figure S2: DEPT135 NMR spectrum of inulin polysaccharide isolated from echinacea root.

Author Contributions

Conceptualization, N.P., I.I., Y.T., and M.O.; investigation, N.P., A.P., I.I., I.H., Y.T., and I.D.; resources, N.P. and P.D.; data curation, N.P., I.I., A.P., and M.O.; writing—original draft preparation, N.P. and M.O.; writing—review and editing, I.I. and P.D.; visualization, M.O.; supervision, M.O. and N.P.; project administration, A.P. and M.O.; funding acquisition, A.P. All authors have read and agreed to the published version of the manuscript.

Funding

This research was funded by the Bulgarian Ministry of Education and Science, grant number PMC № 577/17.08.2018.

Data Availability Statement

Not applicable.

Acknowledgments

Part of the laboratory equipment used in the study was purchased with the financial support of the Operational Program “Science and Education for Smart Growth” 2014–2020, co-financed by the European Union through the European Structural and Investment Funds, Grant BG05M2OP001-1.002-0012.

Conflicts of Interest

The authors declare no conflict of interest. The funders had no role in the design of the study; in the collection, analyses, or interpretation of data; in the writing of the manuscript; or in the decision to publish the results.

References

  1. Burlou-Nagy, C.; Banica, F.; Jurca, T.; Vicas, L.G.; Marian, E.; Muresan, M.E.; Bácskay, I.; Kiss, R.; Fehér, P.; Pallag, A. Echinacea purpurea (L.) Moench: Biological and pharmacological properties. A review. Plants 2022, 11, 1244. [Google Scholar] [CrossRef]
  2. Martins, R.; Barbosa, A.; Advinha, B.; Sales, H.; Pontes, R.; Nunes, J. Green Extraction Techniques of Bioactive Compounds: A State-of-the-Art Review. Processes 2023, 11, 2255. [Google Scholar] [CrossRef]
  3. Heydari, M.; Carbone, K.; Gervasi, F.; Parandi, E.; Rouhi, M.; Rostami, O.; Abedi-Firoozjah, R.; Kolahdouz-Nasiri, A.; Garavand, F.; Mohammadi, R. Cold Plasma-Assisted Extraction of Phytochemicals: A Review. Foods 2023, 12, 3181. [Google Scholar] [CrossRef] [PubMed]
  4. More, P.R.; Jambrak, A.R.; Arya, S.S. Green, environment-friendly and sustainable techniques for extraction of food bioactive compounds and waste valorization. Trends Food Sci. Technol. 2022, 128, 296–315. [Google Scholar] [CrossRef]
  5. Putra, N.R.; Yustisia, Y.; Heryanto, R.B.; Asmaliyah, A.; Miswarti, M.; Rizkiyah, D.N.; Yunus, M.A.C.; Irianto, I.; Qomariyah, L.; Rohman, G.A.N. Advancements and challenges in green extraction techniques for Indonesian natural products: A review. S. Afr. J. Chem. Eng. 2023, 46, 88–98. [Google Scholar] [CrossRef]
  6. Murray, M.T. 75—Echinacea Species (Narrow-Leafed Purple Coneflower). In Textbook of Natural Medicine, 5th ed.; Pizzorno, J., Murray, M., Eds.; Elsevier: St. Louis, MO, USA, 2020; Volume 1, pp. 566–573.e2. [Google Scholar]
  7. Bauer, R. Chemistry, analysis and immunological investigations of Echinacea phytopharmaceuticals. In Immunomodulatory Agents from Plants, 1st ed.; Wagner, H., Ed.; Birkhäuser: Basel, Switzerland, 1999; pp. 41–88. [Google Scholar]
  8. Hall, C., 3rd. Echinacea as a functional food ingredient. Adv. Food Nutr. Res. 2003, 47, 113–173. [Google Scholar]
  9. Manayi, A.; Vazirian, M.; Saeidnia, S. Echinacea purpurea: Pharmacology, phytochemistry and analysis methods. Pharmacogn. Rev. 2015, 9, 63–72. [Google Scholar]
  10. Petkova, N.; Denev, P. Chemical structure and functional properties of fructan isolated from Echinacea purpurea roots by microwave-assisted extraction. In Proceedings of the 14th International Conference on Polysaccharides-Glycoscience, Prague, Czech Republic, 7–9 November 2018. [Google Scholar]
  11. Wack, M.; Blaschek, W. Determination of the structure and degree of polymerisation of fructans from Echinacea purpurea roots. Carbohydr. Res. 2006, 341, 1147–1153. [Google Scholar] [CrossRef]
  12. Dobrange, E.; Peshev, D.; Loedolff, B.; Van den Ende, W. Fructans as immunomodulatory and antiviral agents: The case of Echinacea. Biomolecules 2019, 9, 615. [Google Scholar] [CrossRef]
  13. Petkova, N.; Ivanov, I.; Mihaylova, D.; Lante, A. Effect of pressure liquid extraction and ultrasonic irradiation frequency on inulin, phenolic content and antioxidant activity in burdock (Arctium lappa L.) roots. Acta Sci. Pol.-Hortorum Cultus. 2020, 19, 125–133. [Google Scholar] [CrossRef]
  14. Ivanov, I.; Dincheva, I.; Badjakov, I.; Petkova, N.; Denev, P.; Pavlov, A. GC-MS analysis of unpolar fraction from Ficus carica L. (fig) leaves. Int. Food Res. J. 2018, 25, 282–286. [Google Scholar]
  15. Chen, J.; Liu, H. Nutritional indices for assessing fatty acids: A mini-review. Int. J. Mol. Sci. 2020, 21, 5695. [Google Scholar] [CrossRef] [PubMed]
  16. Tumbarski, Y.; Deseva, I.; Mihaylova, D.; Stoyanova, M.; Krastev, L.; Nikolova, R.; Yanakieva, V.; Ivanov, I. Isolation, characterization and amino acid composition of a bacteriocin produced by Bacillus methylotrophicus strain BM47. Food Technol. Biotechnol. 2018, 56, 546–552. [Google Scholar] [CrossRef] [PubMed]
  17. Petkova, N.; Vrancheva, R.; Denev, P.; Ivanov, I.; Pavlov, A. HPLC-RID method for determination of inulin and fructooligosacharides. ASN 2014, 1, 99–107. [Google Scholar]
  18. Barclay, T.; Ginic-Markovic, M.; Johnston, M.; Cooper, P.; Petrovsky, N. Analysis of the hydrolysis of inulin using real-time 1H NMR spectroscopy. Carbohydr. Res. 2012, 352, 117–125. [Google Scholar] [CrossRef] [PubMed]
  19. Robertson, F.; de Monredon, D.; Dysseler, P.; Guillon, F.; Amado, R.; Thibault, J.-F. Hydration properties of dietary fibre and resistant starch: A European collaborative study. LWT Food Sci. Technol. 2000, 33, 72–79. [Google Scholar] [CrossRef]
  20. Sharma, A.; Bhushette, P.R.; Annapure, U.S. Purification and physicochemical characterization of Prunus domestica exudate gum polysaccharide. Carbohydr. Polym. Technol. Appl. 2020, 1, 100003. [Google Scholar] [CrossRef]
  21. Jinapong, N.; Suphantharika, M.; Jamnong, P. Production of instant soymilk powders by ultrafiltration, spray drying and fluidized bed agglomeration. J. Food Eng. 2008, 84, 194–205. [Google Scholar] [CrossRef]
  22. Sun, K.; Thumthanaruk, B.; Lekhavat, S.; Jumnongpon, R. Effect of spray drying conditions on physical characteristics of coconut sugar powder. Int. Food Res. J. 2016, 23, 1315–1319. [Google Scholar]
  23. Petrova, A.; Ognyanov, M.; Petkova, N.; Denev, P. Phytochemical characterization of purple coneflower roots (Echinacea purpurea (L.) Moench.) and their extracts. Molecules 2023, 28, 3956. [Google Scholar] [CrossRef]
  24. Cozzolino, R.; Malvagna, P.; Spina, E.; Giori, A.; Fuzzati, N.; Anelli, A.; Garozzo, D.; Impallomeni, G. Structural analysis of the polysaccharides from Echinacea angustifolia radix. Carbohydr. Polym. 2006, 65, 263–272. [Google Scholar] [CrossRef]
  25. Yang, G.; Li, K.; Liu, C.; Peng, P.; Bai, M.; Sun, J.; Li, Q.; Yang, Z.; Yang, Y.; Wu, H. A comparison of the immunostimulatory effects of polysaccharides from tetraploid and diploid Echinacea purpurea. BioMed. Res. Int. 2018, 2018, 8628531. [Google Scholar] [CrossRef] [PubMed]
  26. Grube, M.; Bekers, M.; Upite, D.; Kaminska, E. Infrared spectra of some fructans. Spectroscopy 2002, 16, 289–296. [Google Scholar] [CrossRef]
  27. Olennikov, D.N.; Tankhaeva, L.M.; Rokhin, A.V. Glucofructans from Saussurea lappa roots. Chem. Nat. Compd. 2011, 47, 339–342. [Google Scholar] [CrossRef]
  28. Tipson, R.S. Infrared Spectroscopy of Carbohydrates. A Review of the Literature; National Bureau of Standards: Washington, DC, USA, 1968; p. 11.
  29. Caleffi, E.R.; Krausová, G.; Hyršlová, I.; Paredes, L.L.; dos Santos, M.M.; Sassaki, G.L.; Gonçalves, R.A.; de Oliveira, A.J. Isolation and prebiotic activity of inulin-type fructan extracted from Pfaffia glomerata (Spreng) Pedersen roots. Int. J. Biol. Macromol. 2015, 80, 392–399. [Google Scholar] [CrossRef]
  30. Sun, Q.; Zhu, L.; Li, Y.; Cui, Y.; Jiang, S.; Tao, N.; Chen, H.; Zhao, Z.; Xu, J.; Dong, C. A novel inulin-type fructan from Asparagus cochinchinensis and its beneficial impact on human intestinal microbiota. Carbohydr. Polym. 2020, 247, 116761. [Google Scholar] [CrossRef]
  31. Vandyshev, V.V.; Babaeva, E.Y.; Drozdovskaya, D.D. Triacylglycerols of the lipid fraction from fruits of two Echinacea species. Pharm. Chem. J. 2009, 43, 154–156. [Google Scholar] [CrossRef]
  32. Coelho, J.; Barros, L.; Dias, M.I.; Finimundy, T.C.; Amaral, J.S.; Alves, M.J.; Calhelha, R.C.; Santos, P.F.; Ferreira, I.C.F.R. Echinacea purpurea (L.) Moench: Chemical characterization and bioactivity of its extracts and fractions. Pharmaceuticals 2020, 13, 125. [Google Scholar] [CrossRef]
  33. Tilami, S.K.; Kouřimská, L. Assessment of the nutritional quality of plant lipids using atherogenicity and thrombogenicity indices. Nutrients 2022, 14, 3795. [Google Scholar] [CrossRef]
  34. Stanisavljević, I.; Stojičević, S.; Veličković, D.; Veljković, V.; Lazić, M. Antioxidant and antimicrobial activities of Echinacea (Echinacea purpurea L.) extracts obtained by classical and ultrasound extraction. Chin. J. Chem. Eng. 2009, 17, 478–483. [Google Scholar] [CrossRef]
  35. Binns, S.E.; Purgina, B.; Bergeron, C.; Smith, M.L.; Ball, L.; Baum, B.R.; Arnason, J.T. Light-mediated antifungal activity of Echinacea extracts. Planta Med. 2000, 66, 241–244. [Google Scholar] [CrossRef] [PubMed]
  36. Sharma, M.; Vohra, S.; Arnason, J.T.; Hudson, J.B. Echinacea extracts contain significant and selective activities against human pathogenic bacteria. Pharm. Biol. 2008, 46, 111–116. [Google Scholar] [CrossRef]
  37. Bergeron, C.; Gafner, S. Quantitative analysis of the polysaccharide and glycoprotein fractions in Echinacea purpurea and Echinacea angustifolia by HPLC-ELSD for quality control of raw material. Pharm. Biol. 2007, 45, 98–105. [Google Scholar] [CrossRef]
  38. Mistríková, I.; Vaverková, Š. Echinacea—Chemical composition, immunostimulatory activities and uses. Thaiszia J. Bot. 2006, 16, 11–26. [Google Scholar]
  39. Nagoor Meeran, M.F.; Javed, H.; Sharma, C.; Goyal, S.N.; Kumar, S.; Jha, N.K.; Ojha, S. Can Echinacea be a potential candidate to target immunity, inflammation, and infection—The trinity of coronavirus disease 2019. Heliyon 2021, 7, e05990. [Google Scholar] [CrossRef]
  40. Nandi, K.; Sen, D.J.; Patra, F.; Nandy, B.; Bera, K.; Mahanti, B. Angle of repose walks on its two legs: Carr index and Hausner ratio. World J. Pharm. Pharm. Sci. 2020, 9, 1565–1579. [Google Scholar]
  41. Sherrington, L.A.; Sherrington, A. Guaifenesin. In Analytical Profiles of Drug Substances and Excipients, 1st ed.; Brittain, H.G., Ed.; Academic Press: San Diego, CA, USA, 1998; Volume 25, pp. 121–164. [Google Scholar]
  42. Saénz, C.; Tapia, S.; Chávez, J.; Robert, P. Microencapsulation by spray drying of bioactive compounds from cactus pear (Opuntia ficus-indica). Food Chem. 2009, 114, 616–622. [Google Scholar] [CrossRef]
  43. Jirayucharoensak, R.; Khuenpet, K.; Jittanit, W.; Sirisansaneeyakul, S. Physical and chemical properties of powder produced from spray drying of inulin component extracted from Jerusalem artichoke tuber powder. Dry. Technol. 2019, 37, 1215–1227. [Google Scholar] [CrossRef]
  44. El-Kholy, W.; Bisar, G.; Aamer, R. Impact of inulin extracted, purified from (chicory and globe artichoke) roots and the combination with maltodextrin as prebiotic dietary fiber on the functional properties of stirred bio-yogurt. Food Nutr. Sci. 2023, 14, 70–89. [Google Scholar] [CrossRef]
  45. Bouaziz, M.A.; Rassaoui, R.; Besbes, S. Chemical composition, functional properties, and effect of inulin from Tunisian Agave americana L. leaves on textural qualities of pectin gel. J. Chem. 2014, 2014, 758697. [Google Scholar] [CrossRef]
  46. Mudannayake, D.C.; Wimalasiri, K.M.; Silva, K.F.; Ajlouni, S. Comparison of properties of new sources of partially purified inulin to those of commercially pure chicory inulin. J. Food Sci. 2015, 80, C950–C960. [Google Scholar] [CrossRef] [PubMed]
  47. Rashid, S.; Rakha, A.; Butt, M.S.; Asghar, M. Physicochemical and techno-functional characterization of inulin extracted from chicory roots and Jerusalem artichoke tubers and exploring their ability to replace the fat in cakes. Progr. Nutr. 2018, 20, 191–202. [Google Scholar]
Figure 1. HPSEC of inulin polysaccharide isolated from echinacea root: (a) conventional extraction; (b) ultrasound-assisted extraction; (c) inulin standard with DP 25.
Chemengineering 07 00094 g001
Figure 2. FT-IR spectrum of inulin polysaccharide isolated from echinacea root: (a) conventional extraction; (b) ultrasound-assisted extraction.
Chemengineering 07 00094 g002
Figure 3. NMR spectrum of inulin polysaccharide isolated from echinacea root: (a) 13C spectrum; (b) 1H spectrum; (c) HMBC spectrum; (d) HSQC spectrum.
Chemengineering 07 00094 g003
Figure 4. Functional properties of inulin isolated from Echinacea purpurea roots.
Chemengineering 07 00094 g004
Table 1. GC-MS profile of different subsequent extracts from purple coneflower (Echinacea purpurea) roots.
CompoundRTRIHexane FractionChloroform FractionEthyl Acetate Fraction
Alcohols
1.Propylene Glycol4.321011ND 1ND0.46
2.Butane-2,3-diol4.841044NDND1.00
3.Glycerol7.221267ND0.406.00
4.Phenylethyl Alcohol6.851185NDND0.17
5.Mannitol14.881904NDND1.80
Organic acids
6.β-Hydroxybutyric acid6.081152NDND0.31
7.Benzoic acid 7.051241NDND0.22
8.Succinic acid 7.631314NDND1.97
9.Fumaric acid 8.291365NDND0.60
10.Malic acid9.221460NDND0.49
11.Pyroglutamic acid10.721588NDND1.89
Alkanes
12.n-Tetradecane8.511400NDND0.64
Sugars
13.Fructose isomer13.131853NDND4.75
14.Fructose isomer13.241859NDND6.66
Fatty alcohols
15.n-Eicosanol18.9521751.140.560.41
16.n-Heneicosanol22.9524891.952.673.86
17.n-Docosanol26.0025951.341.161.27
Fatty acids
18.Caproic acid C6:05.1610600.240.610.38
19.Enanthic acid C7:06.3111630.330.960.50
20.Caprylic acid C8:07.1812600.130.450.30
21.Pelargonic acid C9:08.1013572.573.172.85
22.Capric acid C10:09.1914550.740.400.26
23.n-Undecanoic acid C11:010.4215510.460.830.50
24.Pimelic acid 10.681584ND0.350.23
25.Lauric acid C12:011.6316590.121.510.45
26.Suberic acid11.701730ND0.921.98
27.Azelaic acid13.0817820.512.703.32
28.Myristic acid C14:013.8918710.200.320.45
29.Pentadecylic acid C15:015.4319400.800.630.55
30.Palmitelaidic acid C16:116.6920180.320.280.83
31.Palmitic acid C16:017.06204616.0124.3312.38
32.Margaric acid C17:018.6521400.770.500.65
33.Ethyl linoleate18.8021492.211.370.94
34.Linoleic acid C18:219.76220626.1121.1818.02
35.α-Linolenic acid C18:319.84221712.058.524.84
36.Elaidic acid C18:119.9322231.650.850.68
37.Stearic acid C18:020.2622394.446.163.66
38.Arachidic acid C20:022.4724383.610.521.52
39.n-Heneicosanoic acid C21:023.6025131.292.930.95
40.Behenic acid C22:026.3826240.952.101.49
41.Lignoceric acid C24:028.8628090.780.861.82
Phytosterols
42.Campesterol 34.4332661.210.930.54
43.Stigmasterol 34.7732872.021.290.85
44.β-Sitosterol 35.67333912.138.375.22
Triterpenes
45.β-Amyrin 35.8533460.67NDND
46.Lanosterol35.9133510.830.61ND
47.α-Amyrin 36.0033570.59NDND
48.Cycloartenyl acetate36.7433890.48NDND
49.Betulin37.6334200.32NDND
Total identified 98.9598.4598.65
Fatty acid 76.2882.4659.55
Saturated fatty acid (SFA) 33.4346.2928.71
Unsaturated fatty acid (UFA) 42.3432.2025.32
Triterpenes 2.890.61-
Phytosterols 15.3610.606.61
1 % of TIC; ND—not detected; RT—Retention time; RI—Retention index.
Table 2. Healthy indices of different subsequent extracts from purple coneflower (Echinacea purpurea) roots.
Nutritional IndicesHexane FractionChloroform FractionEthyl Acetate Fraction
ΣPUFA/ΣSFA1.270.700.88
Index of atherogenicity (IA)0.440.910.64
Index of thrombogenicity (IT)0.420.840.69
Hypocholesterolemic/hypercholesterolemic (HH) ratio2.341.141.72
Health-promoting index (HPI)2.501.191.73
Linoleic acid/α-linolenic acid (LA/ALA) ratio2.172.493.72
Table 3. Antimicrobial activity of different subsequent extracts from purple coneflower (Echinacea purpurea) roots.
Test MicroorganismHexane FractionChloroform FractionEthyl Acetate Fraction
Bacillus subtilis ATCC 663312 **1112
Bacillus amyloliquefaciens 4BCL-YT101010
Staphylococcus aureus ATCC 2592311916
Listeria monocytogenes ATCC 8632101010
Enterococcus faecalis ATCC 292129910
Salmonella enteritidis1099
Klebsiella sp.---
Escherichia coli ATCC 25922111015
Proteus vulgaris ATCC 6380---
Pseudomonas aeruginosa ATCC 9027121017
Candida albicans NBIMCC 748 *88
Saccharomyces cerevisiae999
Aspergillus niger ATCC 1015---
Aspergillus flavus---
Penicillium sp.888
Rhizopus sp.---
Fusarium moniliforme ATCC 38932---
Mucor sp.---
- no inhibition; * resistant with inhibition zones up to 12 mm or completely missing; ** moderately sensitive with inhibition zones from 12–18 mm; dwell = 6 mm.
Table 4. Physicochemical characteristics of inulin-type fructan from purple coneflower (Echinacea purpurea) roots.
CharacteristicsClassical ExtractionUltrasound-Assisted ExtractionReferences
Yield, %18.7 ± 1.215.4 ± 2.15.9–12 [10]
8.87 [23]
Purity, %57.7 ± 1.572.4 ± 0.582.2 ± 2.5 [10]
Melting point, °C188–190203–205186.5 [10]
Molecular weight
Mw, Da
Mn, Da
389040504500 [24]
4378 [10]
5000 [25]
374038954226 [10]
Polydispersity index1.041.041.04 [10]
Degree of polymerization242524–25 [23]
25–29 (avg DP 27) [10]
33–55 [11]
Degree of polymerization (NMR)1316-
L73.07 ± 1.2879.80 ± 5.94-
a27.31 ± 1.8429.32 ± 1.70-
b7.59 ± 1.548.82 ± 0.50-
C26.18 ± 2.3027.95 ± 1.92-
ΔE34.9031.49-
16.1717.74-
Angle of repose (°)23.2223.03-
Wettability, min2.032.46-
True density (g/mL)0.631.25-
Bulk density (g/mL)0.370.27-
Tap density (g/mL)0.550.45-
Carr’s index33 41-
Hausner ratio1.501.68-
FlowabilityFairBad-
CohesivenessHighHigh-
- absent data in the literature.
Disclaimer/Publisher’s Note: The statements, opinions and data contained in all publications are solely those of the individual author(s) and contributor(s) and not of MDPI and/or the editor(s). MDPI and/or the editor(s) disclaim responsibility for any injury to people or property resulting from any ideas, methods, instructions or products referred to in the content.

