Article

CFD-Simulation of Isobutane Dehydrogenation for a Fluidized Bed Reactor

by
Sergei A. Solovev
1,*,
Olga V. Soloveva
2,
Giyjaz E. Bekmukhamedov
3,
Svetlana R. Egorova
3 and
Alexander A. Lamberov
3
1
Institute of Digital Technologies and Economics, Kazan State Power Engineering University, 420066 Kazan, Russia
2
Institute of Heat Power Engineering, Kazan State Power Engineering University, 420066 Kazan, Russia
3
Alexander Butlerov Institute of Chemistry, Kazan Federal University, 420008 Kazan, Russia
*
Author to whom correspondence should be addressed.
ChemEngineering 2022, 6(6), 98; https://doi.org/10.3390/chemengineering6060098
Submission received: 26 September 2022 / Revised: 29 November 2022 / Accepted: 6 December 2022 / Published: 19 December 2022
(This article belongs to the Special Issue Feature Papers in Chemical Engineering)

Abstract

:
In the present study, a mathematical model of the isobutane dehydrogenation process for a laboratory reactor with a diameter of 2.8 cm and a height of 70 cm was created using CFD methods. A two-fluid model was selected as a model for the fluidization simulation, when the gas and solid granular phases were considered as continuous. The model of chemical kinetics considers three reactions that make the main contribution to the products mass fraction at the reactor outlet: the reaction of catalytic dehydrogenation of isobutane to isobutylene, the reaction of thermal cracking of isobutylene with the formation of methane and propylene, and the reaction of catalytic hydrogenation of propylene. The model was verified in a series of experimental studies. Experimental studies and numerical simulations were carried out for the process parameters: gas velocity 0.008, 0.012 and 0.016 m/s, gas temperature 550, 575, 600 and 625 °C, and catalyst mass 75, 100 and 125 g. The optimal process temperature was 575 °C, where the yield of isobutylene averaged 47.6% of the mass. As the temperature decreased, the yield of isobutylene decreased to 40.1% by weight on average. With an increase in temperature, the yield of isobutylene increased to 52.8% by weight on average, and the total yield of products of side reactions increased to 20% by weight on average. Changes in the gas velocity and catalyst mass had an insignificant effect on the values of the yield of isobutylene, but significantly affected the values of the yield of the by-products.

1. Introduction

Fluidized bed reactors are used in many practical applications. They are used in oil refining (catalytic cracking) [1], coal gasification [2], and petrochemistry [3]. First introduced over 70 years ago, fluid catalytic cracking (FCC) technology still plays an important role in converting oil into valuable fuels. More than 30% of all gasoline produced in the world is produced in the FCC process. In addition to fuels, FCC is used for the production of certain chemical products (ethylene, propylene, butenes, etc.) [4]. In addition to oil refining, fluidized bed reactors have found applications in the combustion of coal and biomass. In such reactors there is a two-phase mixture of fine solids and gases, this mixture is boiled by means of ascending or descending flows. Fluidized bed bioreactors are widely used in biomass gasification [5].
There are two models to describe the hydrodynamics of gas and solid particles in a fluidized bed: the Euler–Euler model (CFD or TFM) and the Euler–Lagrange model (CFD-DEM). In the Euler–Euler model, both solid and gas phases are considered as interpenetrating media. The interaction between particles in this case is studied on the basis of the kinetic theory of granular flow. In the Euler–Lagrange model, the behavior of solid particles is studied in terms of Newton’s laws of motion, while the gas is considered to be a continuous medium [6]. The TFM and CFD-DEM have been extensively used to simulate particulate reacting flow in fluidized bed reactors [7].
Due to the advantage of the high efficiency, the TFM has been broadly applied for simulating thermal conversion of solid fuels in fluidized bed reactors. For example, Wu et al. [8] analyzed the factors influencing the production of synthesis gas in a fluidized bed gasifier. The authors applied a two-fluid Euler–Euler model to create a three-dimensional model of the gasifier. The results showed that the formation of synthesis gas was greatly influenced by the initial temperature, namely, with an increase in the initial temperature, the content of carbon monoxide and hydrogen in the synthesis gas increased. Cardoso et al. [9] investigated fluid dynamics and heat transfer in a fluidized bed biomass gasifier using a 2D Euler–Euler model. They concluded that the particle size of the biomass significantly affected the heat transfer and hydrodynamics in the fluidized bed: smaller particles showed better mixing and heat transfer. Ding et al. [10] simulated the pyrolysis of combustible solid waste in a fluidized bed reactor using the Euler–Euler model. The authors studied the effect of pyrolysis temperature on the product yield and found that with an increase in pyrolysis temperature, the yield of the products first increased, but after 773 K it decreased. At the same time, the gas yield showed an opposite trend with an increase in the pyrolysis temperature. This behavior can be explained by the activation of secondary cracking at temperatures above 773 K. Wu et al. [11] conducted numerical studies of hydrodynamics, temperature and emissions of harmful substances during oxy-fueled combustion in a circulating fluidized bed combustion chamber. The studies were carried out using the Euler–Euler approach at high-oxygen concentrations. The authors concluded that an increase in the oxygen concentration led to a change in the fluidization regime to turbulent, while the overall temperature in the combustion chamber increased. In addition, increasing the oxygen concentration at the chamber inlet led to a decrease in carbon monoxide emissions with a simultaneous increase in nitrogen and sulfur oxide emissions.
In addition to the TFM model, the CFD-DEM model provides an alternative to study gas–solid flow in fluidized beds. Specifically, in this model, the trajectory of each particle is tracked and the collisions between particles are resolved. Wang et al. [12] first developed a high-fidelity CFD-DEM model considering the gas turbulence using a large-eddy simulation (LES) turbulence model, achieving excellent accuracy, good stability, and high efficiency in a parallelization strategy. The CFD-DEM model, integrating heat and mass transfer sub-models, was further demonstrated to be a good choice for modelling biomass gasification in fluidized beds [13]. However, the disadvantage of using the CFD-DEM model is the inaccessibility of computing resources when calculating chemical engineering processes in large-scale fluidized rectors.
Therefore, the CFD-DEM model has been extensively applied to simulate different processes in various lab-scale fluidized beds. The influence of the particle diameter on the bed height, the rate of change in the bed mass and the type of bubbles was studied in [14]. Yue Y. et al. [15] investigated the effect of particle density on spout deflection in a fluidized bed using the same combined numerical method. Physical parameters under which non-alternating and alternating spout deflection occur were considered. The behavior of the solid phase was also calculated using DEM in [16]. The authors showed that an increase in velocity led to a double bed recirculation. Particles rushed to the central part of the flow and mixed better in the vertical direction (as opposed to the transverse one).
CFD-DEM modeling has also been used to simulate the process of fast biomass pyrolysis [17]. Biomass gasification in a fluidized bed using the multiphase particle-in-cell (MP-PIC) model and the CFD-DEM was investigated by Li and Eri [18]. They considered different chemical reactions in their work: drying, pyrolysis, and homogeneous/heterogeneous reactions. The experimental data obtained in [19] were used when simulating the pyrolysis process in a full-scale industrial pyrolyser.
The authors of [20] carried out a numerical study on the biomass gasification process in a fluidized bed reactor. The authors applied a combined approach using computational fluid dynamics and the discrete element method (CFD-DEM). The influence of such parameters as the size of biomass particles, the initial temperature of the bed and the gas flow rate on the productivity of the reactor was studied. The results of the study showed that the particle size did not significantly affect the production of hydrogen and methane, or the formation of carbon oxides. An increase in the initial bed temperature led to a decrease in the outlet gas temperature. Increasing the gas flow rate at the inlet led to better mixing of the binary mixture. Shao et al. [21] conducted a numerical study to predict the minimum fluidization rate of particles at high temperatures and pressures, as well as at various particle diameters. For modeling, the authors applied the Euler–Lagrange approach. The research results showed that with increasing pressure and temperature, the minimum fluidization rate decreased. The increase in particle size resulted in an increase in the minimum fluidization rate. Zhang et al. [22] investigated the process of coal enrichment in gas–solid fluidized beds. To model this process, the authors used the Euler–Lagrange model. They studied the influence of the size of coal particles and the height of the fluidized bed on the intensification of the coal enrichment process. The results of numerical studies showed that the use of large particles together with a small initial bed height led to a significant improvement in the coal enrichment process. Kong et al. [23] conducted heat transfer studies during biomass gasification in a bubbling fluidized bed reactor. The studies were carried out using computational fluid dynamics and the discrete particle method (CFD-DEM). The authors found that convection was the dominant heat transfer mechanism, followed by radiation and heat released during chemical reactions. At the same time, an increase in the operating temperature improved chemical reactions and, in general, contributed to an increase in heat transfer by all of the above mechanisms.
Fluidized bed reactors are widely used for the dehydrogenation of light alkanes, for example, isobutane to isobutylene [24]. The dehydrogenation system consists of a fluidized bed reactor and a regenerator. Various types of catalysts are used to ensure a high reaction rate and high selectivity: platinum/tin (Pt/Sn) with promoters, chromium oxides on zirconium or aluminum oxide [25], as well as gallium (Ga) supported on the porous metal oxide, etc. [26,27].
Ma et al. [28] conducted experimental studies to optimize the PtSnK/Al2O3 catalyst used in the isobutane dehydrogenation reaction. The authors studied the effect of such parameters as the mass ratio of platinum (Pt) to tin (Sn), the calcination temperature, the mass fraction of potassium K, and the concentration of H2PtCl6 in impregnation solution on the characteristics of isobutane dehydrogenation. The research results showed that the mass ratio of platinum to tin had the greatest influence on the dehydrogenation process, and the concentration of H2PtCl6 had the least influence. Due to the achievement of the optimal value of the mass ratio of platinum to tin (1:1) and with a potassium content of 0.8%, it was possible to achieve an average isobutane conversion of 46.59%. Azimi and Kalbasi [29] performed a numerical simulation of isobutane dehydrogenation in a fluidized bubbling bed reactor. The authors investigated the effect of the operating conditions on energy consumption in the reactor. The research results revealed the dependence of energy consumption on the degree of isobutane conversion. To obtain the degree of conversion of isobutane, the authors used a three-phase model. The authors found that energy consumption had an inverse relationship with isobutane conversion. The operating conditions of the reactor affected the conversion of isobutane by shifting the equilibrium position of the reaction or by changing the average residence time of the gas in the bed. The factor that had the greatest impact on the energy consumption in the reactor was the volumetric flow rate of the feed stream. Vernikovskaya et al. [30] a conducted numerical and experimental study on the performance of a fluidized bed reactor for isobutane dehydrogenation. The authors added propane to the feedstock in an amount of from 0 to 60 wt.% and investigated the performance of the fluidized bed reactor with the Cr2O3/Al2O3 catalyst. The research results showed that when propane was added in an amount from 0 to 60 wt.%, the isobutylene selectivity increased from 86% to 89%. Matveyeva et al. [31] investigated the performance of a fluidized bed reactor with a Ga2O3/Al2O3 catalyst at various gallium contents. The results of experimental studies showed that an increase in the content of gallium from 3 to 9% led to an increase in the yield of isobutylene from 27 to 32 wt.%, while the conversion of isobutane increased from 42 to 55 wt.%. The catalyst consistently showed high activity and selectivity over 60 cycles.
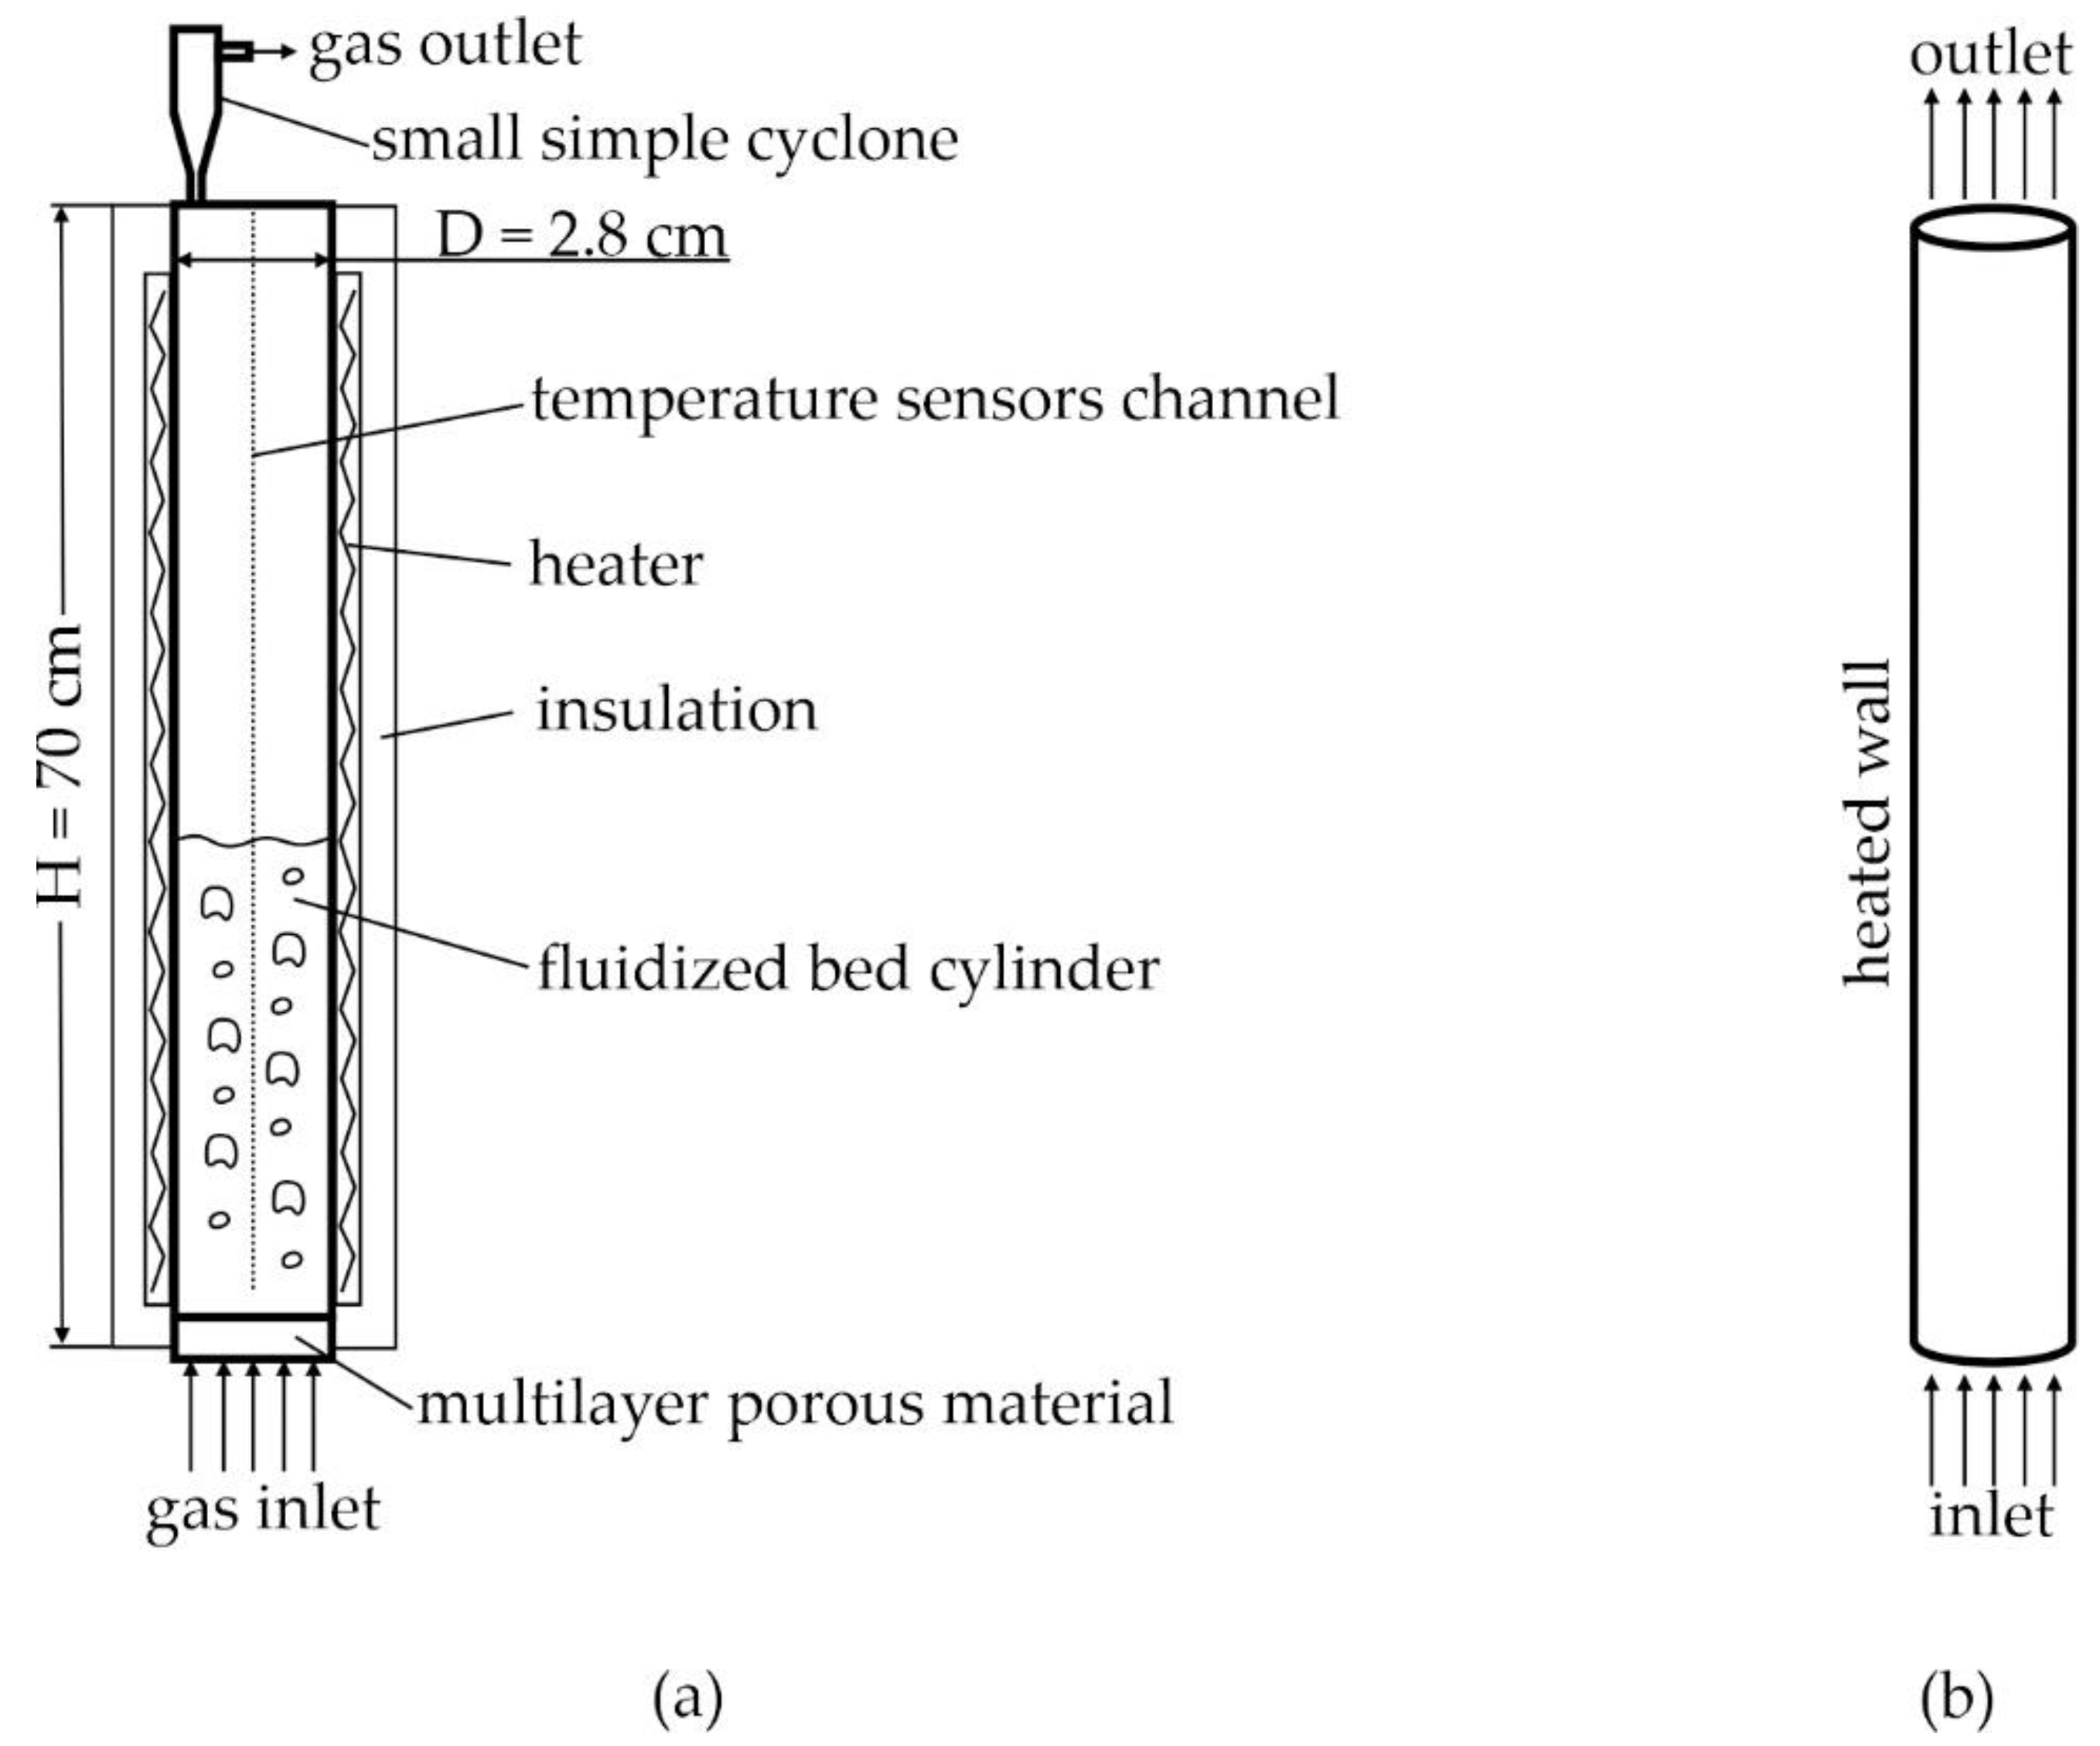
This paper presents the results of the experimental study and numerical simulation of the dehydrogenation of isobutane to isobutylene in a laboratory reactor with a fluidized bed with a chromia–alumina catalyst. The following ranges of change in the main process parameters were considered: gas velocity 0.008–0.016 m/s, gas temperature 550–625 °C, and catalyst mass 75–125 g. Based on the experiments, an original mathematical model was built for numerical simulation of the process using the TFM approach, taking into account the main dehydrogenation reaction isobutane to isobutylene and two side reactions: thermal cracking of isobutane with the formation of methane and propylene, and the propylene hydrogenation reaction to propane. The developed and verified model will make it possible to simulate the process for various gas and catalyst parameters both in laboratory studies and in industrial devices.

2. Materials and Methods

2.1. Experiment Setup

In the present study, we used a laboratory reactor, which was a vertical steel tube 70 cm in height and 2.8 cm in diameter (Figure 1a).
Heated isobutane was fed at the bottom of the reactor through a multilayer porous material that provided uniform flow distribution over the reactor cross section, as well as prevented solid particles from entering the gas supply system. During the dehydrogenation process, a granular chromia–alumina catalyst was placed in the reactor [32,33,34,35,36,37].
A system of electric heaters was located around the reactor. In the inner part of the reactor there was a channel 65 cm in height and 0.6 cm in diameter. The channel was attached to the reactor walls with three horizontal spacers and designed to accommodate a temperature sensor. In the upper part of the tube there was a hole for the gas outlet with a diameter of 0.3 cm. A simple cyclone was located at the outlet of the reactor to return the catalyst particles to the reactor. The main part of the reactor was covered with a heat-insulating material. The automatic control system maintained the set temperature inside the reactor.
Experimental studies were carried out for different values of the mass of the catalyst in the reactor, gas flow rate and temperature of the supplied gas. The parameters of the experimental conditions are presented in Table 1.

2.2. Numerical Simulation Model

2.2.1. Geometry Model, Boundary and Initial Conditions

To carry out a numerical simulation, we first defined a geometric model. Since the laboratory reactor had a simple shape, we chose a simple cylinder as the computational domain. The scheme is shown in Figure 1b.
Taking into account gravity, we chose the lower base and the upper base of the cylinder. In the lower base of the cylinder, we determined the conditions for supplying the gas velocity value; for a granular solid phase, the surface was impermeable. In the upper base of the cylinder, we defined the simple outlet condition. Since a real reactor has heaters on the walls to maintain a defined temperature, in the computational domain we determined the isothermal condition.
As the initial conditions for the numerical simulation, we defined a fixed bed of catalyst particles of a defined volume fraction in the lower zone of the cylinder.
After beginning the calculation, when gas is supplied from below, the bed of particles will begin to expand. After some time, the expansion of the bed will stop, which we considered the exit to the fluidization regime at a defined gas velocity. Next, we observed the parameters of the fluidized bed for some time and averaged the results.

2.2.2. Fluidized Bed Model

In the numerical simulation of the fluidized bed, a two-fluid continuous Eulerian–Eulerian multiphase model was used, supplemented by the kinetic theory of gases to take into account the collisions of solid particles. It was assumed that all considered phases in total occupied the entire volume of the computational domain. We denoted the volume fraction of the i-th phase by α i , the sum of the volume fractions of all phases was equal to 1.
For each of the phases, the equations for conservation of mass, momentum and energy are satisfied. In the study of this problem, the following equations were solved.
The mass conservation equation for the gas phase:
α g ρ g t + ( α g ρ g v g ) = 0 ,
where ρ g is the real density of the gas phase, and v g is the velocity of the gas phase.
The mass conservation equation for the solid phase:
α s ρ s t + ( α s ρ s v s ) = 0 ,
where ρ s is the real density of the solid phase, and v s is the velocity of the solid phase.
The momentum conservation equation for the gas phase:
α g ρ g v g t + ( α g ρ g v g v g ) = α g p + τ = g + α g ρ g g + i = 1 N K g s ( v g v s ) ,
where p is the pressure, τ = g is the stress tensor in the gas phase, and K g s is the coefficient of interaction between the gas and discrete solid phases. In Equation (3), the stress tensor:
τ = g = α g μ g ( v g + v g T ) + α g 2 3 μ g v g I = ,
where μ g is the shear viscosity, and I = is the unit tensor.
The momentum conservation equation for the solid phase:
α s ρ s v s t + ( α s ρ s v s v s ) = α s p p s + τ = s + α s ρ s g + K s g ( v s v g ) ,
where p s is the pressure of the solid phase granules, τ = s is the stress tensor in the solid phase, and K s g is the coefficient of interaction between the discrete solid phases and gas. For the interaction of the gas and solid phases, we have K g s = K s g . In Equation (5), the stress tensor:
τ = s = α s μ s ( v s + v s T ) + α s ( λ s 2 3 μ s ) v s I = ,
where μ s ,   λ s are shear and bulk viscosity of the solid phase.
The energy conservation equation for the gas phase:
α g ρ g h g t + ( α g ρ g v g h g ) = α g p t + τ = g : v g + h g s A ( T g T s ) ,
where h g is the gas enthalpy, h g s is the heat transfer coefficient between the gas and solid phases, and A is the heat exchange surface area.
The energy conservation equation for the solid phase:
α s ρ s h s t + ( α s ρ s v s h s ) = α s p t + τ = s : v s + h s g A ( T s T g ) ,
where h s is the solid phase enthalpy, and h s g is the heat transfer coefficient between the solid and gas phases.
The conservation of the solid particle phase fluctuating energy [38]:
3 2 [ t ( α s ρ s Θ s ) + ( α s ρ s v s Θ s ) ] = ( p s I = + τ = s ) : v s + ( k Θ s Θ s ) γ Θ s + ϕ g s ,
where k Θ s is the granule energy diffusion coefficient, Θ s is the solid granule temperature, γ Θ s is the particle collisions energy dissipation, and ϕ g s is the energy exchange between the solid and gas phases.
The i-th component of the gas mixture conservation equation:
ρ g Y i t + ( ρ g v g Y i ) = J i + R i ,
where Y i is the i-th component of the gas mixture mass fraction, R i is the formation of the i-th component of the mixture, arising from chemical reactions, and J i is the diffusion flux of the i-th component arising from concentration and temperature gradients.
For turbulent flux, the diffusion flow is calculated as follows:
J i = ( ρ D m , i + μ t Sc t ) Y i D T , i T T ,
where Sc t is the turbulent Schmidt number, μ t is the turbulent viscosity, D m , i and D T , i are mass and thermal diffusion coefficients.
Further, we considered the constitutional relations for the closure of the equations system presented above. In the case of the interaction of two phases of the gaseous–solid granular type, the model [39] was used:
K s g = { 3 4 C D α s α g ρ g | v s v g | d s α g 2 / 65 , α g > 0.8 , 150 α s ( 1 α g ) μ g α g μ s 2 + 1.75 ρ g α s | v s v g | d s ,   α g 0.8 ,
where the drag coefficient:
C D = 24 α g Re s [ 1 + 0.15 ( α g Re s ) 0.687 ] ,
Reynolds number:
Re s = α g ρ g d s | v s v g | μ g .
The application of the interphase interaction model [39] has shown good agreement with the experimental and industrial results from our previous studies [40,41].
For the solid phase, the values of shear and bulk viscosity, granule pressure, diffusion and energy dissipation were determined using standard models [39,42,43].
In the energy conservation equation, the heat transfer coefficient between the phases is written as:
h s   g = κ g Nu s d s .
In Equation (15) κ g is the thermal conductivity coefficient, in the case of the presence of a granulated solid phase, the following relation was used to calculate the Nusselt number during heat exchange between the solid the gaseous phases [44]:
Nu s = ( 7 10 α g + 5 α g 2 ) ( 1 + 0.7 Re s 1 5 Pr 1 3 ) + ( 1.33 2.4 α g + 1.2 α g 2 ) Re s 7 10 Pr 1 3 ,
Prandtl number:
Pr = C p g μ g κ g .
Considered in the reactor, the fluidized bed components movement is turbulent. In the solution model used for calculations, a dispersed   k ε turbulence model was used, in which the motions of the “secondary” solid granular phases are generated against the turbulent motion of the “primary” gas phase.
The ANSYS Fluent 19.2 software (www.ansys.com (accessed on 1 December 2022)) was used to solve the written system of equations. Many of the component property parameters were taken from the database of the software. Physicochemical properties of the components were estimated according to the polynomial dependence on temperature.

2.2.3. Solid Granular Phase

In calculations of a fluidized bed, an important factor is the correct choice of the effective diameter for a polydisperse solid phase. In this study, we restricted ourselves to the choice of one average diameter.
To model the experiments we used the average Sauter mean diameter D 32 , determined using the density distribution function f ( D ) of particle diameters, as follows:
D 32 = 0 f ( D ) D 3 d D 0 f ( D ) D 2 d D .
The distribution density function satisfies the condition:
0 f ( D ) d D = 1 .
For our experimental studies, the sizes of catalyst particles varied from 20 to 250 µm. Sauter mean diameter value was D 32 = 84 µm. Additionally, in the continuous model of the solid phase, the density was 2400 kg/m3, the thermal conductivity was 37 W/m K, and the heat capacity was 1047 J/kg K.

2.2.4. Chemical Reactions Model

In addition to the main reaction in the process of isobutane dehydrogenation, undesirable side reactions of cracking, isomerization, alkylation, aromatization, followed by coke formation, also take place. The process temperature is of great importance. An increase in temperature above the optimum shifts the equilibrium to the right, but an excessive increase can lead to the cracking of isobutane and isobutylene. For the process of dehydrogenation of isobutane on a chromia–alumina catalyst at temperatures of 550–580 °C, the yield of isobutylene is 35–50%, cracking products 3–7%, isomerization 0.2–0.5%. The amount of coke is 0.2–2.0%. In this study, from a large number of reactions, the reactions of isobutane dehydrogenation, thermal cracking, and propylene hydrogenation were selected. The contribution of products of side reactions to the evaluation of the conversion and selectivity of the process is negligible. The reactions chosen for numerical simulation have the form:
i - C 4 H 10 i - C 4 H 8 + H 2 ,
i - C 4 H 10 CH 4 + C 3 H 6 ,
C 3 H 6 + H 2 C 3 H 8 .
In Equation (10), the value R i determines the formation rate of the i-th component of the mixture from chemical reactions, which can be written as:
R i = M w , i r = 1 N R R ˙ i , r ,
where M w , i is the molecular weight of the i-th component of the mixture, and N R is the number of reactions involving the i-th component of the mixture.
R ˙ i , r = k f , r A c a t j = 1 N [ C j , r ] η i , r ,
where A c a t is the coefficient that takes into account the gas mixture component volume involved in the reaction, C j , r is the concentration of the j-th component of the mixture, η i , r is the exponent for the reactant j-th component in the reaction, and k f , r is the reaction rate constant. The parameter A c a t determines the volume of gas for possible contact with the catalyst for components in the reactions of isobutane dehydrogenation and propylene hydrogenation. For thermal cracking, the reaction can take place in the absence of a catalyst and the parameter A c a t determines the volume of gas not occupied by the catalyst.
The reaction rate constant for equations is determined by the Arrhenius expression:
k f , r = A r e E r R T ,
where A r is the pre-exponential factor, and E r is the activation energy.
From the results of experimental studies, parameters A r and E r were determined for each reaction. Table 2 shows the obtained values for our model. The values were chosen after the analysis of experimental data and a series of computational simulations.

2.2.5. Mesh and Tine Step

For numerical simulation of the problem using the methods of computational fluid dynamics, we needed to cover the computational domain with a mesh. Since the geometric model of the computational domain has small dimensions and simple shapes, we used a uniform mesh with a cell size Δ x = 0.001 m (Figure 2a).
.
To determine the optimal value of the mesh cell size, we performed calculations for Δ x = 0.005 m, 0.0025 m, 0.001 m, and 0.0005 m. We determined the optimal value of the mesh size by the values of the average volume fraction of the catalyst in the reactor. Figure 2b shows the results of verification calculations for a gas velocity of 0.016 m/s and a catalyst mass of 100 g. For the calculation, we chose Δ x = 0.001 m, since with a further decrease in the mesh size, the values of the average volume fraction of particles almost do not change.
To choose the time step Δ t , we estimate the Courant number:
N C = | v | Δ t Δ x .
The authors of [45] proposed a maximum Courant number of 0.3. For monodisperse liquid-fluidized suspensions, the authors of [46] suggested setting a limit on the Courant number between 0.03 and 0.3. In our studies, the gas velocity varied from 0.008 to 0.016 m/s. For such velocity values and Δ x = 0.001 m, the time step should be in the range from 0.00375 to 0.01875 s. In our model for calculations, we chose Δ t = 0.005 s.
In all the calculations performed, sufficient convergence was observed in all the parameters for the selected values of Δ x and Δ t .
In experimental studies, one reactor operation cycle for each case was 15 min. During numerical simulation, we continuously monitored the output of all components of the gas mixture in the outlet section. Then, the beginning of the stationary mode of operation of the reactor was determined, when the value of the mass fraction of each gas component varied within no more than 1–2%. After reaching a steady state, we took the output values for the next 100 s and averaged them to obtain the final value. The time to reach the steady state mainly depends on the gas velocity and in our calculations was 380–400 s for a gas velocity of 0.008 m/s and 200–220 s for a gas velocity of 0.016 m/s. Thus, in the calculations, the physical time of the simulations was from 5 to 9 min.

3. Results and Discussion

We carried out numerical simulations for all values of the determining parameters in experimental studies: the gas supply rate to the reactor were 0.008 m/s, 0.012 m/s and 0.016 m/s; the mass of the catalyst in the reactor were 75 g, 100 g and 125 g; temperature in the reactor were 550 °C, 575 °C, 600 °C and 625 °C.
Figure 3, Figure 4 and 
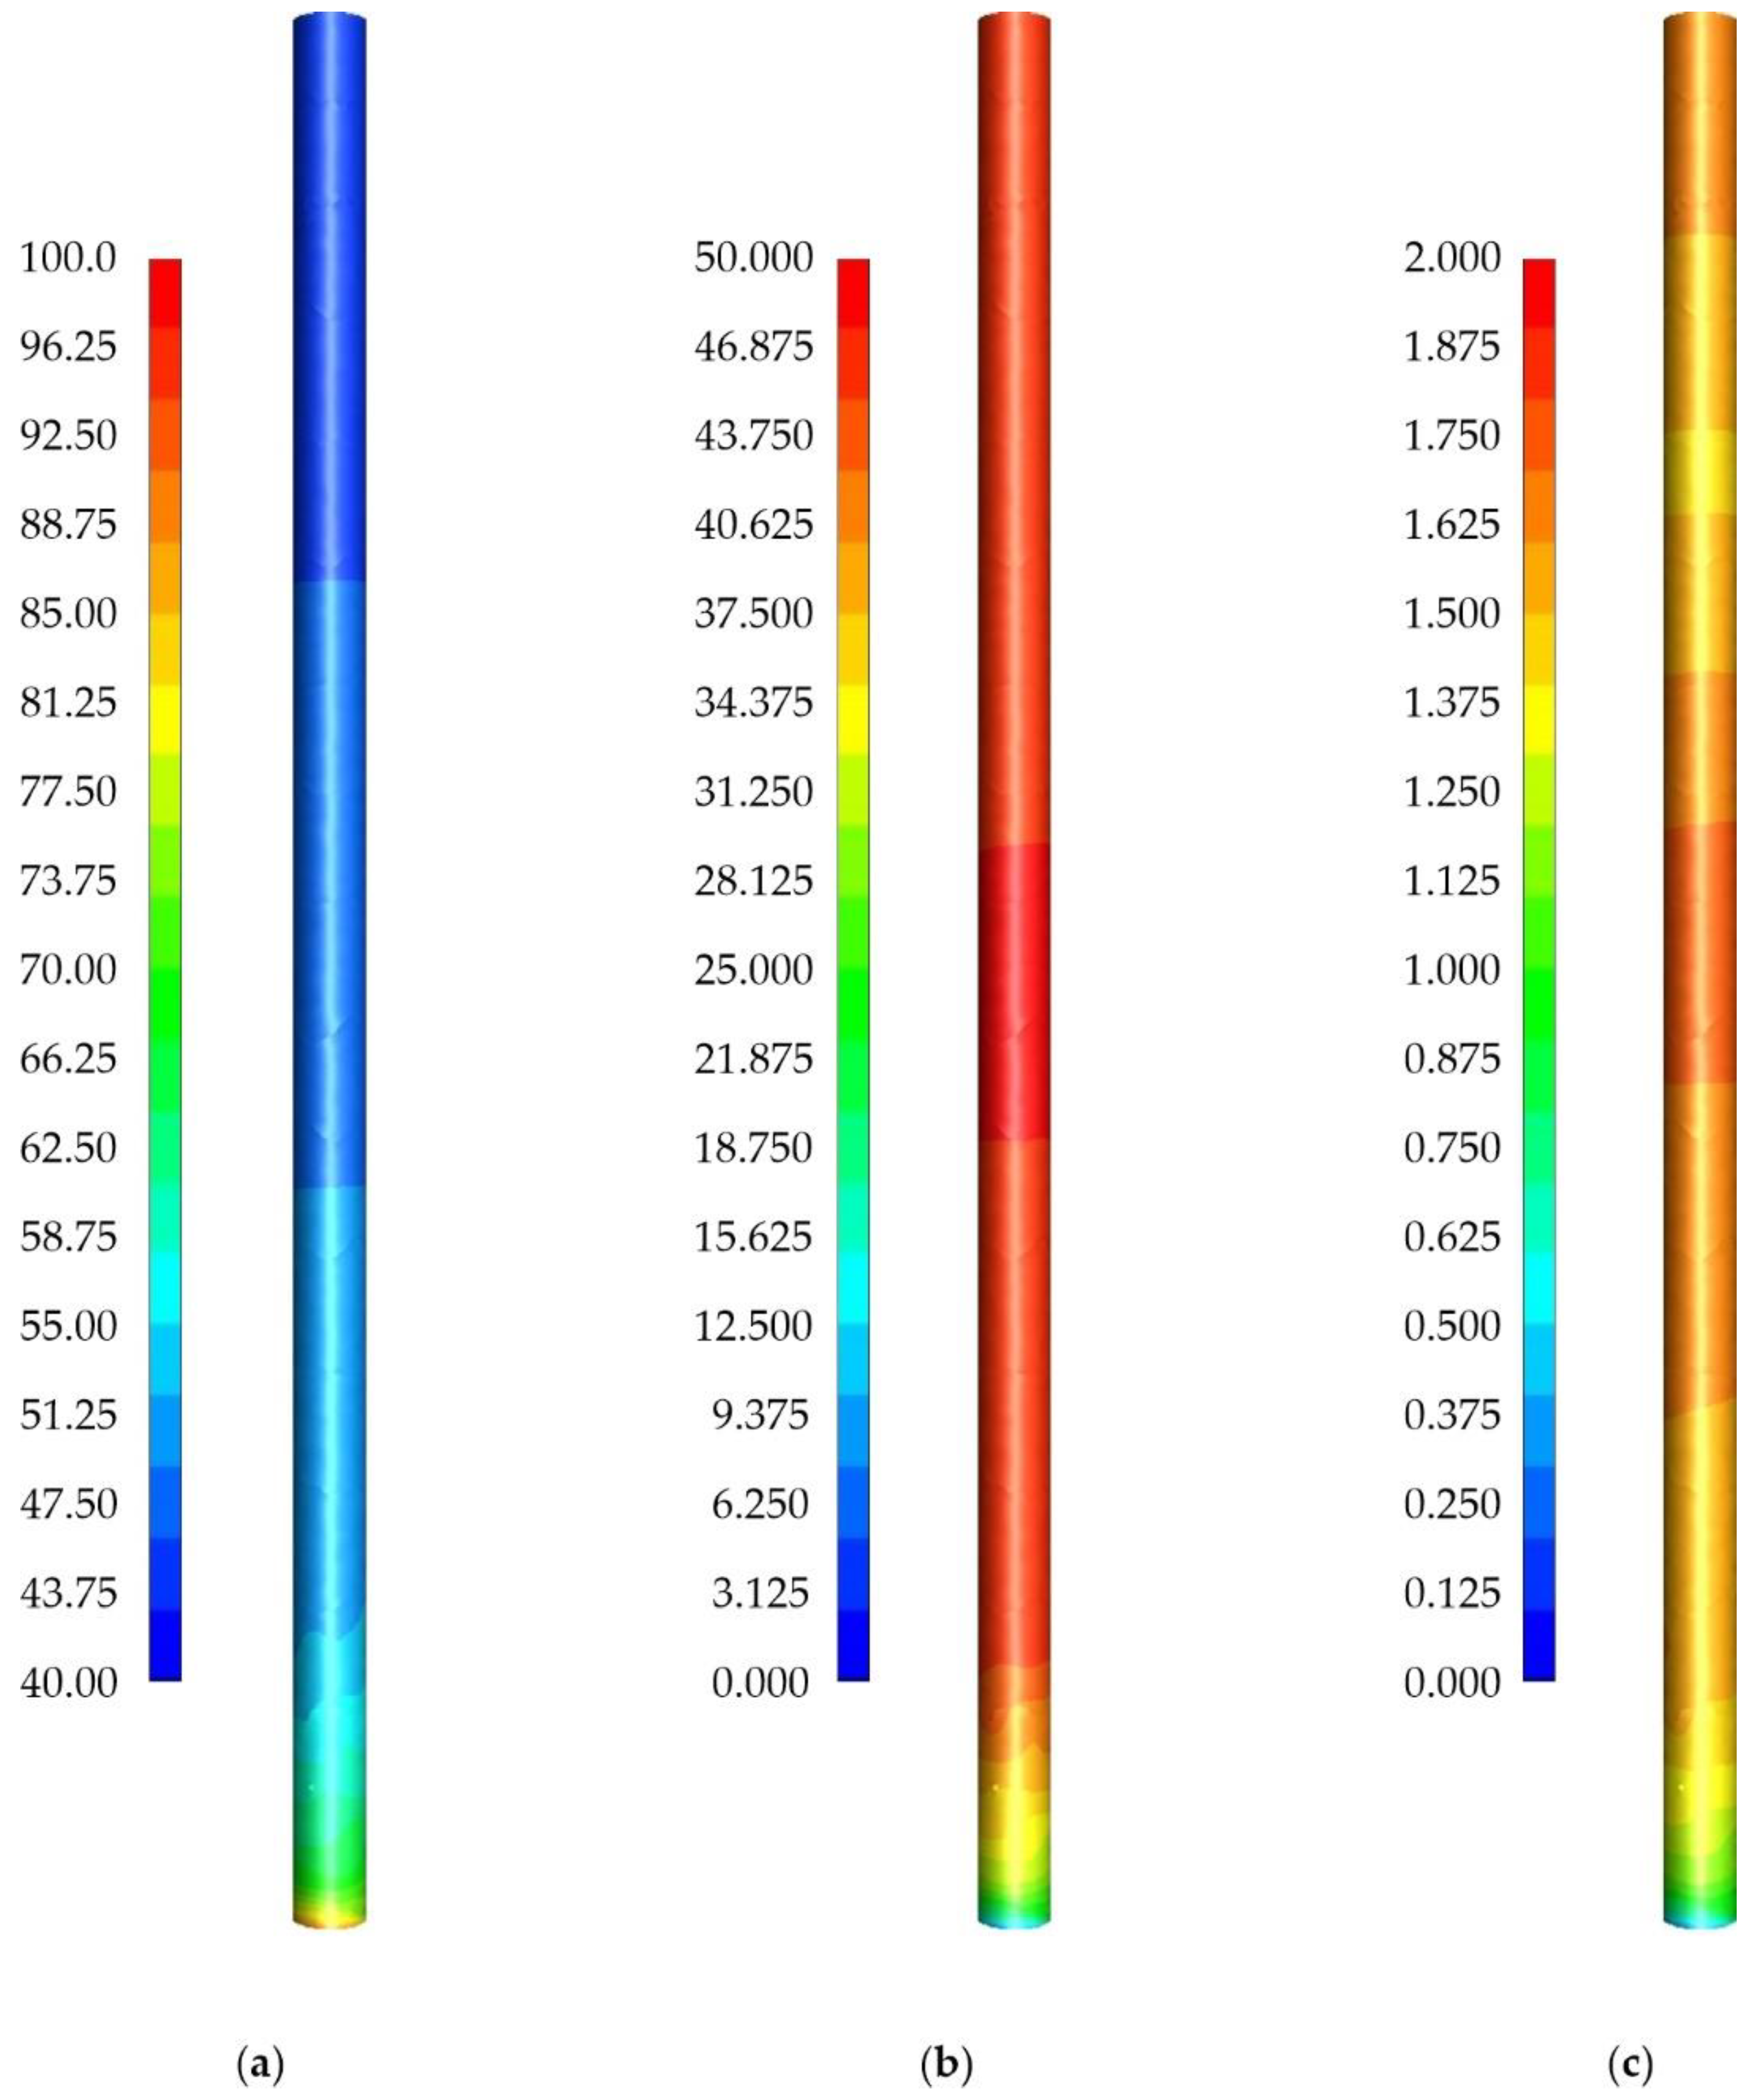
Figure 5 present the instantaneous concentration fields of the catalyst and reaction products for the case of a catalyst mass of 100 g, a gas velocity of 0.016 m/s, and a temperature of 575 °C. This temperature is considered optimal for carrying out the isobutane dehydrogenation reaction in a fluidized bed reactor. The maximum velocity achieved in a laboratory reactor was 0.016 m/s. In this case, in an industrial large-scale reactor, the gas velocity is usually about 0.3 m/s. Despite the impossibility of achieving a gas velocity close to the industrial regime, weak fluidization makes it possible to better evaluate the properties of the catalyst without the influence of fast fluidization hydrodynamics [40,41].
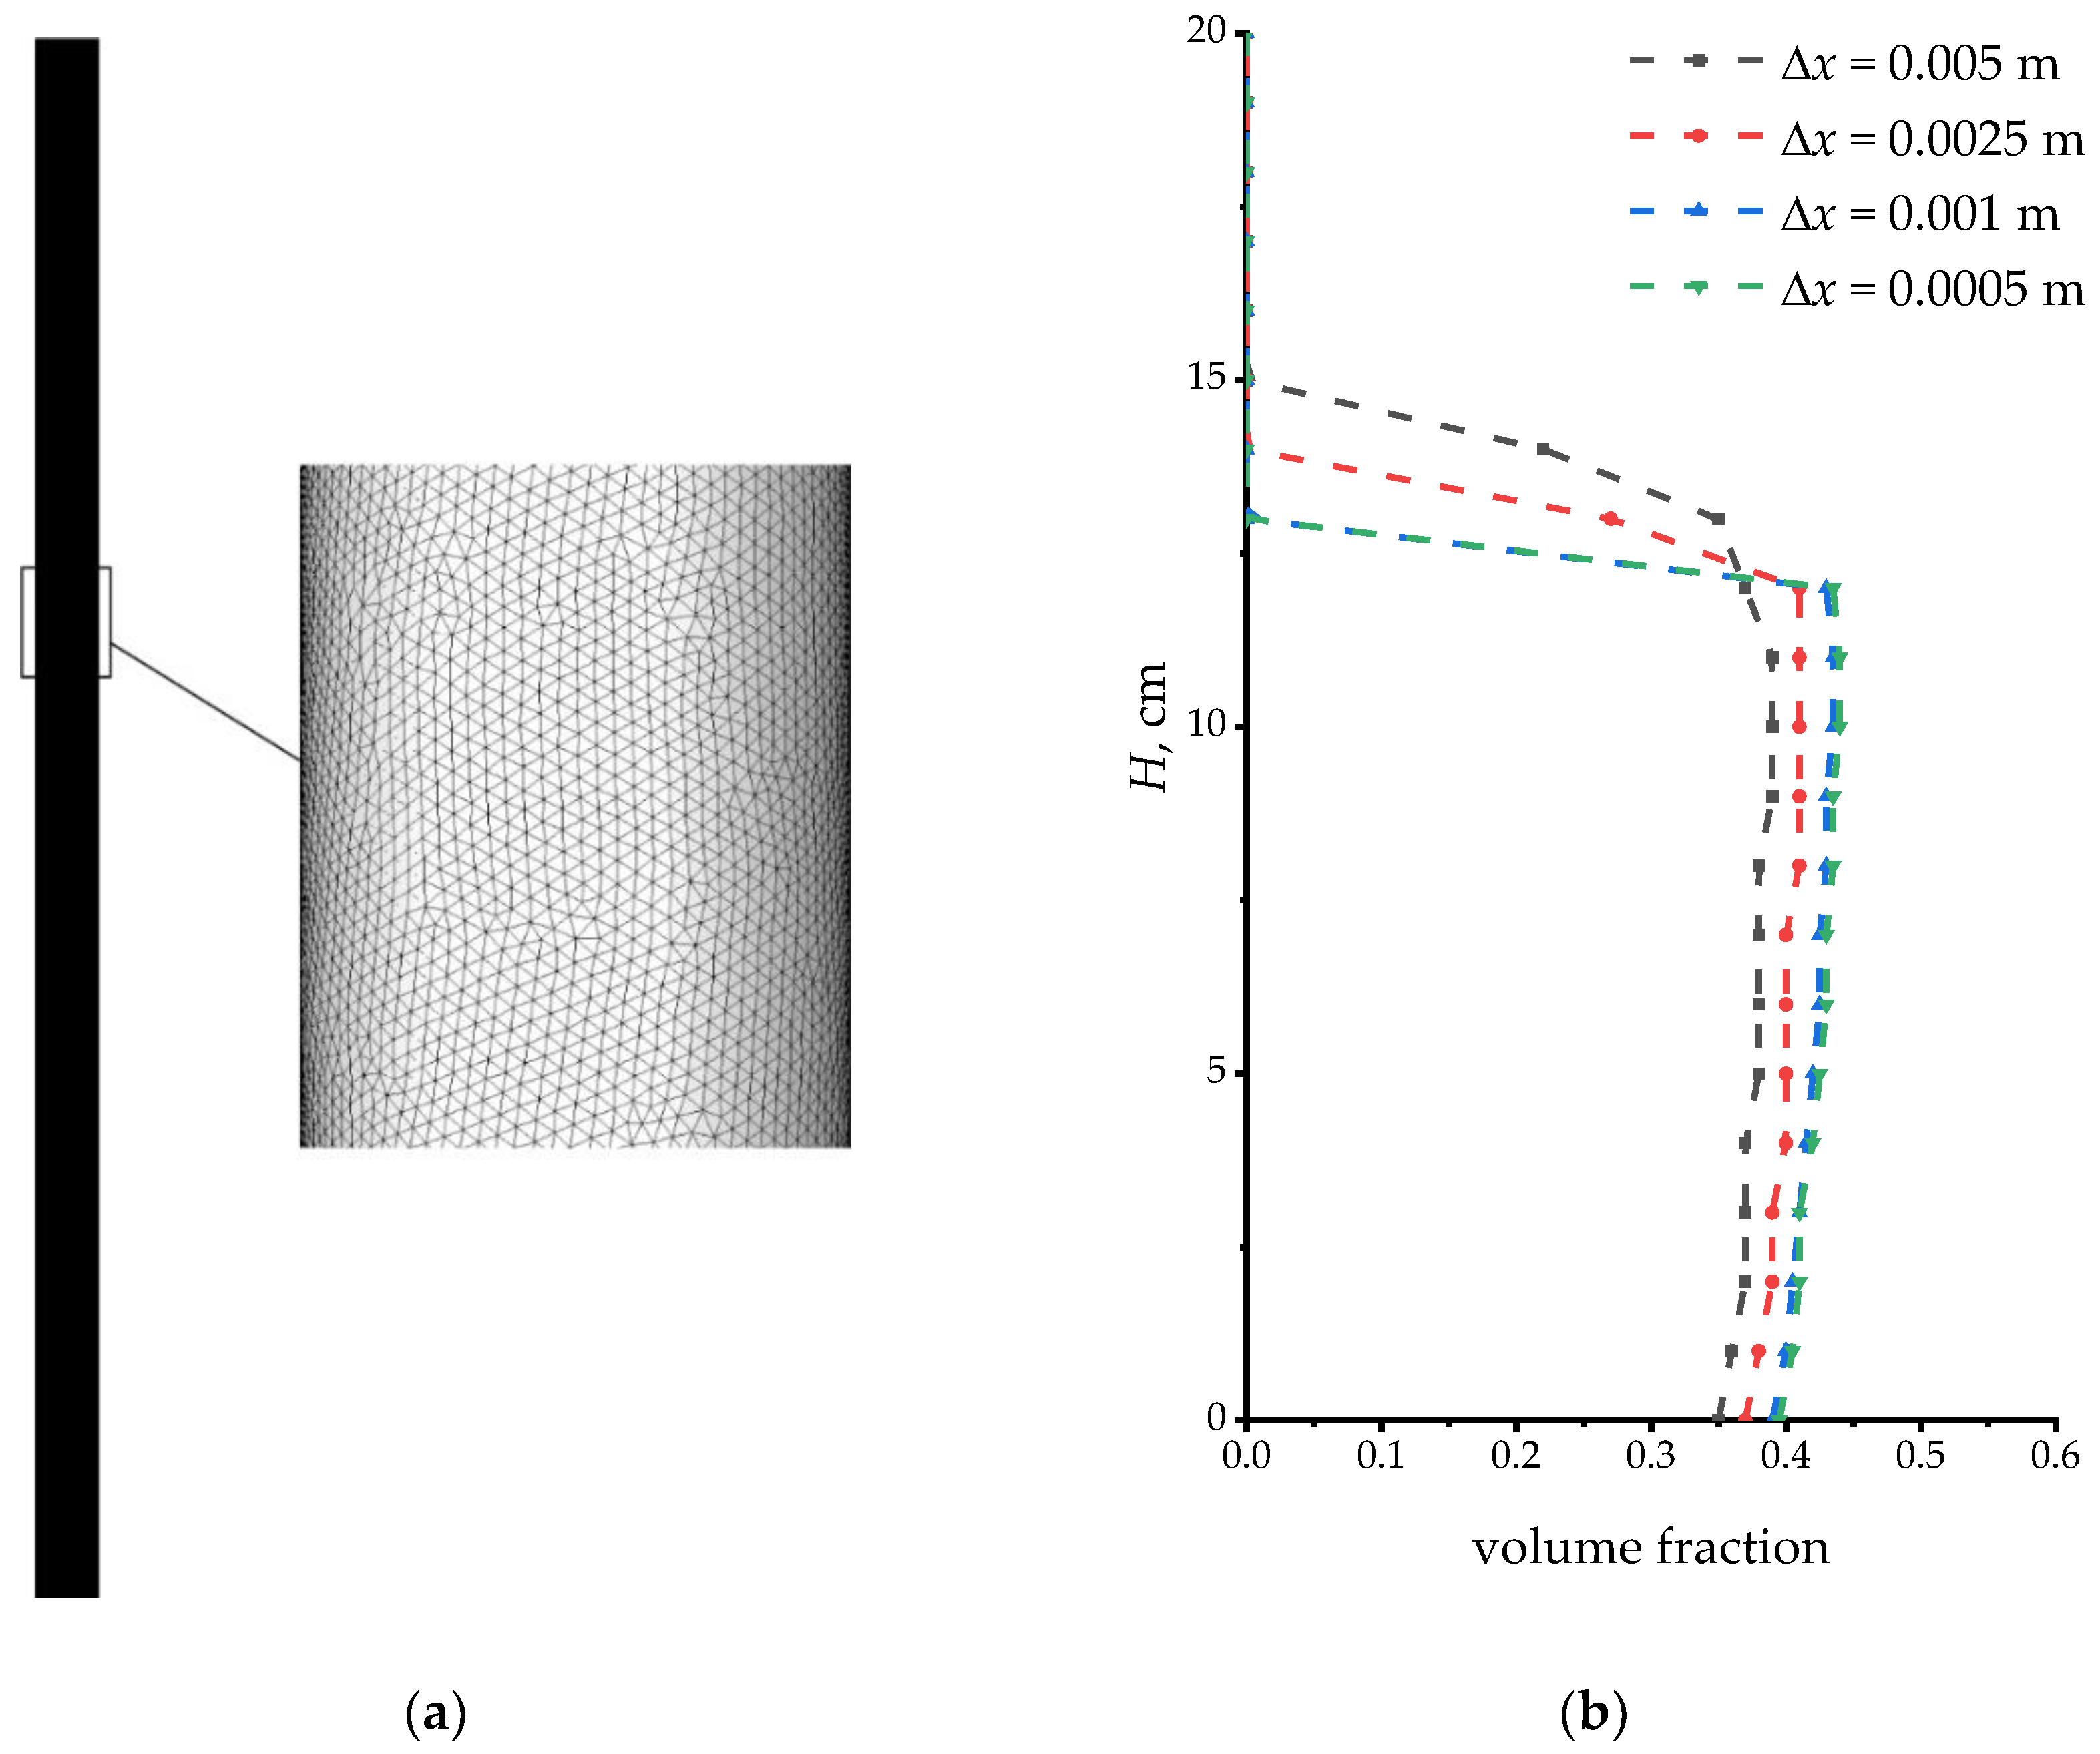
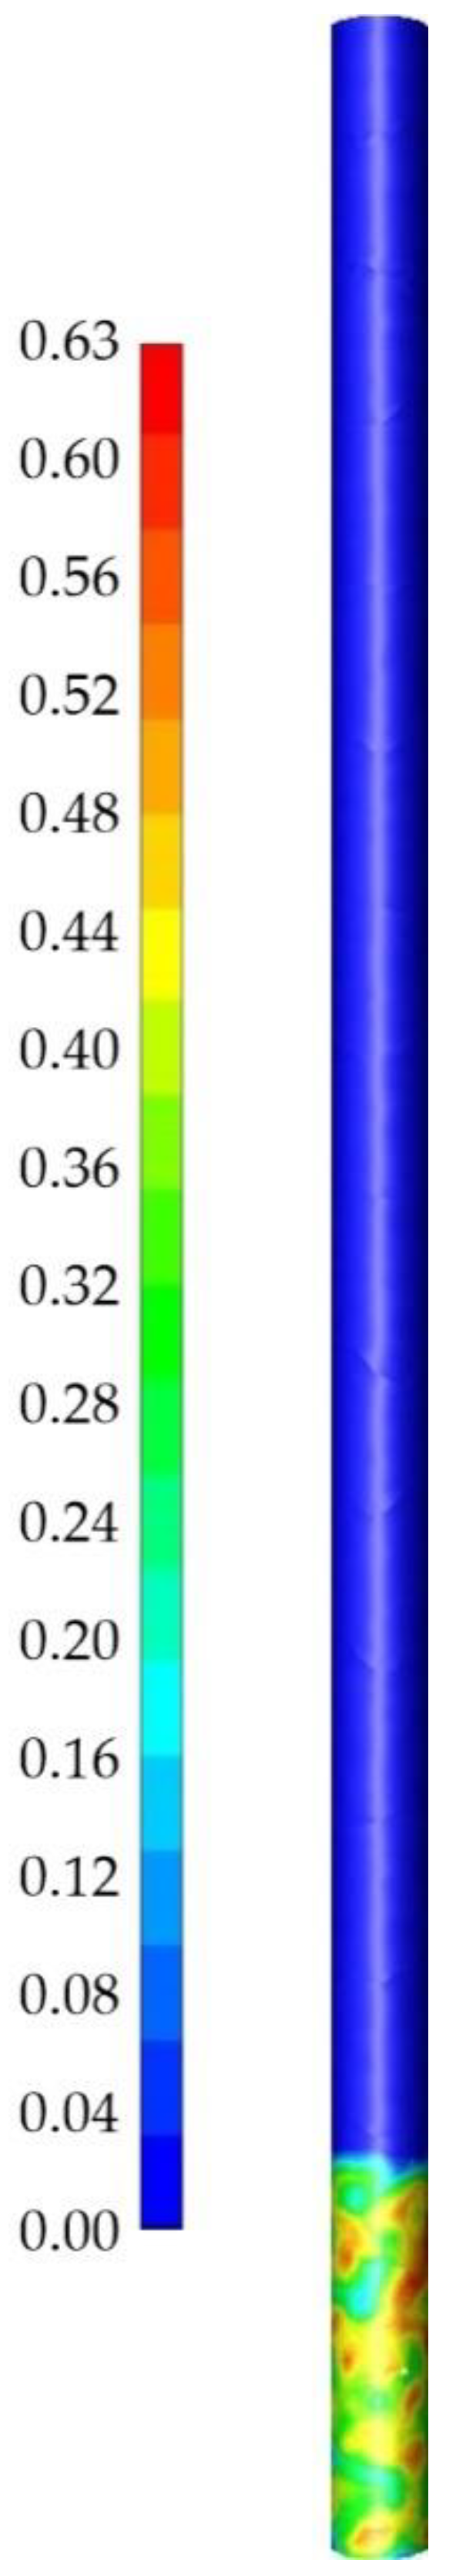
Figure 3 shows the volume fraction of catalyst particles in the reactor under study for the parameters described above. It was observed that the particles form a limited bed with dense and rarefied zones. We characterized the bed as a weak bubbling fluidization. In the course of experimental studies, the probe was also lowered to take samples of the catalyst in the bed. A sufficient amount of catalyst particles was found only at the level of 12–14 cm.
In numerical simulation, we continuously analyzed the values of the mass fraction of all components of the gas phase at the output section. 
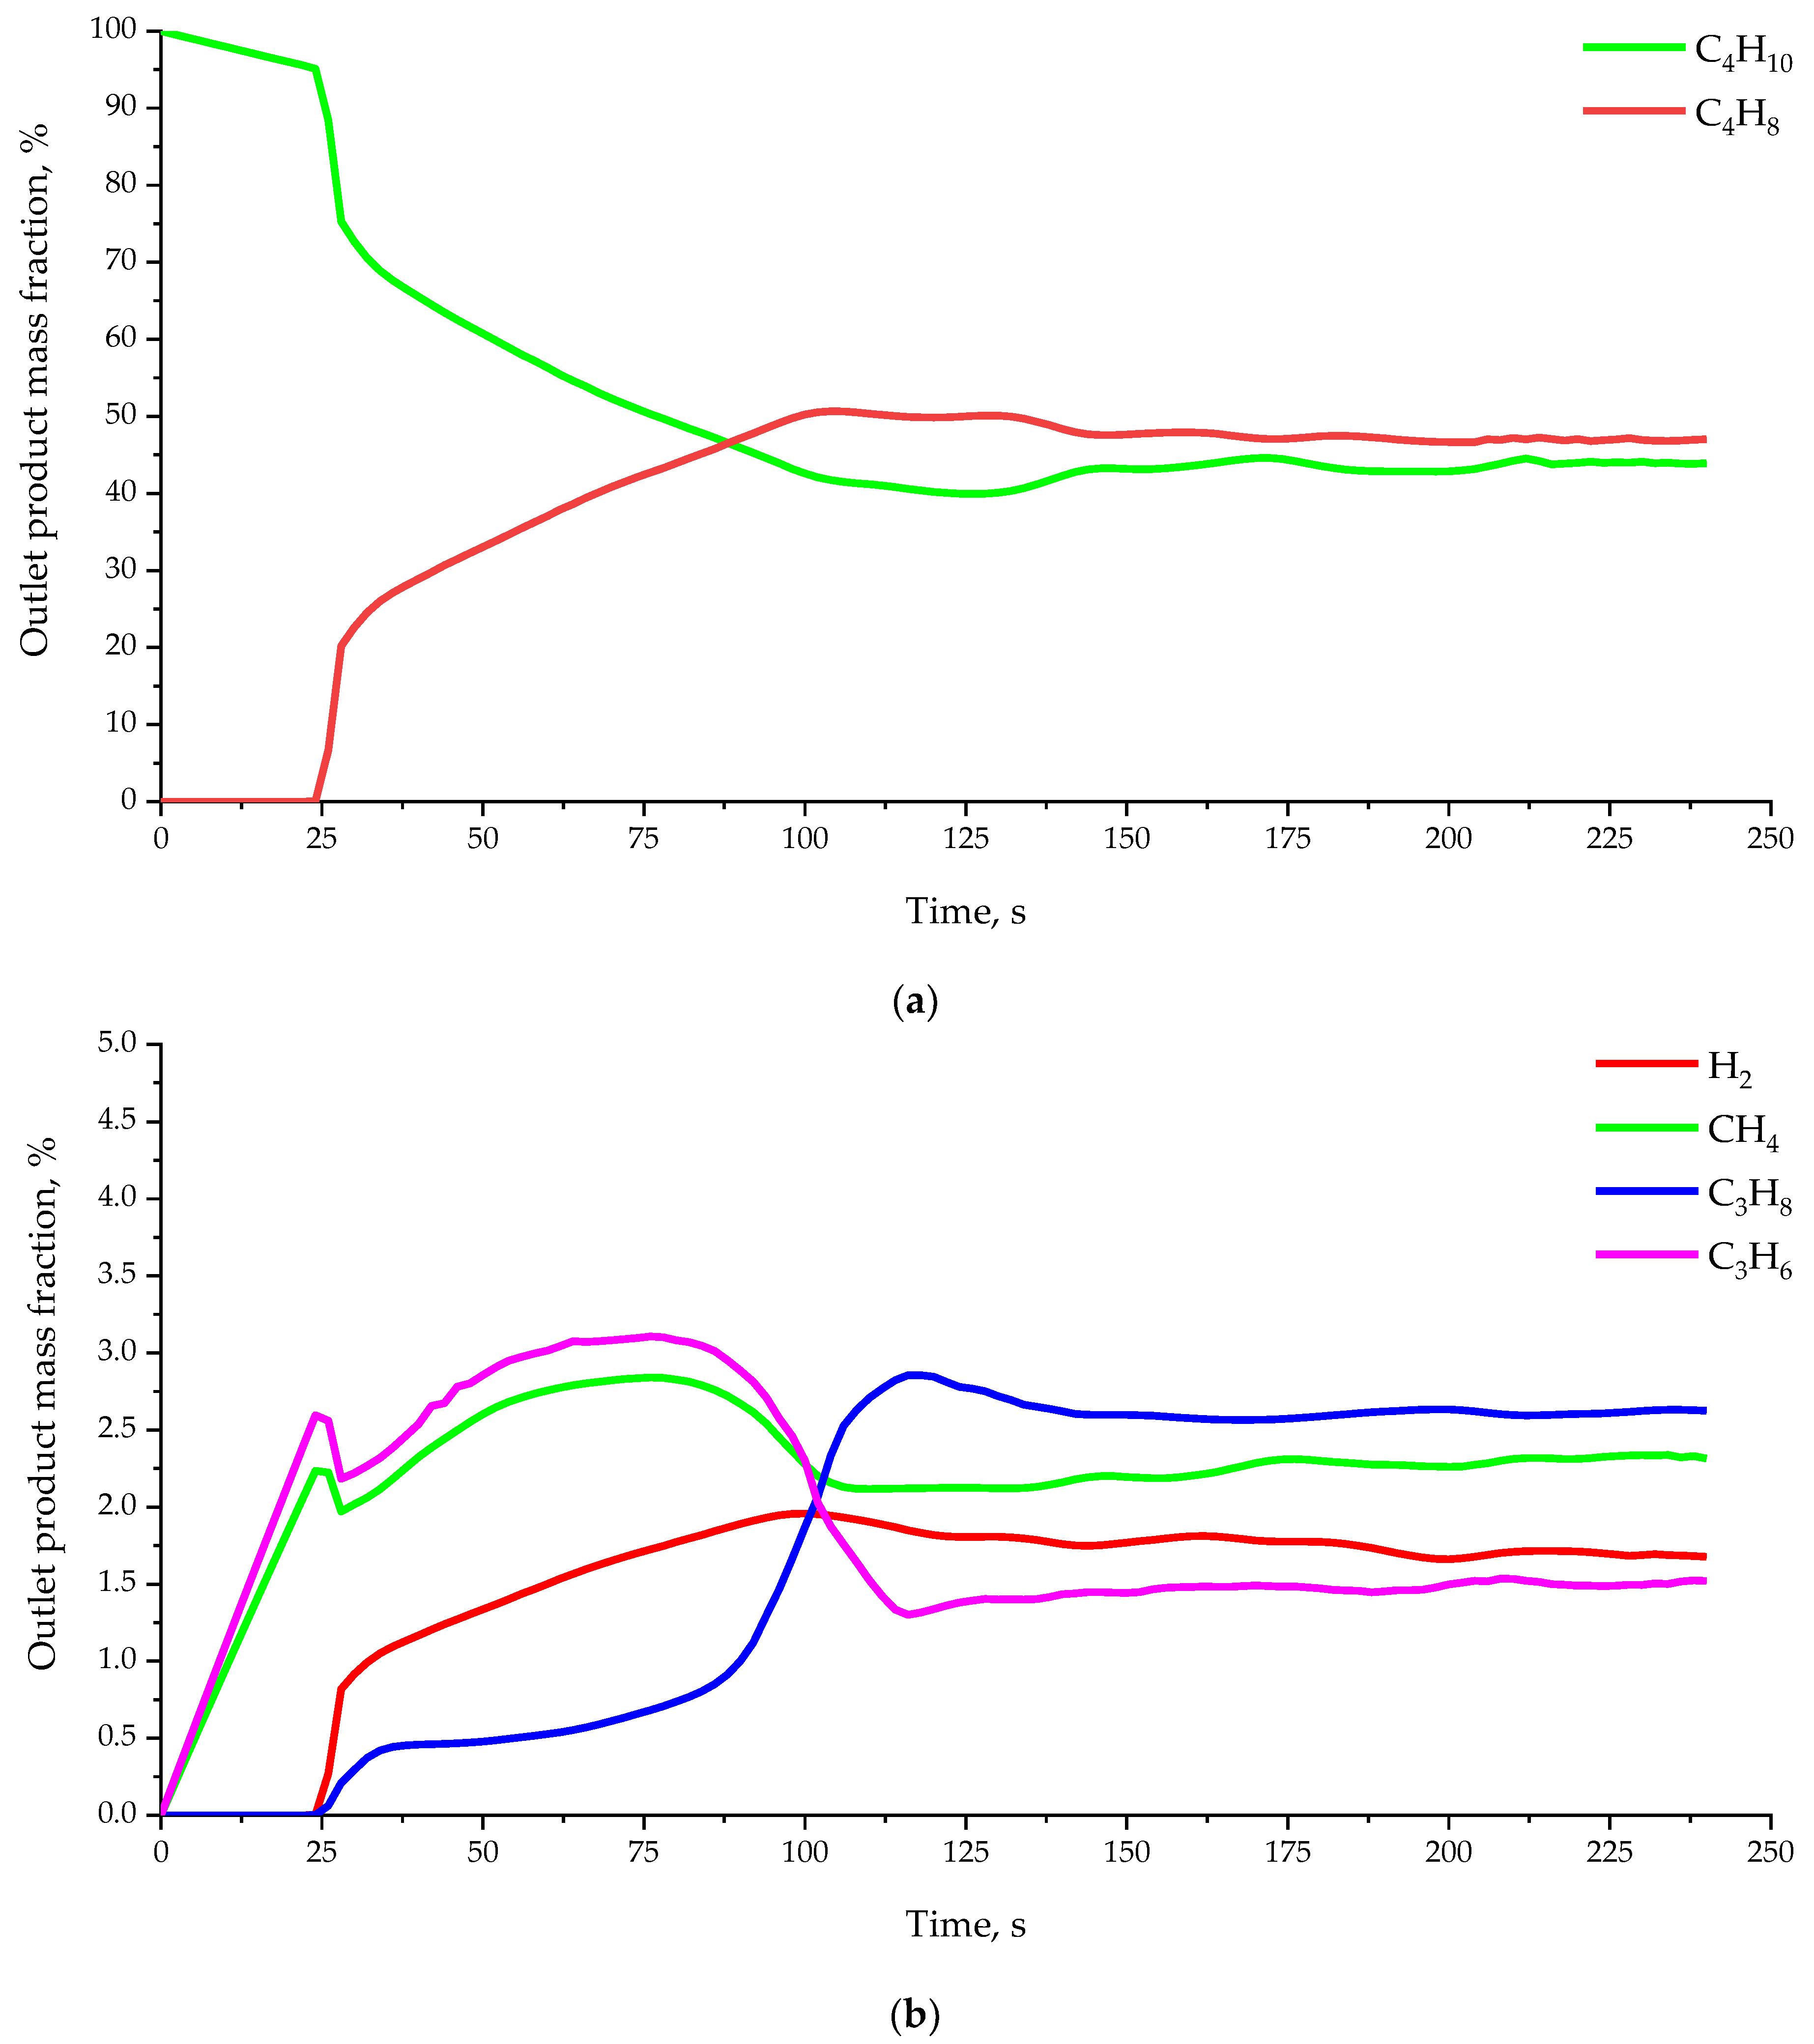
Figure 4 plots the mass fraction of reaction products for the case of a catalyst mass of 100 g, a gas velocity of 0.016 m/s, and temperature of 575 °C.
From the beginning of the simulation run, we observed the products of the thermal cracking reaction of the decomposition of isobutane with the formation of methane and propylene. These were the products of the reaction that take place in the upper part of the reactor. In the 24th second, we observed the appearance of isobutylene and hydrogen. The rapid increase in the products of the main reaction of isobutane dehydrogenation at 24–28 s can be explained by the initial state of the reactor model. In the first second, the catalyst had a uniform volume fraction and the gas consisted entirely of isobutane. With the advent of hydrogen, the formation of propane began as a product of the propylene hydrogenation reaction. From the 24th to the 140th second, we observed changes in the values of the mass fraction of the components. Then, the changes in the values became smaller, and from about the 200th second, the changes in the mass fraction of the components did not exceed 1–2% of the average value for each gas component. In the case presented in Figure 4, we finally obtained the average mass fraction of the components: C4H10—43.9%, C4H8—47%, H2—1.68%, CH4—2.32%, C3H6—1.52%, and C3H8—2.63%.
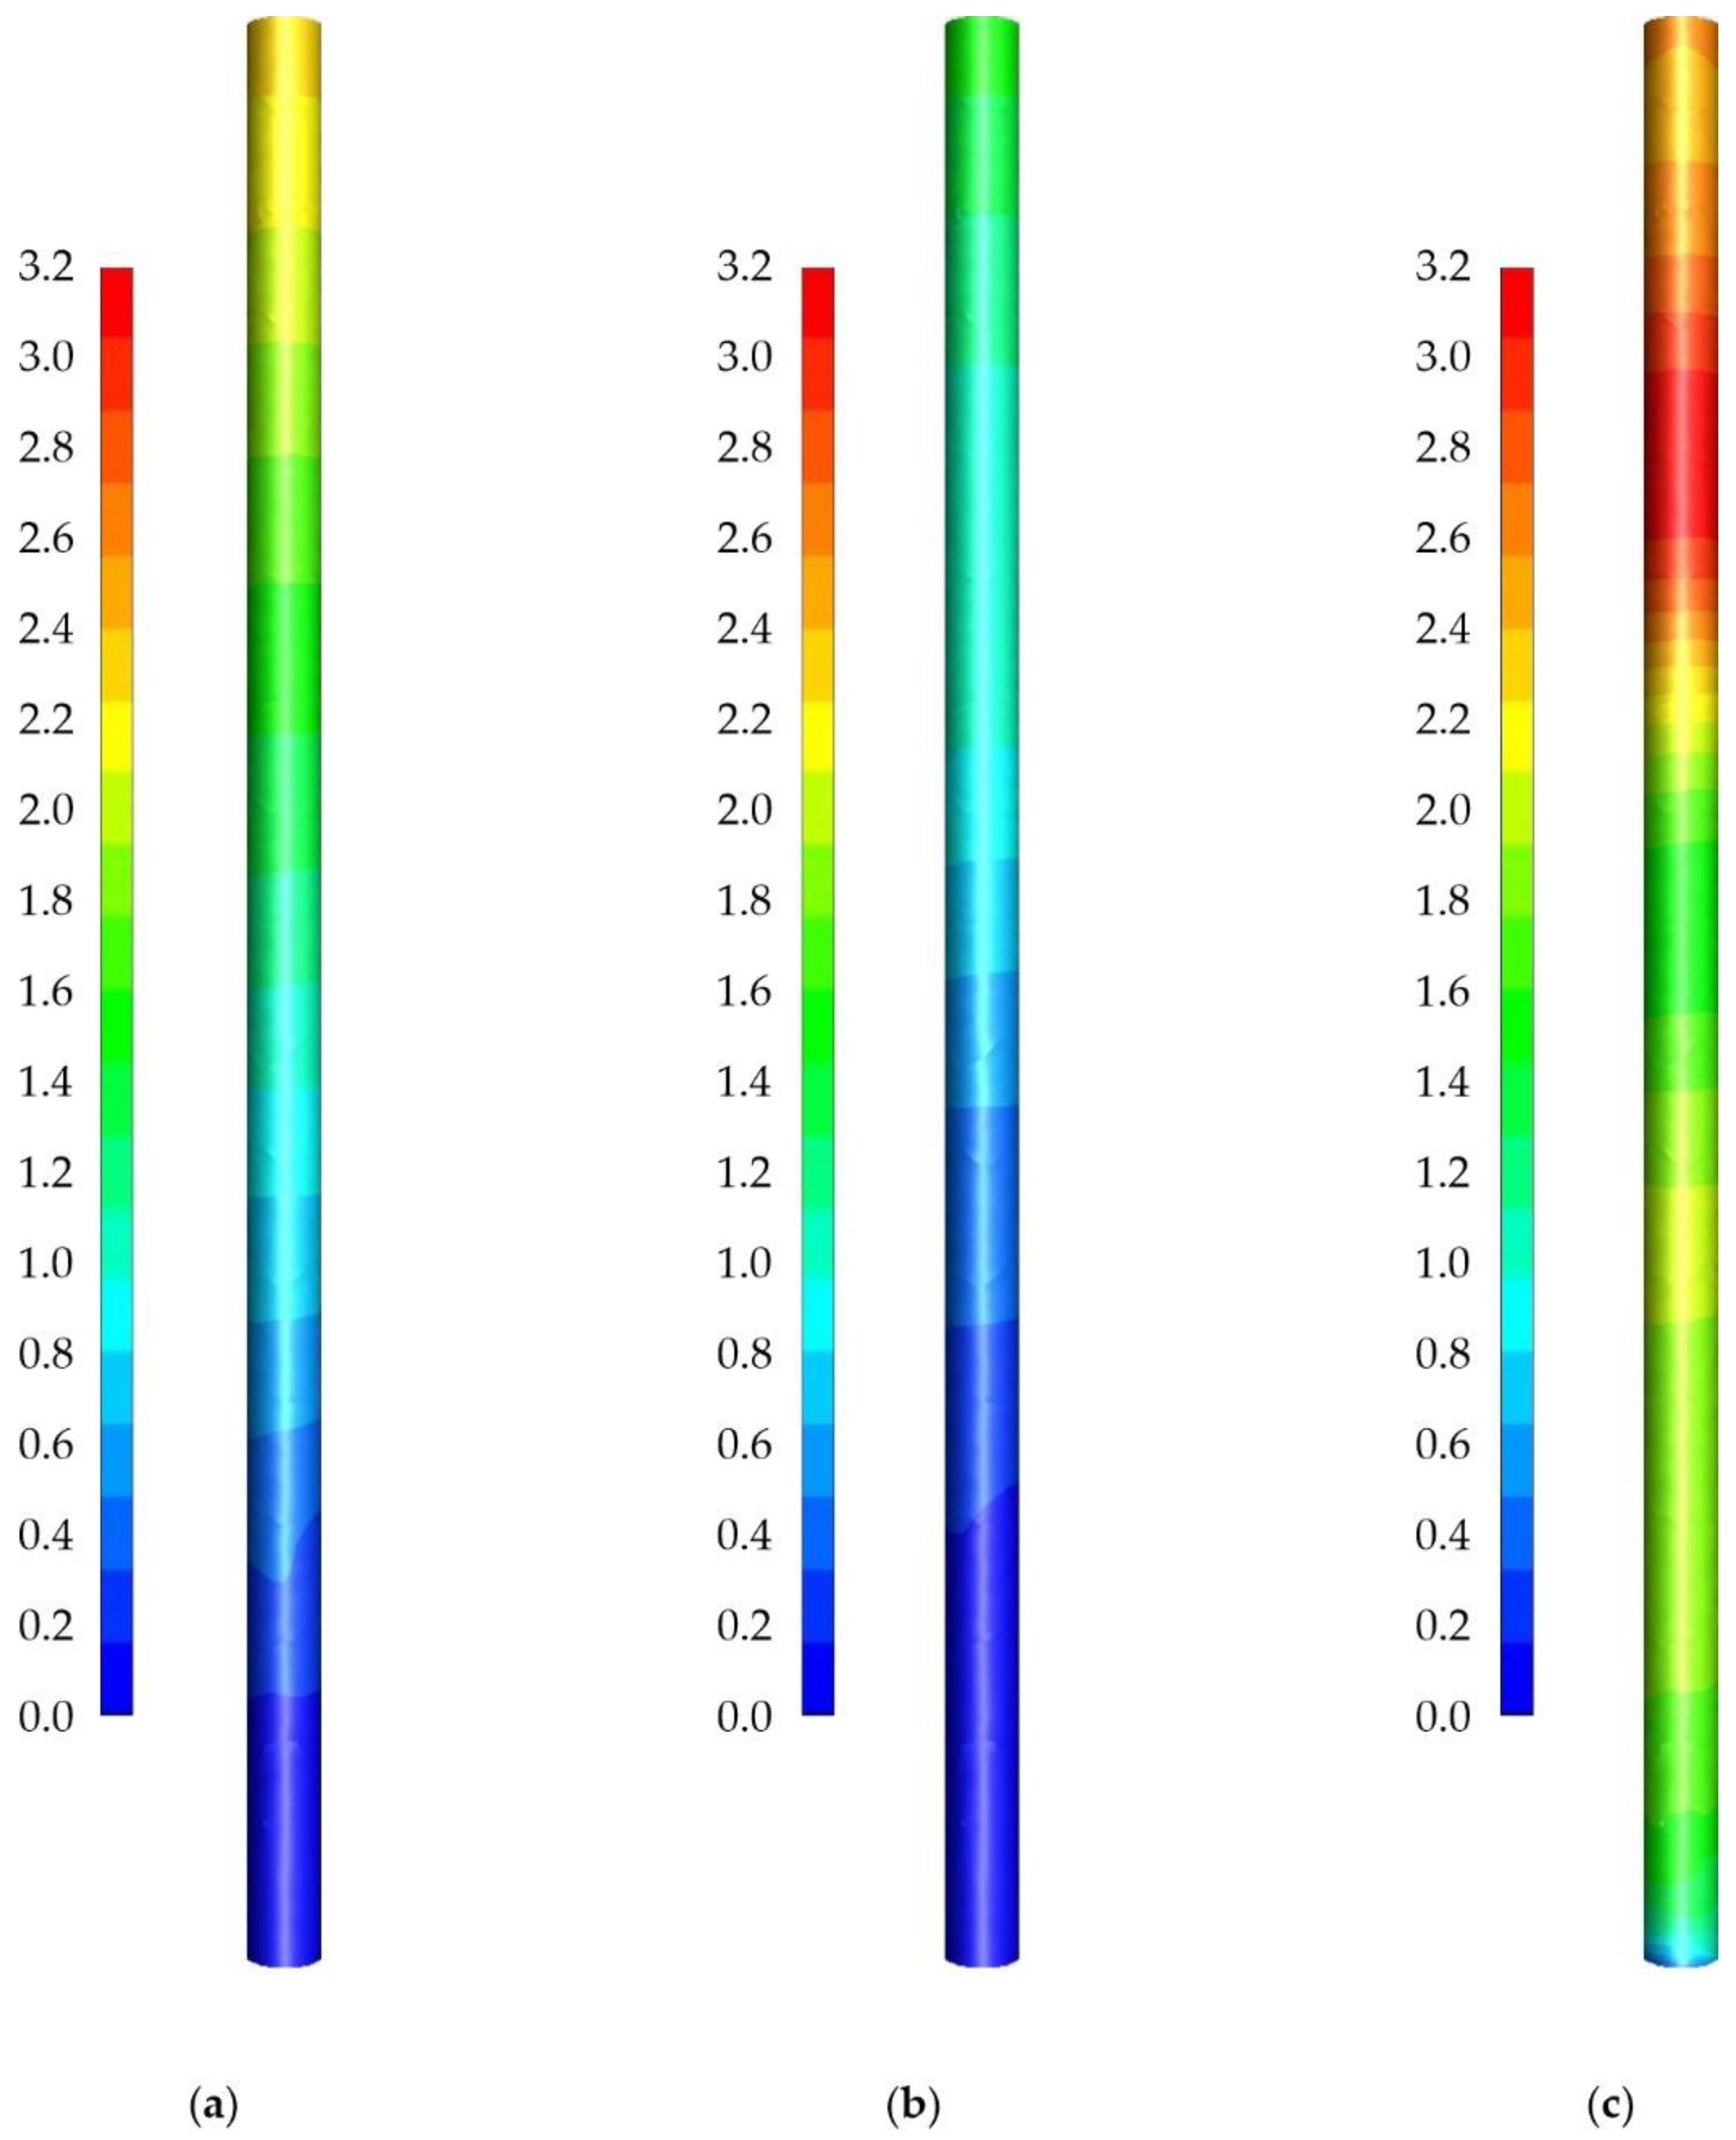
Figure 5 shows the components of the main isobutane dehydrogenation reaction in the reactor under study for the parameters described above.
Isobutane entered from the bottom of the reactor. Upon contact with the catalyst, the mass fraction of isobutane began to decrease to 52% of the mass fraction in the gas phase. We also observed a decrease in the isobutane fraction above the main catalyst bed to 44% of the mass fraction in the gas phase. There, isobutane decomposed as a result of the thermal cracking reaction. The volume fraction of isobutylene and hydrogen increased in the area of the catalyst bed. The fraction of isobutylene reaches 47% of the mass in the gas mixture above the catalyst bed and does not change until the exit from the reactor. Thus, the isobutane dehydrogenation reaction in our model proceeds only in the presence of a catalyst. Hydrogen is formed in the reaction of isobutane dehydrogenation and appears at the bottom of the reactor, where the catalyst bed is located. Then, the mass fraction of hydrogen decreases during the hydrogenation reaction of propylene, which was formed during the thermal cracking of isobutane. The mass fraction of hydrogen in the gas mixture in the reactor does not exceed 1.8%.
Figure 6 shows the components of side reactions of thermal cracking and hydrogenation of propylene in the reactor under study for the parameters described above.
Methane and propylene were formed from isobutane at the top of the reactor in the thermal cracking reaction of isobutane. The formation of these components mainly occurred in the absence of a catalyst, since in the catalyst bed isobutane was mainly spent on the dehydrogenation reaction. The mass fraction of side reaction products in the gas mixture in the reactor did not exceed 7%.
The propylene hydrogenation reaction takes place in the presence of a catalyst. The reaction product (propane) was formed in the area where propylene, hydrogen and a catalyst were present. In the upper part of the reactor, the mass fraction of propane decreased, as thermal cracking reaction products were formed there and the mass content was redistributed to all components.
The visualized fields of the catalyst and components of the studied reactions showed the adequacy of the created mathematical model to the fundamental physics of the process. The following are detailed graphs for the analysis of gas components after leaving the reactor. 
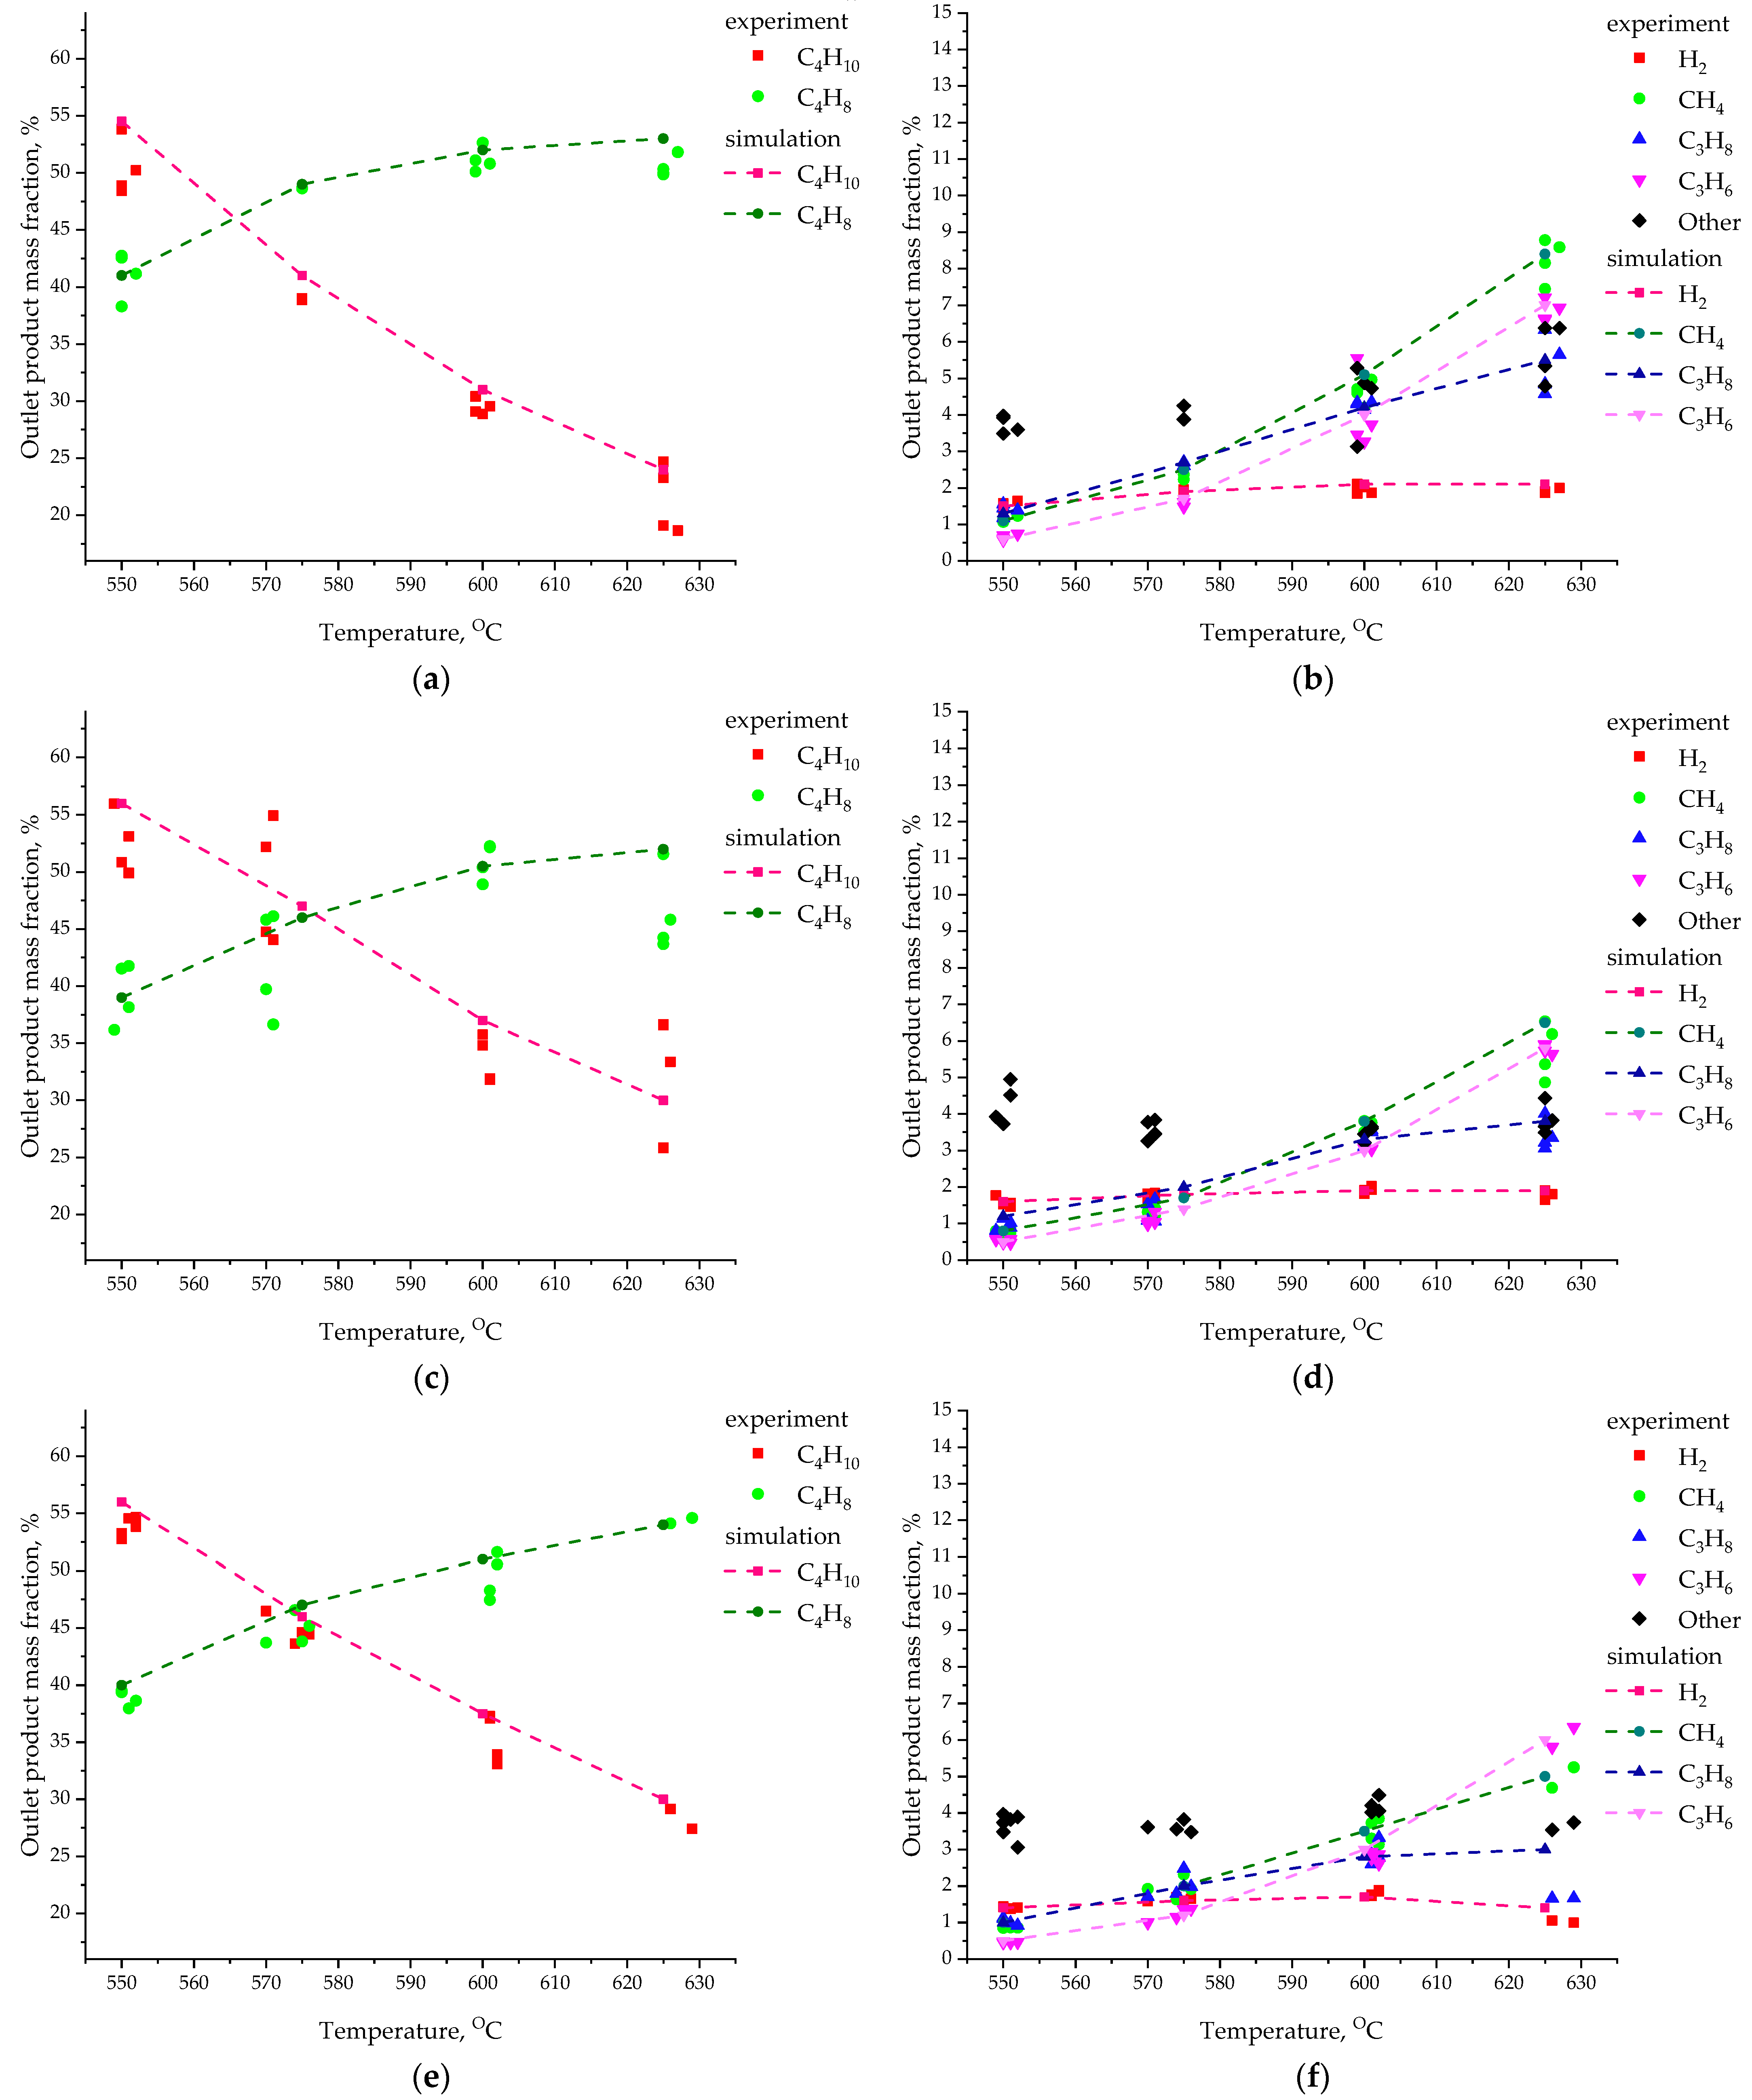
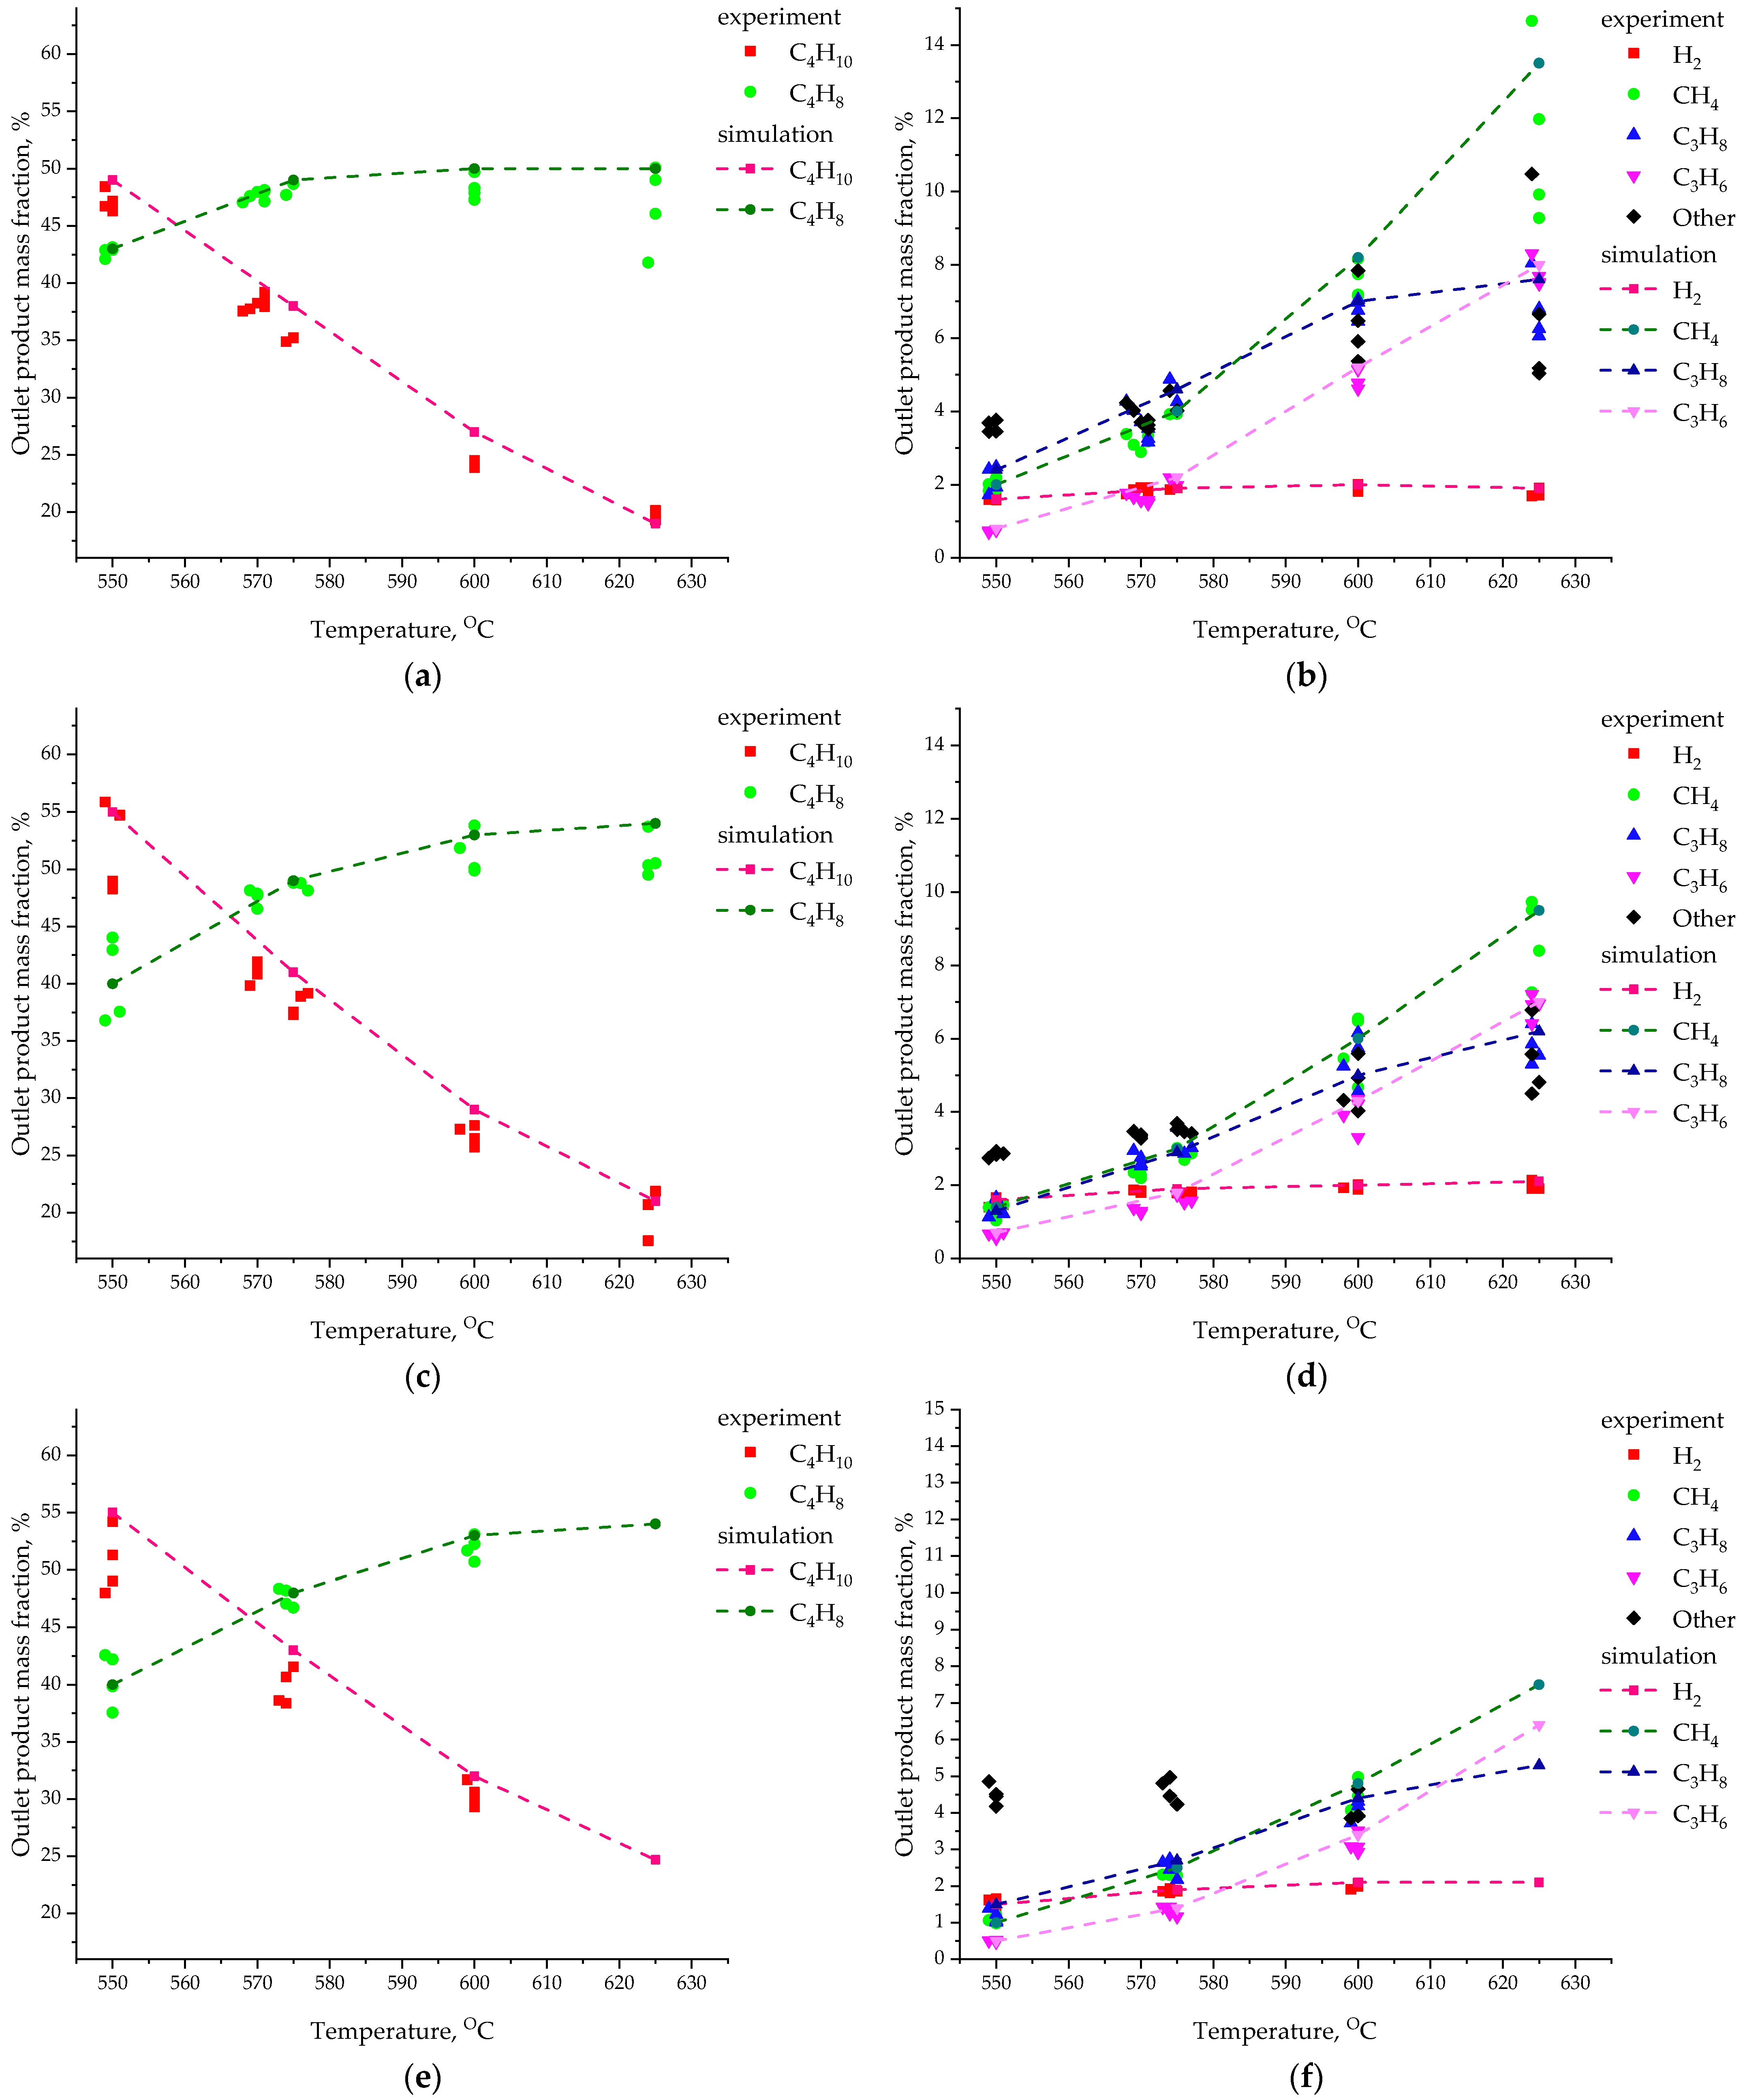
Figure 7 shows the results for a catalyst weight of 75 g, 
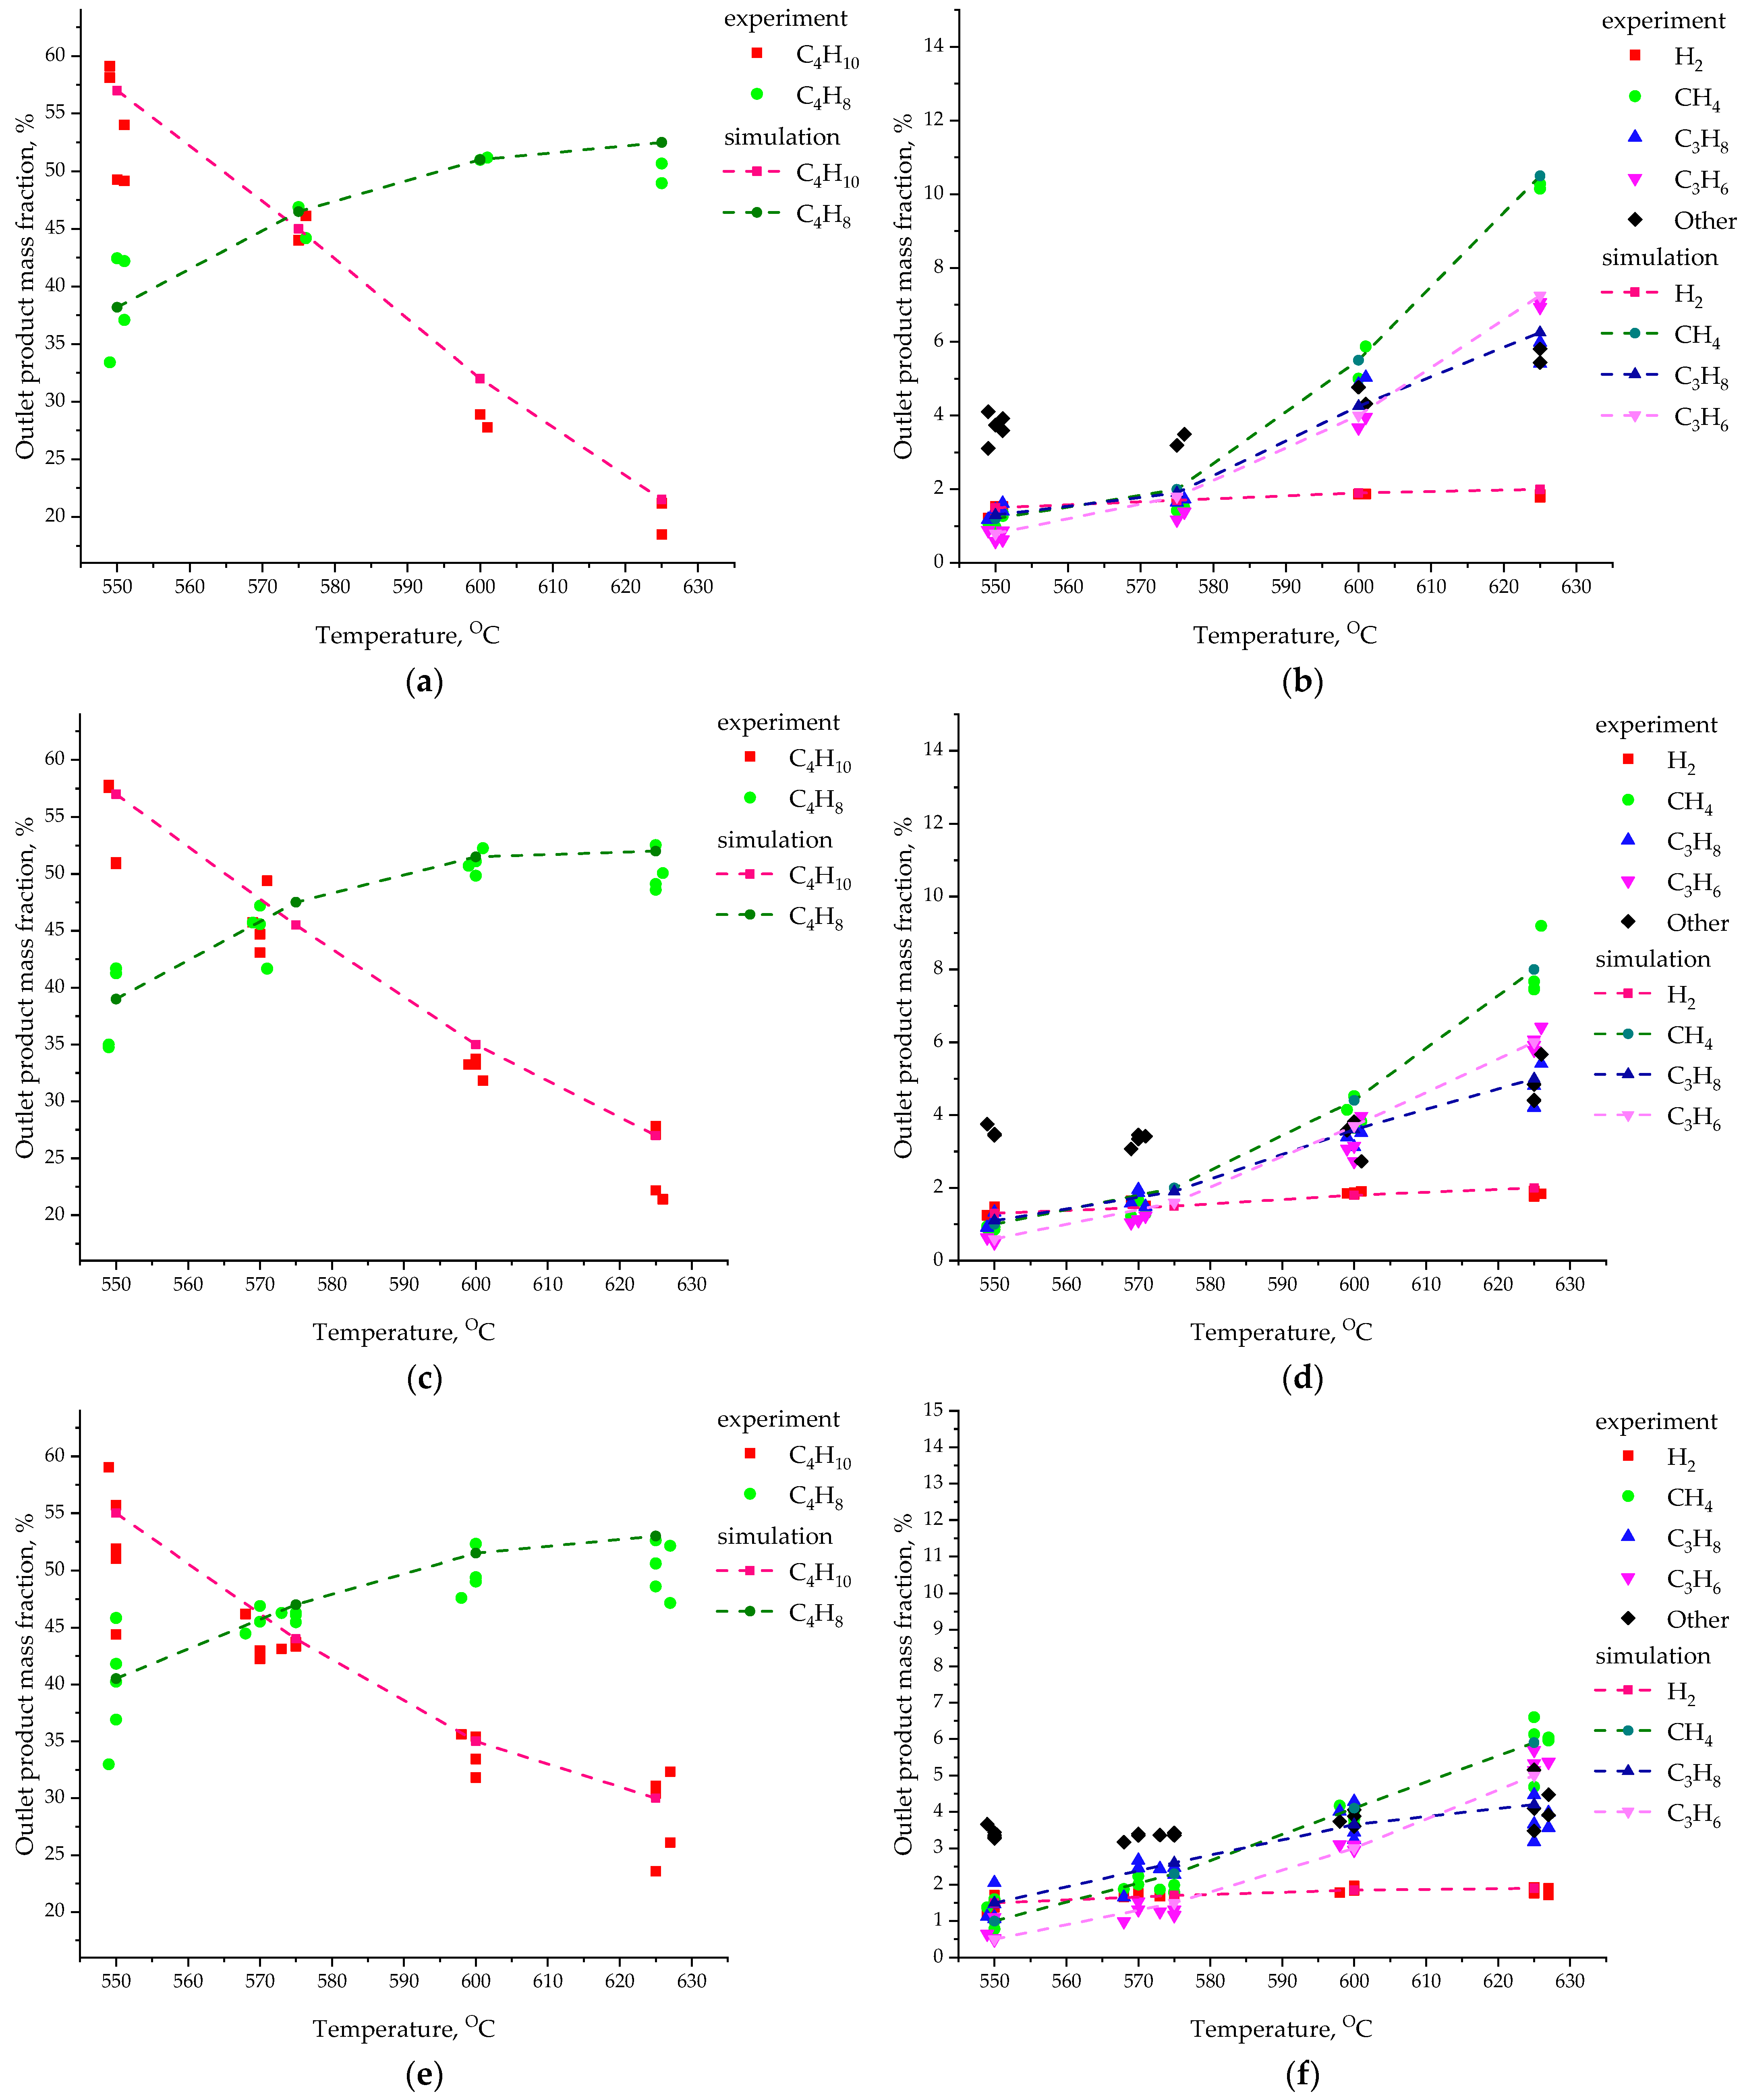
Figure 8 shows the results for a catalyst weight of 100 g, Figure 9 shows the results for a catalyst weight of 125 g.
In the figures, the dots represent the results of the analysis of experimental studies, and the dashed lines represent the results of numerical simulation.
The obtained results of numerical simulation showed good agreement with the results of experimental studies. In Figure 7, Figure 8 and Figure 9b,d,f, black dots represent the yield data of the by-products, which were not taken into account in this model. Such products occupy an average of 3–6% of the total mass. The model parameters were chosen so as to bring the values of the reaction products closer to the experimental data. As a result, in the model, the result of the yield of the feed gas (isobutane) was greater than the experimental data, on average, by the value of unaccounted for by-products of the reactions.
Note that the experimental data were taken during several cycles of the reactor operation. So, during long-term operation of the catalyst in the reactor, without regeneration, its efficiency decreases, and the yields of the products can differ greatly from the results for a freshly regenerated catalyst. In industry, fluidized bed reactors for the process of isobutane dehydrogenation operate in circulation with a regenerator, where the coke deposited upon dehydrogenation is removed from the catalyst surface.
In general, in the results of numerical simulation, the mass fractions of the reaction components correspond to the results of the considered experiments for all fluidization modes and to the mass of the loaded catalyst.
Obviously, temperature had the main effect on the rate of the studied chemical reactions and on the final mass fraction of each component in the gas phase at the outlet of the reactor. Analysis of the efficiency of the process showed a significant increase in the yield of the product of the main reaction (isobutylene) with an increase in temperature from 550 to 575 °C. So, for a temperature of 550 °C the yield of isobutylene was 39–43% of the mass, and for a temperature of 575 °C the yield of isobutylene was 46–49% of the mass. In this case, the yield of by-products was for T = 550 °C—2.5–5.2% of the mass, for T = 575 °C—5.1–10.8% of the mass. With a further increase in temperature, the growth of the mass fraction of isobutylene slowed down, and in some cases it was practically absent. For a temperature of 600 °C, the yield of isobutylene was 50–53% of the mass, and for a temperature of 625 °C, the yield of isobutylene was 50–54% of the mass. At the same time, a significant increase in the products of side reactions with increasing temperature was observed: for T = 600 °C—9.3–20.4% of the mass, for T = 625 °C—14.0–29.1% of the mass.
Then, we analyzed the effect of gas velocity on the yield of reaction products. Obviously, the gas velocity affected the process under study, since the time of contact of the gas with the catalyst and the residence time of gas molecules in the reactor changed. In this case, an increase in gas velocity did not necessarily lead to a decrease in the time of contact of the gas with the catalyst. With an increase in gas velocity, the height of the bed of particles increased, but the volume content of the solid phase per unit volume decreased. However, in the fluidized bed zone, all phases and components were actively mixed and in contact with each other. Note that in industrial reactors, as a rule, fast turbulent fluidization is used, where catalyst particles circulate throughout the entire volume of the reactor. In our studies, the change in gas velocity had almost no effect on the yield of isobutylene. So, at the same temperature, the yield of isobutylene differed by a maximum of 2.6% relative to the average value for cases of temperature 625 °C. For the optimal temperature of 575 °C, the differences were 1.7% relative to the average value. In this case, we observed the highest values of the isobutylene yield mass at a velocity of 0.016 m/s for all cases of temperature and catalyst mass. That is, the speed of gas movement through the layer of catalyst particles did not greatly affect the yield of the main product for the selected flow values. We observed the highest yields of by-products at a velocity of 0.008 m/s for all cases of temperature and catalyst mass. The values differed by a maximum of 22.1% relative to the average value. Here, the smallest value of the gas velocity created a fluidized bed of the smallest height. Additionally, at the lowest value of the speed, the flow was longer in the reactor, including above the catalyst layer. In the catalyst-free zone, by-products are mainly formed. Thus, for the reactor under study, it was most expedient to achieve the highest possible gas velocity in experiments. In our case, the gas flow rate of 0.016 m/s was the most optimal. Firstly, according to the present studies, a greater amount of isobutane was retained in the upper part of the reactor without decomposing into by-products. Secondly, we were approaching regimes in industrial reactors, where the gas velocity can reach 0.4 m/s.
Then, we analyzed the effect of the mass of the catalyst on the yield of reaction products. Different values of the catalyst mass do not affect the fluidization mode, but such a study can be useful for assessing the reliability of the results of laboratory studies and their transfer to devices with a large amount of catalyst. The yield of isobutylene varied insignificantly for different values of the mass of the catalyst. So, for the same cases of temperature and gas velocity, the yield of isobutylene differed by a maximum of 2.1% relative to the average value for cases of temperature 625 °C. In this case, the yield of by-products changed more significantly up to 13% relative to the average value for cases of a temperature of 625 °C for a gas velocity of 0.008 m/s. For the optimum temperature value of 575 °C and gas velocity of 0.016 m/s, the yield of isobutylene differed by 0.9% relative to the average value. The yield of by-products differed by 9.4% relative to the average value. We observed an increase in the yield of products of all reactions with an increase in the mass of the catalyst, the maximum values for 125 g of particles. An increase in the mass of the loaded catalyst leads to a larger volume of the fluidization zone in the reactor, where all gas components are more intensively mixed than in the zone of gas movement, free from catalyst particles. This may have an effect on increasing the yield of by-products. Thus, the fixed mass of the catalyst in the laboratory reactor did not significantly affect the yield of the main reaction product (isobutylene), but significantly affected the yield of the by-products of the process.
Despite the fact that the optimal temperature for the considered process was taken to be about 575 °C, testing the created model in a wide temperature range up to 625 °C will allow using the results of this study to simulate large-scale circulating fluidized bed reactors. In industrial reactor-regenerator systems, the maximum temperature of the gas–catalyst mixture can reach a temperature of 650 °C in individual zones.

4. Conclusions

In the present study, a mathematical model of the process of isobutane dehydrogenation in a fluidized catalyst bed for a laboratory reactor was created. To verify the model, a series of experiments was carried out with different values of the catalyst mass and gas supply rate. The temperature range was chosen based on the possible values in a large-scale industrial reactor.
The model implemented the main reaction of dehydrogenation of isobutane to isobutylene with hydrogen evolution. Additionally, two side reactions were implemented in the model: the reaction of thermal cracking of isobutane with the formation of methane and propylene; and propylene hydrogenation reaction to propane with the addition of hydrogen formed in the main isobutane dehydrogenation reaction. The by-products were accounted for, since they can take up to 30% of the mass content of the contact gas at the outlet of the reactor. Other by-products of reactions that were not taken into account in the model, in experimental studies amounted to 3–6% of the mass.
The developed model for CFD simulation of isobutane dehydrogenation in a fluidized catalyst bed showed good agreement with experimental data for a laboratory reactor in a wide temperature range. The research results of this work will be extended in relation to the simulation of large-scale industrial reactors with a fluidized bed catalyst for the process of isobutane dehydrogenation.

Author Contributions

Conceptualization, S.A.S.; methodology, G.E.B., S.R.E. and S.A.S.; software, S.A.S. and O.V.S.; validation, O.V.S. and G.E.B.; formal analysis, S.A.S. and S.R.E.; investigation, S.A.S. and A.A.L.; resources, S.R.E. and A.A.L.; data curation, O.V.S. and S.R.E.; writing—original draft preparation, S.A.S. and G.E.B.; writing—review and editing, O.V.S., S.R.E. and A.A.L.; visualization, S.A.S. and O.V.S.; supervision, A.A.L.; project administration, S.A.S., S.R.E. and A.A.L.; funding acquisition, S.A.S. All authors have read and agreed to the published version of the manuscript.

Funding

The research was supported by project No. 2 of the National Center for Physics and Mathematics.

Conflicts of Interest

The authors declare no conflict of interest.

References

  1. Sadeghbeigi, R. Fluid Catalytic Cracking Handbook: An Expert Guide to the Practical Operation, Design, and Optimization of FCC Units; Butterworth-Heinemann: Oxford, UK, 2020; p. 352. [Google Scholar]
  2. Basu, P. Combustion and Gasification in Fluidized Beds; CRC Press: Boca Raton, FL, USA, 2006; p. 496. [Google Scholar]
  3. De Lasa, H. (Ed.) Chemical Reactor Design and Technology: Overview of the New Developments of Energy and Petrochemical Reactor Technologies. Projections for the 90’s; Springer: Berlin/Heidelberg, Germany, 2012; p. 850. [Google Scholar]
  4. Bai, P.; Etim, U.J.; Yan, Z.; Mintova, S.; Zhang, Z.; Zhong, Z.; Gao, X. Fluid catalytic cracking technology: Current status and recent discoveries on catalyst contamination. Catal. Rev. 2019, 61, 333–405. [Google Scholar] [CrossRef]
  5. Özkaya, B.; Kaksonen, A.H.; Sahinkaya, E.; Puhakka, J.A. Fluidized bed bioreactor for multiple environmental engineering solutions. Water Res. 2019, 150, 452–465. [Google Scholar] [CrossRef] [PubMed]
  6. Wu, Y.; Liu, D.; Hu, J.; Ma, J.; Chen, X. Comparative study of two fluid model and dense discrete phase model for simulations of gas–solid hydrodynamics in circulating fluidized beds. Particuology 2021, 55, 108–117. [Google Scholar] [CrossRef]
  7. Zhong, W.; Yu, A.; Zhou, G.; Xie, J.; Zhang, H. CFD simulation of dense particulate reaction system: Approaches, recent advances and applications. Chem. Eng. Sci. 2016, 140, 16–43. [Google Scholar] [CrossRef]
  8. Wu, H.; Yang, C.; Zhang, Z.; Zhang, Q. Simulation of Two-Phase Flow and Syngas Generation in Biomass Gasifier Based on Two-Fluid Model. Energies 2022, 15, 4800. [Google Scholar] [CrossRef]
  9. Cardoso, J.; Silva, V.; Eusébio, D.; Brito, P.; Tarelho, L. Improved numerical approaches to predict hydrodynamics in a pilot-scale bubbling fluidized bed biomass reactor: A numerical study with experimental validation. Energy Convers. Manag. 2018, 156, 53–67. [Google Scholar] [CrossRef]
  10. Ding, K.; Xiong, Q.; Zhong, Z.; Zhong, D.; Zhang, Y. CFD simulation of combustible solid waste pyrolysis in a fluidized bed reactor. Powder Technol. 2020, 362, 177–187. [Google Scholar] [CrossRef]
  11. Wu, Y.; Liu, D.; Duan, L.; Ma, J.; Xiong, J.; Chen, X. Three-dimensional CFD simulation of oxy-fuel combustion in a circulating fluidized bed with warm flue gas recycle. Fuel 2018, 216, 596–611. [Google Scholar] [CrossRef]
  12. Wang, S.; Luo, K.; Yang, S.; Hu, C.; Fan, J. Parallel LES-DEM simulation of dense flows in fluidized beds. Appl. Therm. Eng. 2017, 111, 1523–1535. [Google Scholar] [CrossRef]
  13. Wang, S.; Luo, K.; Fan, J. CFD-DEM coupled with thermochemical sub-models for biomass gasification: Validation and sensitivity analysis. Chem. Eng. Sci. 2020, 217, 115550. [Google Scholar] [CrossRef]
  14. Zhou, L.; Lv, W.; Bai, L.; Han, Y.; Wang, J.; Shi, W.; Huang, G. CFD–DEM study of gas–solid flow characteristics in a fluidized bed with different diameter of coarse particles. Energy Rep. 2022, 8, 2376–2388. [Google Scholar] [CrossRef]
  15. Yue, Y.; Wang, T.; Shen, Y. CFD-DEM study of effects of particle density on spout deflection behavior in a spout fluidized bed. Powder Technol. 2020, 366, 736–746. [Google Scholar] [CrossRef]
  16. Luo, K.; Wu, F.; Yang, S.; Fan, J. CFD–DEM study of mixing and dispersion behaviors of solid phase in a bubbling fluidized bed. Powder Technol. 2015, 274, 482–493. [Google Scholar] [CrossRef]
  17. Houston, R.; Oyedeji, O.; Abdoulmoumine, N. Detailed biomass fast pyrolysis kinetics integrated to computational fluid dynamic (CFD) and discrete element modeling framework: Predicting product yields at the bench-scale. Chem. Eng. J. 2022, 444, 136419. [Google Scholar] [CrossRef]
  18. Li, C.; Eri, Q. Comparison between two Eulerian-Lagrangian methods: CFD-DEM and MPPIC on the biomass gasification in a fluidized bed. Biomass Convers. Biorefin. 2021. [Google Scholar] [CrossRef]
  19. Wu, C.; Zhuo, Y.; Xu, X.; Farajzadeh, E.; Dou, J.; Yu, J.; Shen, Y.; Zhang, Z. A combined experimental and numerical study of coal briquettes pyrolysis using recycled gas in an industrial scale pyrolyser. Powder Technol. 2022, 404, 117477. [Google Scholar] [CrossRef]
  20. Wang, S.; Shen, Y. CFD-DEM study of biomass gasification in a fluidized bed reactor: Effects of key operating parameters. Renew. Energy 2020, 159, 1146–1164. [Google Scholar] [CrossRef]
  21. Shao, Y.; Gu, J.; Zhong, W.; Yu, A. Determination of minimum fluidization velocity in fluidized bed at elevated pressures and temperatures using CFD simulations. Powder Technol. 2019, 350, 81–90. [Google Scholar] [CrossRef]
  22. Zhang, Y.; Jia, Y.; Xu, J.; Wang, J.; Duan, C.; Ge, W.; Zhao, Y. CFD intensification of coal beneficiation process in gas-solid fluidized beds. Chem. Eng. Process.-Process Intensif. 2020, 148, 107825. [Google Scholar] [CrossRef]
  23. Kong, D.; Luo, K.; Wang, S.; Yu, J.; Fan, J. Particle behaviours of biomass gasification in a bubbling fluidized bed. Chem. Eng. J. 2022, 428, 131847. [Google Scholar] [CrossRef]
  24. Airaksinen, S.M.; Harlin, M.E.; Krause, A.O.I. Kinetic modeling of dehydrogenation of isobutane on chromia/alumina catalyst. Ind. Eng. Chem. Res. 2002, 41, 5619–5626. [Google Scholar] [CrossRef]
  25. Pakhomov, N.A.; Parakhin, O.A.; Nemykina, E.I.; Danilevich, V.V.; Chernov, M.P.; Pecherichenko, V.A. Microspherical chromium oxide/alumina catalyst KDM for fluidized-bed isobutane dehydrogenation: Development and industrial application experience. Catal. Ind. 2012, 4, 298–307. [Google Scholar] [CrossRef]
  26. Sanfilippo, D.; Miracca, I. Dehydrogenation of paraffins: Synergies between catalyst design and reactor engineering. Catal. Today 2006, 111, 133–139. [Google Scholar] [CrossRef]
  27. Sanfilippo, D. Dehydrogenations in fluidized bed: Catal. React. Eng. Catal. Today 2011, 178, 142–150. [Google Scholar] [CrossRef]
  28. Ma, Z.; Mo, Y.; Li, J.; An, C.; Liu, X. Optimization of PtSnK/Al2O3 isobutane dehydrogenation catalyst prepared by an impregnation-reduction method. J. Nat. Gas Sci. Eng. 2015, 27, 1035–1042. [Google Scholar] [CrossRef]
  29. Azimi, S.S.; Kalbasi, M. Three-phase modeling of dehydrogenation of isobutane to isobutene in a fluidized bed reactor: Effect of operating conditions on the energy consumption. Energy 2018, 149, 250–261. [Google Scholar] [CrossRef]
  30. Vernikovskaya, N.V.; Savin, I.G.; Kashkin, V.N.; Pakhomov, N.A.; Ermakova, A.; Molchanov, V.V.; Nemykina, E.L.; Parahin, O.A. Dehydrogenation of propane-isobutane mixture in a fluidized bed reactor over Cr2O3/Al2O3 catalyst: Experimental studies and mathematical modelling. Chem. Eng. J. 2011, 176, 158–164. [Google Scholar] [CrossRef]
  31. Matveyeva, A.N.; Zaitseva, N.A.; Mäki-Arvela, P.; Aho, A.; Bachina, A.K.; Fedorov, S.P.; Murzin, D.Y.; Pakhomov, N.A. Fluidized-bed isobutane dehydrogenation over alumina-supported Ga2O3 and Ga2O3/Al2O3 catalysts. Ind. Eng. Chem. Res. 2018, 57, 927–938. [Google Scholar] [CrossRef]
  32. Bekmukhamedov, G.E.; Morozov, V.I.; Tuktarov, R.R.; Bukharov, M.S.; Egorova, S.R.; Lamberov, A.A.; Yakhvarov, D.G. Electronic interaction between Cr3+ ions in chromia-alumina catalysts for light alkane dehydrogenation. J. Phys. Chem. Solids 2022, 167, 110778. [Google Scholar] [CrossRef]
  33. Egorova, S.R.; Tuktarov, R.R.; Boretskaya, A.V.; Laskin, A.I.; Gizyatullov, R.N.; Lamberov, A.A. Stabilizing effect of α-Cr2O3 on highly active phases and catalytic performance of a chromium alumina catalyst in the process of isobutane dehydrogenation. Mol. Catal. 2021, 509, 111610. [Google Scholar] [CrossRef]
  34. Lamberov, A.A.; Egorova, S.R.; Gilmanov, K.K.; Kataev, A.N.; Bekmukhamedov, G.E. Pilot Tests of the Microspherical Aluminochromium KDI-M Catalyst for iso-Butane Dehydrogenation. Catal. Ind. 2017, 9, 17–22. [Google Scholar] [CrossRef]
  35. Bekmukhamedov, G.E.; Mukhamed’yarova, A.N.; Egorova, S.R.; Lamberov, A.A. Modification by SiO2 of Alumina Support for Light Alkane Dehydrogenation Catalysts. Catalysts 2016, 6, 162. [Google Scholar] [CrossRef] [Green Version]
  36. Bekmukhamedov, G.E.; Egorova, S.R.; Lamberov, A.A. Effect of the Nature of Silicon Oxide Structures on the Activity of an Alumina–Chromium Catalyst in the Reaction of iso-Butane Dehydrogenation. Catal. Ind. 2014, 6, 44–52. [Google Scholar] [CrossRef]
  37. Egorova, S.R.; Bekmukhamedov, G.E.; Lamberov, A.A. Effect of High_Temperature Treatment on the Properties of an Alumina–Chromium Catalyst for the Dehydrogenation of Lower Paraffins. Kinet. Catal. 2013, 54, 49–58. [Google Scholar] [CrossRef]
  38. Ding, J.; Gidaspow, D. A bubbling fluidization model using kinetic theory of granular flow. AIChE J. 1990, 36, 523–538. [Google Scholar] [CrossRef]
  39. Gidaspow, D. Multiphase Flow and Fluidization; Academic Press: Cambridge, MA, USA, 1994. [Google Scholar]
  40. Solov’ev, S.A.; Egorov, A.G.; Lamberov, A.A.; Egorova, S.R.; Kataev, A.N. Effect of the design of a feedstock injection device in a fluidized bed reactor on the efficiency of the reaction, using the dehydrogenation of iso-paraffins in a fluidized chromia-alumina catalyst bed as an example. Catal. Ind. 2016, 8, 48–55. [Google Scholar] [CrossRef]
  41. Soloveva, O.V.; Solovev, S.A.; Egorova, S.R.; Lamberov, A.A.; Antipin, A.V.; Shamsutdinov, E.V. CFD modeling a fluidized bed large scale reactor with various internal elements near the heated particles feeder. Chem. Eng. Res. Des. 2018, 138, 212–228. [Google Scholar] [CrossRef]
  42. Ogawa, S.; Umemura, A.; Oshima, N. On the equation of fully fluidized granular materials. J. Appl. Math. Phys. 1980, 31, 483–493. [Google Scholar] [CrossRef]
  43. Lun, C.K.K.; Savage, S.B.; Jeffrey, D.J. Kinetic theories for granular flow: Inelastic particles in couette flow and slightlyinelastic particles in a general flow field. J. Fluid Mech. 1984, 140, 223–256. [Google Scholar] [CrossRef]
  44. Gunn, D.J. Transfer of heat or mass to particles in fixed and fluidized beds. Int. J. Heat Mass Transf. 1978, 21, 467–476. [Google Scholar] [CrossRef]
  45. Gobin, A.; Neau, H.; Simonin, O.; Llinas, J.; Reiling, V.; Selo, J. Numerical simulations of a gas-phase polymerization reactor. In Proceedings of the European Congress on Computational Methods in Applied Sciences and Engineering, Wales, UK, 4–7 September 2001. [Google Scholar]
  46. Cornelissen, J.T.; Taghipour, F.; Escudie, R.; Ellis, N.; Grace, J.R. CFD modelling of a liquid–solid fluidized bed. Chem. Eng. Sci. 2007, 62, 6334–6348. [Google Scholar] [CrossRef]
Figure 1. Laboratory reactor: (a) experimental reactor scheme; (b) 3D model of computational domain.
Chemengineering 06 00098 g001
Figure 2. Mesh: (a) graphical example; (b) definition of optimal Δ x .
Chemengineering 06 00098 g002
Figure 3. Solid phase volume fraction for the case of a catalyst mass of 100 g, a gas velocity of 0.016 m/s and a temperature of 575 °C.
Chemengineering 06 00098 g003
Figure 4. The mass fraction of reaction products for the case of catalyst mass of 100 g, a gas velocity of 0.016 m/s, and temperature of 575 °C: (a) C4H10 and C4H8; (b) H2, CH4, C4H8 and C4H6.
Chemengineering 06 00098 g004
Figure 5. The mass fraction of isobutane dehydrogenation reaction products for the case of a catalyst mass of 100 g, a gas velocity of 0.016 m/s, and temperature of 575 °C: (a) C4H10; (b) C4H8; and (c) H2.
Chemengineering 06 00098 g005
Figure 6. Mass fraction of side reaction products for the case of a catalyst mass of 100 g, a gas velocity of 0.016 m/s, and temperature of 575 °C: (a) CH4; (b) C3H6; and (c) C3H8.
Chemengineering 06 00098 g006
Figure 7. The mass fraction of reaction products for the case of catalyst mass of 75 g: (a) C4H10 and C4H8 at v = 0.008 m/s; (b) H2, CH4, C3H8, C3H6 at v = 0.008 m/s; (c) C4H10 and C4H8 at v = 0.012 m/s; (d) H2, CH4, C3H8, C3H6 at v = 0.012 m/s; (e) C4H10 and C4H8 at v = 0.016 m/s; and (f) H2, CH4, C3H8, C3H6 at v = 0.016 m/s.
Chemengineering 06 00098 g007
Figure 8. The mass fraction of reaction products for the case of catalyst mass of 100 g: (a) C4H10 and C4H8 at v = 0.008 m/s; (b) H2, CH4, C3H8, C3H6 at v = 0.008 m/s; (c) C4H10 and C4H8 at v = 0.012 m/s; (d) H2, CH4, C3H8, C3H6 at v = 0.012 m/s; (e) C4H10 and C4H8 at v = 0.016 m/s; and (f) H2, CH4, C3H8, C3H6 at v = 0.016 m/s.
Chemengineering 06 00098 g008
Figure 9. The mass fraction of reaction products for the case of catalyst mass of 125 g: (a) C4H10 and C4H8 at v = 0.008 m/s; (b) H2, CH4, C3H8, C3H6 at v = 0.008 m/s; (c) C4H10 and C4H8 at v = 0.012 m/s; (d) H2, CH4, C3H8, C3H6 at v = 0.012 m/s; (e) C4H10 and C4H8 at v = 0.016 m/s; and (f) H2, CH4, C3H8, C3H6 at v = 0.016 m/s.
Chemengineering 06 00098 g009
Table 1. Experiment conditions.
NameValue
Catalyst mass, g75, 100, 125
Gas rate, m/s0.008, 0.012, 0.016
Temperature, °C550, 575, 600, 625
Table 2. Parameters for models of chemical reactions.
ReactionPre-Exponential Factor A r Activation Energy E r , kJ/mol
Isobutane dehydrogenation (27)1.5 × 109117
Thermal cracking (28)2.0 × 109120
Propylene hydrogenation (29)1.8 × 109121
Publisher’s Note: MDPI stays neutral with regard to jurisdictional claims in published maps and institutional affiliations.

