Article

Simulation for the Performance and Economic Evaluation of Conventional Activated Sludge Process Replacing by Sequencing Batch Reactor Technology in a Petroleum Refinery Wastewater Treatment Plant

by
Shahryar Jafarinejad
Department of Chemical Engineering, College of Engineering, Tuskegee University, Tuskegee, AL 36088, USA
ChemEngineering 2019, 3(2), 45; https://doi.org/10.3390/chemengineering3020045
Submission received: 14 March 2019 / Revised: 16 April 2019 / Accepted: 29 April 2019 / Published: 3 May 2019

Abstract

:
Treatment of the petroleum refinery wastewater containing complex chemicals using biological processes is usually challenging because of the inhibition and/or toxicity of these matters when they serve as microbial substrates. In addition, performance modeling and cost evaluation of processes are essential for designing, construction, and forecasting future economic requirements of the petroleum refinery wastewater treatment plants (PRWWTPs). In this study, the performance and economics of conventional activated sludge (CAS) process replacing by sequencing batch reactor (SBR) technology in a two train PRWWTP were evaluated using simulation. The final treated effluent characteristics for the PRWWTPs containing CAS + CAS and SBR + CAS processes under steady state conditions were studied and evolution of the main parameters of the final effluent during the 30 days of simulation for these plants were investigated. Finally, the total project construction, operation labor, maintenance, material, chemical, energy, and amortization costs of these plants were estimated and compared. Results demonstrated that the project construction cost of PRWWTP containing CAS + CAS processes was lower than that of PRWWTP containing SBR + CAS processes and the energy and amortization costs for both plants were higher in comparison with the operation, maintenance, material, and chemical costs. Note that this study is a computer simulation and drawing general conclusions only on the basis of computer simulation may be insufficient.

Graphical Abstract

1. Introduction

Large amounts of wastewaters containing different contaminants (e.g., oil, phenols, sulfides, dissolved solids, suspended solids, toxic metals, biological oxygen demand (BOD)-bearing materials) can be generated in the petroleum refinery [1,2,3,4,5,6,7], which poses a problem for managing and treating these complex wastewaters [5,8]. Compliance with the regulations set by regulatory agencies, the related harm prevention on the surrounding environment, and water reuse issues can be the driving forces for the petroleum refinery to treat wastewaters with appropriate treatment technologies [5,9].
Process wastewater pretreatment, primary treatment, secondary treatment, and tertiary treatment or polishing are different techniques and/or steps of petroleum refinery wastewater treatment [3,4,5,10,11,12,13,14]. In secondary treatment, microorganisms can degrade dissolved oil and other organic pollutants present in the petroleum refinery wastewater [3,4,5,10]. Suspended growth processes (e.g., conventional activated sludge (CAS) process, powdered activated carbon treatment (PACT) process, sequencing batch reactors (SBRs), continuous stirred tank bioreactor (CSTB), membrane bioreactors (MBRs), deep shaft process, and aerated lagoons) and attached growth processes (e.g., trickling filters (TFs), fluidized bed bioreactor (FBB), and rotating biological contactor (RBC)) are biological treatment processes that have been applied in the petroleum industry [3,5,12,15,16].
The CAS process has been the most commonly utilized biological treatment method in the petroleum refinery [3,4,17]. In conventional biological processes, both the flow and composition changing of the wastewater can usually impede the treatment system [3,18,19,20]. In some cases, common continuous flow processes such as CAS may encounter serious problems to meet the regulated discharge limits. Treatment of the petroleum refinery wastewater containing complex chemicals using biological processes is usually challenging because of the inhibition and/or toxicity of these matters when they serve as microbial substrates. Use of discontinuous systems such as SBR technology, which promote the mineralization of the petroleum refinery wastewaters containing toxic chemicals can be promising [4,20]. At an industrial scale, 88–95% BOD reduction and 98–99% phenol removal from refinery wastewater using the CAS process have been reported [21]. Additionally, using a hydraulic retention time (HRT) of 36 h and sludge retention time (SRT) of 40 days, the total COD in the petroleum refinery wastewater by the SBR process has been reported to decrease to 50–150 mg/L [22]. Jafarinejad reviewed the application of SBR technology for the petroleum industry wastewater treatment [4].
In the petroleum refinery wastewater treatment plant (PRWWTP) design, in addition to improving effluent quality, it is necessary to optimize energy consumption and decrease the use of chemicals in the treatment system [23,24]. Computer simulation is a useful tool in the analysis of the performance, effectiveness, and economics of wastewater treatment plants (WWTPs) [25,26]. In reality, technical and economic simulation of processes are necessary for designing PRWWTPs. Cost prediction prepares a powerful tool for design, construction, and forecasting future economic requirements [24]. Some researchers have carried out mathematical modeling and simulation of WWTPs [24,25,26,27,28,29,30,31,32,33,34]; but, as far as I know, there is no research on modeling and simulation for the application of SBR technology in the PRWWTP. In this study, the performance and economics of the CAS process replacing by SBR technology in a two train PRWWTP were evaluated using a simulation. The analysis of performance and effectiveness of PRWWTPs was done using the GPS-X software package developed by Hydromantis Inc and cost estimation to build, operate, and maintain the PRWWTPs was performed using CapdetWorks with equipment costing database Sept 2007 (USA, Avg). The final treated effluent characteristics for the PRWWTPs containing CAS + CAS and SBR + CAS processes under steady state conditions were studied, and evolution of the main parameters of the final effluent during the 30 days of simulation for these plants were investigated. In addition, the costs of these plants were estimated and compared.

2. Materials and Methods

2.1. Case Study and Influent Wastewater

In order to base the study on a real case for simulations, a PRWWTP in Iran was selected. The purpose of this plant is to process the refinery wastewater effluent and make water disposal of proper quality for discharge or use as cooling towers make-up. The plant includes two independent trains suitable for parallel operation, each equipped with a manual inlet sluice gate for possible isolation. This plant consists of two American Petroleum Institute (API) separators, two equalization basins, pH control injection facilities, polyelectrolyte injection, a static mixer, ferric chloride injection, two air flotation units, nutrient injection system, two aeration basins, two clarifiers, an aerobic digester, three sand filter units, and two chlorination units. Continuous on-stream monitoring of the filter effluent is maintained by a total organic carbon (TOC) analyzer with the capability of diverting to the evaporation pond or to the air flotation diversion box if quality does not meet cooling tower makeup specifications. The characteristics of influent wastewater (API effluent) for performance modeling and cost estimation of the PRWWTPs are given in Table 1. It is necessary to note that for performance modeling and cost estimation, values of volatile solids (%), soluble chemical oxygen demand (COD), soluble BOD, Total Kjeldahl Nitrogen (TKN), soluble TKN, total phosphorus, pH, cations, anions, settleable solids, and non-degradable fraction of volatile suspended solids (VSS) were assumed by author.

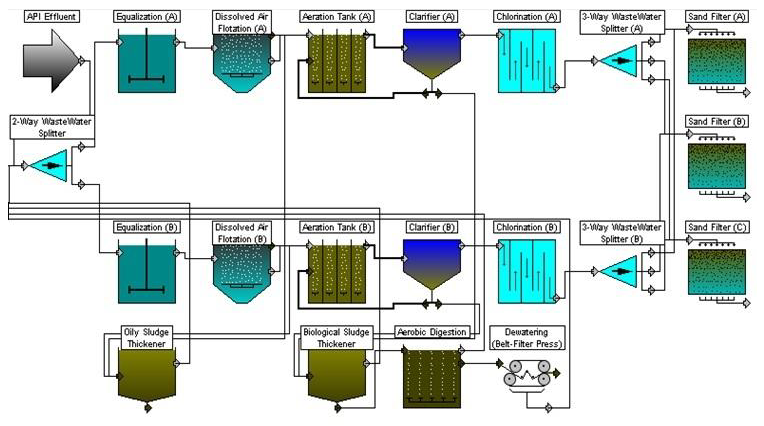
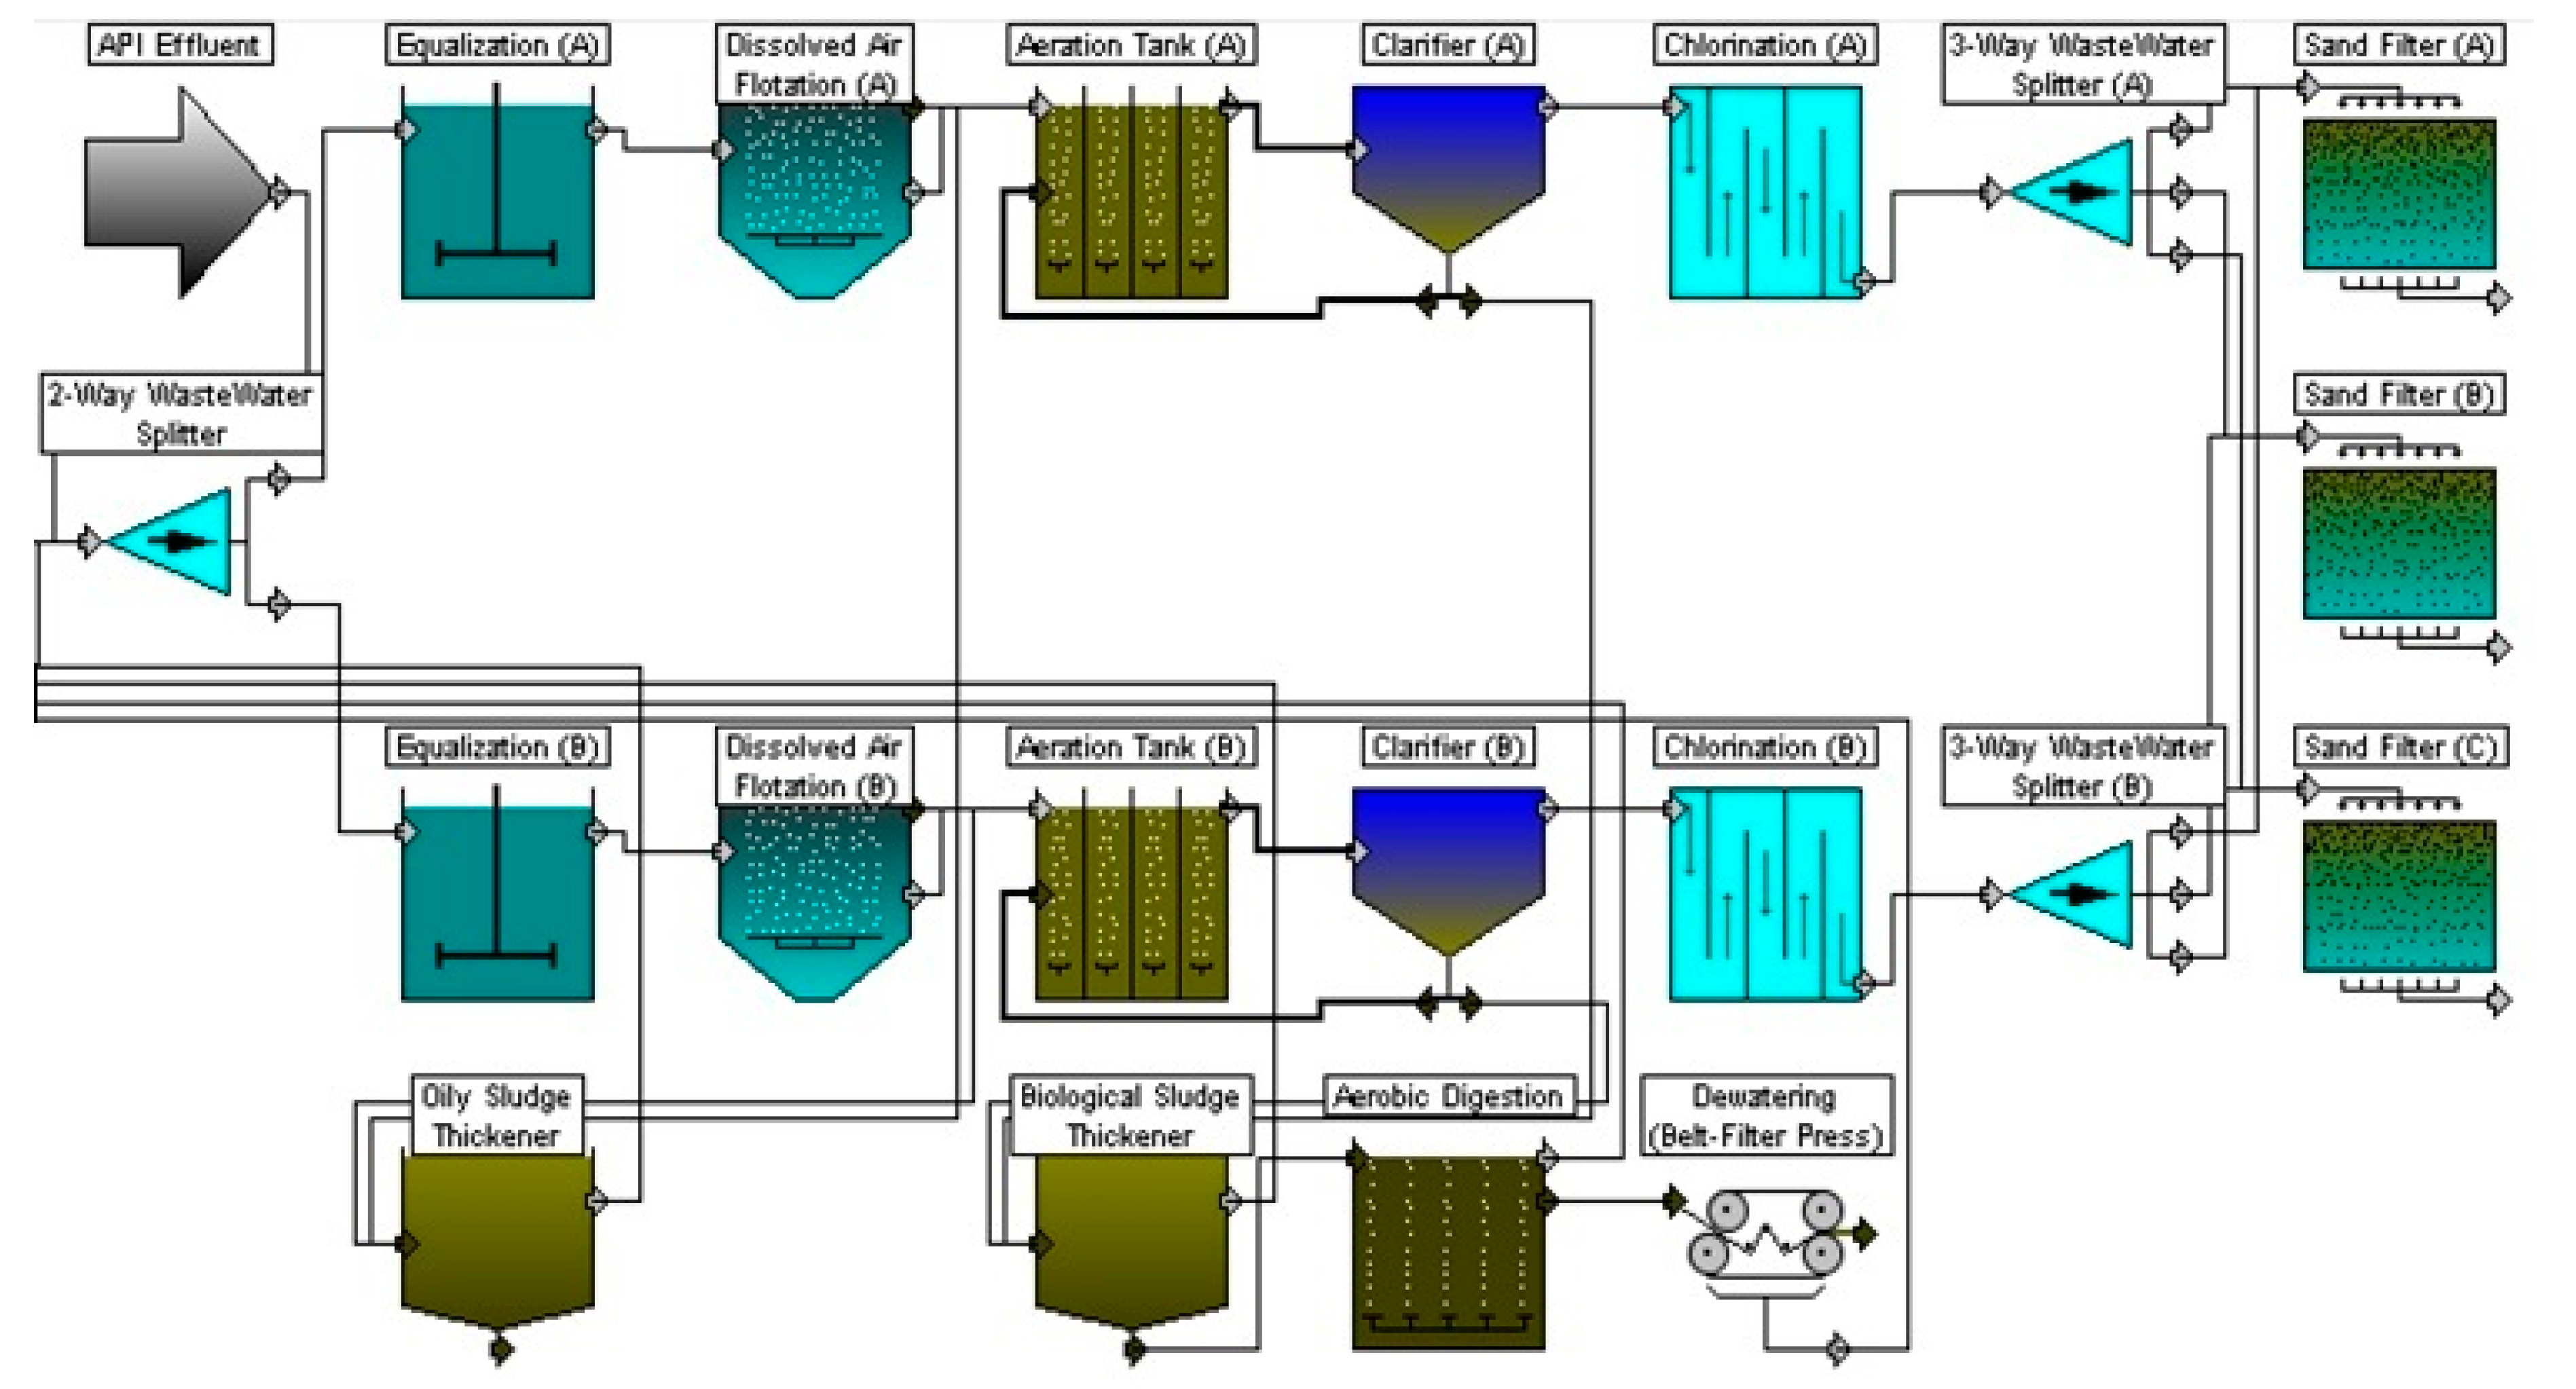
2.2. PRWWTP Containing CAS Process

An aeration tank, a settling tank (clarifier), and a sludge return line to treat wastewater are applied in the CAS process. To provide the necessary oxygen and adequate mixing of the influent wastewater and return activated sludge (RAS), diffused or mechanical aeration is utilized, which allows absorption, flocculation, and synthesis of the organic matter to occur during aeration. A high ratio of organic loading (i.e., feed/microorganism (F/M)) to the mixed liquor at the beginning of the tank is the major characteristic of a plug flow type. As a plug flow tank has little longitudinal mixing except for that which is caused by diffused aeration, substrate can be used up with liquor flowing through its length and the mass of microorganisms can be enhanced due to cell reproduction. Much of the oxygen can be consumed by nitrification and endogenous respiration if the F/M is sufficiently low in the latter stages of the tank. The lack of longitudinal mixing can decrease the ability to handle shock loads; there is little dilution of the inflow so toxic material may affect microorganisms. Discouraging the excessive growth of filamentous organisms that can cause settlement problems in the secondary clarifier is the main advantage of the plug flow activated sludge process [3,15,24].
A process flow diagram (PFD) of the PRWWTP containing CAS process is shown in Figure 1. This plant consists of equalization tanks (A/B), coagulant addition line, dissolved air flotation (DAF) tanks (A/B), aeration tanks or plug flow activated sludge tanks (A/B), secondary clarifiers (A/B), chlorination tanks (A/B), sand filters (A/B/C), oily sludge thickener, biological sludge thickener, aerobic digestion tank, and dewatering equipment or a belt-filter press. Note that API separators are not simulated in this study and API effluent is used as influent wastewater for this simulation. The tank type was a concrete basin and tank volume, tank depth, minimum water level in tank, air flow into aeration tank, pressure correction coefficient, alpha factor for oxygen transfer in wastewater, beta factor for oxygen saturation in wastewater in equalization tanks were 2000 m3, 3 m, 2.8 m, 31,200 m3/d, 1, 0.9, and 0.95, respectively. Ferric ion was applied as coagulant and its chemical dosage was 16 kgMe/d. The diameter of the DAF tank, maximum water level, air pressure, detention time in floating tank, hydraulic loading rate, air/solids ratio, and polymer dosage were 4.7 m, 2.5 m, 4.8 bar, 0.5 h, 60.337 m3/(m2·d), 0.15, and 0.001 g/kg, respectively. Details of the CAS process parameters are given in Table 2. Default values in the software were selected for all other parameters that have not been given in Table 2. Type of secondary clarifier was circular and flat bottom and the diameter of clarifier, surface overflow rate, side water depth, specific gravity, underflow concentration, and weir overflow rate maximum were 11 m, 0.69 m3/(m2·h), 4.5 m, 1.03, 1%, and 186.3 m3/(m·d), respectively. Tank volume, contact time at peak flow, chlorine dose, rate of kill, and influent coliform count in chlorination were 30 m3, 30 min, 2 mg/L, 0.5 m3/(g·min), and 107/100 mL, respectively. The characteristics of sand filtration process parameters for simulation are listed in Table 3. The oily sludge thickener was a gravity type thickener where the surface area, depth, and mass loading in this thickener were 7 m2, 4 m, and 68 kg/(m2·d), respectively. In addition, the biological sludge thickener was a gravity type thickener where the surface area, depth, and mass loading in the thickener were 12.5 m2, 4.5 m, and 19.6 kg/(m2·d), respectively. The maximum volume, depth, detention time, volatile solids destroyed, mixed liquor solids, digested sludge concentration, and temperature in aerobic digestion were 234 m3, 4.7 m, 15 d, 40%, 12,000 mg/L, 2.5%, and 23°C, respectively. Aeration type in aerobic digestion was diffusion aeration and air flow into aeration tank was 10,200 m3/d, where the alpha factor for oxygen transfer in wastewater, beta factor for oxygen saturation in wastewater, coarse bubble minimum air flow, and standard oxygen transfer efficiency were 0.7, 0.95, 0.33 L/s/m3, and 6%, respectively. The filter press surface, cake solids content, density of cake, operating schedule per day, days operating per week, hydraulic loading per meter of belt press width, polymer dose and filtrate solid concentration in belt-filter press or dewatering were 10 m2, 25%, 1201.4 kg/m3, 8 h/d, 5 d/wk, 381.6 m3/d, 0.5% dry wt, and 100 mg/L, respectively. Default values in the software were selected for all other parameters that have not been given here.

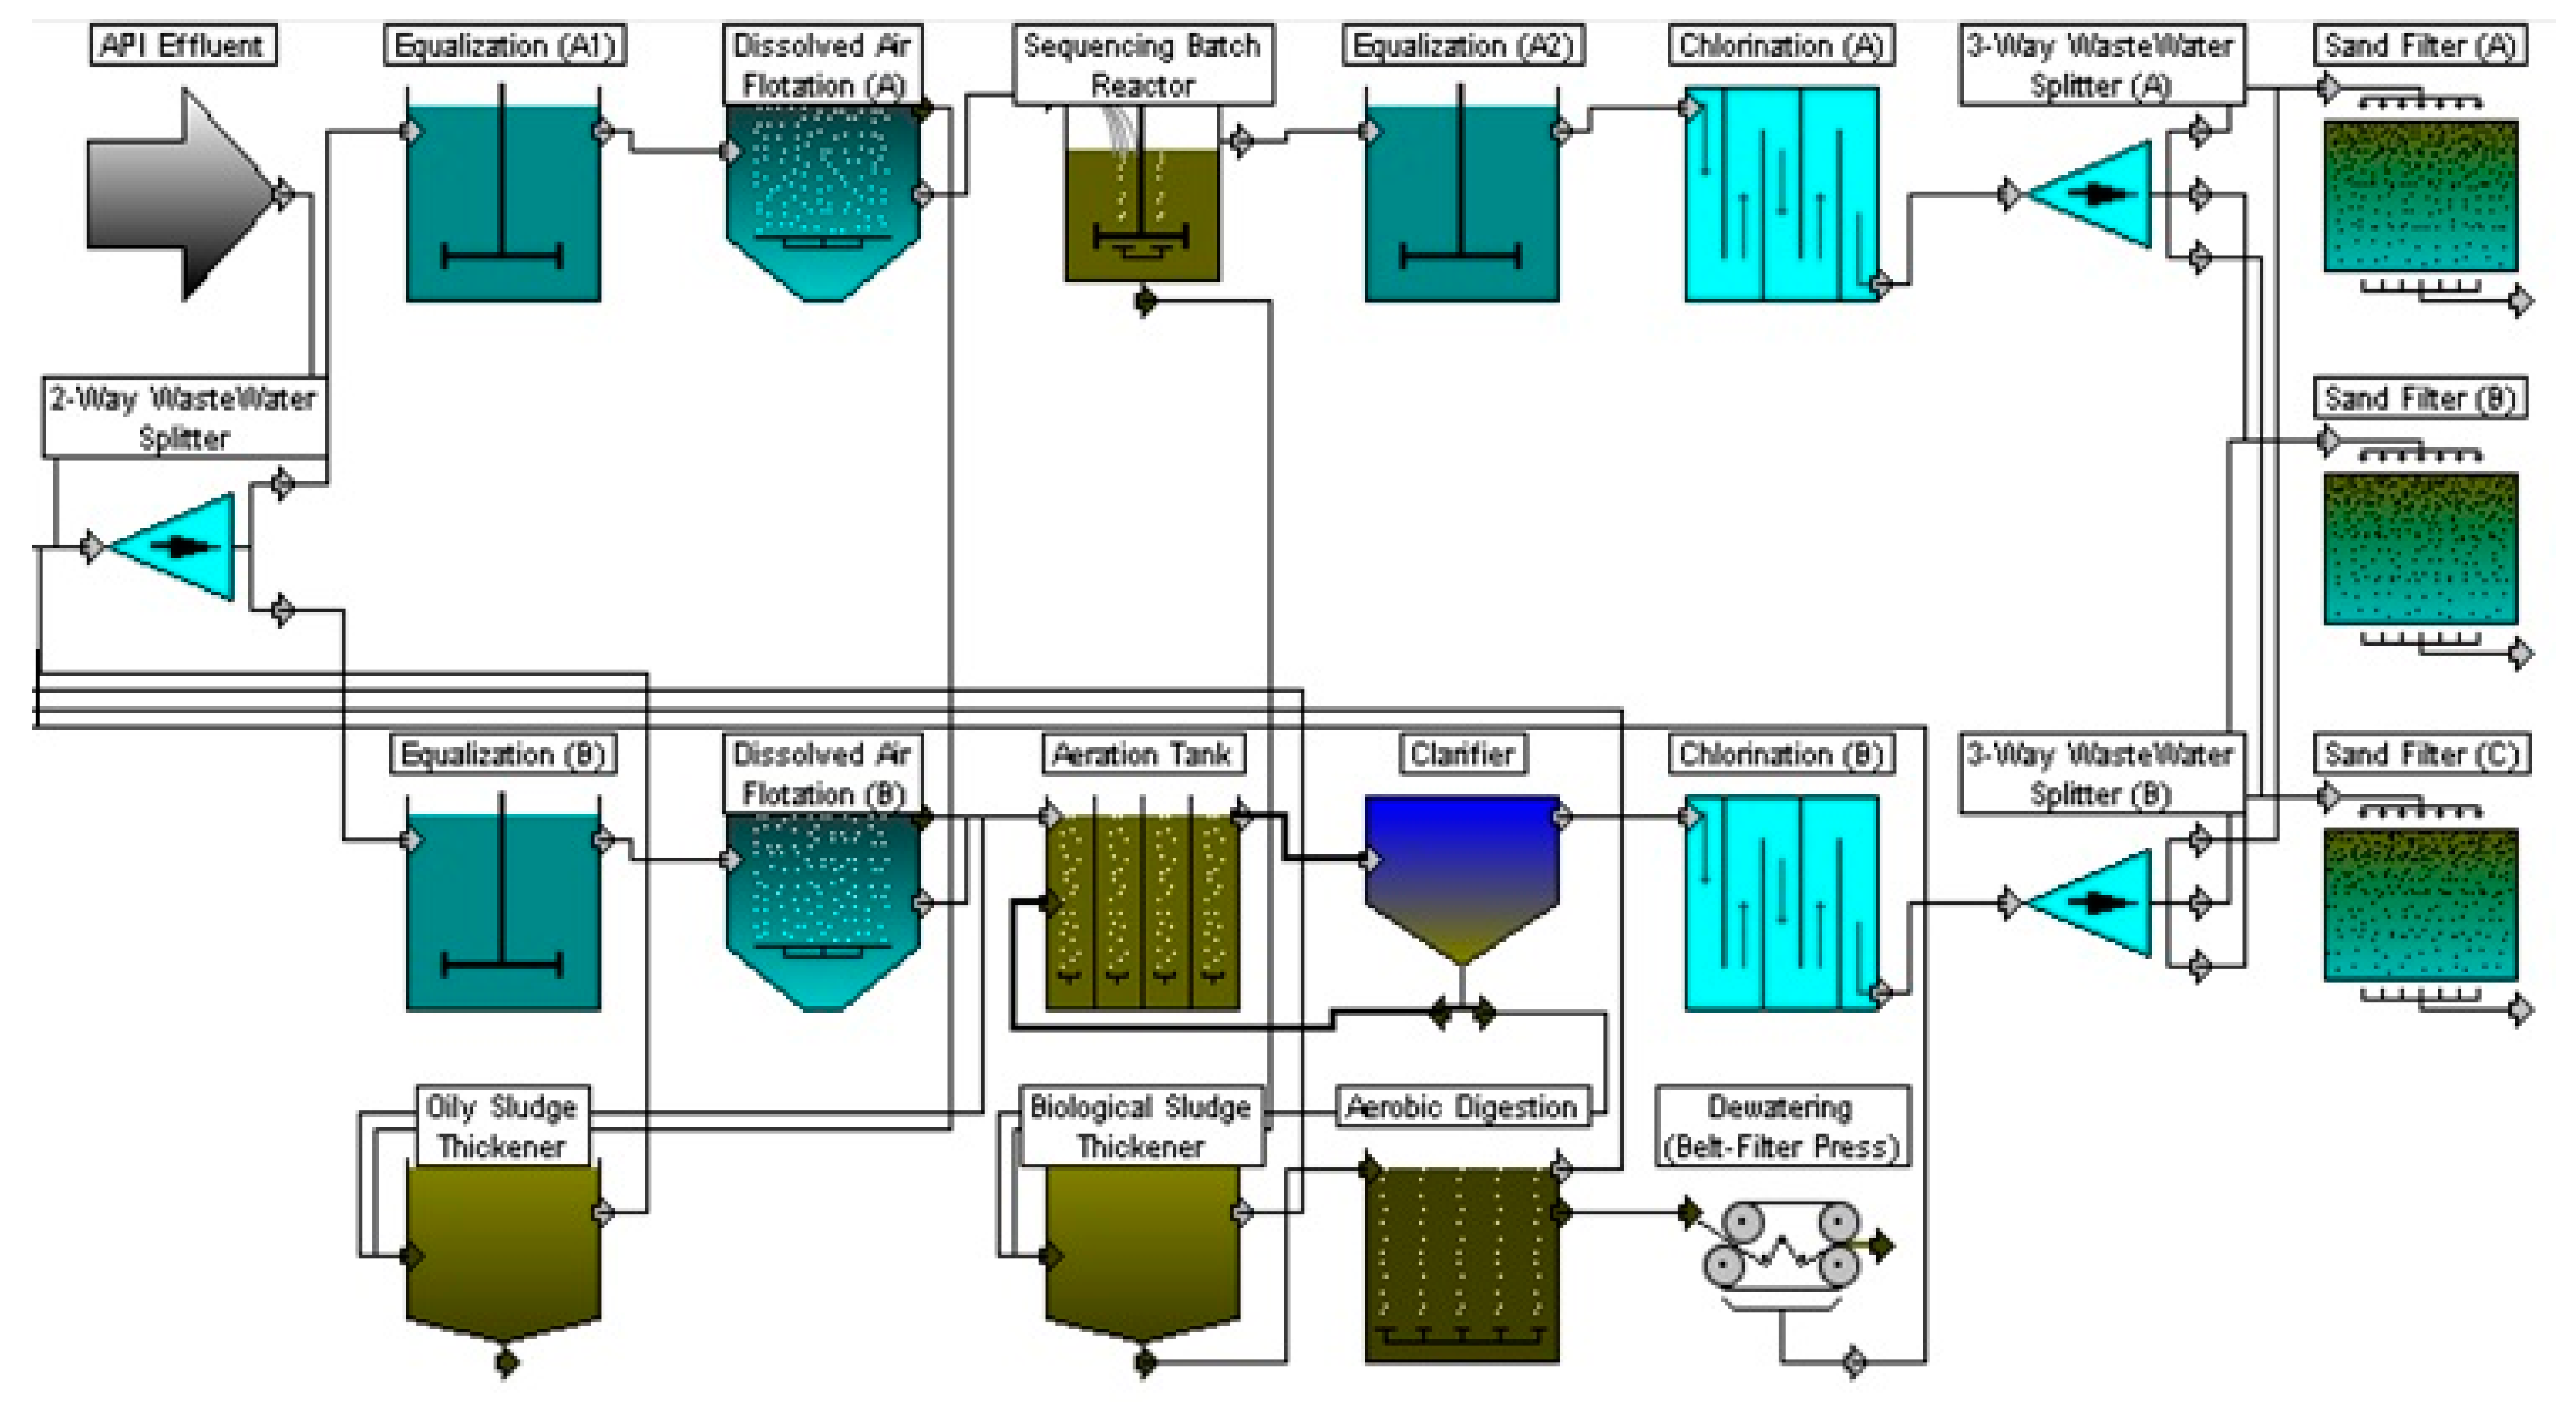
2.3. PRWWTP Containing SBR Process

The SBR technology is a fill-and-draw activated sludge process for aerobic and anaerobic treatment of both municipal and industrial wastewater where equalization, aeration, and clarification can all be achieved using a single batch reactor. This system does not need a clarifier. Two or more batch reactors can be applied in a predetermined sequence of operations for optimization of the process performance. Fill, react, settle, draw, and idle are five steps of the operation of an SBR. These steps may be changed for different operational uses. SBRs are usually designed in time (i.e., aerobic cycle time); whereas, the CAS process or plug flow tanks are designed in space (i.e., reactors of a certain volume with a certain HRT). SBRs are usually applied at flow rates of 219 L/s (5MGD) or less. Application of these systems is discouraged for large flow rates due to the more sophisticated operation needed at larger SBR plants. This technology is specially suggested for low flow rates (e.g., wastewater flow rates of less than 22 L/s (0.5MGD)) [3,4,15,24,35,36]. SBR performance can be affected by organic loading rate, HRT, SRT, dissolved oxygen (DO), and influent characteristics such as COD, solids content, and C/N ratio [3,37,38].
A process flow diagram of the PRWWTP containing SBR process is shown in Figure 2. This plant consists of equalization tanks (A1/A2/B), coagulant addition line, DAF (A/B), SBR, aeration tank or plug flow activated sludge tank, secondary clarifier, chlorination tanks (A/B), sand filters (A/B/C), oily sludge thickener, biological sludge thickener, aerobic digestion tank, and dewatering equipment or belt-filter press. An equalization tank is usually needed prior to the chlorination unit in batch SBRs in order to store large volumes of water. When the flow is not equalized, a sizable filter may be necessary to accommodate the large flow of water entering the chlorination system [39]. The characteristics and operational conditions of equalization tanks, coagulant addition, DAF, aeration tank, secondary clarifier, chlorination, sand filters, oily sludge thickener, biological sludge thickener, aerobic digestion, and belt-filter press are the same as that of PRWWTP containing CAS process. The details of the SBR process have been given in Table 4. Default values in the software were selected for all other parameters that have not been given in Table 4.

2.4. Simulation Methods

Analysis of the performance and effectiveness of PRWWTPs was done using the GPS-X software package developed by Hydromantis Inc, which is a modular, powerful, multi-purpose modeling environment for the simulation of municipal and industrial WWTPs [26,27,28].
A collection of wastewater process models using a set of basic wastewater components, or state variables in GPS-X is called a library Hydromantis Inc. 2011 [26]. In this study, since there was an interest in modeling carbon and nitrogen, the carbon, nitrogen (cnlib) library was selected. Selected models used for different unit operation in PRWWTPs for simulation are given in Table 5. The COD-states influent model was used for influent characterization, and the Mantis model was applied for biological processes. The mantis model is identical to the International Association on Water Pollution Research and Control (IAWPRC) Activated Sludge Model No. 1 (ASM1) with some modifications:
(i)
Introduction of two additional growth processes, one for the autotrophic organisms and one for the heterotrophic organisms;
(ii)
Use of the temperature-dependent kinetic parameters by Arrhenius equation [26].
(iii)
Introduction of aerobic denitrification in the model according to the Münch modification [40].
The final treated effluent characteristics for the PRWWTPs containing CAS + CAS and SBR + CAS processes under steady state conditions were studied and evolution of the main parameters of the final effluent during the 30 days of simulation for these plants were investigated.
The planning level design and costing productivity can be improved by economic modeling and simulation that can lead to better engineering decisions. In this study, CapdetWorks 2.5 with equipment costing database Sept 2007 (USA, Avg) was used for cost estimation to build, operate and maintain the PRWWTPs. CapdetWorks calculates all the costs—total project construction, total operation, maintenance, material, chemical, energy, and amortization for each treatment alternative [24].

3. Results and Discussion

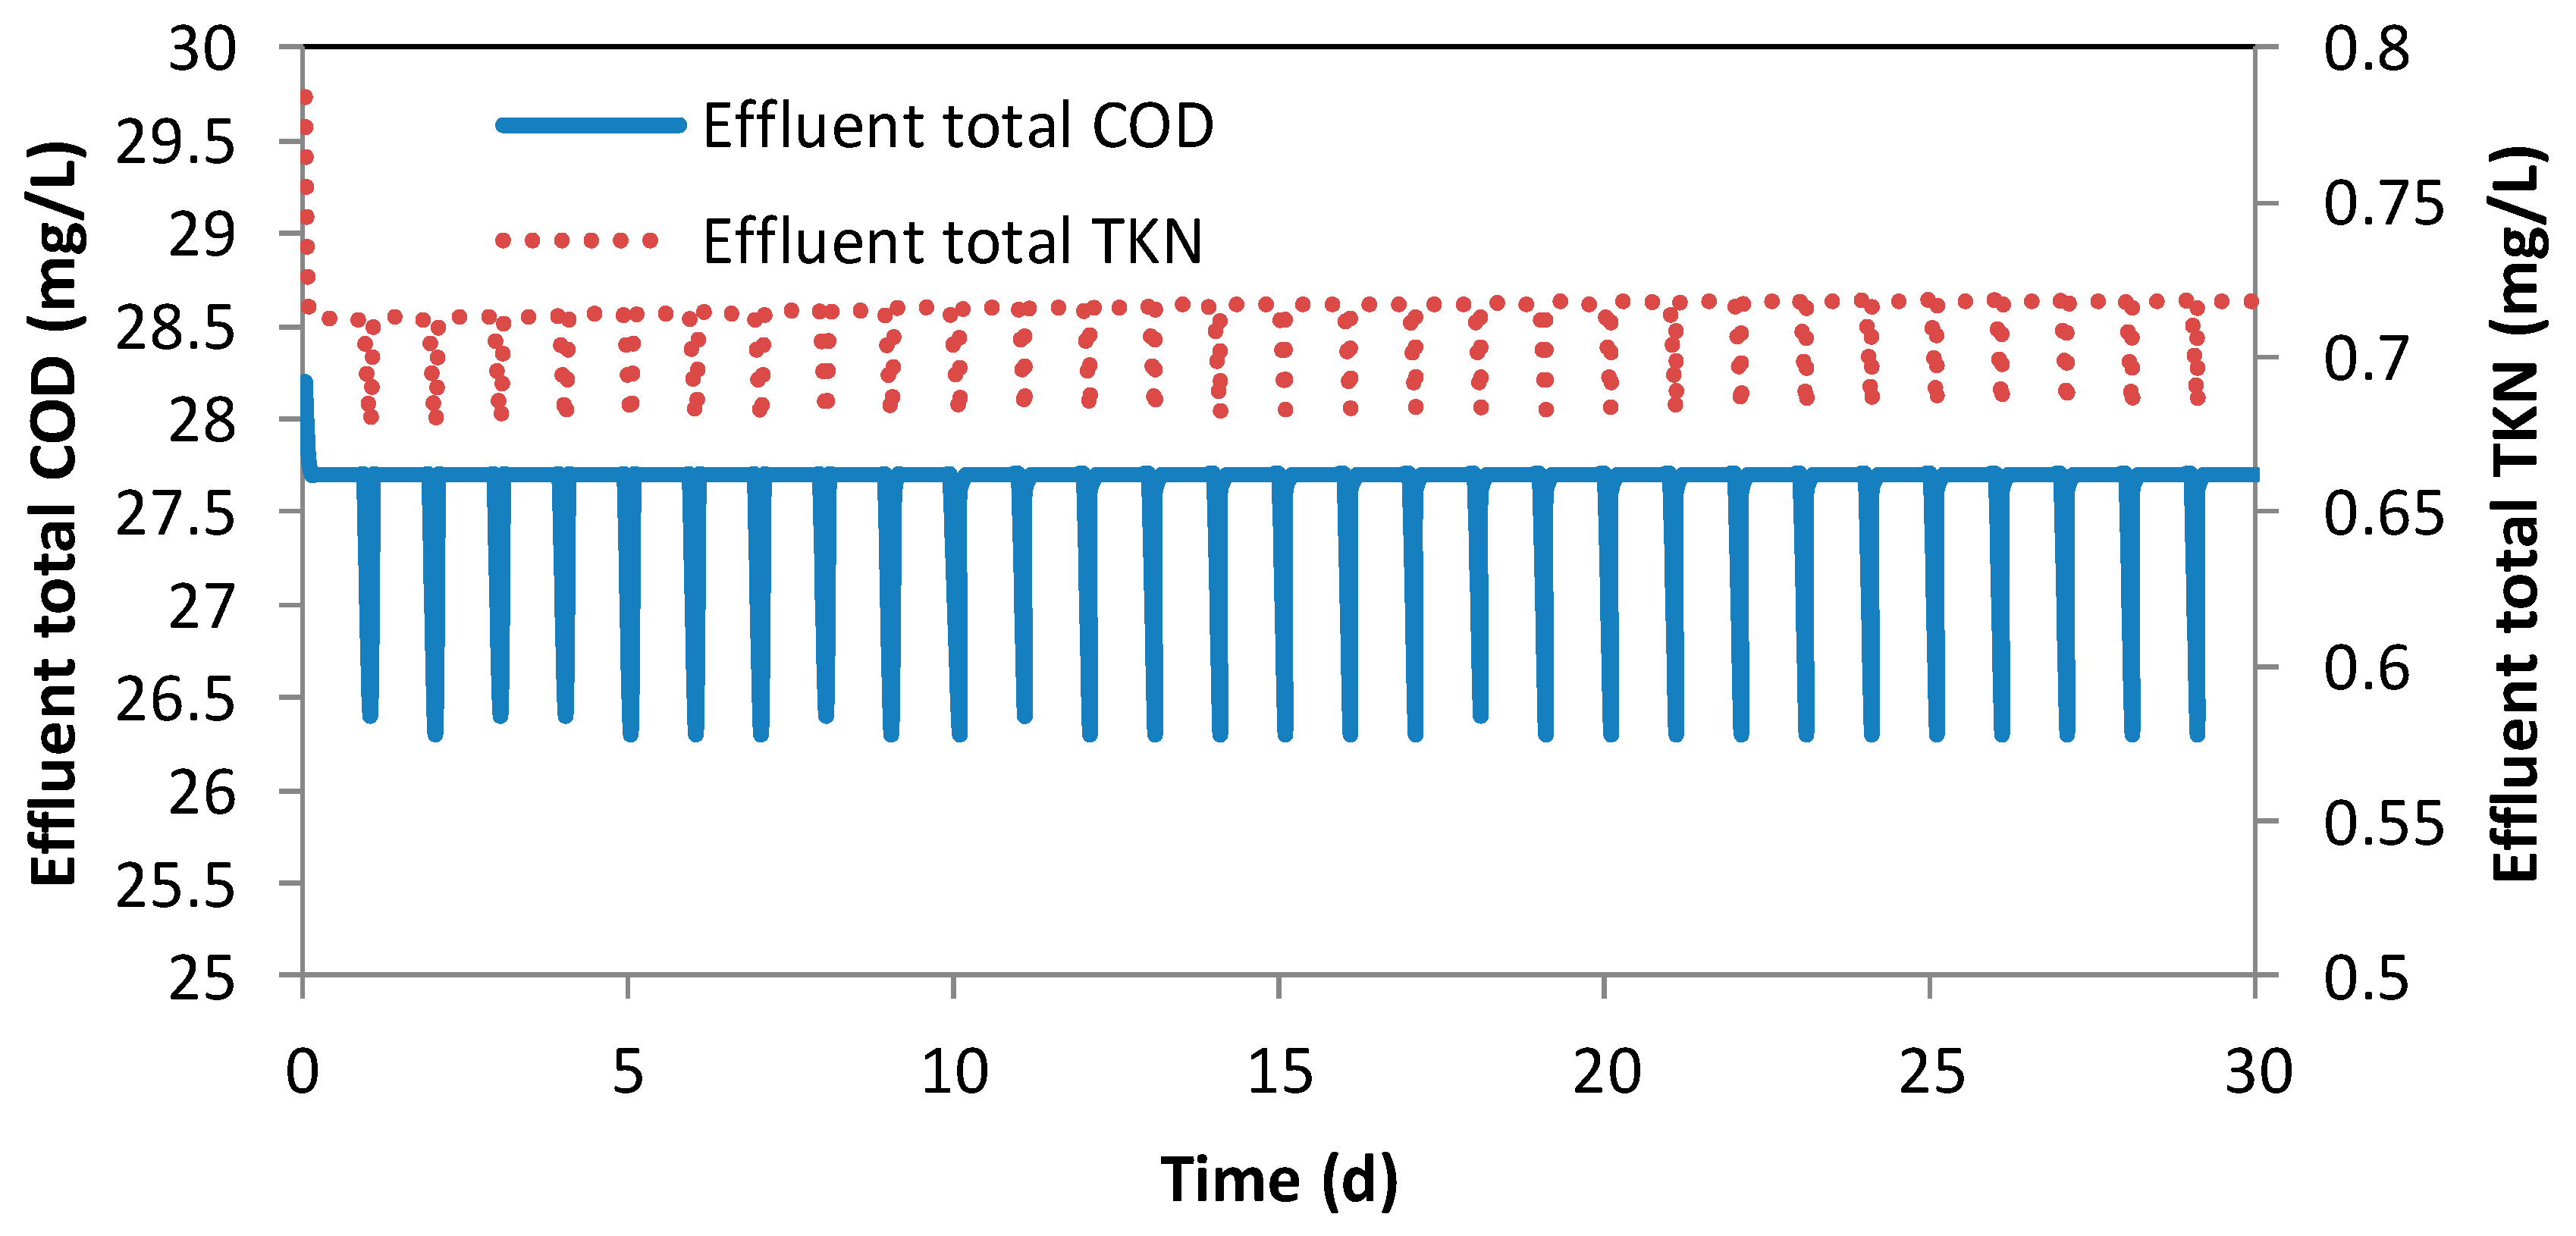
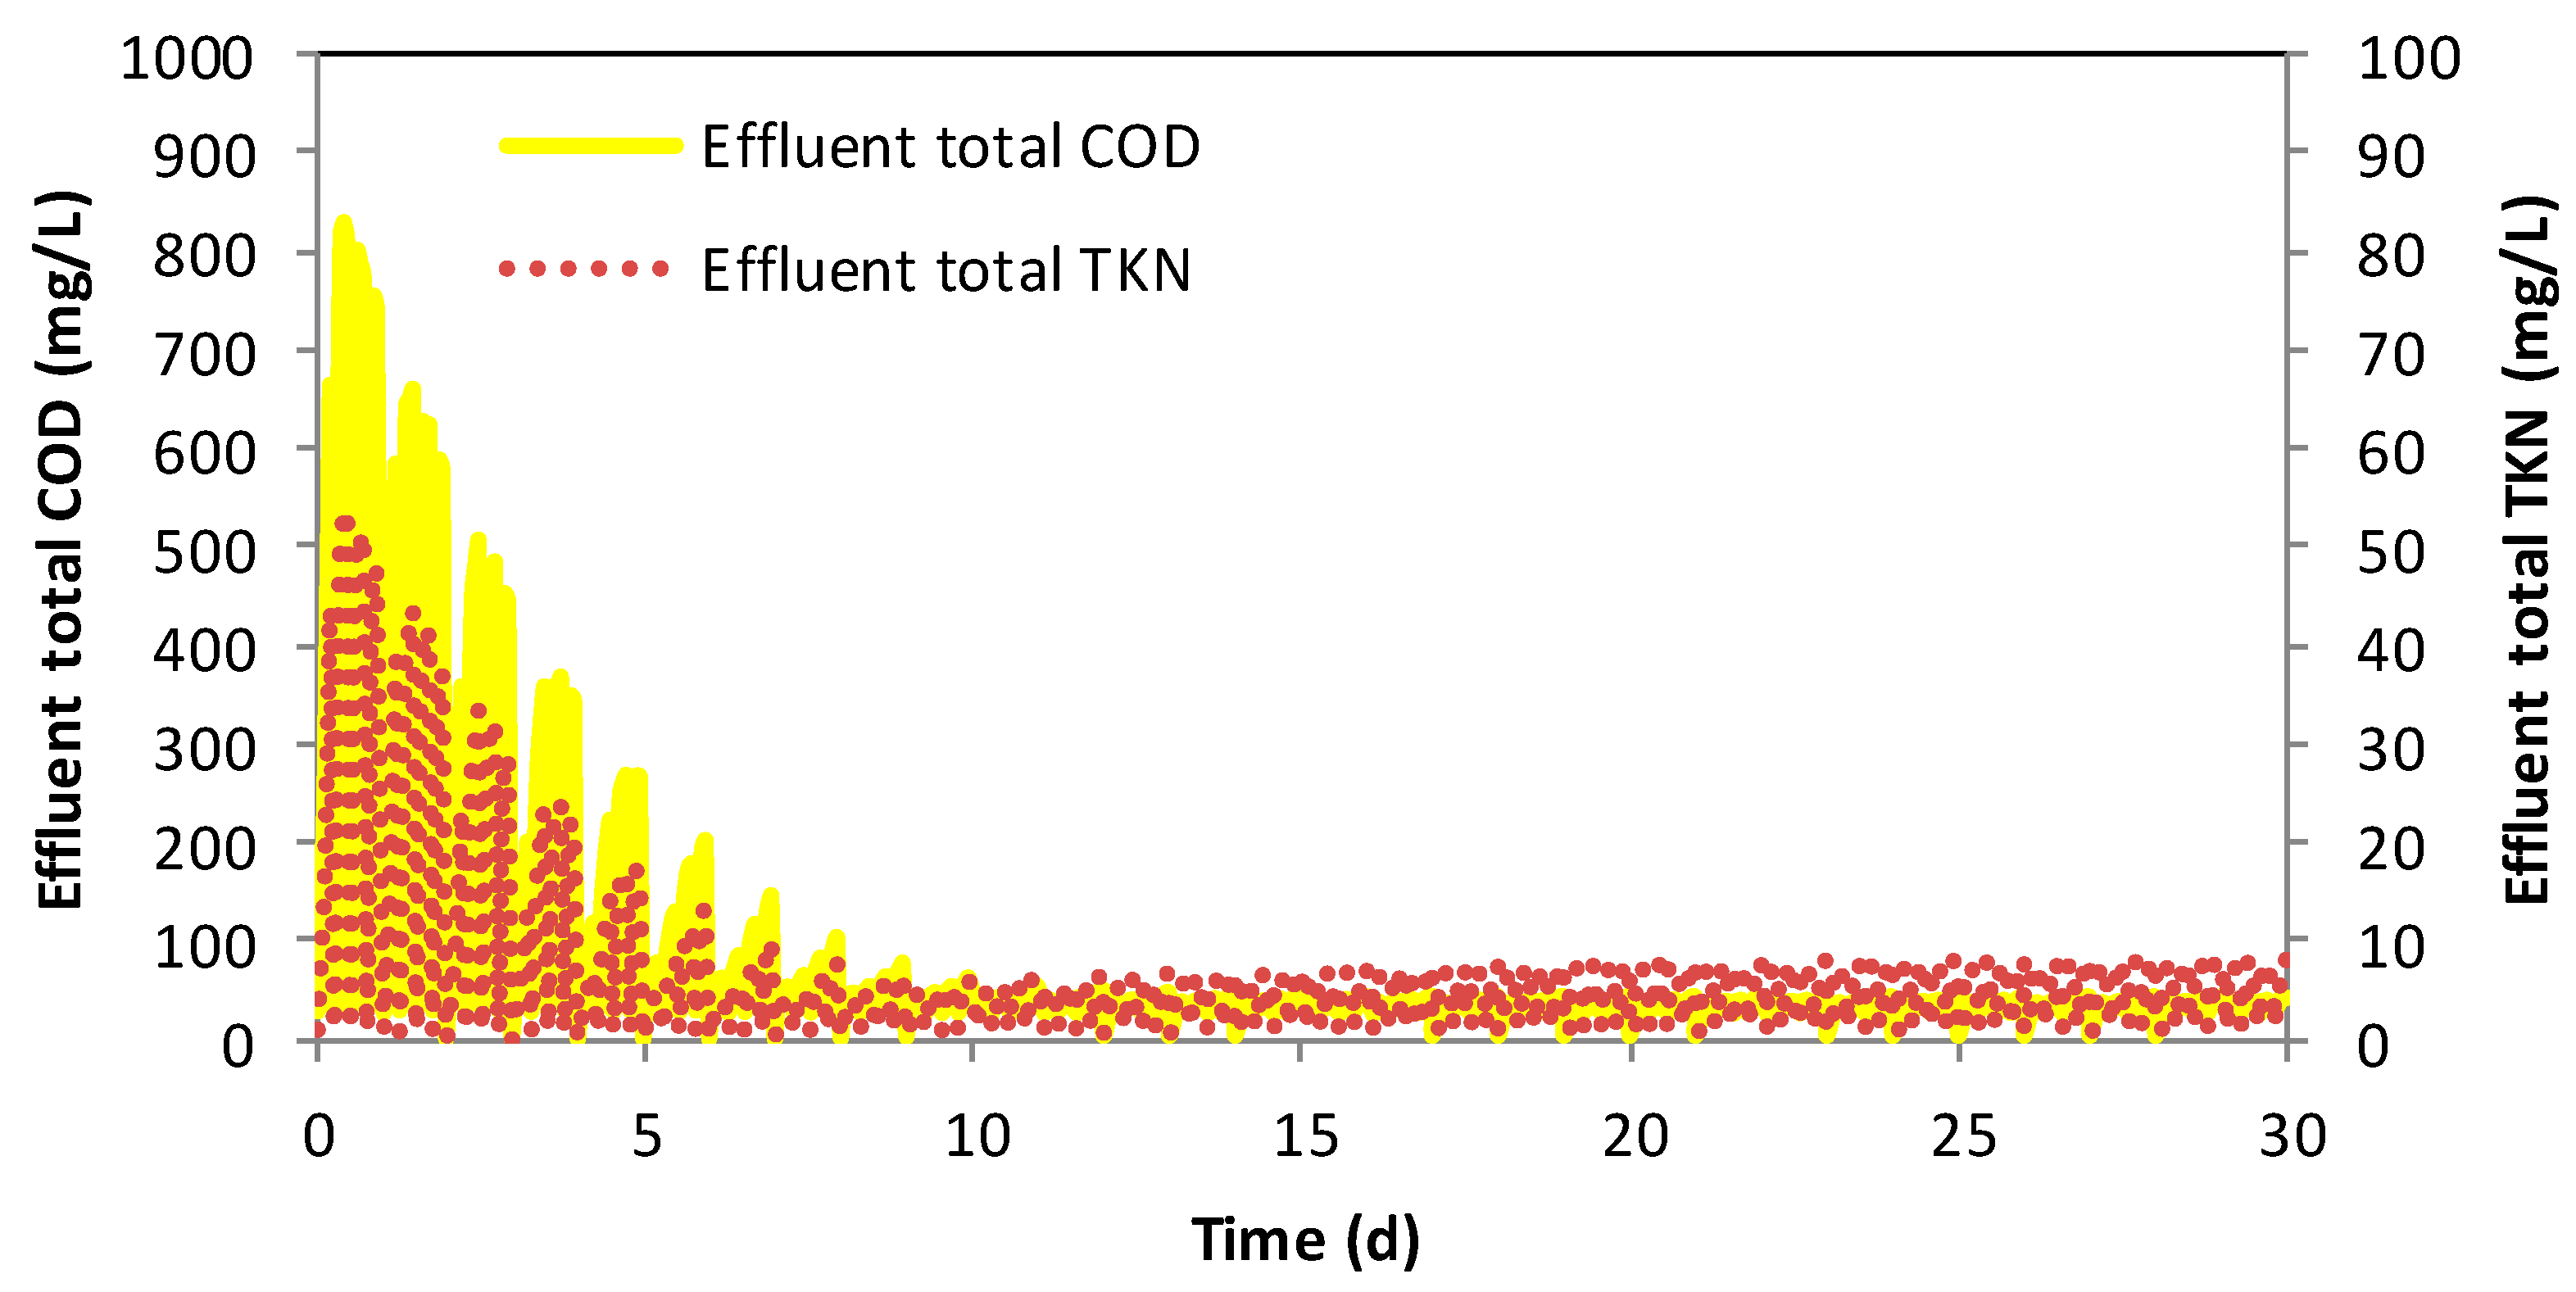
3.1. Performance Comparison of the PRWWTPs Containing CAS + CAS and SBR + CAS Processes

The PRWWTPs containing CAS + CAS and SBR + CAS processes were simulated through the GPS-X software under steady state conditions for 30 days and the final treated effluent investigated parameters such as TSS, BOD5, COD, and ammonia N from both PRWWTPs complied with the regulated treated effluent standards [41,42]. In addition, evolution of the main parameters of the final effluent during the 30 days of simulation for PRWWTPs containing CAS + CAS and SBR + CAS are demonstrated in Figure 3 and Figure 4, respectively. As shown, regarding the PRWWTP containing CAS + CAS processes, during the first day of the simulation, a decrease of the total COD and total TKN was noticed, since the system had not yet reached the steady state. For the PRWWTP containing SBR + CAS processes, from day 10 until the last day of the simulation, the parameters were approximately constant.

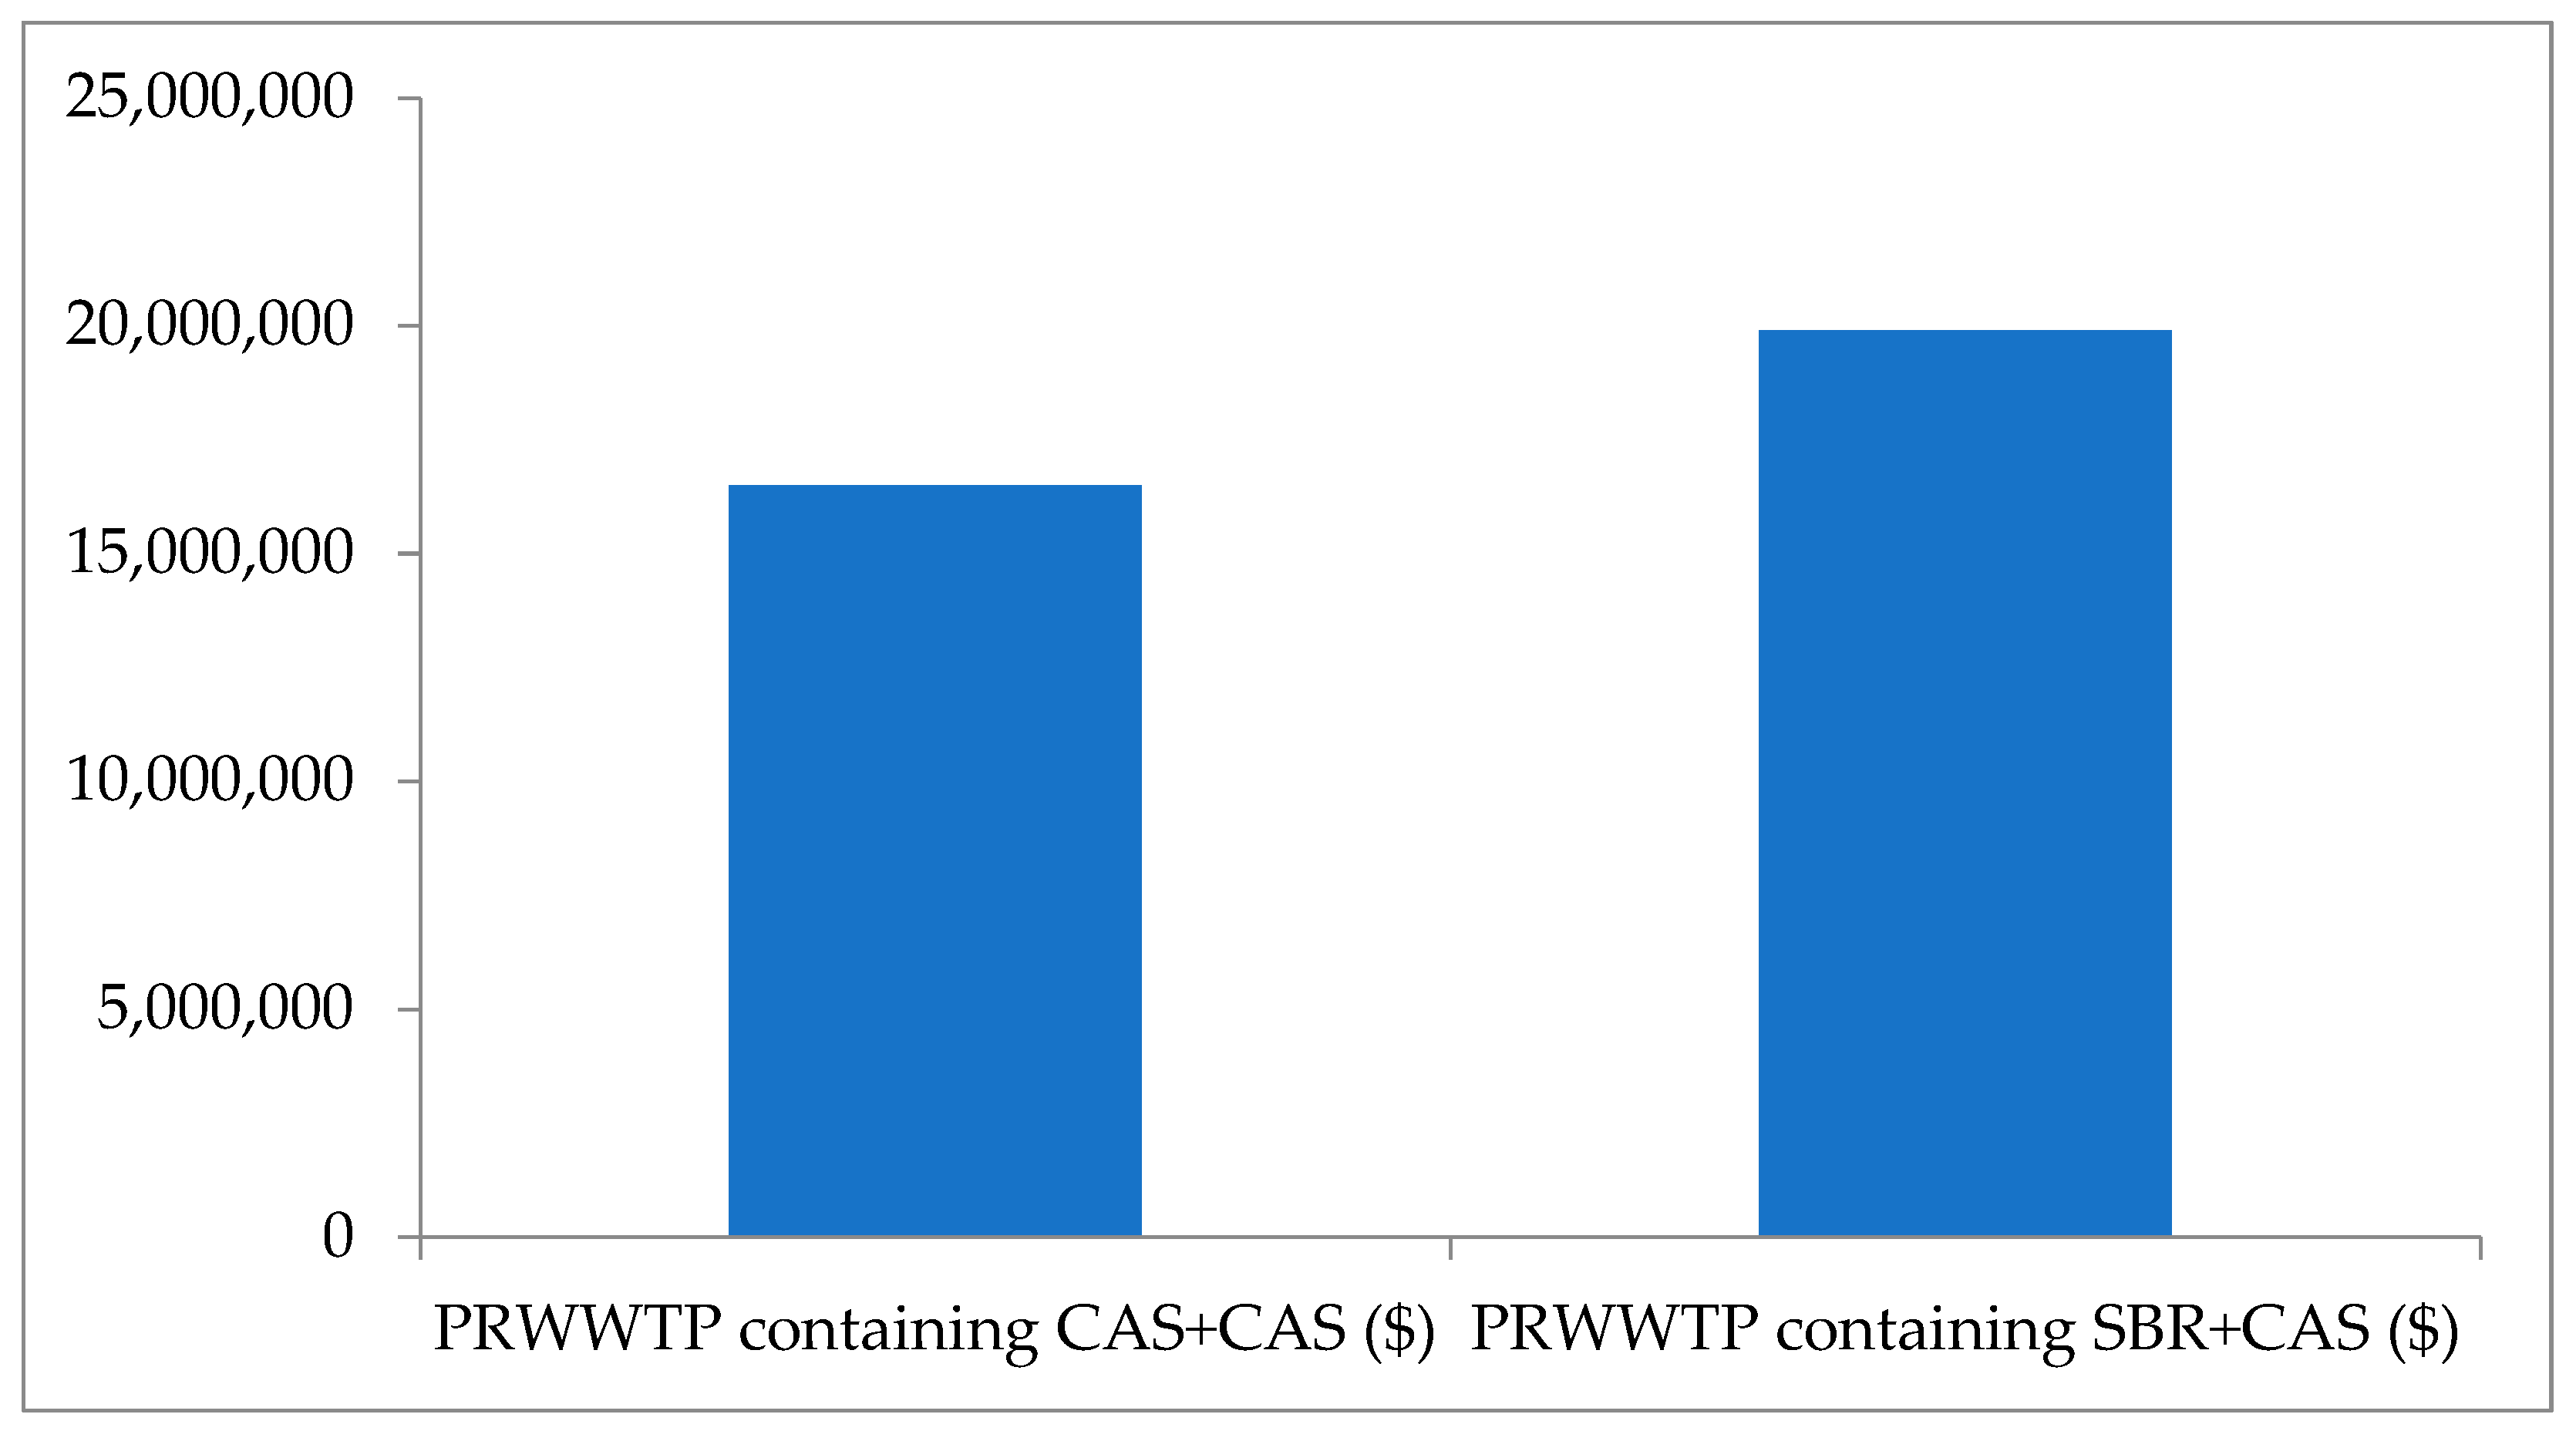
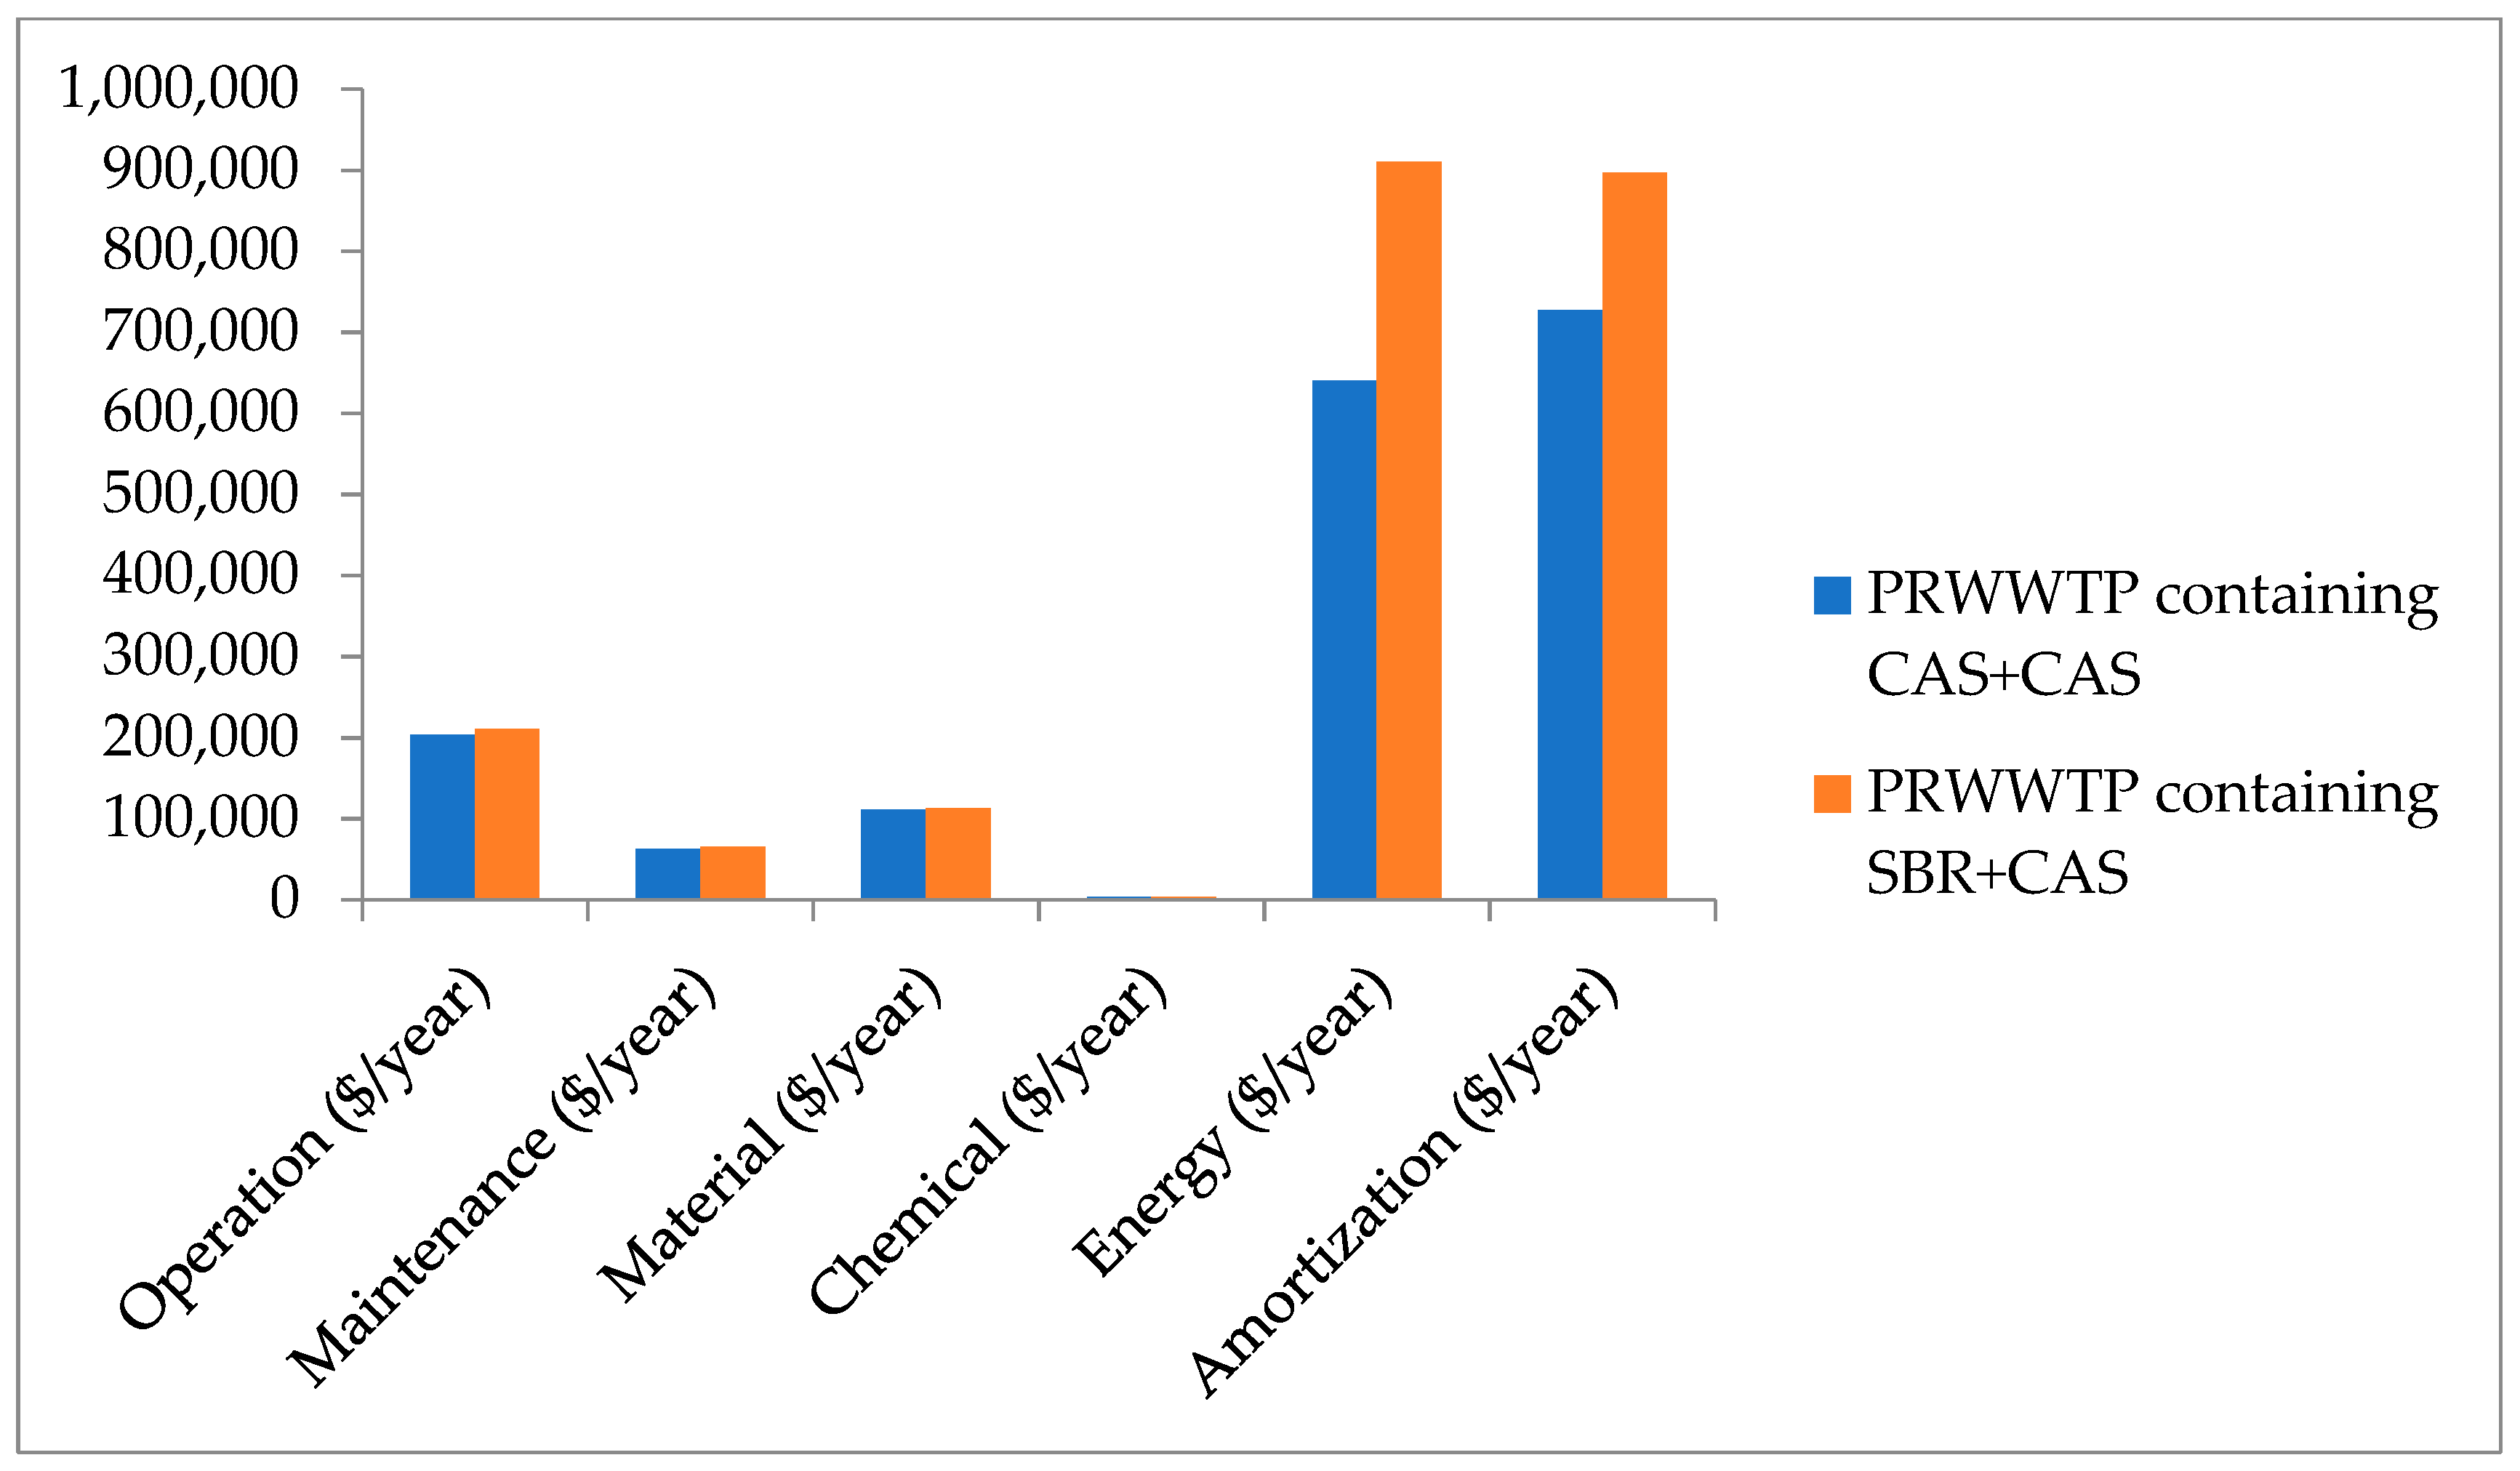
3.2. Economic Comparison of the PRWWTPs Containing CAS + CAS and SBR + CAS Processes

The total project construction cost ($) and the total operation, maintenance, material, chemical, energy, and amortization costs ($/year) of PRWWTPs containing CAS + CAS and SBR + CAS processes are shown in Figure 5 and Figure 6, respectively. Figure 5 illustrates that project construction cost of PRWWTP containing CAS + CAS processes was 17.08% lower than that of PRWWTP containing SBR + CAS processes. Figure 6 shows that the operation, maintenance, material, chemical, energy, and amortization costs of PRWWTP containing CAS + CAS were lower than those of PRWWTP containing SBR + CAS. Note that the energy cost ($/year) of the CAS unit was higher than that of the SBR unit; but the energy cost of PRWWTP containing CAS + CAS was 29.67% lower than that of PRWWTP containing SBR + CAS due to the presence of an additional equalization tank in the configuration of PRWWTP containing SBR + CAS. These results depicted that the PRWWTP containing CAS + CAS processes was cost effective and the energy and amortization costs for both plants were higher in comparison with the operation, maintenance, material, and chemical costs.

4. Conclusions

The performance and economics of CAS process replacing by SBR technology in a two train PRWWTP were evaluated using a simulation by the GPS-X software and CapdetWorks software with equipment costing database Sept 2007 (USA, Avg), respectively. The treated effluent investigated parameters such as TSS, BOD5, COD, and ammonia N from both PRWWTPs complied with the regulated treated effluent standards. Regarding the PRWWTP containing CAS + CAS processes, during the first day of the simulation, a decrease of the total COD and total TKN was noticed, since the system has not yet reached the steady state. For the PRWWTP containing SBR + CAS processes, from day 10 until the last day of the simulation, the parameters were approximately constant. The project construction cost of PRWWTP containing CAS + CAS processes was lower than that of PRWWTP containing SBR + CAS processes, and the energy and amortization costs for both plants were higher in comparison with the operation, maintenance, material, and chemical costs. Note that this study is a computer simulation and verification of the simulation using real data may be required to draw conclusions.

Funding

This research received no external funding.

Acknowledgments

The author is grateful to H. Aglan, Dean of the College of Engineering, for purchasing the Software.

Conflicts of Interest

The author declares no conflict of interest.

References

  1. Jafarinejad, S. Control and treatment of sulfur compounds specially sulfur oxides (SOx) emissions from the petroleum industry: A review. Chem. Int. 2016, 2, 242–253. [Google Scholar]
  2. Jafarinejad, S. Odours emission and control in the petroleum refinery: A review. Curr. Sci. Perspect. 2016, 2, 78–82. [Google Scholar]
  3. Jafarinejad, S. Petroleum Waste Treatment and Pollution Control, 1st ed.; Elsevier/Butterworth-Heinemann: Oxford, UK, 2017. [Google Scholar]
  4. Jafarinejad, S. Recent developments in the application of sequencing batch reactor (SBR) technology for the petroleum industry wastewater treatment. Chem. Int. 2017, 3, 241–250. [Google Scholar]
  5. Jafarinejad, S. Activated sludge combined with powdered activated carbon (PACT process) for the petroleum industry wastewater treatment: A review. Chem. Int. 2017, 3, 268–277. [Google Scholar]
  6. Beychock, M.R. Aqueous Wastes from Petroleum and Petrochemical Plants; John Wiley & Sons: London, UK, 1967. [Google Scholar]
  7. Santos, B.; Crespo, J.G.; Santos, M.A.; Velizarov, S. Oil refinery hazardous effluents minimization by membrane filtration: An on-site pilot plant study. J. Environ. Manag. 2016, 181, 762–769. [Google Scholar] [CrossRef]
  8. Tyagi, R.D.; Tran, F.T.; Chowdhury, A.K.M.M. Biodegradation of petroleum refinery wastewater in a modified rotating biological contactor with polyurethane foam attached to the disks. Water Res. 1993, 27, 91–99. [Google Scholar] [CrossRef]
  9. Ghorbanian, M.; Moussavi, G.; Farzadkia, M. Investigating the performance of an up-flow anoxic fixed-bed bioreactor and a sequencing anoxic batch reactor for the biodegradation of hydrocarbons in petroleum-contaminated saline water. Int. Biodeterior. Biodegrad. 2014, 90, 106–114. [Google Scholar] [CrossRef]
  10. United States Environmental Protection Agency (US EPA). Profile of the Petroleum Refining Industry; EPA Office of Compliance Sector Notebook Project; EPA/310-R-95-013; Office of Compliance, Office of Enforcement and Compliance Assurance; U.S. Environmental Protection Agency: Washington, DC, USA, September 1995.
  11. Benyahia, F.; Abdulkarim, M.; Embaby, A.; Rao, M. Refinery wastewater treatment: A true technological challenge. In Proceedings of the Seventh Annual U.A.E. University Research Conference, Al Ain, UAE, 22–24 April 2006. [Google Scholar]
  12. IPIECA. Petroleum Refining Water/Wastewater Use and Management; IPIECA Operations Best Practice Series; IPIECA: London, UK, 2010. [Google Scholar]
  13. European Commission; Joint Research Center. Best Available Techniques (BAT) Reference Document for the Refining of Mineral Oil and Gas, Industrial Emissions Directive 2010/75/EU (Integrated Pollution Prevention and Control); Joint Research Center, Institute for Prospective Technological Studies Sustainable Production and Consumption Unit European IPPC Bureau R: Brussels, Belgium, 2013. [Google Scholar]
  14. Goldblatt, M.E.; Gucciardi, J.M.; Huban, C.M.; Vasconcellos, S.R.; Liao, W.P. New Polyelectrolyte Emulsion Breaker Improves Oily Wastewater Cleanup at Lower Usage Rates; Technical Paper, GE Water and Power, Water & Process Technologies; General Electric Company: Boston, MA, USA, 2014; pp. 1–6. [Google Scholar]
  15. Environmental Protection Agency (EPA). Waste Water Treatment Manuals, Primary, Secondary and Tertiary Treatment; Environmental Protection Agency: Wexford, UK, 1997.
  16. Isha, S.; Malakahmad, A.; Isa, M.H. Refinery wastewater biological treatment: A short review. J. Sci. Ind. Res. 2012, 71, 251–256. [Google Scholar]
  17. Pajoumshariati, S.R.; Bonakdarpour, B.; Zare, N.; Ashtiani, F.Z. The effect of hydraulic retention time on the performance and fouling characteristics of membrane sequencing batch reactors used for the treatment of synthetic petroleum refinery wastewater. Bioresour. Technol. 2011, 102, 7692–7699. [Google Scholar]
  18. Mohan, S.V.; Prakasham, R.S.; Satyavathi, B.; Annapurna, J.; Ramakrishna, S.V. Biotreatability studies of pharmaceutical wastewaters using an anaerobic suspended film contact reactor. Water Sci. Technol. 2001, 43, 271–276. [Google Scholar] [CrossRef]
  19. Mohan, S.V.; Sharma, P.N. Pharmaceutical wastewater and treatment technologies. Pharma Bio World 2002, 11, 93–100. [Google Scholar]
  20. Mohan, S.V.; Rao, N.C.; Prasad, K.K.; Madhavi, B.T.V.; Sharma, P.N. Treatment of complex chemical wastewater in a sequencing batch reactor (SBR) with an aerobic suspended growth configuration. Process. Biochem. 2005, 40, 1501–1508. [Google Scholar] [CrossRef]
  21. Wang, L.K.; Hung, Y.T.; Lo, H.H.; Yapijakis, C. Waste Treatment in the Process Industries; CRC Press, Taylor & Francis Group: Boca Raton, FL, USA, 2006. [Google Scholar]
  22. Hudson, N.; Doyle, J.; Lant, P.; Roach, N.; de Bruyn, B.; Staib, C. Sequencing batch reactor technology: The key to a BP refinery (Bulwer Island) upgraded environmental protection system—A low cost lagoon based retrofit. Water Sci. Technol. 2001, 43, 339–346. [Google Scholar] [CrossRef]
  23. Mohr, K.S.; Veenstra, J.N.; Sanders, D.A. Refinery wastewater management using multiple angle oil-water separators. In Proceedings of the International Petroleum Environment Conference, Albuquerque, NM, USA, 20 October 1998. [Google Scholar]
  24. Jafarinejad, S. Cost estimation and economical evaluation of three configurations of activated sludge process for a wastewater treatment plant (WWTP) using simulation. Appl. Water Sci. 2017, 7, 2513–2521. [Google Scholar] [CrossRef]
  25. Korniluk, M.; Montusiewicz, A.; Piotrowicz., A.; Lagod, G. Simulation of wastewater treatment systems with membrane separation. Proc. ECOpole 2008, 2, 41–45. [Google Scholar]
  26. Hydromantis Inc. GPS-X Technical Reference; Hydromantis Inc.: Hamilton, ON, Canada, 2011. [Google Scholar]
  27. Nasr, M.S.; Moustafa, M.A.E.; Seif, H.A.E.; El Kobrosy, G. Modelling and simulation of German BIOGEST/EL-AGAMY wastewater treatment plants-Egypt using GPS-X simulator. Alex. Eng. J. 2011, 50, 351–357. [Google Scholar] [CrossRef]
  28. Abdel-Kader, A.M.; Aljefry, M.H.; Eladawy, S.M. Studying the effects of alum, Lime and ferric chloride on the treatment efficiency of rotating biological contactors plant. In Proceedings of the 13th International Conference on Environmental Science and Technology, Athens, Greece, 5–7 September 2013. [Google Scholar]
  29. Lester, J.N.; Soares, A.; San Martin, D.; Harper, P.; Jefferson, B.; Brigg, J.; Wood, E.; Cartmell, E. A novel approach to the anaerobic treatment of municipal wastewater in temperate climates through primary sludge fortification. Environ. Technol. 2009, 30, 985–994. [Google Scholar] [CrossRef] [PubMed]
  30. Beck, C.; Prades, G.; Sadowski, A.G. Activated sludge wastewater treatment plants optimisation to face pollution overloads during grape harvest periods. Water Sci. Technol. 2005, 51, 81–88. [Google Scholar] [CrossRef]
  31. Mannina, G.; Viviani, G. Hybrid moving bed biofilm reactors: An effective solution for upgrading a large wastewater treatment plant. Water Sci. Technol. 2009, 60, 1103–1116. [Google Scholar] [CrossRef]
  32. El Monayeri, O.D. Comparative study to assess the performance of an integrated treatment system using ANN vs. GPS-X. Int. J. Appl. Eng. Res. 2016, 11, 5604–5609. [Google Scholar]
  33. Mikosz, J. Determination of permissible industrial pollution load at a municipal wastewater treatment plant. Int. J. Environ. Sci. Technol. 2015, 12, 827–836. [Google Scholar] [CrossRef]
  34. Pereira, S.F. Modeling of a Wastewater Treatment Plant Using GPS-X. Master’s Thesis, Faculdade de Ciências e Tecnologia, Departamento de Química, Universidade Nova de Lisboa, Lisbon, Portugal, 2014. [Google Scholar]
  35. Metcalf & Eddy. Wastewater Engineering, Treatment, Disposal and Reuse; Mc Graw—Hill Book Company: New York, NY, USA, 1991. [Google Scholar]
  36. United States Environmental Protection Agency (US EPA). Wastewater, Technology Fact Sheet: Sequencing Batch Reactors; U.S. Environmental Protection Agency, Office of Water: Washington, DC, USA, 1999; EPA 932-F-99-073.
  37. Dohare, D.; Meshram, R. Biological treatment of edible oil refinery wastewater using activated sludge process and sequencing batch reactors—A Review. Int. J. Eng. Sci. Res. Technol. 2014, 3, 251–260. [Google Scholar]
  38. Mahvi, A.H. Sequencing batch reactor: A promising technology in wastewater treatement. Iran. J. Environ. Health Sci. Eng. 2008, 5, 79–90. [Google Scholar]
  39. United States Environmental Protection Agency (US EPA). Wastewater, Technology Fact Sheet: Package Plants; U.S. Environmental Protection Agency, Office of Water: Washington, DC, USA, 2000; EPA 832-F-00-016.
  40. Münch, E.V.; Lant, P.; Keller, J. Simultaneous Nitrification and Denitrification in Bench-scale Sequencing Batch Reactors. Water Res. 1996, 30, 277–284. [Google Scholar] [CrossRef]
  41. World Bank Group. Environmental, Health, and Safety Guidelines Petroleum Refining. pp. 1–35. Available online: http://www.ifc.org/wps/wcm/connect/df09eb23-f252-4d08-ac86-db1972c781a7/2016-EHS+Guidelines+for+Petroleum+Refining+FINAL.pdf?MOD=AJPERES (accessed on 17 November 2016).
  42. Koyuncu, I. Effect of operating conditions on the separation of ammonium and nitrate ions with nanofiltration and reverse osmosis membranes. J. Environ. Sci. Health Part A 2002, 37, 1347–1359. [Google Scholar] [CrossRef]
Figure 1. Process flow diagram of the petroleum refinery wastewater treatment plant (PRWWTP) containing conventional activated sludge (CAS) + CAS processes.
Chemengineering 03 00045 g001
Figure 2. Process flow diagram of the petroleum refinery wastewater treatment plant (PRWWTP) containing sequencing batch reactor (SBR) + CAS processes.
Chemengineering 03 00045 g002
Figure 3. Evolution of the total COD and total TKN of the final effluent during the 30 days of simulation for the PRWWTPs containing CAS + CAS processes.
Chemengineering 03 00045 g003
Figure 4. Evolution of the total COD and total TKN of the final effluent during the 30 days of simulation for the PRWWTPs containing SBR + CAS processes.
Chemengineering 03 00045 g004
Figure 5. The total project construction cost ($) of the PRWWTPs containing CAS + CAS and SBR + CAS processes.
Chemengineering 03 00045 g005
Figure 6. The total operation, maintenance, material, chemical, energy, and amortization costs ($/year) of the PRWWTPs containing CAS + CAS and SBR + CAS processes.
Chemengineering 03 00045 g006
Table 1. The characteristics of influent wastewater (API effluent).
ParameterValue
Mean influent flow (m3/d)3120
Total COD (mg/L)550
Soluble COD (mg/L)300
Total BOD (mg/L)270
Soluble BOD (mg/L)80
Total suspended solids (TSS) (mg/L)231.5
Volatile solids (%)75
Average summer temperature (°C)38
Average winter temperature (°C)10
Total TKN (mgN/L)40
Soluble TKN (mgN/L)28
Ammonia (mgN/L)15
Total phosphorus (mgP/L)8
pH7.6
Cations (mg/L)160
Anions (mg/L)160
Settleable solids (mL/L)10
Oil and grease (mg/L)150
Non-degradable fraction of VSS (%)40
Table 2. The characteristics of CAS process parameters.
ParameterValue
Process designCarbon removal plus nitrification
Maximum volume1170 m3
Tank width17 m
Tank depth4.05 m
Aeration methodDiffused air
Total air flow into aeration tank31,464 m3/d
Bubble sizeFine bubble
Alpha factor for oxygen transfer in wastewater0.5
Beta factor for oxygen saturation in wastewater0.95
Standard oxygen transfer efficiency30%
Maximum heterotrophic specific growth rate3.2 1/d
Heterotrophic decay rate0.62 1/d
Maximum autotrophic specific growth rate0.9 1/d
Autotrophic decay rate0.17 1/d
Biomass yield0.5
Mixed liquor suspended solids (MLSS)1500
Safety factor for calculated SRT1.5
Table 3. The characteristics of sand filtration process parameters.
ParameterValue
Filter bed depth1.2 m
Surface area15 m2
Loading rate8 m3/(m2·h)
Approach velocity0.15 cm/s
Sixty percent finer size0.75 mm
Specific weight of sand2649.5 kg/m3
Porosity of bed0.4
Expanded depth1.52 m
Number of trough50
Width of trough0.304 m
Underdrain depth0.304 m
Head loss in underdrain0.304 m
Operating depth of water above sand0.91 m
Height of trough from underdrain1.98 m
Backwash time10 min
Freeboard1.2 m
Number of layers1
Coefficient of permeability in the layer5
Porosity of layer0.4
Particle diameter in the layer0.0007 m
Shape factor8.5
Specific gravity of particles in the layer2.65
Table 4. The characteristics of SBR process parameters.
ParameterValue
Process designCarbon removal plus nitrification
Surface area290 m2
Maximum water level4.05 m
Feed point from bottom2 m
Number of mixers per SBR2
Aeration methodDiffused air
Total air flow into aeration tank31,464 m3/d
Bubble sizeFine bubble
Alpha factor for oxygen transfer in wastewater0.5
Beta factor for oxygen saturation in wastewater0.95
Standard oxygen transfer efficiency30%
Maximum heterotrophic specific growth rate3.2 1/d
Heterotrophic decay rate0.62 1/d
Maximum autotrophic specific growth rate0.9 1/d
Autotrophic decay rate0.17 1/d
Biomass yield0.5
Safety factor for calculated SRT1.5
Mixing (and fill) time0.5 h
Aeration (and fill) time1.5 h
Aeration time (only)2 h
Settling time1.4
Decant time0.5
De-sludge time0.1 h
Table 5. The selected models used for different unit operation in PRWWTPs for simulation.
ProcessModel
Equalization TanksNoreact
Coagulant additionChemeq
DAFSimple1d
Aeration tanks or CAS processMantis
SBR processMantis
Secondary clarifiersSimple1d
ChlorinationEmpiric
Sand filtersSimple1d
Oily sludge thickenerEmpiric
Biological sludge thickenerEmpiric
Aerobic digestionMantisdig
Dewatering or belt-filter pressPress

