

Absorption and Distribution of Imidacloprid and Its Metabolites in Goldfish (Carassius auratus Linnaeus)
Abstract
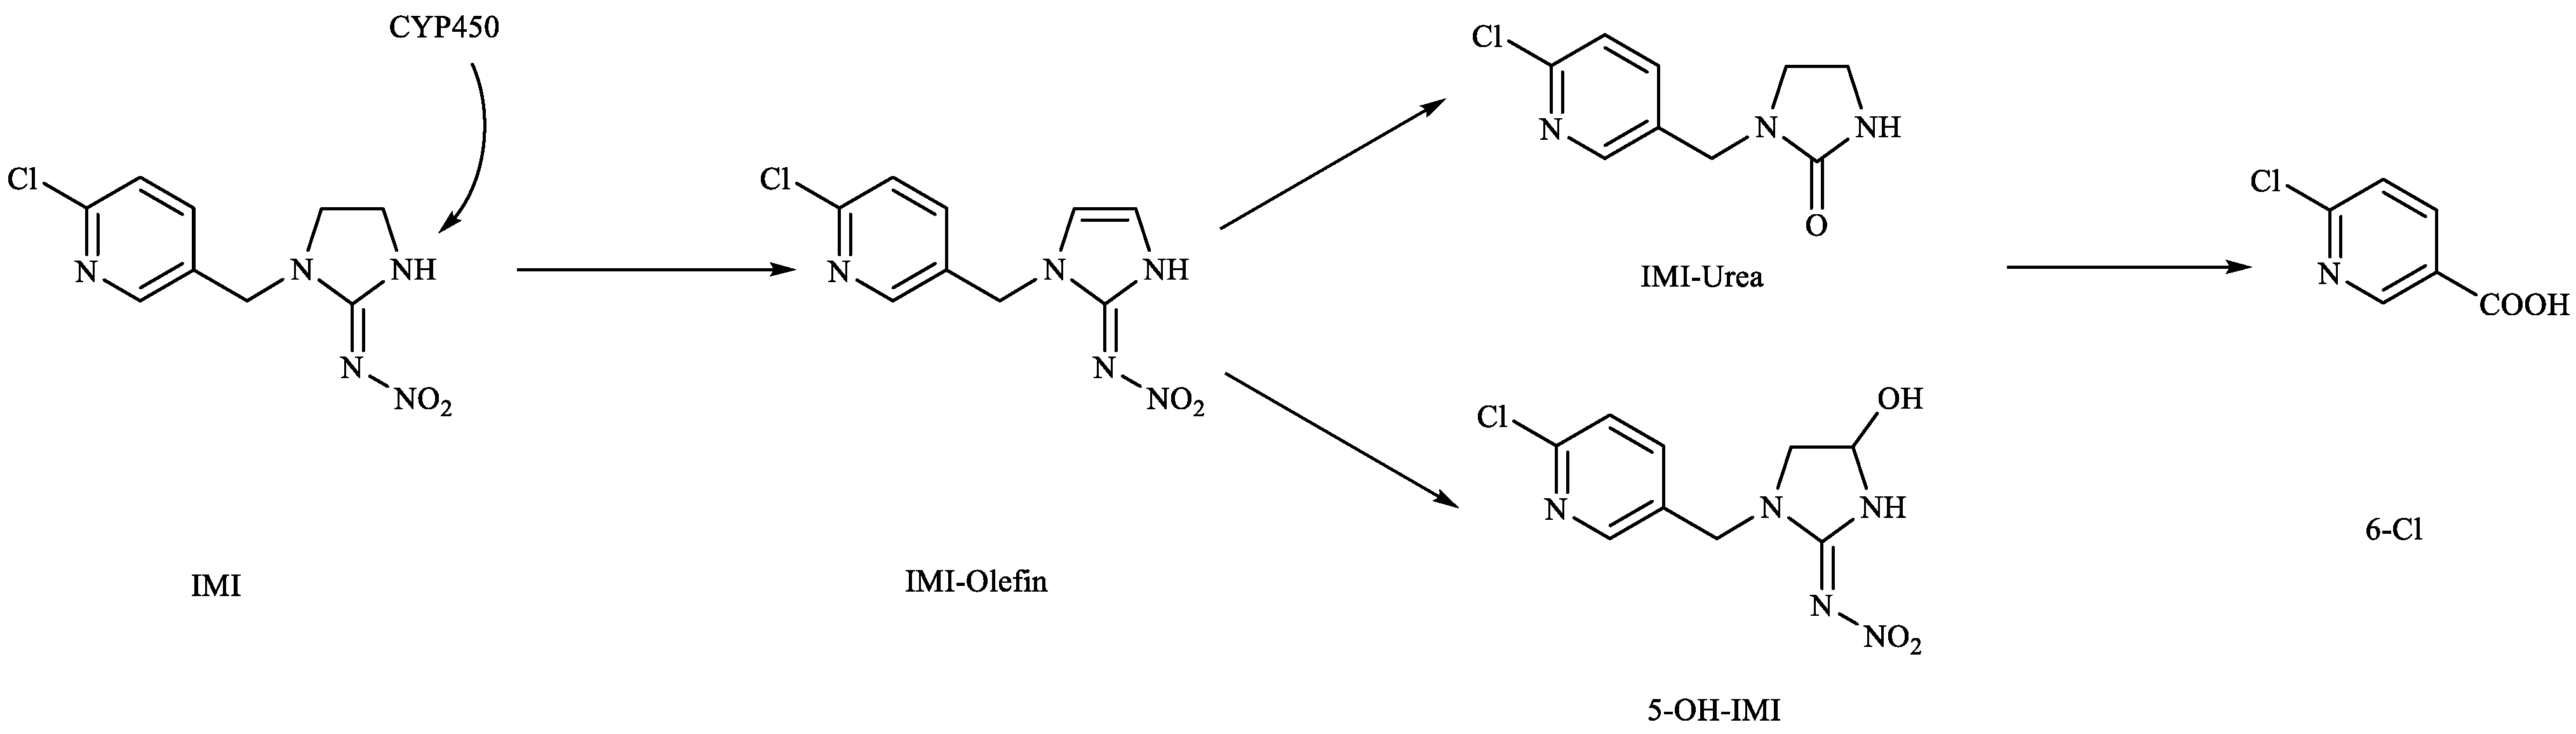
:1. Introduction
2. Materials and Methods
2.1. Chemicals, Instruments and Animals
2.2. Exposure Experiment
2.3. Sample Pretreatment
2.4. Instrument Conditions
2.5. Detection Limit, Precision and Recovery
2.6. Data Analysis
3. Results
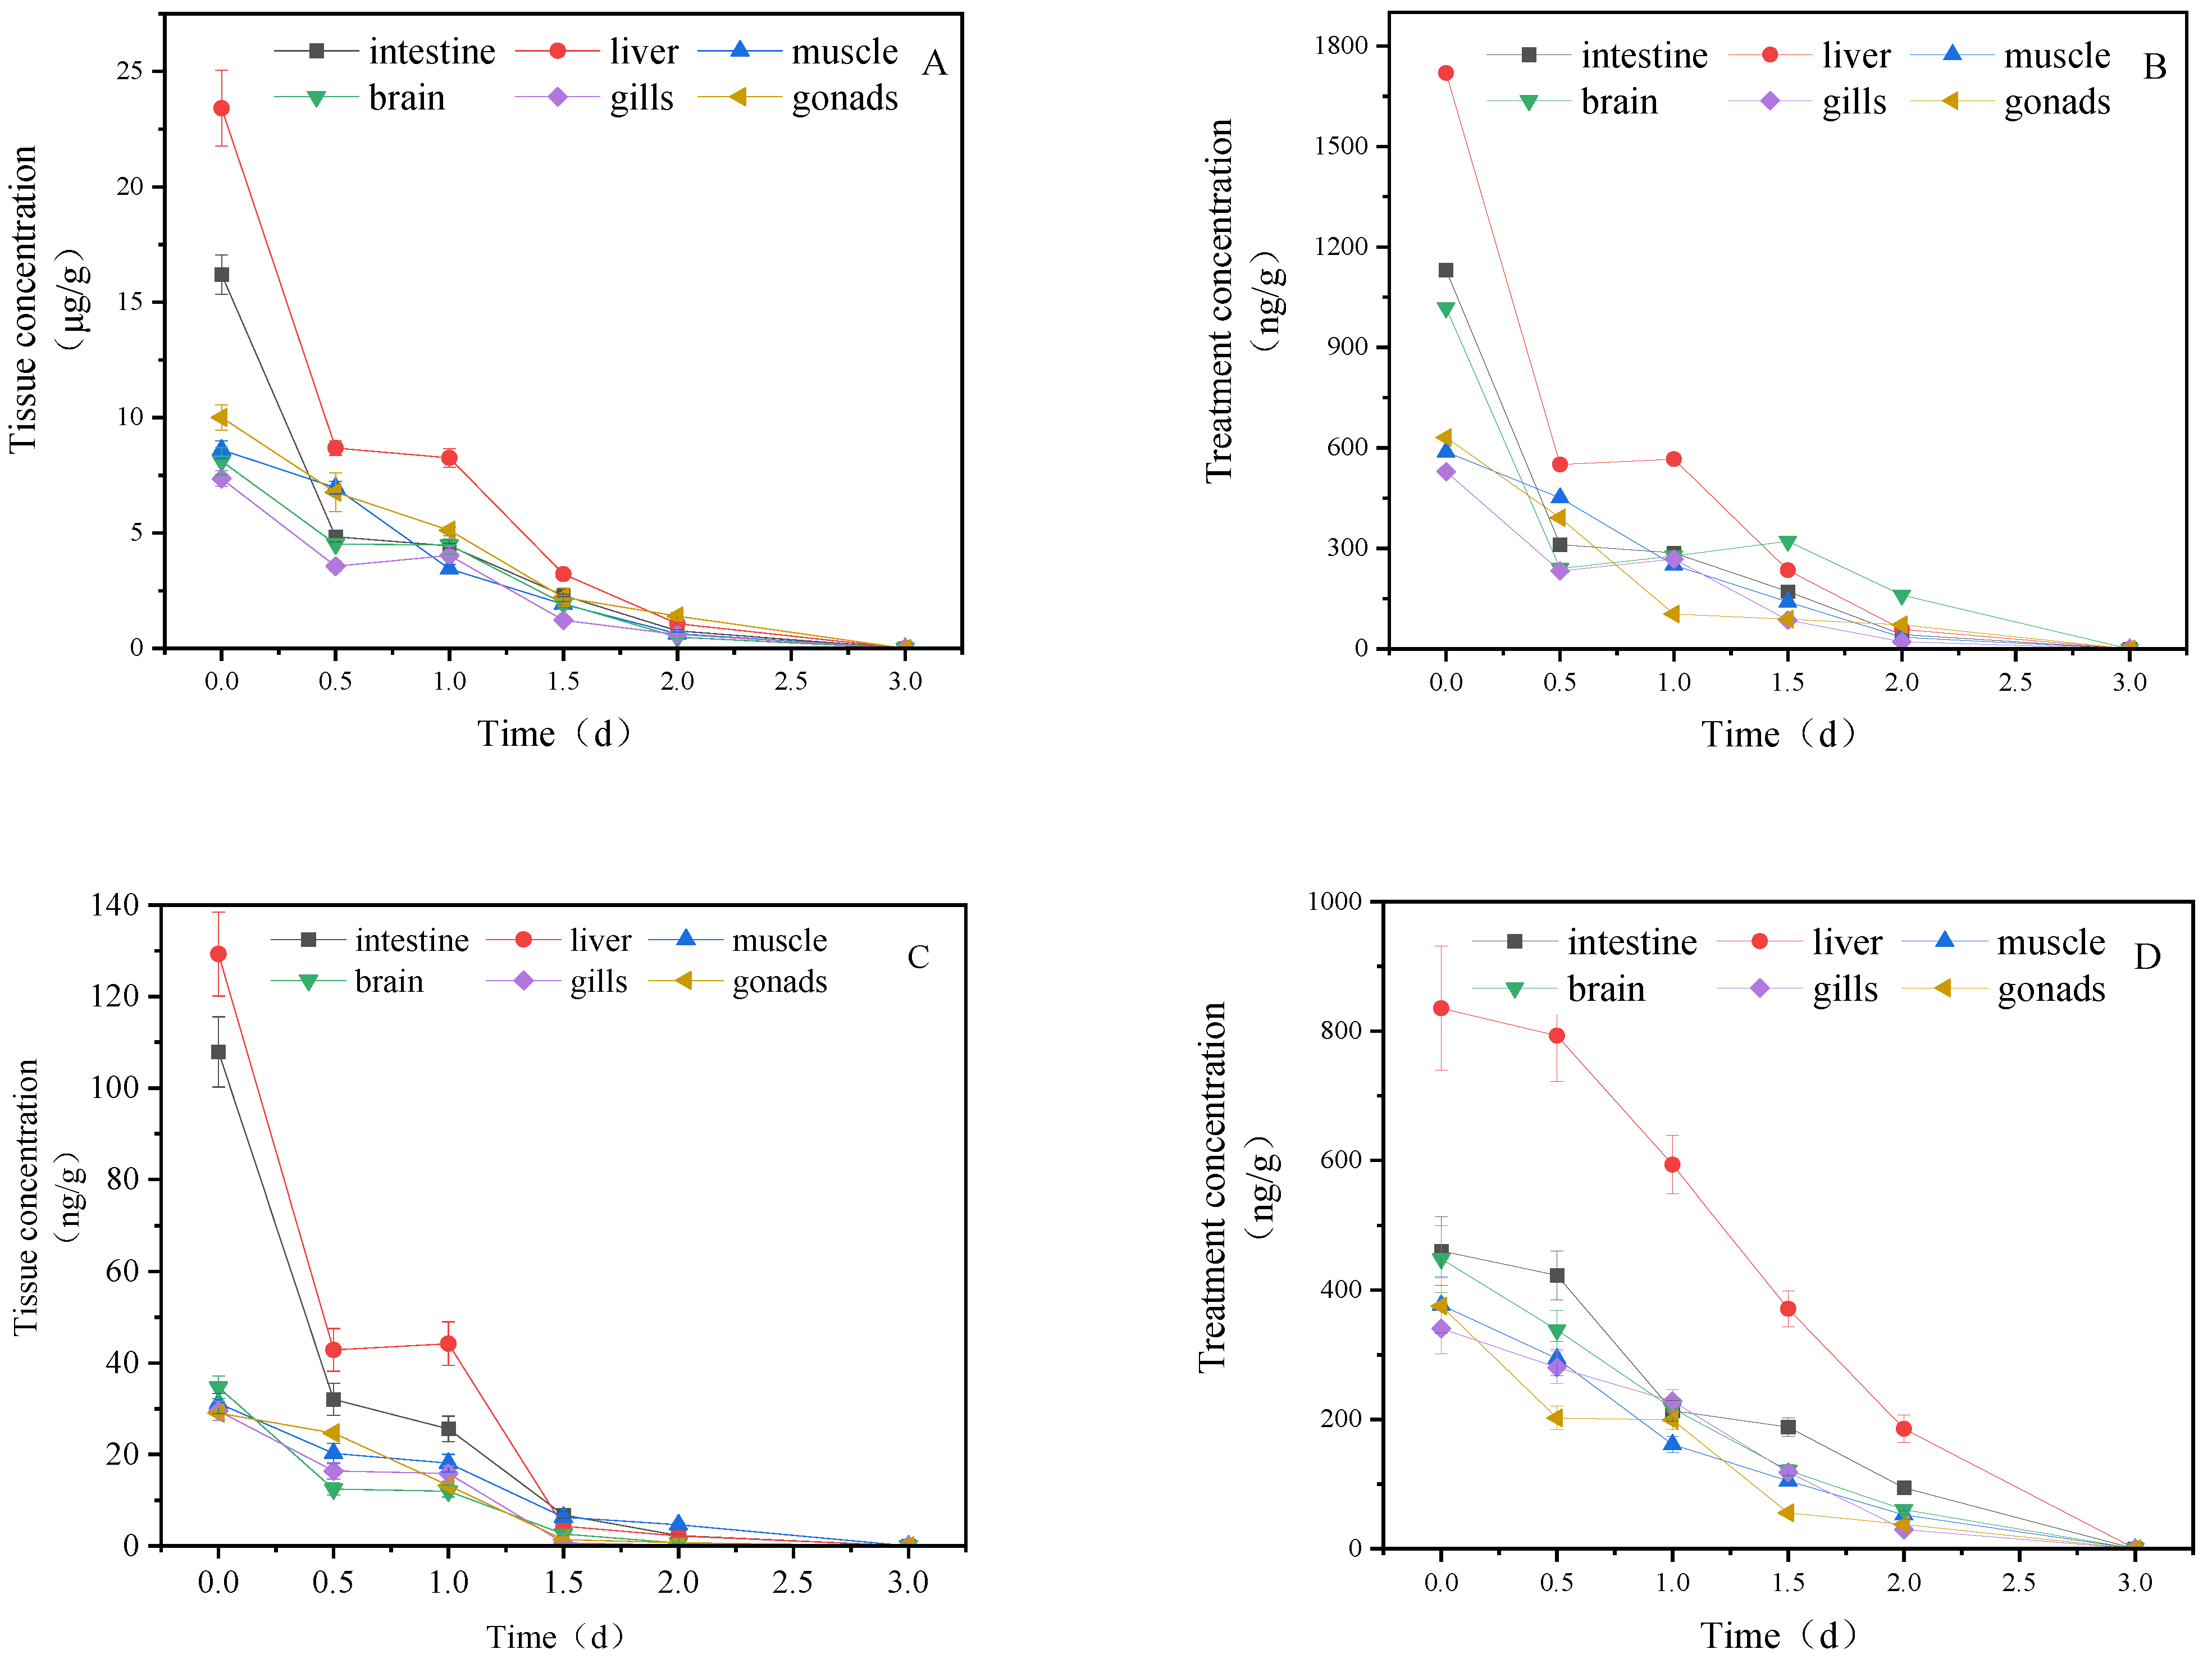
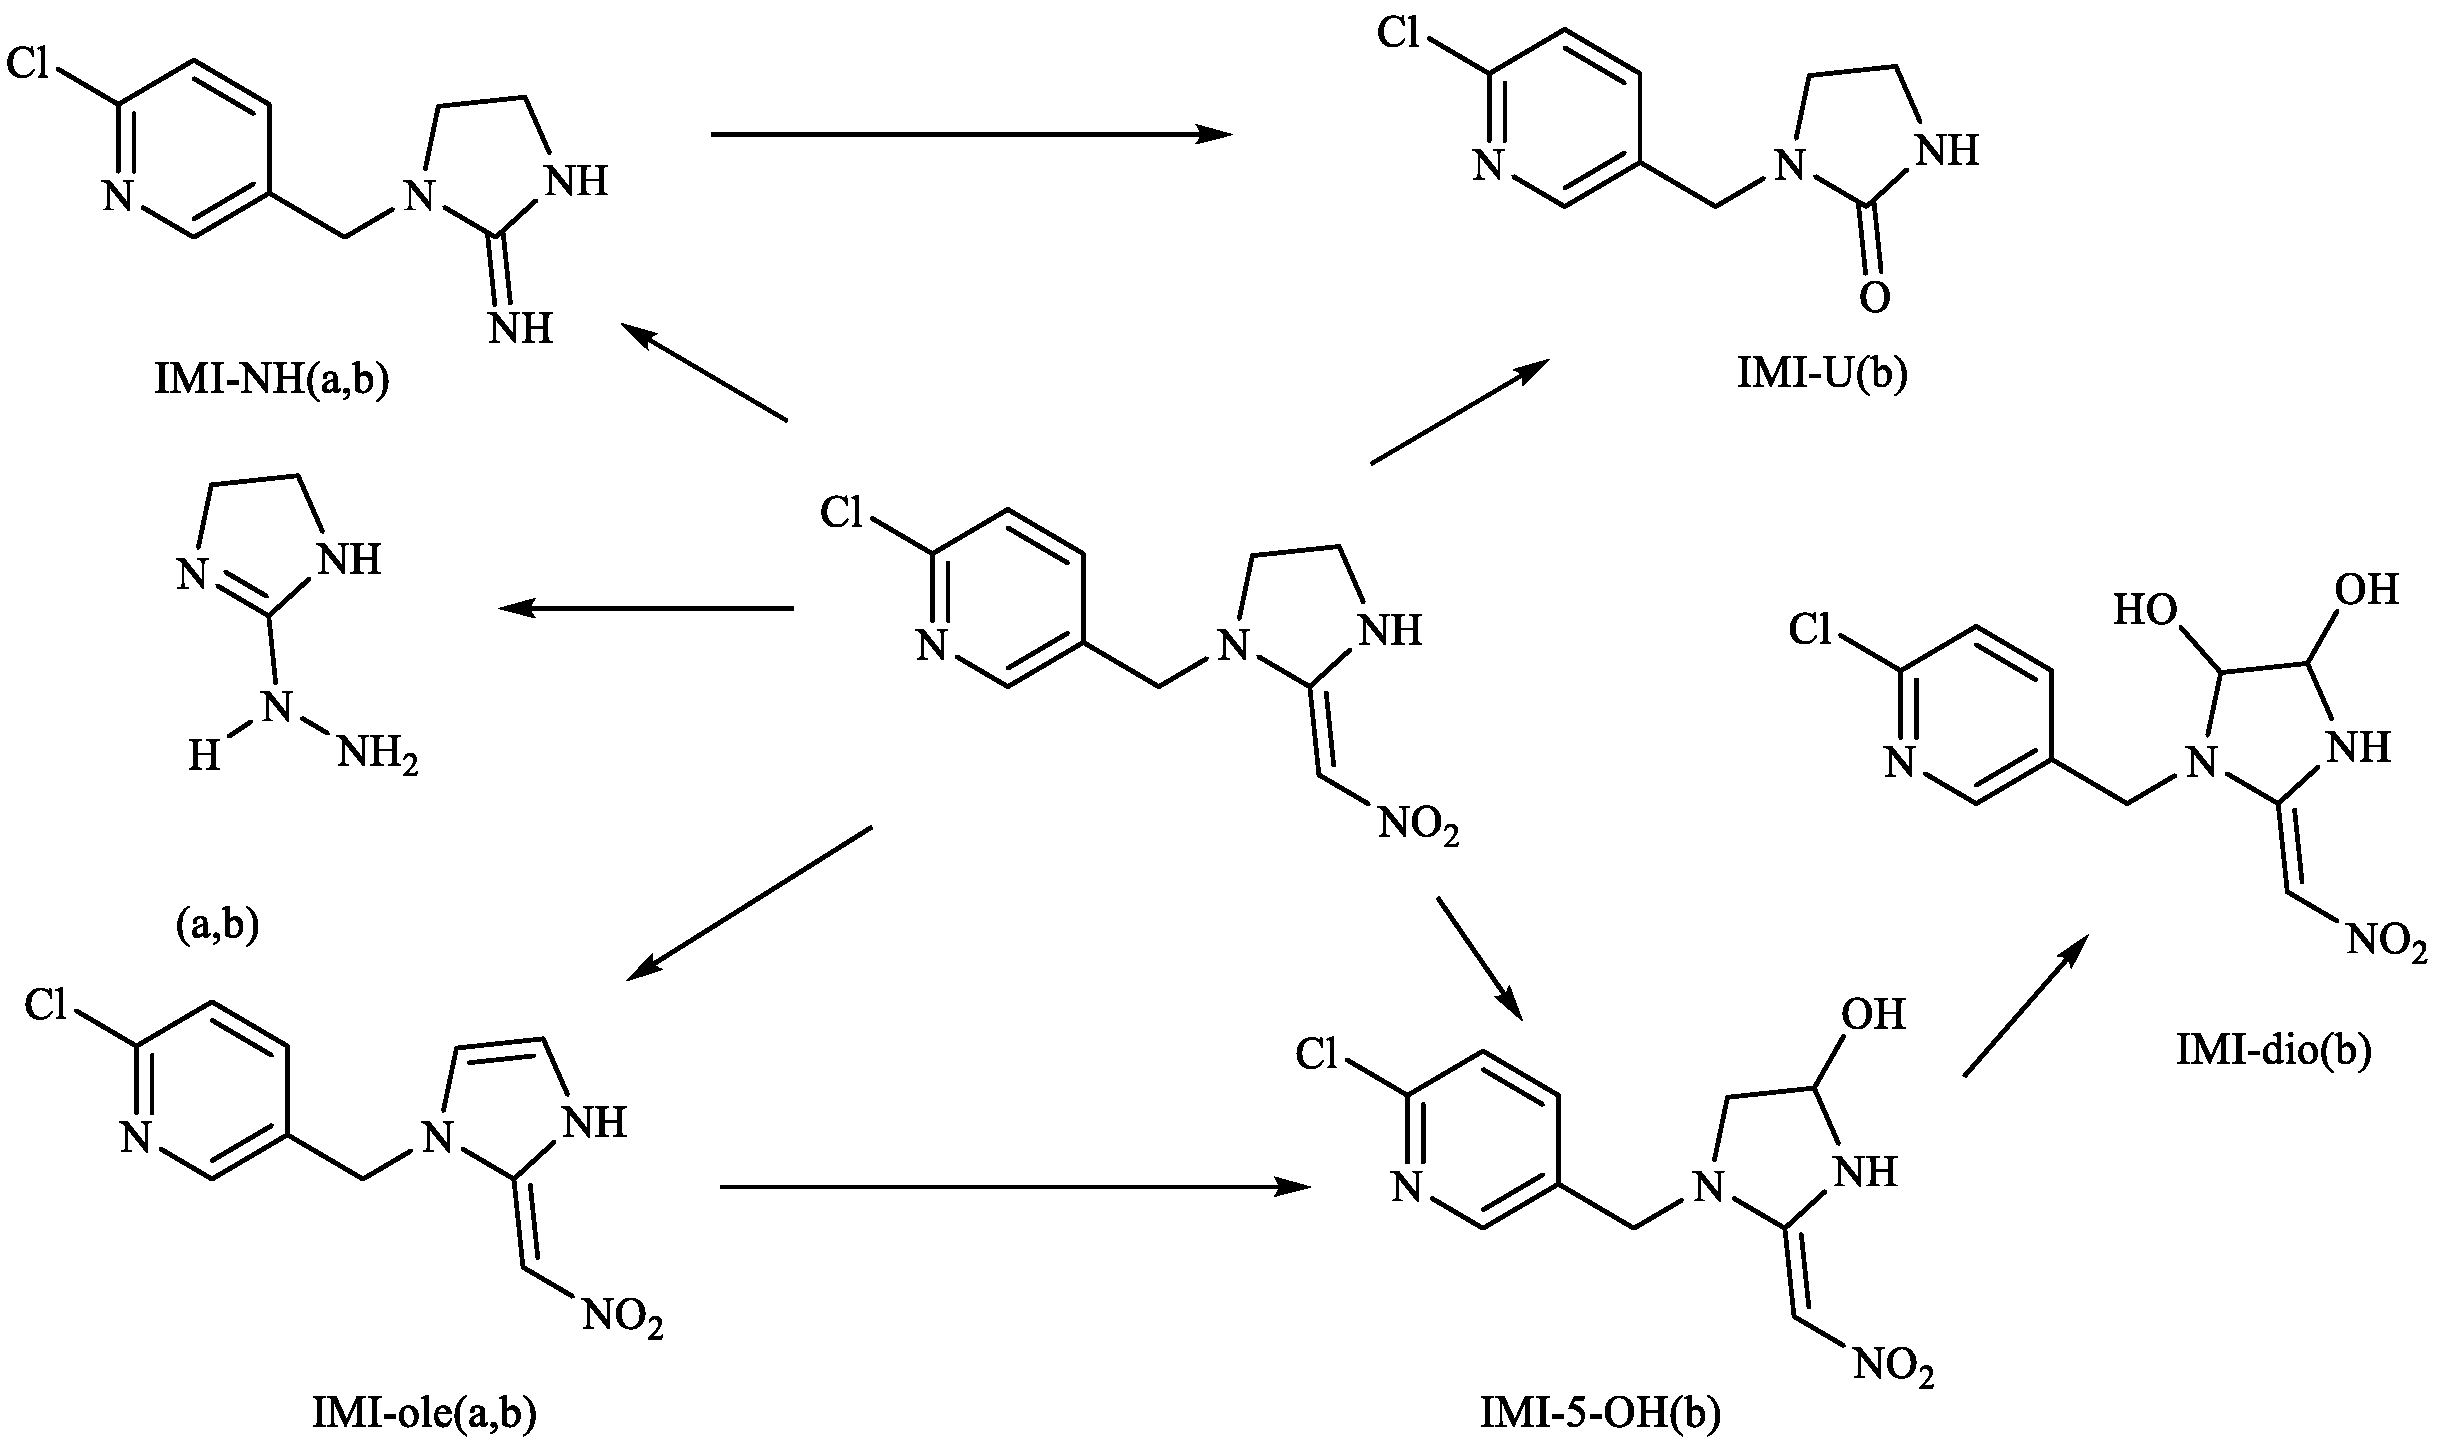
3.1. Concentration Changes of IMI and Its Metabolites in Goldfish under Short-Term Exposure
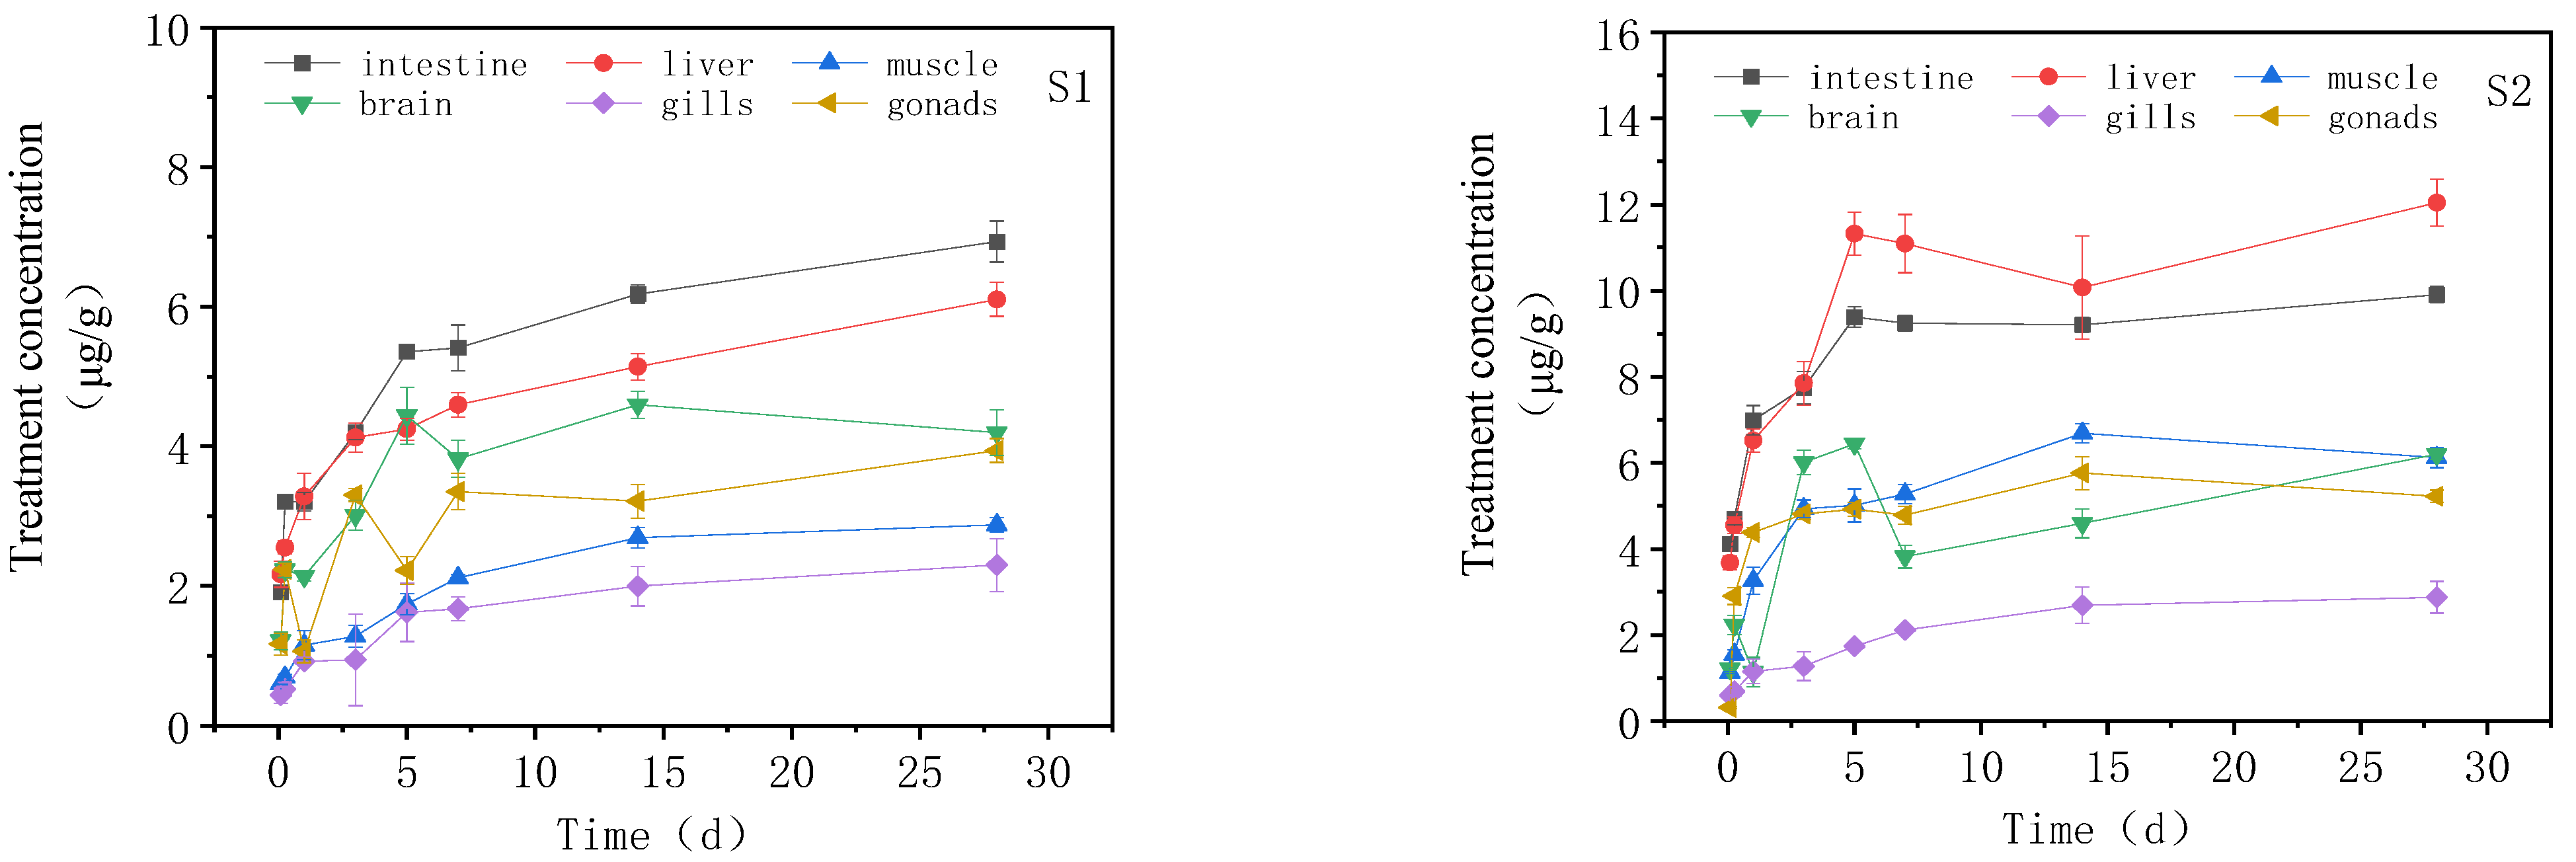
3.2. Concentration Changes of IMI in Goldfish under Continuous Exposure
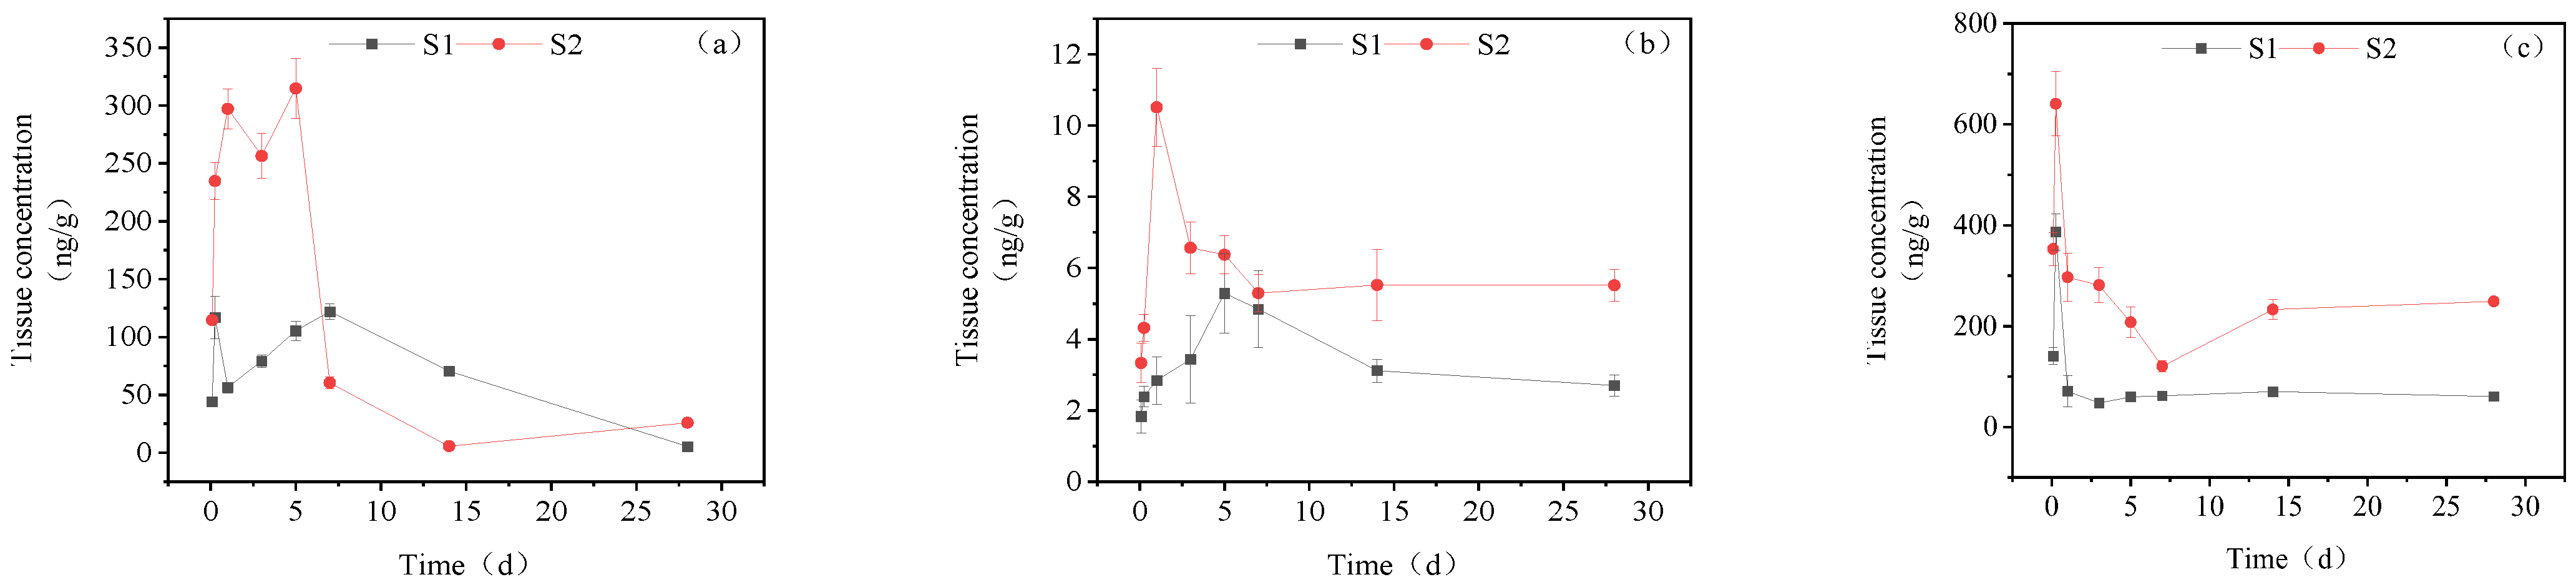
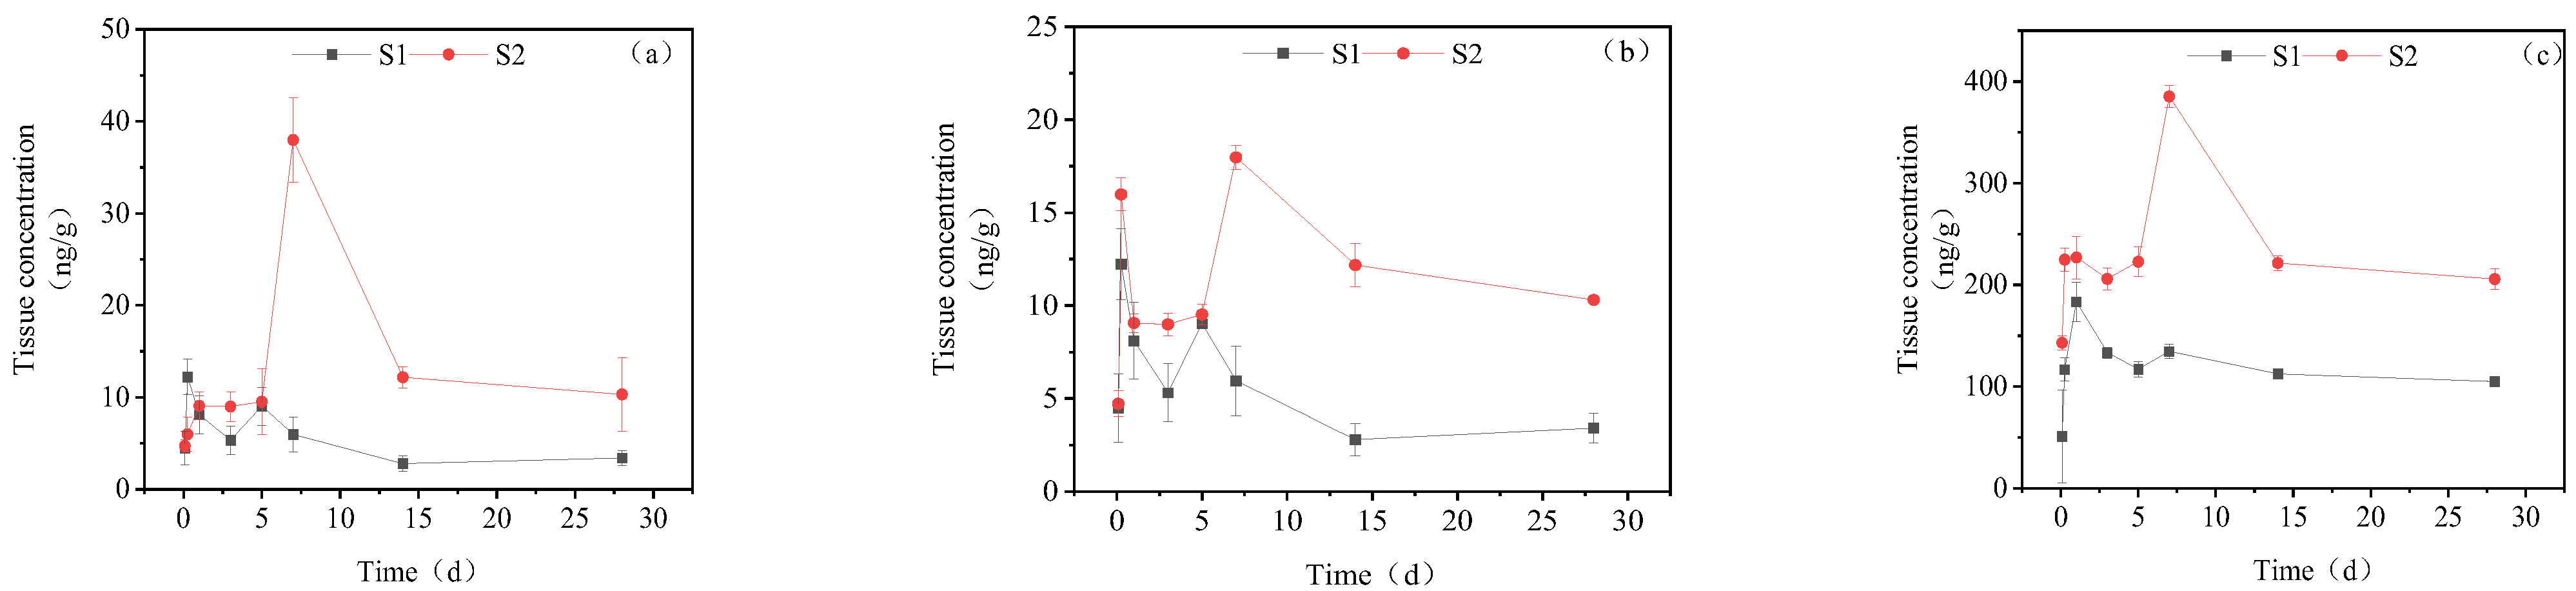
3.3. Dynamic Changes in IMI Metabolites in Different Tissues of Goldfish under Continuous Exposure
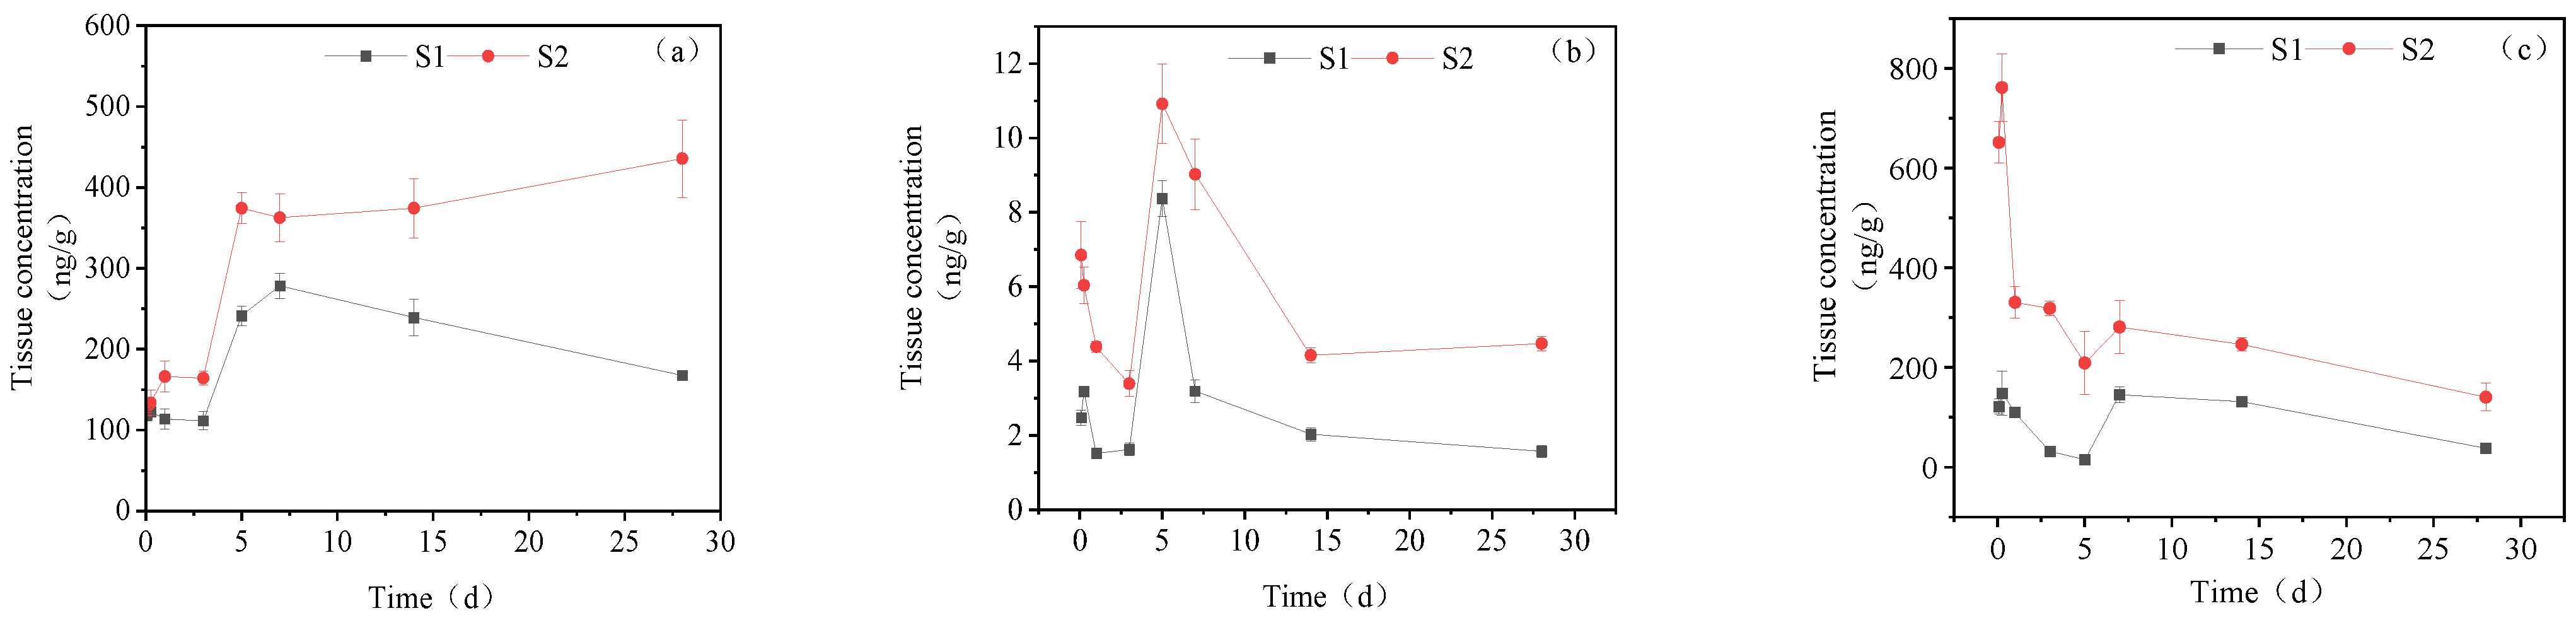
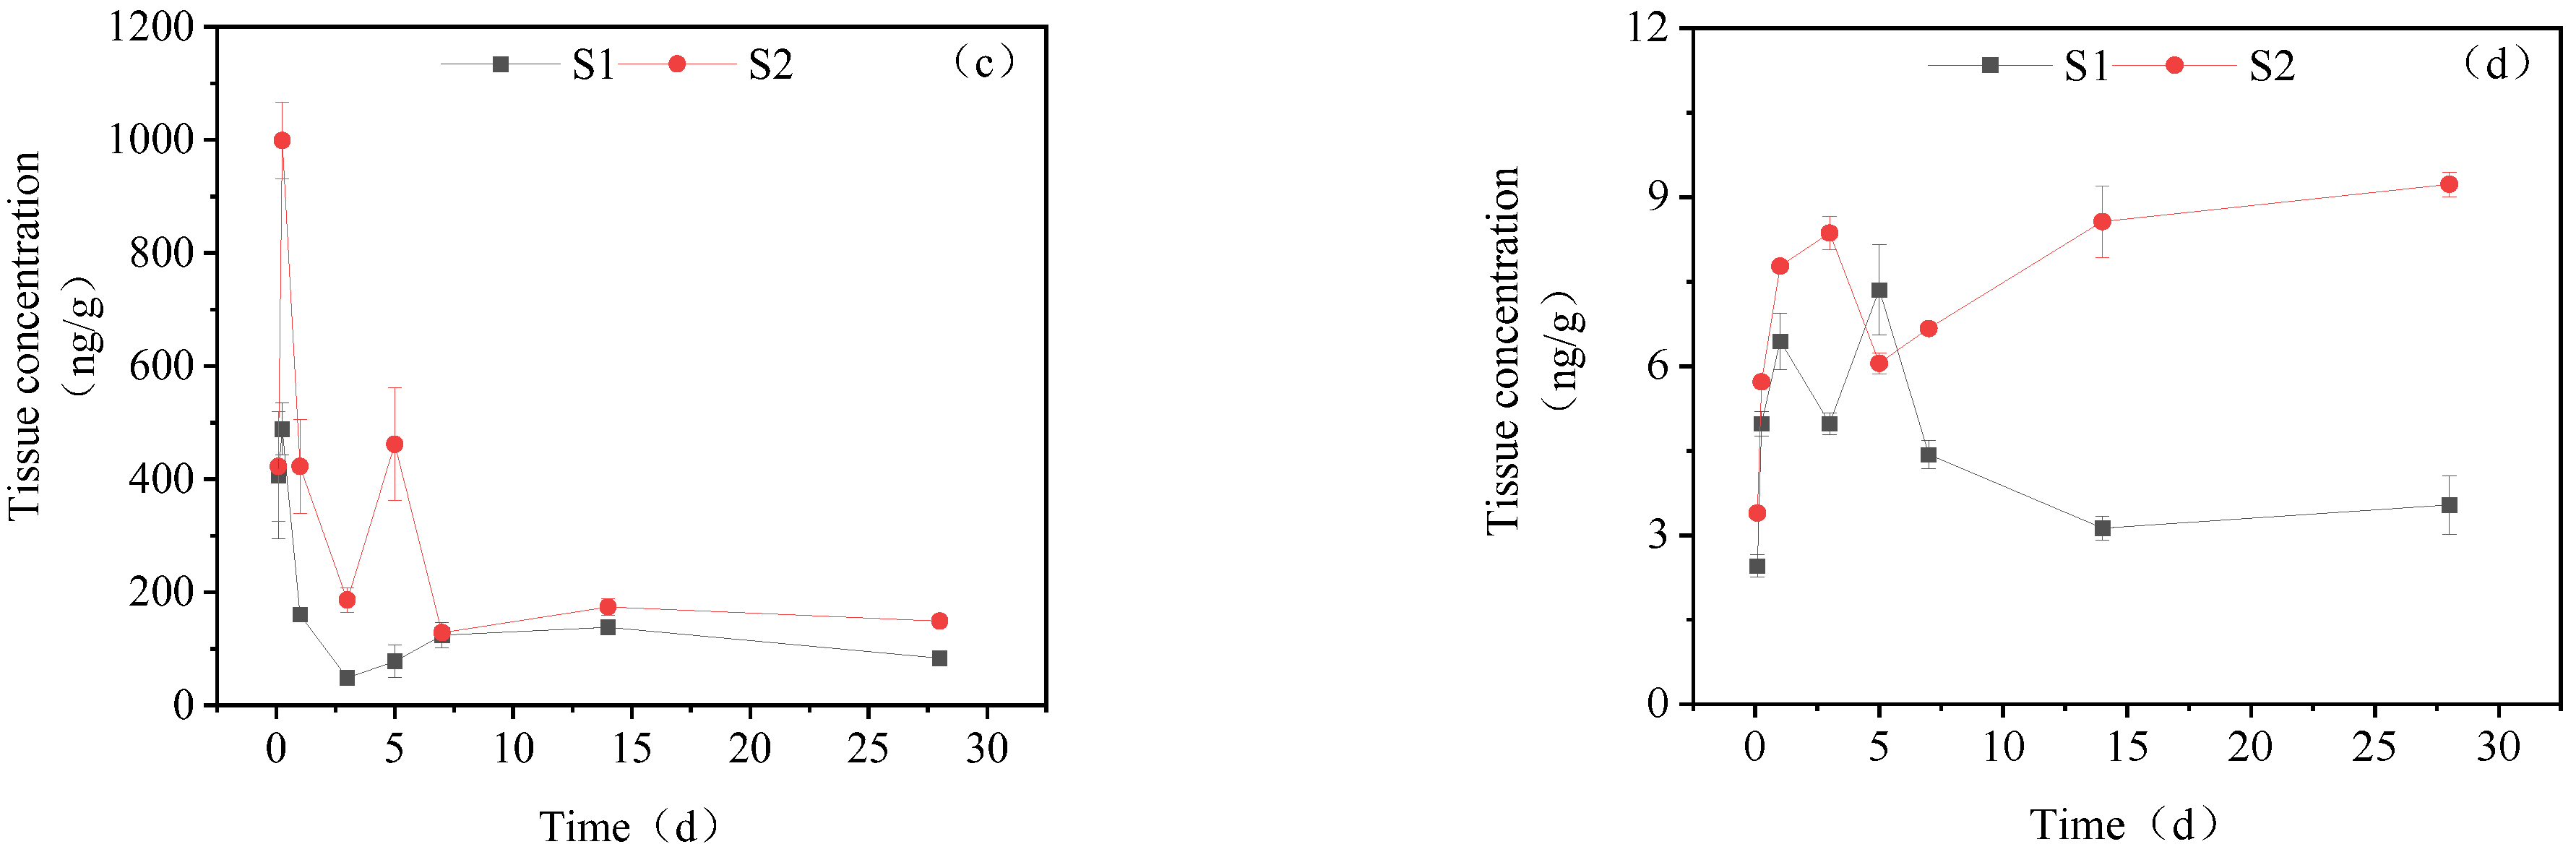
3.3.1. Concentration Changes in IMI Metabolites in Gill Tissues
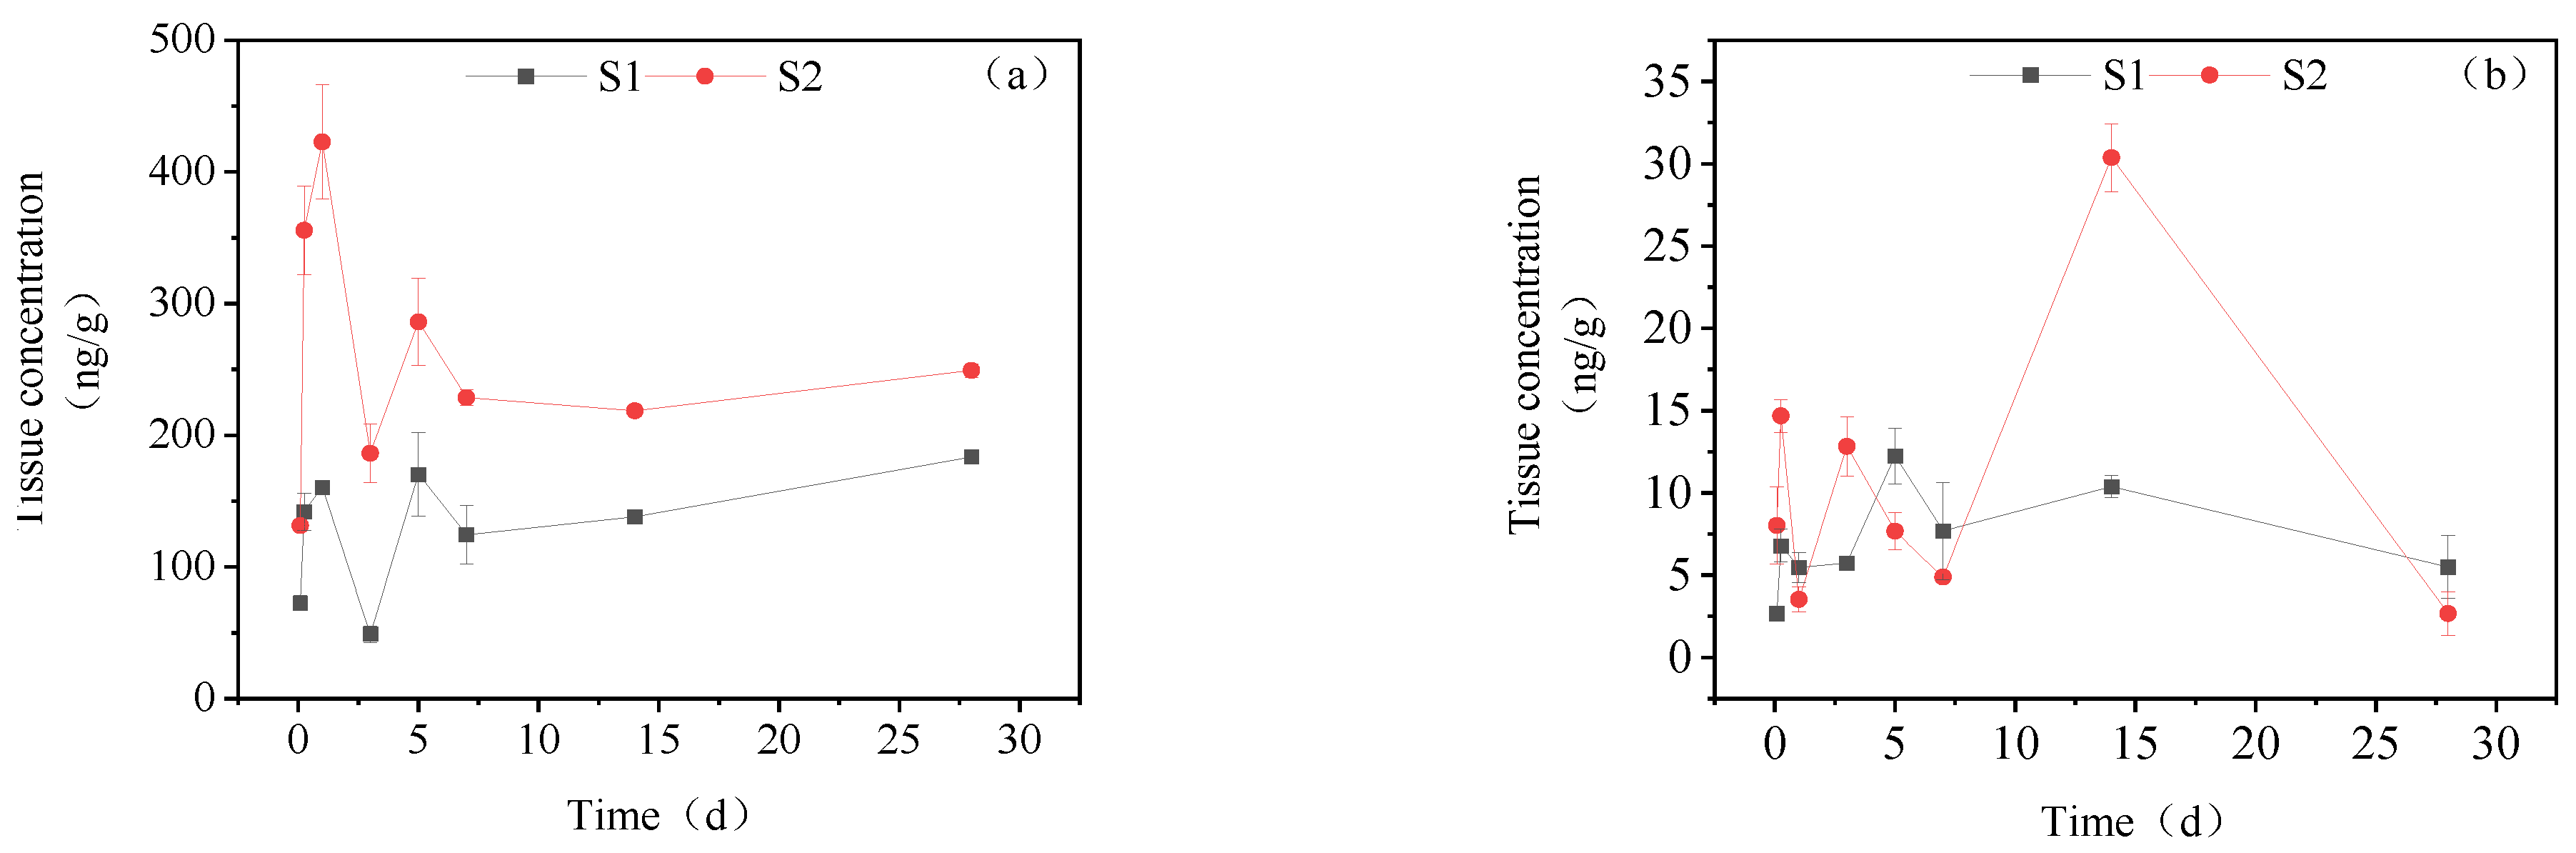
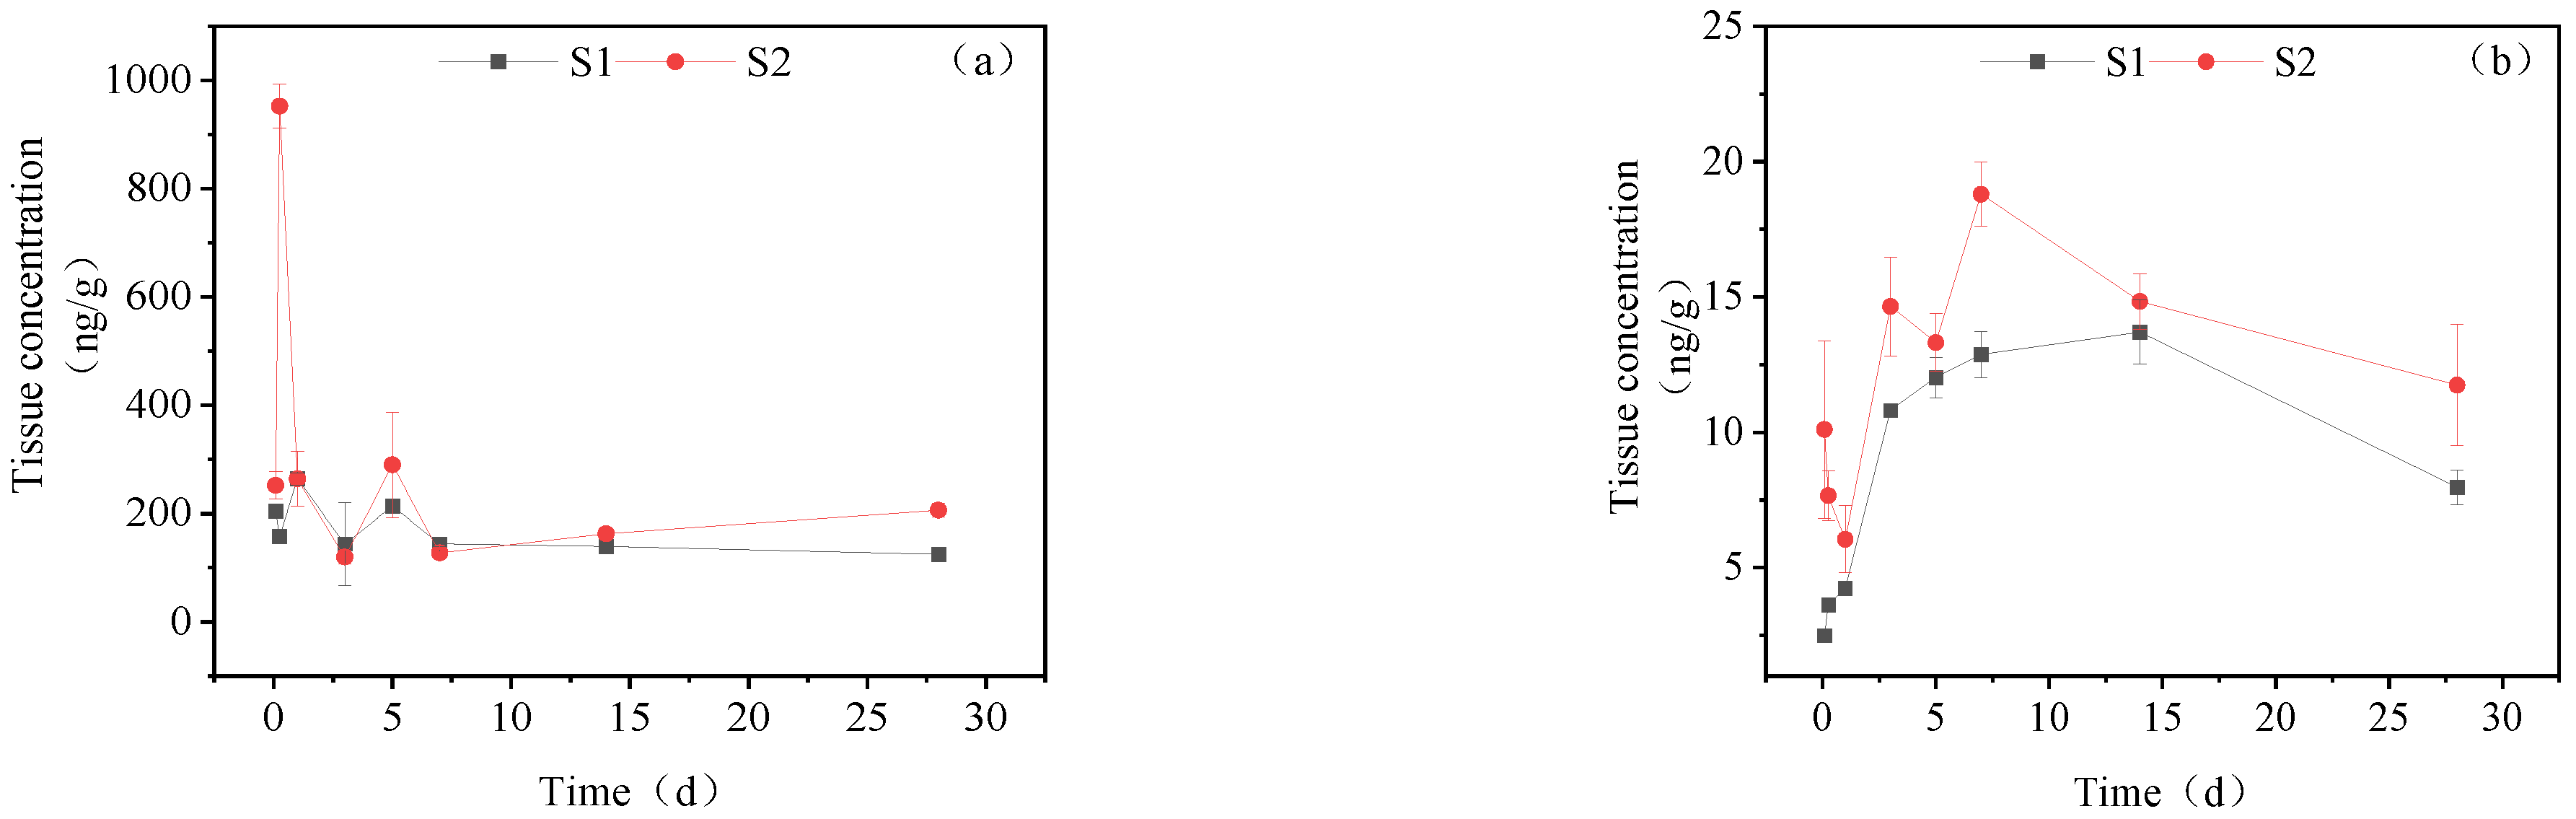
3.3.2. Dynamic Changes in IMI Metabolites in the Intestine
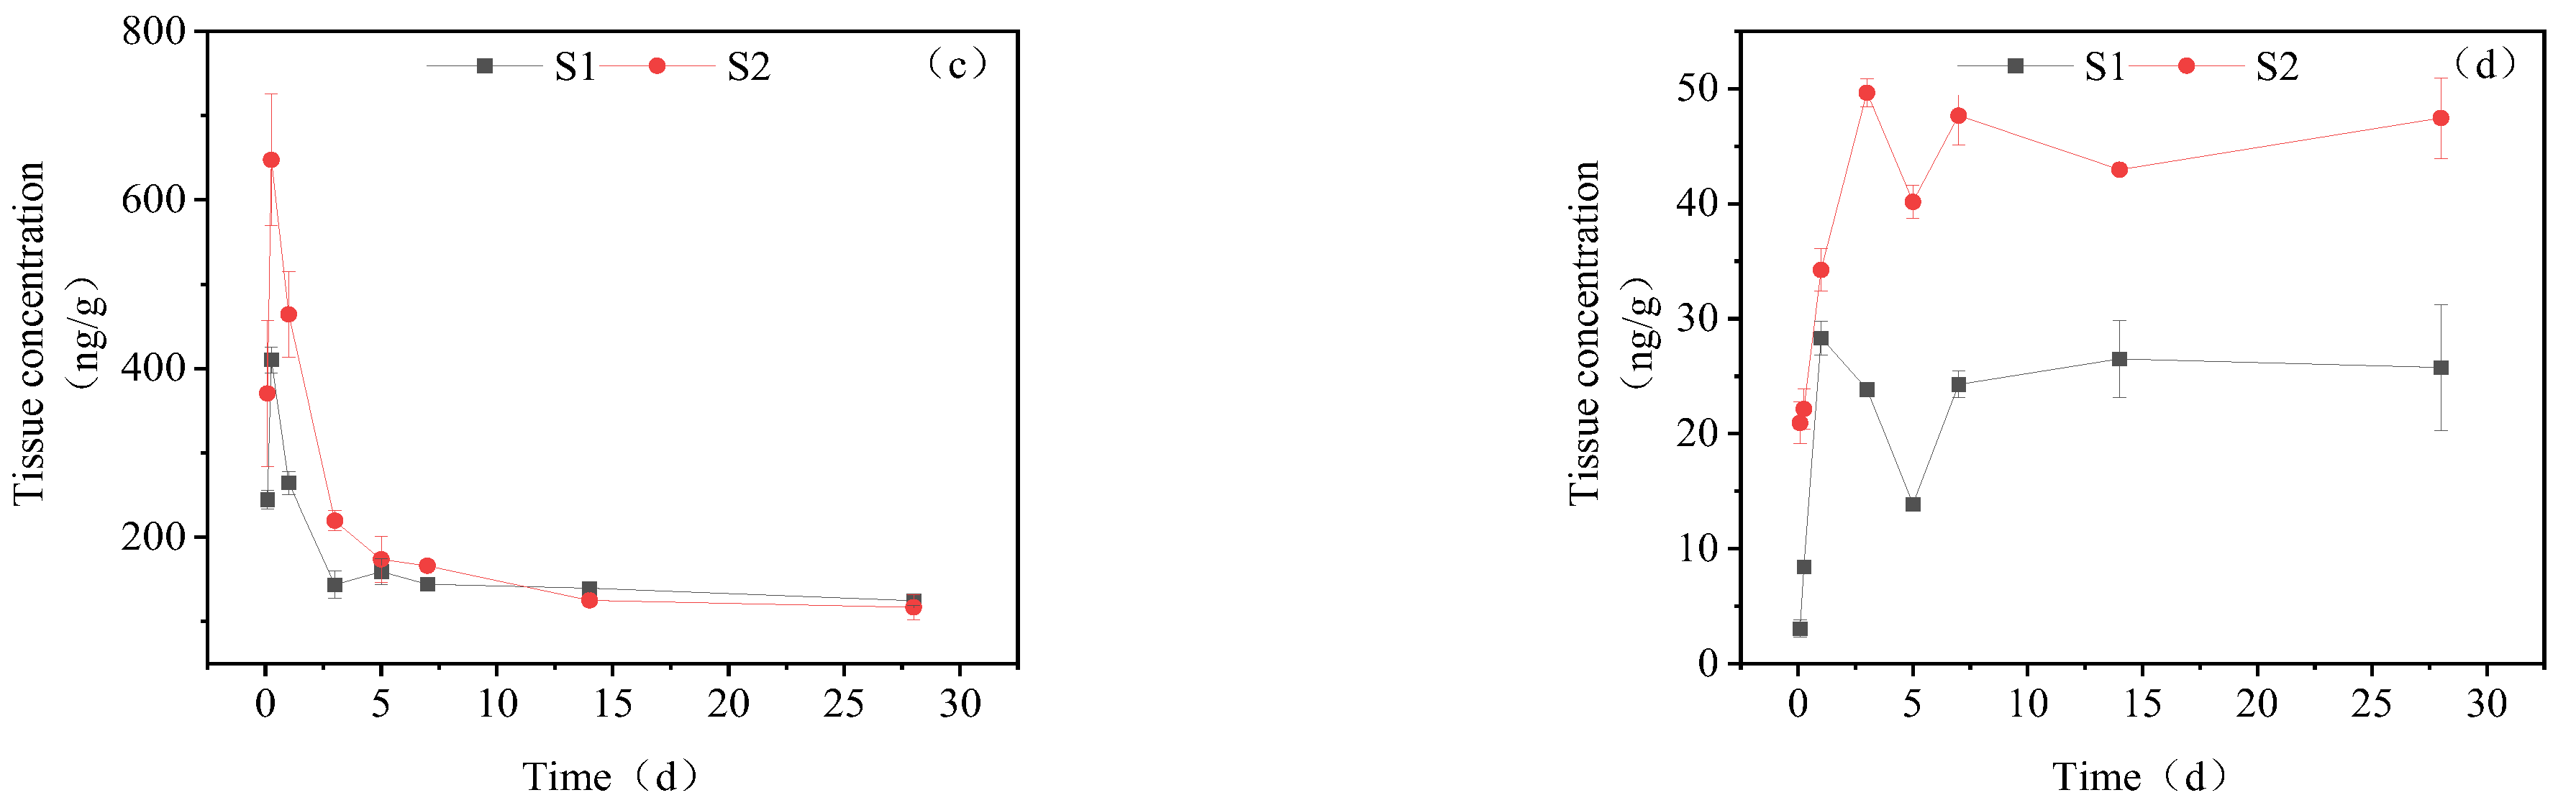
3.3.3. Dynamic Changes in IMI Metabolites in the Liver
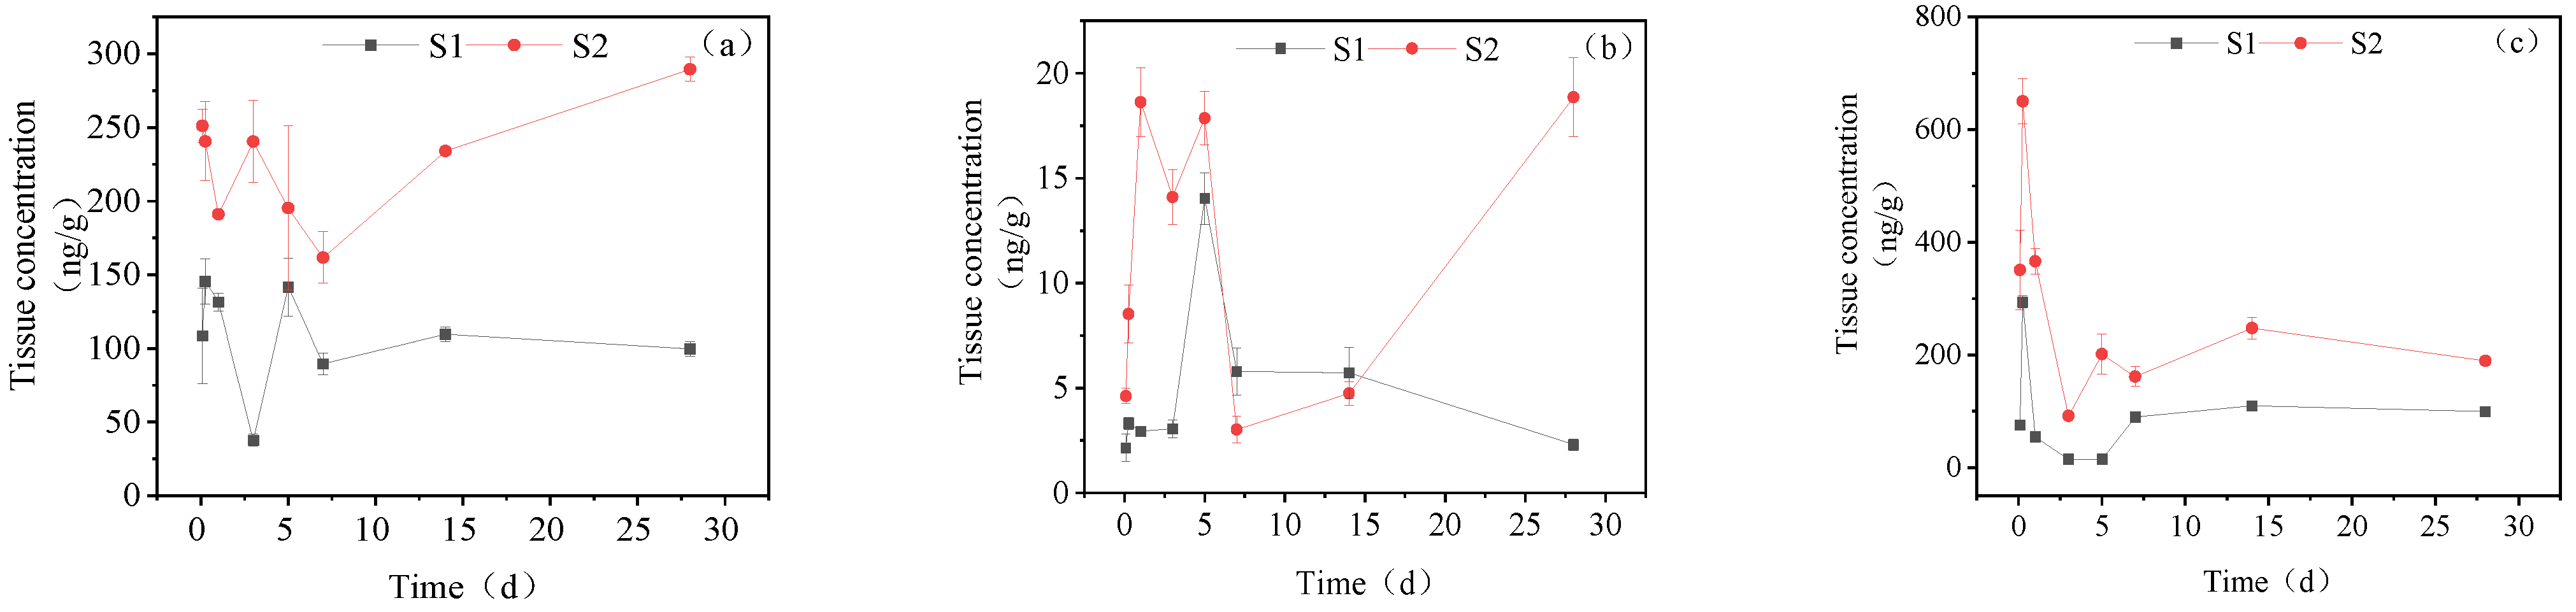
3.3.4. Dynamic Changes in IMI Metabolites in Muscle
3.3.5. Dynamic Changes in IMI Metabolites in Brain Tissue
3.3.6. Dynamic Changes in IMI Metabolites in Gonads
4. Discussion
5. Conclusions
Author Contributions
Funding
Institutional Review Board Statement
Informed Consent Statement
Data Availability Statement
Conflicts of Interest
References
- Peter, J.; Ralf, N.; Michael, S.; Alfred, E. Overview of the Status and Global Strategy for Neonicotinoids. J. Agric. Food Chem. 2011, 59, 2897–2908. [Google Scholar]
- Dave, G.; David, K. Review: An Overview of the Environmental Risks Posed by Neonicotinoid Insecticides. J. Appl. Ecol. 2013, 50, 977–987. [Google Scholar]
- Casida John, E. Neonicotinoids and Other Insect Nicotinic Receptor Competitive Modulators: Progress and Prospects. Annu. Rev. Entomol. 2018, 63, 125–144. [Google Scholar] [CrossRef]
- Hladik Michelle, L.; Main Anson, R.; Goulson, D. Environmental Risks and Challenges Associated with Neonicotinoid Insecticides. Environ. Sci. Technol. 2018, 52, 3329–3335. [Google Scholar] [CrossRef] [Green Version]
- Anderson, J.C.; Dubetz, C.; Palace, V.P. Neonicotinoids in the Canadian Aquatic Environment: A Literature Review on Current Use Products with a Focus on Fate, Exposure, and Biological Effects. Sci. Total Environ. 2015, 505, 409–422. [Google Scholar] [CrossRef]
- Struger, J.; Grabuski, J.; Cagampan, S.; Sverko, E.; McGoldrick, D.; Marvin, C.H. Factors Influencing the Occurrence and Distribution of Neonicotinoid Insecticides in Surface Waters of Southern Ontario, Canada. Chemosphere 2017, 169, 516–523. [Google Scholar] [CrossRef] [PubMed] [Green Version]
- Starner, K.; Kean, S.G. Detections of the Neonicotinoid Insecticide Imidacloprid in Surface Waters of Three Agricultural Regions of California, USA, 2010–2011. Bull. Environ. Contam. Toxicol. 2012, 88, 316–321. [Google Scholar] [CrossRef] [PubMed]
- Xu, M.; Huang, H.; Li, N.; Li, F.; Wang, D.; Luo, Q. Occurrence and Ecological Risk of Pharmaceuticals and Personal Care Products (Ppcps) and Pesticides in Typical Surface Watersheds, China. Ecotoxicol. Environ. Saf. 2019, 175, 289–298. [Google Scholar] [CrossRef]
- Zhang, Q.; Zhao, C.; Lu, X.; Yu, B.; Huang, Y. Advances in Research on Toxic Effects of Neonicotinoid Insecticides on Non-Target Organisms. Asian J. Ecotoxicol. 2019, 15, 56–71. [Google Scholar]
- Whitehorn, G.P.R.; O’Connor, S.; Wackers, F.L.; Goulson, D. Neonicotinoid Pesticide Reduces Bumble Bee Colony Growth and Queen Production. Science 2012, 336, 351–352. [Google Scholar] [CrossRef] [Green Version]
- Luo, T.; Wang, X.; Jin, Y. Low Concentrations of Imidacloprid Exposure Induced Gut Toxicity in Adult Zebrafish (Danio rerio). Comp. Biochem. Physiol. C Toxicol. Pharmacol. 2021, 241, 108972. [Google Scholar] [CrossRef]
- Ahmet, T.; Gonca, A.; Mustafa, O.; Cilingir, Y.A.; Selim, C.; Gurdal, A.; Mine, K.; Muhammed, A. Neurotoxic Responses in Brain Tissues of Rainbow Trout Exposed to Imidacloprid Pesticide: Assessment of 8-Hydroxy-2-Deoxyguanosine Activity, Oxidative Stress and Acetylcholinesterase Activity. Chemosphere 2017, 175, 186–191. [Google Scholar]
- Phugare Swapnil, S.; Jadhav Jyoti, P. Biodegradation of Acetamiprid by Isolated Bacterial Strain Rhodococcus sp. Bch2 and Toxicological Analysis of Its Metabolites in Silkworm (Bombax mori). Clean-Soil Air Water 2015, 43, 296–304. [Google Scholar] [CrossRef]
- Decourtye, A.; Devillers, J.; Cluzeau, S.; Charreton, M.; Pham-Delègue, M.-H. Effects of Imidacloprid and Deltamethrin on Associative Learning in Honeybees under Semi-Field and Laboratory Conditions. Ecotoxicol. Environ. Saf. 2004, 57, 410–419. [Google Scholar] [CrossRef] [PubMed]
- Ge, W.; Yan, S.; Wang, J.; Zhu, L.; Chen, A.; Wang, J. Oxidative Stress and DNA Damage Induced by Imidacloprid in Zebrafish (Danio rerio). J. Agric. Food Chem. 2015, 63, 1856–1862. [Google Scholar] [CrossRef]
- Gb 11607-1989; Section Fisheries Water Quality Standards Revision, Water Quality Standard for Fisheries. China National Environmental Protection Bureau: Beijing, China, 1989.
- Zheng, X.; Li, Z.; Xing, L.; Sun, X.; Men, X.; Guo, G.; Ren, Y. A study on the basic physiological and anatomical parameters of Cyprinidae fish under feeding conditions. J. Qingdao Agric. Univ. 2020, 37, 282–288. [Google Scholar]
- Gong, X.-J.; Su, M.; Zhao, C.; Zhou, X. Determination of Imidacloprid in Rats’ Plasma by RP/HPLC and Its Pharmacokinetics in Rats Receiving Intragastric Administration. J. Instrum. Anal. 2018, 37, 1500–1503. [Google Scholar]
- María, B.P.; Cristos, D.; Juan, M.P.; Julie, C.B. Tissue Distribution and Sublethal Effects of Imidacloprid in the South American Grayish Baywing (Agelaioides badius). Chemosphere 2021, 284, 131327. [Google Scholar]
- Jin, H.J.; Yang, R. Bioaccumulation and Monitoring of Chemicals in the Water Environment. Huanjing Jiance Guanli Yu Jishu 1990, 2, 12–18. [Google Scholar]
- Li, S. Evaluation of the Safety of Imidacloprid and Its Metabolites under the Integrated Rice and Procambarus Clarkii Breeding Model; Huazhong Agricultural University: Wuhan, China, 2020. [Google Scholar]
- Yang, Y.; Su, L.; Huang, Y.; Zhang, X.; Li, C.; Wang, J.; Fan, L.; Wang, S.; Zhao, Y.H. Bio-Uptake, Tissue Distribution and Metabolism of a Neonicotinoid Insecticide Clothianidin in Zebrafish. Environ. Pollut. 2022, 292, 118317. [Google Scholar] [CrossRef]
- Ihm, Y.B.; Kim, C.S.; Lee, H.D.; Jeong, M.; Kim, D.K.; Kyung, K.K. Behavior of the Insecticide Imidacloprid in Crucian Carp (Carassius auratus L.) and Its Toxic Effects on Organs. Korean J. Pestic. Sci. 2006, 10, 289–295. [Google Scholar]
- Suchail, S.; Sousa, G.D.; Rahmani, R.; Belzunces, L.P. In Vivo Distribution and Metabolisation of 14c-Imidacloprid in Different Compartments of Apis mellifera L. Pest Manag. Sci. 2004, 60, 1056–1062. [Google Scholar] [CrossRef] [PubMed]
- Byrne, F.J.; Castle, S.; Prabhaker, N.; Toscano, N.C. Biochemical Study of Resistance to Imidacloprid in B Biotype Bemisia Tabaci from Guatemala. Pest Manag. Sci. 2003, 59, 347–352. [Google Scholar] [CrossRef] [PubMed]
- Suchail, S.; Debrauwer, L.; Belzunces, L.P. Metabolism of Imidacloprid in Apis Mellifera. Pest Manag. Sci. 2004, 60, 291–296. [Google Scholar] [CrossRef] [PubMed]
- Wang, R.; Xiang, Q.; Chen, K.; Fang, Y. Advance in Search for Influence of CYP450 Genetic Polymorphism to Drugmetabolism. Chin. J. Clin. Pharmacol. 2004, 20, 134–138. [Google Scholar]
- Suchail, S.; Guez, D.; Belzunces, L.P. Characteristics of Imidacloprid Toxicity in Twoapis mellifera subspecies. Environ. Toxicol. Chem. 2000, 19, 1901–1905. [Google Scholar] [CrossRef] [Green Version]
- Fan, Y.; Shi, X.; Gao, X. Research Progresses on the Metabolism of Neonicotinoids Imidacloprid and Thiamethoxam. Chin. J. Pestic. Sci. 2012, 14, 587–596. [Google Scholar]
- Ralf, N.; Klaus, T.; Klaus, W.; Alfred, E. Efficacy of Plant Metabolites of Imidacloprid against Myzus persicae and Aphis gossypii (Homoptera: Aphididae). Pestic. Sci. 1998, 52, 53–57. [Google Scholar]


| Time/min | Aqueous Phase/% | Organic Phase/% |
|---|---|---|
| 0–5 | 80 | 20 |
| 5 | 60 | 40 |
| 6 | 40 | 60 |
| 7 | 80 | 20 |
| 8 | 80 | 20 |
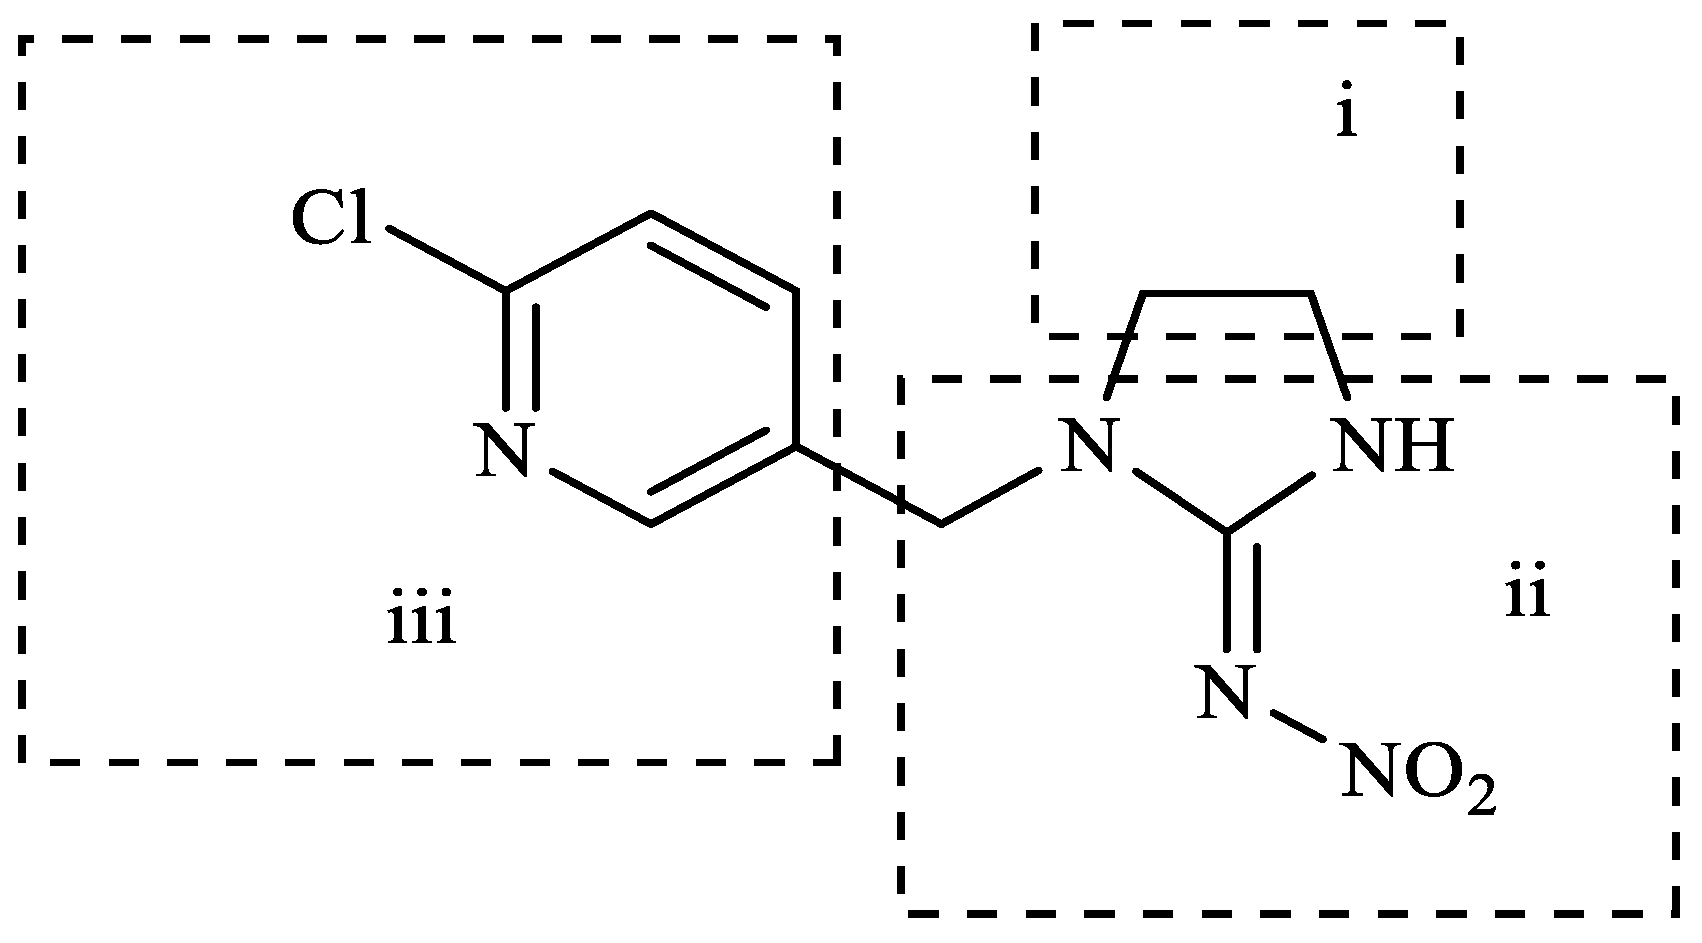
| Detection Object | Structural Formula | Parent Ion | Daughter Ion |
|---|---|---|---|
| IMI |  | 256.2 | 175.3 |
| IMI-urea |  | 212.2 | 128.1 |
| IMI-olefin |  | 254.2 | 171.0 |
| 5-Hydroxy-IMI |  | 272.2 | 225.3 |
| 6-Chloronicotinic acid |  | 155.9 | 112.1 |
| Object | LOD (Limit of Detection) (μg/L) | LOQ (Limit of Quantitation) (μg/L) | Precision/% | Recovery/% | RSD/% |
|---|---|---|---|---|---|
| IMI | 0.001 | 0.00334 | 3.41 | 96.08 | 6.523 |
| IMI-urea | 0.0099 | 0.032907 | 1.98 | 99.77 | 4.172 |
| IMI-olefin | 0.0011 | 0.003519 | 3.79 | 85.25 | 7.355 |
| 5-Hydroxy-IMI | 0.0068 | 0.022718 | 2.84 | 87.24 | 8.825 |
| 6-Chloronicotinic acid | 0.0056 | 0.018682 | 2.64 | 100.23 | 2.805 |
| Metabolite | Maximum Accumulation | Time | Ratio | |
|---|---|---|---|---|
| Intestine | IMI-urea | 432.34 | 24 h | 7.47% |
| IMI-olefin | 9.37 | 28 d | 0.10% | |
| 6-Chloronicotinic acid | 31.27 | 14 d | 0.32% | |
| 5-Hydroxy-IMI | 1021.25 | 6 h | 35.64% | |
| Liver | IMI-urea | 952.38 | 6 h | 25.81% |
| IMI-olefin | 38.28 | 28 d | 0.32% | |
| 6-Chloronicotinic acid | 18.79 | 14 d | 0.18% | |
| 5-Hydroxy-IMI | 653.13 | 6 h | 23.60% | |
| Gill | IMI-urea | 430.67 | 28 d | 9.72% |
| 6-Chloronicotinic acid | 10.97 | 5 d | 0.23% | |
| 5-Hydroxy-IMI | 784.34 | 6 h | 42.68% | |
| Muscle | IMI-urea | 298.39 | 28 d | 3.99% |
| 6-Chloronicotinic acid | 18.85 | 1 d | 0.16% | |
| 5-Hydroxy-IMI | 758.45 | 6 h | 19.34% | |
| Brain | IMI–urea | 319.24 | 5 d | 7.30% |
| 6-Chloronicotinic acid | 10.74 | 1 d | 0.06% | |
| 5-Hydroxy-IMI | 654 | 6 h | 21.80% | |
| Gonad | IMI-urea | 38.92 | 7 d | 0.41% |
| 6-Chloronicotinic acid | 18.34 | 6 h | 0.59% | |
| 5-Hydroxy-IMI | 389.56 | 7 d | 5.58% |
Disclaimer/Publisher’s Note: The statements, opinions and data contained in all publications are solely those of the individual author(s) and contributor(s) and not of MDPI and/or the editor(s). MDPI and/or the editor(s) disclaim responsibility for any injury to people or property resulting from any ideas, methods, instructions or products referred to in the content. |
© 2023 by the authors. Licensee MDPI, Basel, Switzerland. This article is an open access article distributed under the terms and conditions of the Creative Commons Attribution (CC BY) license (https://creativecommons.org/licenses/by/4.0/).
Share and Cite
Xu, W.; Zhang, L.; Hou, J.; Du, X.; Chen, L. Absorption and Distribution of Imidacloprid and Its Metabolites in Goldfish (Carassius auratus Linnaeus). Toxics 2023, 11, 619. https://doi.org/10.3390/toxics11070619
Xu W, Zhang L, Hou J, Du X, Chen L. Absorption and Distribution of Imidacloprid and Its Metabolites in Goldfish (Carassius auratus Linnaeus). Toxics. 2023; 11(7):619. https://doi.org/10.3390/toxics11070619
Chicago/Turabian StyleXu, Wanghui, Lulu Zhang, Jiayin Hou, Xiaohua Du, and Liezhong Chen. 2023. "Absorption and Distribution of Imidacloprid and Its Metabolites in Goldfish (Carassius auratus Linnaeus)" Toxics 11, no. 7: 619. https://doi.org/10.3390/toxics11070619