
Environmental Geochemical Analysis in the Yanomami Indigenous Land, Mucajaí River Basin, State of Roraima, Brazil

Abstract
:1. Introduction
2. Materials and Methods
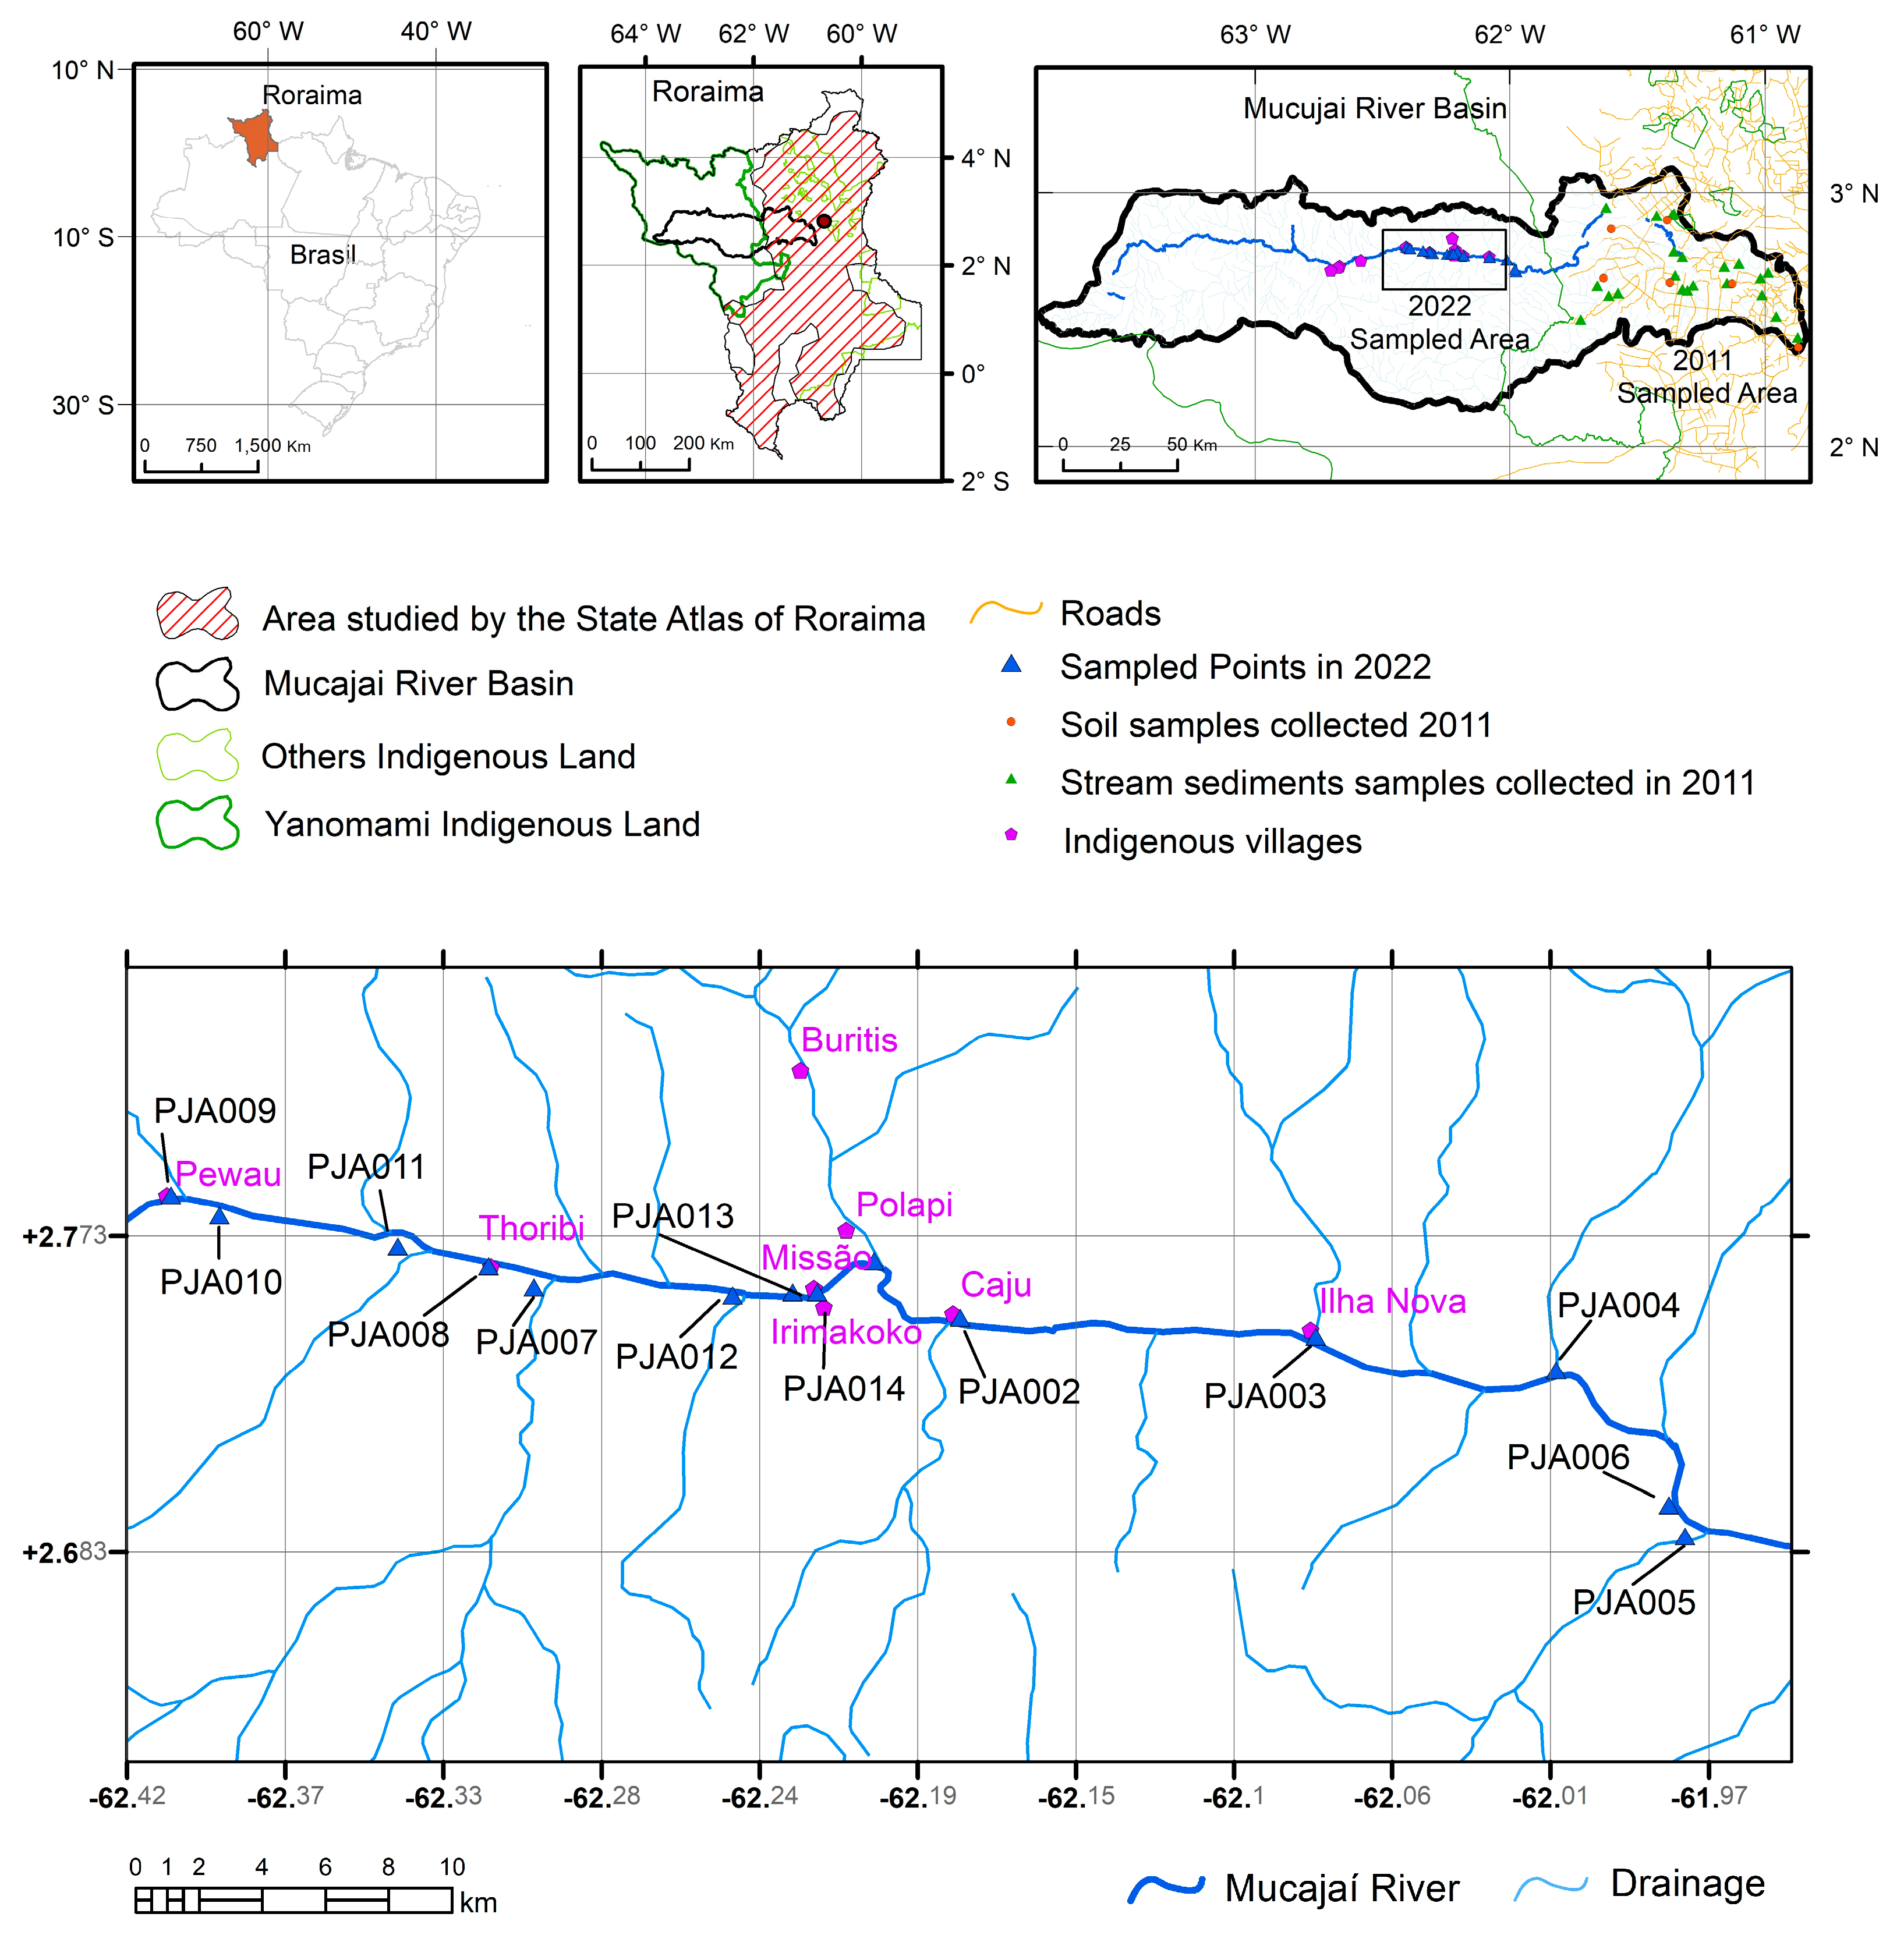
2.1. Study Area and Sampling Points
2.2. Data Collection
2.3. Laboratories
2.4. Legal References Used
3. Results
4. Discussion
5. Conclusions
Author Contributions
Funding
Institutional Review Board Statement
Informed Consent Statement
Data Availability Statement
Acknowledgments
Conflicts of Interest
References
- Doufexi, M.; Gamvroula, D.E.; Alexakis, D.E. Elements’ Content in Stream Sediment and Wildfire Ash of Suburban Areas in West Attica (Greece). Water 2022, 14, 310. [Google Scholar] [CrossRef]
- Alexakis, D.E. Diagnosis of stream sediment quality and assessment of toxic element contamination sources in East Attica, Greece. Environ. Earth Sci. 2011, 63, 1369–1383. [Google Scholar] [CrossRef]
- Ambrosino, M.; El-Saadani, Z.; Khatita, A.A.; Mingqi, W.; Palarea-Albaladejo, J.; Cicchella, D. Geochemical Speciation, Ecological Risk and Assessment of Main Sources of Potentially Toxic Elements (PTEs) in Stream Sediments from Nile River in Egypt. Water 2023, 15, 2308. [Google Scholar] [CrossRef]
- Melfi, A.J.; Forti, C. Estudo do Ciclo de Mercúrio no Ecossistema da Floresta Amazônica: Avaliação do Impacto da Mineração de ouro com Utilização de Mercúrio. Relatório Científico Final PADCT/CIAMB—CNPq No 620375/92.2. Edição Revisada em 2019. Available online: http://mtc-m21b.sid.inpe.br/col/sid.inpe.br/mtc-m21b/2019/10.04.14.36/doc/Relat-Hg-2019_datapaper.pdf (accessed on 6 July 2023).
- Steffen, W.P.; Crutzen, P.J.; McNeill, J.R. The Anthropocene: Are Humans Now Overwhelming the Great Forces of Nature? In Crutzen and the Anthropocene: A New Epoch in Earth’s History 2021. The Anthropocene: Politik—Economics—Society—Science; Benner, S., Lax, G., Crutzen, P.J., Pöschl, U., Lelieveld, J., Brauch, H.G., Paul, J., Eds.; Springer: Cham, Switzerland, 2007; Volume 1. [Google Scholar] [CrossRef]
- Waters, C.N.; Zalasiewicz, J.; Summerhayes, C.; Barnosky, A.D.; Poirier, C.; Gałuszka, A.; Cearreta, A.; Edgeworth, M.; Ellis, E.C.; Ellis, M.; et al. The Anthropocene is functionally and stratigraphically distinct from the Holocene. Science 2016, 351, aad2622. [Google Scholar] [CrossRef] [PubMed]
- Diegues, A. A Dinâmica Social do Desmatamento na Amazônia: Populações e Modos de Vida em Rondônia e Sudeste do Pará; UNRISD: São Paulo, Brazil; USP: North Bethesda, MD, USA; NUPAB: Cincinnati, OH, USA, 1993. [Google Scholar]
- Margulis, S. Causas do Desmatamento da Amazônia Brasileira; Banco Mundial: Brasília, Brazil, 2003. [Google Scholar]
- Wanderley, L. Geografia do Ouro na Amazônia Brasileira: Uma Análise a Partir da Porção Meridional. Ph.D. Thesis, Universidade Federal do Rio de Janeiro, Rio de Janeiro, Brazil, 2015. [Google Scholar]
- Mapbiomas. Coleção 7 da Série Anual de uso e Cobertura da Terra do Brasil. Available online: https://mapbiomas.org/ (accessed on 31 October 2022).
- Basta, P.C.; Viana, P.V.S.; Vasconcellos, A.C.S.; Périssé, A.R.S.; Hofer, C.B.; Paiva, N.S.; Kempton, J.W.; Ciampi De Andrade, D.; Oliveira, R.A.A.; Achatz, R.W.; et al. Mercury exposure in Munduruku indigenous communities from Brazilian Amazon: Methodological background and an overview of the principal results. Int. J. Environ. Res. Public Health 2021, 18, 9222. [Google Scholar] [PubMed]
- Passos, C.J.S.; Mergler, D. Human mercury exposure and adverse health effects in the Amazon: A review. Cad. Saúde Pública 2008, 24, s503–s520. [Google Scholar] [CrossRef] [PubMed]
- Mataveli, G.; Chaves, M.; Guerrero, J.; Escobar-Silva, E.V.; Conceição, K.; Oliveira, G. Mining Is a Growing Threat within Indigenous Lands of the Brazilian Amazon. Remote Sens. 2022, 14, 4092. [Google Scholar] [CrossRef]
- SIGMINE. Available online: https://geo.anm.gov.br/portal/apps/webappviewer/index.html?id=6a8f5ccc4b6a4c2bba79759aa952d908 (accessed on 31 March 2023).
- Conselho Nacional do Meio Ambiente. Resolução no 357, de 17 de março de 2005. Dispõe sobre a Classificação dos Corpos de água e Diretrizes Ambientais para o seu Enquadramento, bem como Estabelece as Condições e Padrões de Lançamento de Efluentes e dá Outras Providências; Diário Oficial da União: Seção 1, Brasília, DF, ano 142, n. 53; Conselho Nacional do Meio Ambiente: Brasília, Brazil, 2005; pp. 58–63. [Google Scholar]
- Conselho Nacional do Meio Ambiente. Resolução no 396, de 3 de Abril de 2008. Dispõe Sobre a Classificação e Diretrizes Ambientais Para o Enquadramento das Águas Subterrâneas e dá Outras Providências; Diário Oficial da União: Seção 1, Brasília, DF, ano 145, n. 66; Conselho Nacional do Meio Ambiente: Brasília, Brazil, 2008; pp. 64–68. [Google Scholar]
- Conselho Nacional do Meio Ambiente. Resolução no 454, de 01 de Novembro de 2012. Estabelece as Diretrizes Gerais e os Procedimentos Referenciais para o Gerenciamento do Material a ser Dragado em Águas sob Jurisdição Nacional; Diário Oficial da União: Seção 1, Brasília, DF, ano 149, n. 216; Conselho Nacional do Meio Ambiente: Brasília, Brazil, 2012; pp. 66–69. [Google Scholar]
- Buchman, M.F. Screening Quick Reference Tables. Seattle: NOAA. 2008; (NOAA OR & R Report 08-1). Available online: https://repository.library.noaa.gov/view/noaa/9327 (accessed on 28 November 2016).
- World Health Organization. Guidelines for Drinking Water Quality: Recommendations, 3rd ed.; WHO: Geneva, Switzerland, 2008; Available online: http://www.who.int/water_sanitation_health/dwq/fulltext.pdf (accessed on 13 September 2010).
- Freitas, A.F.; Marmos, J.L. Atlas Geoquímico do Estado de Roraima: Projeto Levantamento Geoquímico de Baixa Densidade do Estado de Roraima; CPRM: Recife, Brazil, 2017; 225p. [Google Scholar]
- Azevedo, F.A. Toxicologia do Mercúrio; Edição 1; Editora Rima: São Carlos, Brazil, 2003; 272p. [Google Scholar]
- Morel, F.M.; Kraepiel, A.M.; Amyot, M. The chemical cycle and bioaccumulation of mercury. Annu. Rev. Ecol. Syst. 1998, 29, 543–566. [Google Scholar]
- FAO/WHO. Joint FAO/WHO Expert Committee on Food Additives (JECFA); Report of the Tenth Section; FAO/WHO: Rotterdam, The Netherlands, 2016; Available online: http://www.fao.org/fao-who-codexalimentarius/sh-proxy/en/?lnk=1&url=https%253A%252F%252Fworkspace (accessed on 6 July 2023).
- de Vasconcellos, A.C.S.; Ferreira, S.R.B.; de Sousa, C.C.; de Oliveira, M.W.; de Oliveira Lima, M.; Basta, P.C. Health Risk Assessment Attributed to Consumption of Fish Contaminated with Mercury in the Rio Branco Basin, Roraima, Amazon, Brazil. Toxics 2022, 10, 516. [Google Scholar] [CrossRef] [PubMed]
- Marques, R.C.; Bernardi, J.V.E.; Cunha, M.P.L.; Dórea, J.G. Impact of organic mercury exposure and home delivery on neurodevelopment of Amazonian children. Int. J. Hyg. Environ. Health 2016, 219, 498–502. [Google Scholar] [PubMed]
- Reuben, A.; Frischtak, H.; Berky, A.; Ortiz, E.J.; Morales, A.M.; Hsu-Kim, H.; Pendergast, L.L.; Pan, W.K. Elevated Hair Mercury Levels Are Associated with Neurodevelopmental Deficits in Children Living Near Artisanal and Small-Scale Gold Mining in Peru. GeoHealth 2020, 4, e2019GH000222. [Google Scholar] [CrossRef]
- Crespo-López, M.; Augusto-Oliveira, M.; Lopes-Araújo, A.; Santos-Sacramento, L.; Takeda, P.; Macchi, B.; Nascimento, J.; Maia, C.; Lima, R.; Arrifano, G. Mercury: What can we learn from the Amazon? Environ. Int. 2021, 146, 106223. [Google Scholar] [CrossRef] [PubMed]
- Junior, J.M.F.C.; Da Silva Lima, A.A.; Junior, D.R.; Khoury, E.D.T.; Da Silva Souza, G.; De Lima Silveira, L.C.; Pinheiro, M.D.C.N. Manifestações emocionais e motoras de ribeirinhos expostos ao mercúrio na Amazônia. Rev. Bras. Epidemiol. 2017, 20, 212–224. [Google Scholar] [CrossRef]


| Sample ID | Lat (N) | Long (W) | Date | Elevation | Location of Sampling Points |
|---|---|---|---|---|---|
| PJA001 | 2.76584 | −62.20544 | 10-October-2022 | 185 | Left bank of Klokonai River, near the left bank of Mucajaí River |
| PJA002 | 2.74977 | −62.18100 | 10-October-2022 | 186 | Left bank of Klaitabiu River |
| PJA003 | 2.74438 | −62.07983 | 10-October-2022 | 182 | Left bank of Baixukuau River |
| PJA004 | 2.73472 | −62.01156 | 10-October-2022 | 184 | Left bank of Sikaimabiu River |
| PJA005 | 2.68764 | −61.97510 | 10-October-2022 | 171 | Right bank of Jacaré River |
| PJA006 | 2.69650 | −61.97961 | 10-October-2022 | 176 | Right bank of the Mucajaí River. Sandbank abandoned by prospectors, with many pebbles. |
| PJA007 | 2.75834 | −62.30223 | 11-October-2022 | 203 | Right bank of Guximai River, a tributary of the right bank of the Mucajaí River |
| PJA008 | 2.76437 | −62.31511 | 11-October-2022 | 209 | Left bank of the Yalakapu Creek, a tributary of the left bank of the Mucajaí River |
| PJA009 | 2.78466 | −62.40548 | 11-October-2022 | 221 | Left bank of the Pewau River. Indigenous Village of Pewau |
| PJA010 | 2.77879 | −62.39161 | 11-October-2022 | 212 | Upper Mucajaí River |
| PJA011 | 2.76993 | −62.34092 | 11-October-2022 | 211 | Right bank of the Mucajaí River, near Fumaça Waterfall. |
| PJA012 | 2.75605 | −62.24571 | 11-October-2022 | 189 | Left bank of the Mucajaí River |
| PJA013 | 2.75697 | −62.22869 | 12-October-2022 | 200 | Left bank of the Maxthak-u River, a tributary of the left bank of the Mucajaí River. |
| PJA014 | 2.75700 | −62.22169 | 12-October-2022 | 200 | Left bank of the Mucajaí River. Iasasi Indigenous Village |
| Physico–Chemical Parameters | |||||||
|---|---|---|---|---|---|---|---|
| Sample ID | Conductivity (µS/cm) | Temp (°C) | pH | Turbidity (NTU) | Eh (mV) | TDS (mg/L) | - |
| PJA001 | 57 | 24.90 | 6.44 | 23.30 | −3.50 | 37 | |
| PJA002 | 65 | 24.70 | 6.21 | 8.30 | 47.40 | 40 | |
| PJA003 | 56 | 26.20 | 6.22 | 16.40 | −0.50 | 36 | |
| PJA004 | 82 | ------- | 6.05 | 15.10 | 57.50 | 52 | |
| PJA005 | 77 | 27.30 | 6.80 | 30.40 | −119.70 | 49 | |
| PJA006 | 47 | 27.50 | 7.06 | 1176.00 | −149.70 | 31 | |
| PJA007 | 118 | 24.98 | 6.78 | 2016.00 | −16.10 | 78 | |
| PJA008 | 70 | 24.00 | 6.41 | 33.40 | −6.00 | 44 | |
| PJA009 | 46 | 24.50 | 6.44 | 16.70 | 8.60 | 29 | |
| PJA010 | 53 | 26.60 | 6.73 | 195.00 | 15.50 | 32 | |
| PJA011 | 49 | 26.30 | 6.46 | 136.00 | −87.10 | 31 | |
| PJA012 | 48 | 26.70 | 6.35 | 176.00 | −47.60 | 27 | |
| PJA013 | 63 | 25.00 | 6.53 | 6.50 | 21.50 | 42 | |
| PJA014 | 47 | 26.80 | 6.06 | 209.00 | 58.70 | 31 | |
| Anions | |||||||
| Sample ID | Bromide mg/L | Chloride mg/L | Fluoride mg/L | Phosphate mg/L | Nitrate mg/L | Nitrite mg/L | Sulfate mg/L |
| PJA001 | 0.005 | 3.9274 | 0.0427 | 0.005 | 0.4702 | 0.005 | 0.0782 |
| PJA002 | 0.005 | 0.6541 | 0.0674 | 0.005 | 0.4639 | 0.005 | 0.005 |
| PJA003 | 0.005 | 0.6885 | 0.0586 | 0.005 | 0.4903 | 0.005 | 0.0882 |
| PJA004 | 0.005 | 0.7983 | 0.0573 | 0.005 | 0.5132 | 0.005 | 0.0653 |
| PJA005 | 0.005 | 0.7815 | 0.0774 | 0.005 | 0.645 | 0.005 | 0.1737 |
| PJA006 | 0.005 | 0.5686 | 0.0439 | 0.005 | 0.8243 | 0.005 | 0.2050 |
| PJA007 | 0.005 | 0.6466 | 0.0396 | 0.005 | 0.6286 | 0.005 | 0.0911 |
| PJA008 | 0.01505 | 0.7984 | 0.0426 | 0.005 | 1.0462 | 0.0101 | 0.2494 |
| PJA009 | 0.005 | 0.5171 | 0.0355 | 0.005 | 0.4726 | 0.005 | 0.0434 |
| PJA010 | 0.005 | 0.4845 | 0.0457 | 0.005 | 0.728 | 0.005 | 0.2221 |
| PJA011 | 0.005 | 0.5298 | 0.0399 | 0.005 | 0.7090 | 0.005 | 0.2057 |
| PJA012 | 0.005 | 0.5061 | 0.0434 | 0.005 | 0.8378 | 0.005 | 0.4135 |
| PJA013 | 0.005 | 0.7459 | 0.0778 | 0.01275 | 0.3616 | 0.005 | 0.1958 |
| PJA014 | 0.005 | 0.7904 | 0.0444 | 0.005 | 0.8783 | 0.005 | 0.2568 |
| Cations | |||||||
| Sample ID | Al mg/L | Ba mg/L | Ca mg/L | Fe mg/L | Hg mg/L | K mg/L | |
| PJA001 | 0.01 | 0.03 | 1.507 | 0.175 | 0.00025 | 1.696 | |
| PJA002 | 0.01 | 0.05 | 1.945 | 0.074 | 0.00025 | 1.914 | |
| PJA003 | 0.01 | 0.042 | 1.483 | 0.217 | 0.00025 | 1.567 | |
| PJA004 | 0.01 | 0.062 | 2.219 | 0.34 | 0.00025 | 1.419 | |
| PJA005 | 0.01 | 0.056 | 2.16 | 0.528 | 0.00025 | 1.295 | |
| PJA006 | 0.01 | 0.021 | 1.402 | 0.304 | 0.00025 | 1.145 | |
| PJA007 | 0.01 | 0.029 | 1.665 | 0.316 | 0.00025 | 0.949 | |
| PJA008 | 0.126 | 0.035 | 0.981 | 0.271 | 0.00025 | 1.655 | |
| PJA009 | 0.021 | 0.005 | 0.545 | 0.096 | 0.00025 | 0.772 | |
| PJA010 | 0.01 | 0.012 | 0.767 | 0.13 | 0.00025 | 0.792 | |
| PJA011 | 0.041 | 0.014 | 0.695 | 0.187 | 0.00025 | 0.785 | |
| PJA012 | 0.023 | 0.013 | 0.789 | 0.173 | 0.00025 | 0.74 | |
| PJA013 | 0.01 | 0.03 | 2.402 | 0.197 | 0.00025 | 2.168 | |
| PJA014 | 0.01 | 0.005 | 1.713 | 0.113 | 0.00025 | 1.274 | |
| Sample ID | Mg mg/L | Mn mg/L | Na mg/L | Si mg/L | Sr mg/L | Zn mg/L | |
| PJA001 | 0.674 | 0.005 | 2.078 | 7.266 | 0.025 | 0.018 | |
| PJA002 | 1.307 | 0.024 | 2.927 | 11.102 | 0.03 | 0.011 | |
| PJA003 | 0.956 | 0.012 | 2.296 | 7.473 | 0.031 | 0.005 | |
| PJA004 | 1.144 | 0.02 | 3.272 | 11.442 | 0.048 | 0.005 | |
| PJA005 | 1.338 | 0.03 | 2.587 | 8.996 | 0.039 | 0.005 | |
| PJA006 | 0.793 | 0.011 | 1.587 | 6.075 | 0.025 | 0.005 | |
| PJA007 | 0.824 | 0.019 | 1.556 | 6.015 | 0.026 | 0.005 | |
| PJA008 | 0.822 | 0.015 | 1.245 | 4.509 | 0.021 | 0.005 | |
| PJA009 | 0.283 | 0.011 | 1.002 | 3.859 | 0.013 | 0.005 | |
| PJA010 | 0.642 | 0.005 | 1.012 | 3.256 | 0.013 | 0.005 | |
| PJA011 | 0.557 | 0.005 | 1.111 | 3.801 | 0.014 | 0.005 | |
| PJA012 | 0.663 | 0.005 | 1.219 | 3.782 | 0.016 | 0.005 | |
| PJA013 | 0.851 | 0.012 | 3.792 | 11.748 | 0.028 | 0.005 | |
| PJA014 | 0.639 | 0.005 | 2.159 | 7.772 | 0.015 | 0.005 | |
| Statistical Parameters for Water Samples | Legal References Parameters | |||||||||||
|---|---|---|---|---|---|---|---|---|---|---|---|---|
| Element | Detection Limit | Measures > Limit | Mean | Median | Maximum | Minimum | Std. Dv. | PORT.MS 2914/2011 | Conama 357 | Conama 396 | WHO 2011 | |
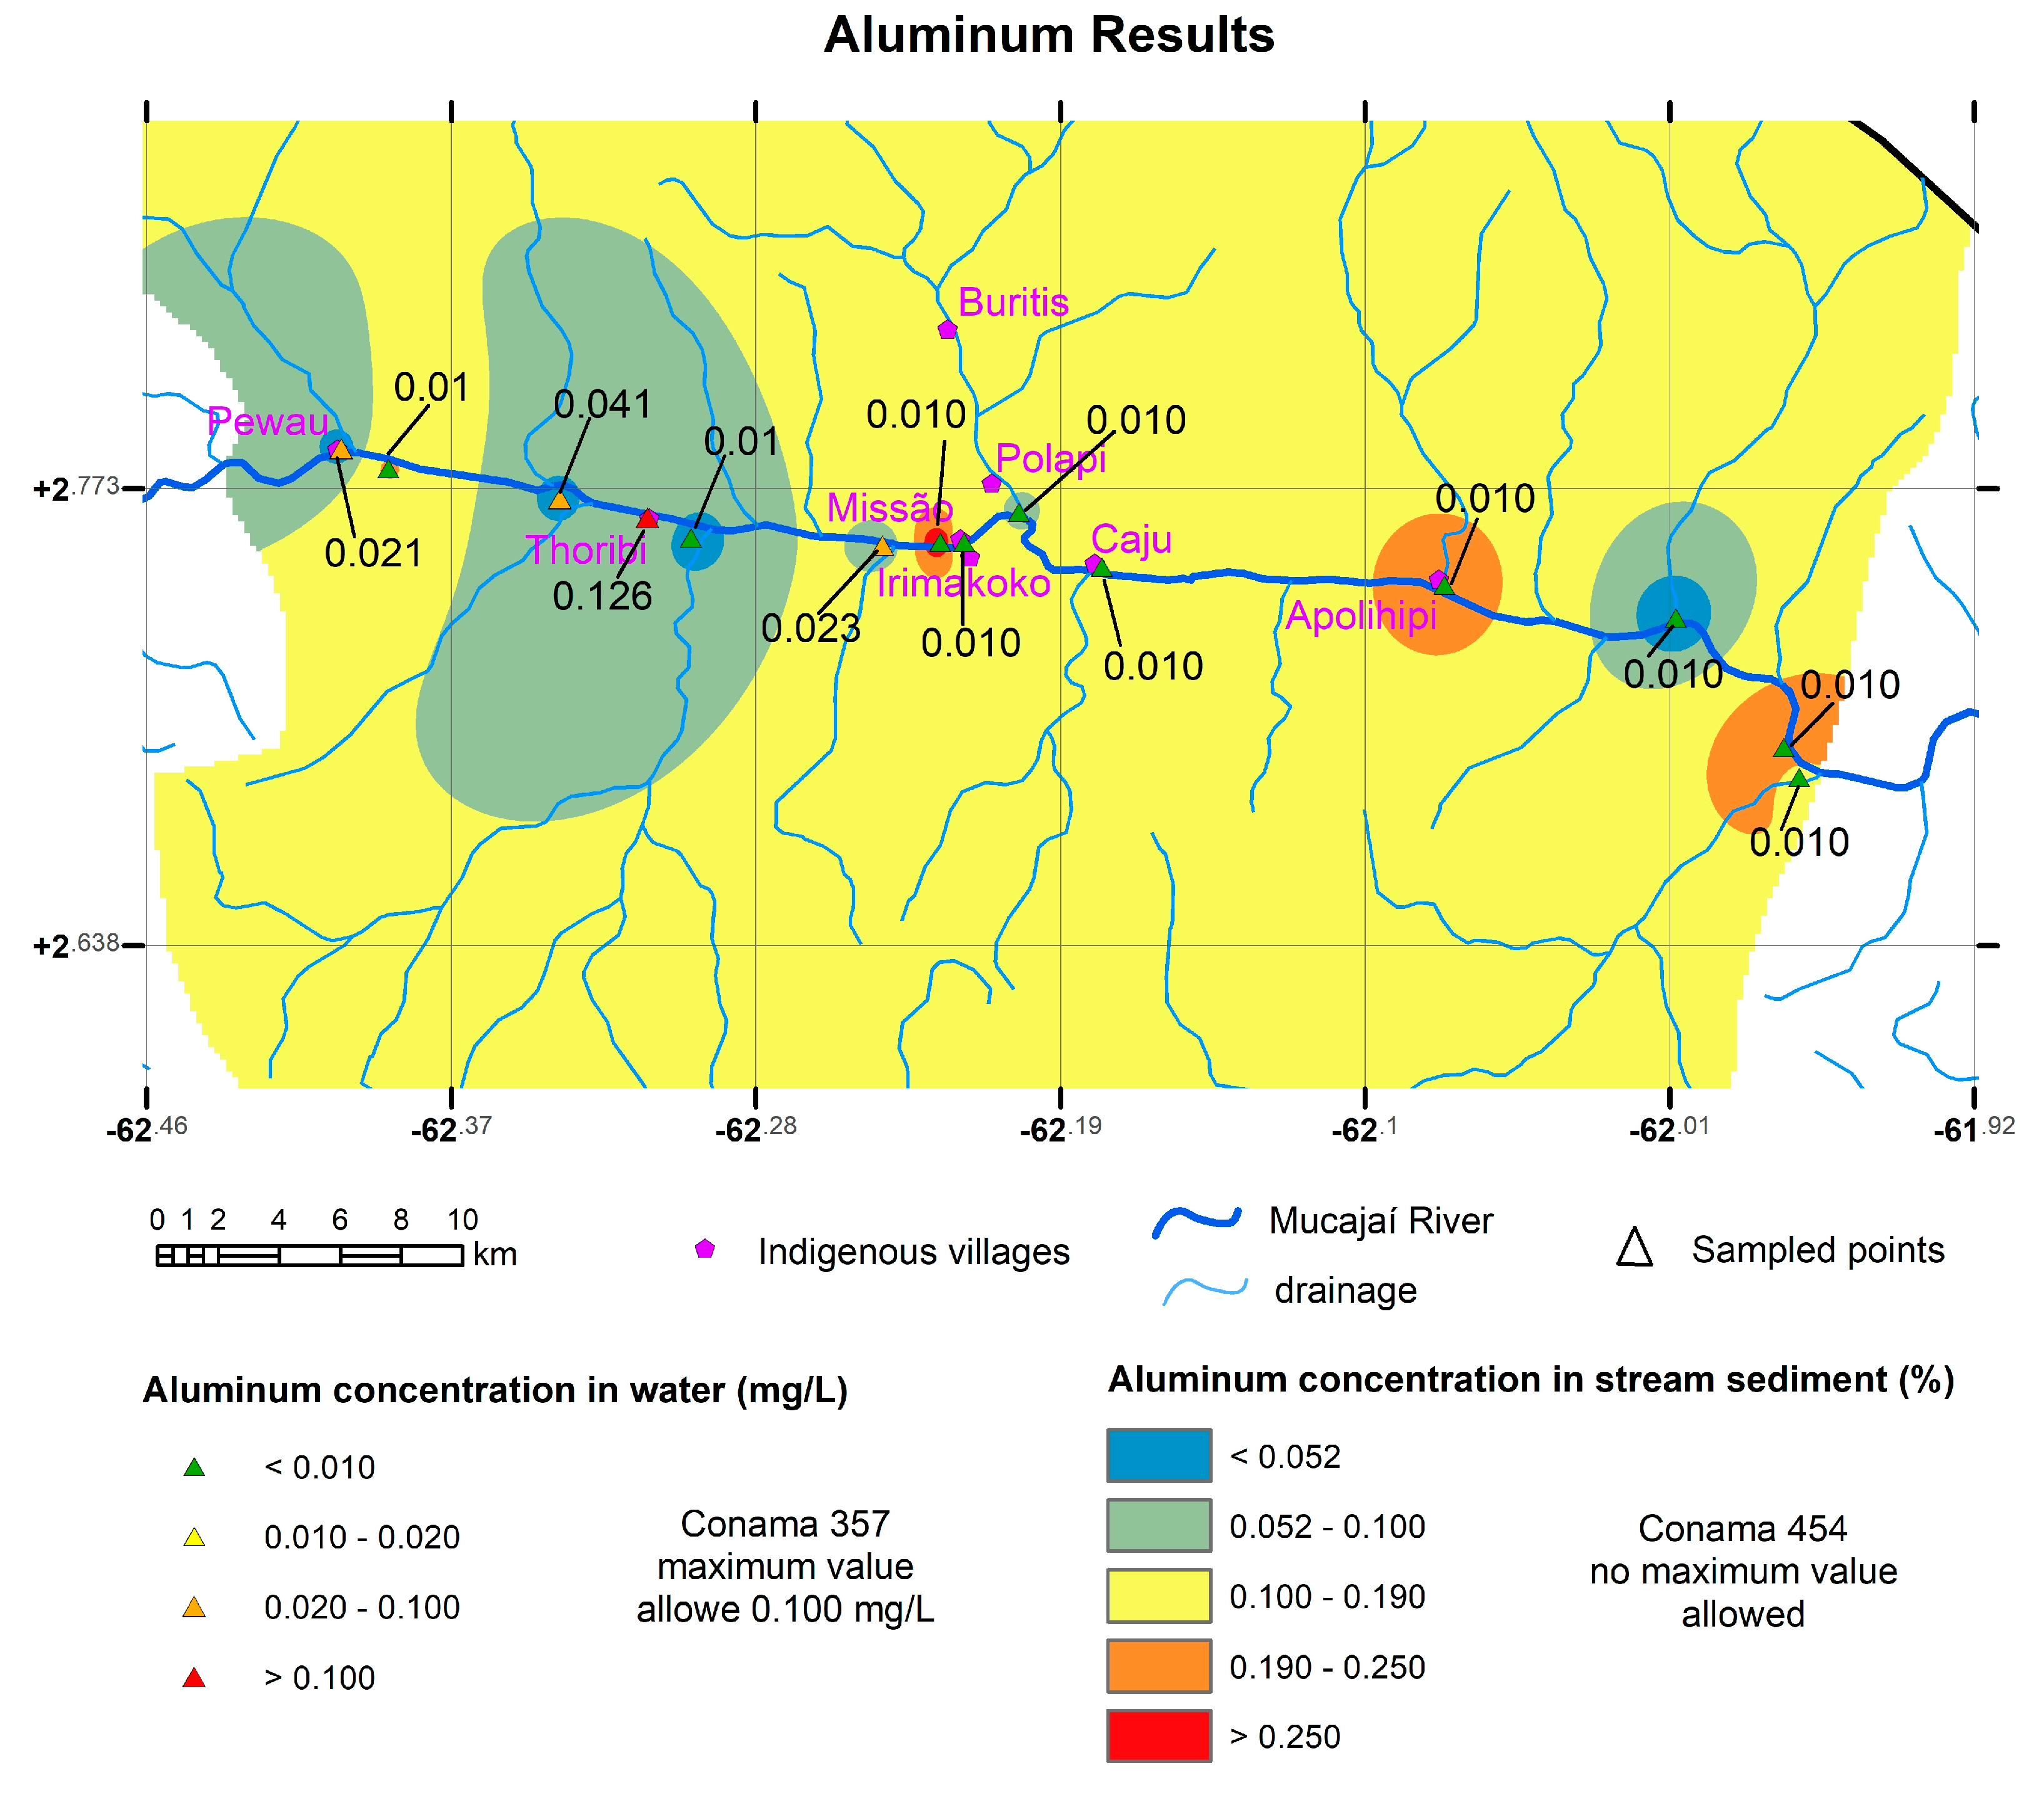
| Cations | Al (mg/L) | 0.005 | 4 | 0.022 | 0.0100 | 0.1260 | 0.0100 | 0.0312 | 0.2 | 0.1 | 0.2 | |
| As (mg/L) | 0.0001 | 0 | 0.01 | 0.01 | 0.01 | 0.01 | ||||||
| B (mg/L) | 0.05 | 0 | - | 0.5 | 0.5 | 2.4 | ||||||
| Ba (mg/L) | 0.0005 | 14 | 0.029 | 0.0295 | 0.0620 | 0.0050 | 0.0185 | 0.7 | 0.7 | 0.7 | 0.7 | |
| Be (mg/L) | 0.0002 | 0 | - | 0.04 | 0.004 | - | ||||||
| Ca (mg/L) | 0.05 | 14 | 1.45 | 1.50 | 2.4020 | 0.55 | 0.61 | - | - | - | - | |
| Cd (mg/L) | 0.0005 | 0 | 0.005 | 0.001 | 0.005 | 0.003 | ||||||
| Co (mg/L) | 0.0005 | 0 | 0.05 | 0.05 | 0.05 | 0.05 | ||||||
| Cr (mg/L) | 0.0005 | 0 | - | 0.05 | - | - | ||||||
| Cu (mg/L) | 0.005 | 0 | 2 | 0.009 | 2 | 2 | ||||||
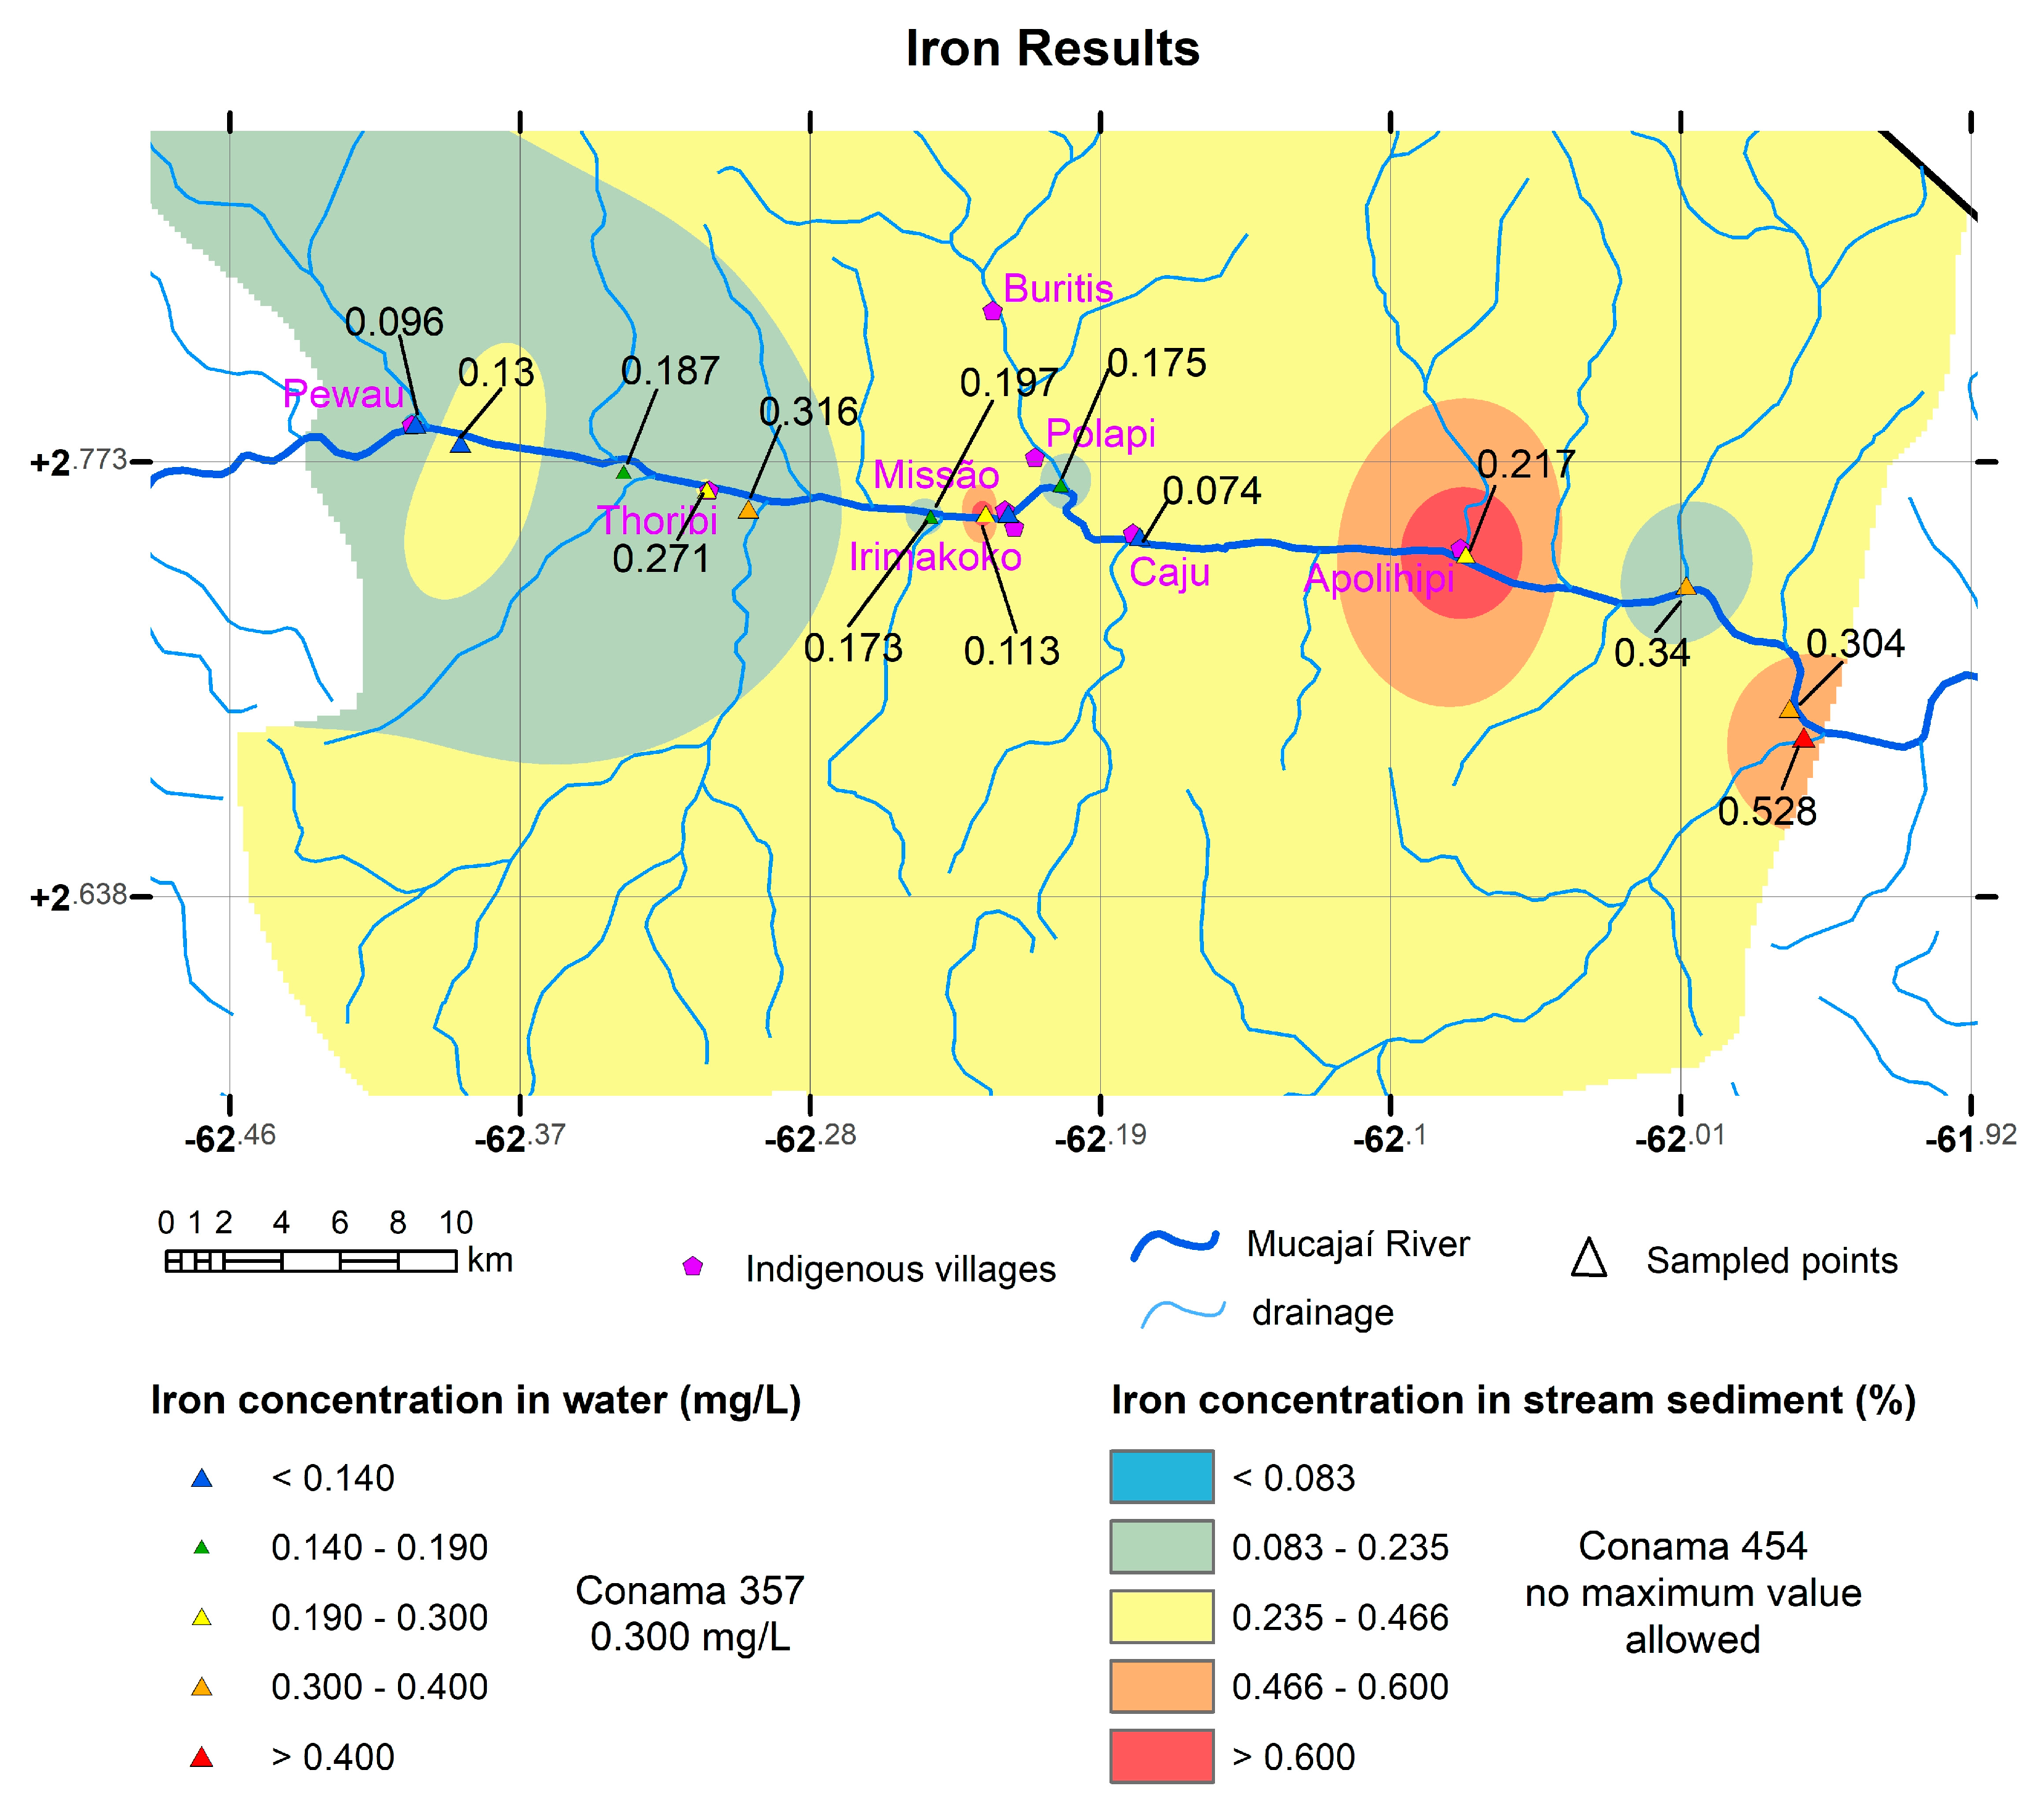
| Fe (mg/L) | 0.005 | 14 | 0.223 | 0.1920 | 0.5280 | 0.0740 | 0.1209. | 0.3. | 0.3 | 0.3 | - | |
| Hg (mg/L) | 0.00009 | 0 | - | - | - | - | ||||||
| K (mg/L) | 0.01 | 14 | 1.298 | 1.2845 | 2.1680 | 0.7400 | 0.4610 | - | - | - | - | |
| Li (mg/L) | 0.001 | 0 | - | 2.5 | - | - | ||||||
| Mg (mg/L) | 0.05 | 14 | 0.821 | 0.8075 | 1.3380 | 0.2830 | 0.2907 | - | - | - | - | |
| Mn (mg/L) | 0.001 | 14 | 0.013 | 0.0115 | 0.0300 | 0.0050 | 0.0080 | 0.1 | 0.1 | 0.1 | - | |
| Mo (mg/L) | 0.0005 | 0 | - | - | 0.07 | - | ||||||
| Na (mg/L) | 0.05 | 14 | 1.99 | 1.83 | 3.7920 | 1.00 | 0.90 | 200 | - | 200 | 50 | |
| Ni (mg/L) | 0.001 | 0 | 0.07 | 0.025 | 0.02 | 0.07 | ||||||
| Pb (mg/L) | 0.0005 | 0 | 0.01 | 0.01 | 0.01 | 0.01 | ||||||
| Sb (mg/L) | 0.0005 | 0 | 0.005 | 0.005 | 0.005 | 0.02 | ||||||
| Se (mg/L) | 0.005 | 0 | 0.01 | 0.01 | 0.01 | 0.04 | ||||||
| Si (mg/L) | 0.5 | 14 | 6.935 | 6.6705 | 11.7480 | 3.2560 | 2.9926 | - | - | - | - | |
| Sn (mg/L) | 0.001 | 0 | - | - | - | - | ||||||
| Sr (mg/L) | 0.001 | 14 | 0.025 | 0.0250 | 0.0480 | 0.0130 | 0.0104 | - | - | - | - | |
| Ti (mg/L) | 0.005 | 0 | - | - | - | - | ||||||
| V (mg/L) | 0.0005 | 0 | - | 0.1 | 0.05 | - | ||||||
| Zn (mg/L) | 0.05 | 2 | 0.006 | 0.0050 | 0.0180 | 0.0050 | 0.0037 | 5 | 0.18 | 5 | - | |
| Anions | Bromide (mg/L) | 0.3 | 1 | 0.0151 | - | - | - | - | ||||
| Chloride (mg/L) | 1 | 14 | 0.89 | 0.67 | 3.93 | 0.48 | 0.88 | 250 | 250 | 250 | ||
| Fluoride (mg/L) | 0.3 | 14 | 0.051 | 0.0442 | 0.0779 | 0.0355 | 0.0141 | 1.5 | 1.4 | 1.5 | 1.5 | |
| Phosphate (mg/L) | 0.5 | 1 | 0.0128 | - | - | - | - | |||||
| Nitrate (mg/L) | 0.22 | 14 | 0.648 | 0.6368 | 1.0463 | 0.3616 | 0.1982 | 10 | 10 | 10 | 50 | |
| Nitrite (mg/L) | 0.16 | 1 | 0.0101 | 1 | 1 | 1 | 3 | |||||
| Sulfate (mg/L) | 1 | 14 | 0.164 | 0.185 | 0.414 | 0.005 | 0.109 | 250 | 250 | 250 | - | |
| Physic-Chem Parameters | Conductivity (µS/cm) | - | 14 | 62.71 | 56.50 | 118.00 | 46.00 | 19.69 | - | 100 | - | - |
| DO (mg/L) | - | 14 | 1.728 | 1.67 | 2.67 | 1.21 | 0.44 | - | >2 | - | - | |
| Temp. (°C) | - | 13 | 25.806 | 26.20 | 27.50 | 24.00 | 1.16 | - | - | - | - | |
| pH | - | 14 | 6.467 | 6.44 | 7.06 | 6.05 | 0.29 | - | 6 to 9 | - | - | |
| Turbidity (NTU) | - | 14 | 289.864 | 31.90 | 2016.00 | 6.50 | 582.14 | - | - | - | - | |
| Eh (mV) | - | 6 | −15.786 | −2.00 | 58.70 | −149.70 | 63.96 | - | - | - | - | |
| TDS (mg/L) | - | 14 | 39.929 | 36.50 | 78.00 | 27.00 | 13.33 | - | - | - | - | |
| Statistical Parameters for Stream Sediments Samples | Legal References Parameters | ||||||||
|---|---|---|---|---|---|---|---|---|---|
| Element | Detection Limit | Measures > Limit | Mean | Median | Maximum | Minimum | Std. Dv | Conama 454 (Level 1) | NOAA SQuiRT 2008 (TEL) |
| Ag (mg/kg) | 0.01 | 0 | - | - | |||||
| Al (%) | 0.01 | 14 | 0.127 | 0.099 | 0.307 | 0.033 | 0.088 | - | - |
| As (mg/kg) | 1 | 10 | 0.076 | 0.075 | 0.240 | <LOD | 0.072 | 5.9 | 5.9 |
| Au (μg/kg) | 0.1 | 14 | 5.979 | 5.750 | 7.000 | 5.200 | 0.596 | - | - |
| B (mg/kg) | 10 | 0 | - | - | |||||
| Ba (mg/kg) | 5 | 14 | 22.833 | 16.960 | 53.430 | 4.090 | 16.745 | - | - |
| Be (mg/kg) | 0.1 | 8 | 0.121 | 0.055 | 0.670 | <LOD | 0.182 | - | - |
| Bi (mg/kg) | 0.02 | 0 | - | - | |||||
| Ca (%) | 0.01 | 13 | 0.013 | 0.008 | 0.033 | <LOD | 0.012 | - | - |
| Cd (mg/kg) | 0.05 | 1 | 0.100 | 0.6 | 0.596 | ||||
| Ce (mg/kg) | 0.05 | 11 | 7.664 | 6.435 | 19.430 | <LOD | 6.919 | - | - |
| Co (mg/kg) | 0.1 | 14 | 2.116 | 1.515 | 6.140 | 0.390 | 1.657 | - | - |
| Cr (mg/kg) | 1 | 14 | 5.059 | 3.980 | 10.700 | 0.960 | 3.375 | 37.3 | 37.3 |
| Cs (mg/kg) | 0.05 | 9 | 0.203 | 0.095 | 0.530 | <LOD | 0.212 | - | - |
| Cu (mg/kg) | 0.5 | 11 | 1.736 | 1.400 | 3.900 | <LOD | 1.359 | 35.7 | 35.7 |
| Fe (%) | 0.01 | 14 | 0.314 | 0.235 | 0.718 | 0.069 | 0.218 | - | - |
| Ga (mg/kg) | 0.1 | 5 | 0.264 | <LOD | 1.600 | <LOD | 0.521 | - | - |
| Ge (mg/kg) | 0.1 | 14 | 8.357 | 7.400 | 12.800 | 5.900 | 2.370 | - | - |
| Hf (mg/kg) | 0.05 | 0 | |||||||
| Hg (mg/kg) | 0.01 | 7 | 0.132 | 0.011 | 1.386 | <LOD | 0.372 | 0.17 | 0.174 |
| In (mg/kg) | 0.02 | 0 | - | - | |||||
| K (%) | 0.01 | 14 | 0.034 | 0.024 | 0.087 | 0.001 | 0.028 | - | - |
| La (mg/kg) | 0.1 | 8 | 1.907 | 1.250 | 7.000 | <LOD | 2.347 | - | - |
| Li (mg/kg) | 1 | 14 | 1.200 | 1.000 | 2.700 | 0.200 | 0.760 | - | - |
| Mg (%) | 0.01 | 14 | 0.040 | 0.028 | 0.097 | 0.003 | 0.032 | - | - |
| Mn (mg/kg) | 5 | 14 | 56.579 | 39.950 | 170.300 | 16.200 | 44.401 | - | - |
| Mo (mg/kg) | 0.05 | 1 | 0.025 | - | - | ||||
| Na (%) | 0.01 | 1 | 0.017 | - | - | ||||
| Nb (mg/kg) | 0.05 | 0 | - | - | |||||
| Ni (mg/kg) | 0.5 | 14 | 1.607 | 1.400 | 3.300 | 0.200 | 1.058 | 18 | 18 |
| P (mg/kg) | 50 | 12 | 34.857 | 29.500 | 8 < LOD | 1 < LOD | 21.707 | - | - |
| Pb (mg/kg) | 0.2 | 14 | 2.028 | 1.845 | 4.610 | 0.490 | 1.382 | 35 | 35 |
| Pd (mg/kg) | 0.2 | 0 | - | - | |||||
| Pt (mg/kg) | 0.1 | 0 | - | - | |||||
| Rb (mg/kg) | 0.2 | 1 | 1.000 | - | - | ||||
| Re (mg/kg) | 0.1 | 0 | - | - | |||||
| S (%) | 0.01 | 0 | - | - | |||||
| Sb (mg/kg) | 0.05 | 0 | - | - | |||||
| Sc (mg/kg) | 0.1 | 13 | 1.493 | 1.200 | 3.500 | <LOD | 1.001 | - | - |
| Se (mg/kg) | 1 | 0 | - | - | |||||
| Sn (mg/kg) | 0.3 | 1 | 0.100 | - | - | ||||
| Sr (mg/kg) | 0.5 | 13 | 1.457 | 1.050 | 3.800 | 0.200 | 1.121 | - | - |
| Ta (mg/kg) | 0.05 | 0 | - | - | |||||
| Te (mg/kg) | 0.05 | 0 | - | - | |||||
| Th (mg/kg) | 0.1 | 1 | 0.500 | - | - | ||||
| Ti (%) | 0.01 | 14 | 0.008 | 0.007 | 0.017 | 0.001 | 0.005 | - | - |
| Tl (mg/kg) | 0.02 | 0 | - | - | |||||
| U (mg/kg) | 0.05 | 14 | 0.278 | 0.201 | 0.569 | 0.051 | 0.176 | - | - |
| V (mg/kg) | 1 | 14 | 9.426 | 7.115 | 23.270 | 2.290 | 6.894 | - | - |
| W (mg/kg) | 0.1 | 1 | 0.100 | - | - | ||||
| Y (mg/kg) | 0.05 | 9 | 0.750 | 0.500 | 2.920 | <LOD | 0.913 | - | - |
| Zn (mg/kg) | 1 | 7 | 5.393 | 4.250 | 13.000 | <LOD | 4.896 | 123 | 123 |
| Zr (mg/kg) | 0.5 | 0 | - | - | |||||
| Sample ID | Al (%) | As (mg/kg) | Au (mg/kg) | Ba (mg/kg) | Be (mg/kg) | Ca (%) | Cd (mg/kg) | Ce (mg/kg) | Co (mg/kg) | Cr (mg/kg) |
|---|---|---|---|---|---|---|---|---|---|---|
| PJS001 | 0.089 | <LOD | 5.200 | 11.680 | <LOD | 0.008 | <LOD | 2.190 | 0.780 | 2.900 |
| PJS002 | 0.137 | 0.050 | 5.500 | 21.540 | 0.130 | 0.005 | 0.025 | 8.030 | 1.550 | 5.420 |
| PJS003 | 0.21 | 0.070 | 5.700 | 46.120 | 0.670 | 0.031 | <LOD | 11.090 | 3.450 | 9.700 |
| PJS004 | 0.032 | <LOD | 5.800 | 6.340 | <LOD | 0.001 | <LOD | <LOD | 0.690 | 1.390 |
| PJS005 | 0.171 | 0.130 | 7.000 | 53.430 | 0.270 | 0.012 | 0.100 | 19.110 | 6.140 | 9.070 |
| PJS006 | 0.249 | 0.240 | 6.100 | 43.580 | 0.170 | 0.031 | <LOD | 19.430 | 4.040 | 8.970 |
| PJS007 | 0.033 | <LOD | 6.000 | 4.440 | <LOD | <LOD | <LOD | <LOD | 0.640 | 1.560 |
| PJS008 | 0.099 | 0.010 | 5.600 | 14.190 | 0.130 | 0.007 | <LOD | 2.900 | 0.800 | 4.630 |
| PJS009 | 0.037 | <LOD | 5.500 | 4.090 | 0.030 | 0.001 | 0.025 | <LOD | 0.390 | 0.960 |
| PJS010 | 0.196 | 0.130 | 5.700 | 33.240 | 0.210 | 0.026 | 0.025 | 8.800 | 3.470 | 6.590 |
| PJS011 | 0.045 | 0.130 | 7.000 | 11.660 | <LOD | 0.033 | <LOD | 15.390 | 1.480 | 2.380 |
| PJS012 | 0.071 | 0.080 | 6.200 | 12.100 | <LOD | 0.005 | 0.025 | 3.110 | 2.140 | 3.230 |
| PJS013 | 0.307 | 0.110 | 5.500 | 37.520 | 0.080 | 0.001 | <LOD | 12.410 | 2.640 | 10.700 |
| PJS014 | 0.098 | 0.120 | 6.900 | 19.730 | <LOD | 0.018 | <LOD | 4.840 | 1.420 | 3.330 |
| Sample ID | Cs (mg/kg) | Cu (mg/kg) | Fe (%) | Ga (mg/kg) | Ge (mg/kg) | Hg (mg/kg) | In (mg/kg) | K (%) | La (mg/kg) | Li (mg/kg) |
| PJS001 | 0.070 | 0.800 | 0.179 | <LOD | 8.000 | <LOD | <LOD | 0.027 | <LOD | 0.600 |
| PJS002 | 0.210 | 2.200 | 0.344 | <LOD | 6.100 | <LOD | <LOD | 0.031 | 1.700 | 1.100 |
| PJS003 | 0.520 | 3.400 | 0.687 | 0.300 | 9.000 | <LOD | <LOD | 0.086 | 2.000 | 2.700 |
| PJS004 | <LOD | 0.250 | 0.105 | <LOD | 7.200 | <LOD | <LOD | 0.008 | <LOD | 0.200 |
| PJS005 | 0.440 | 3.200 | 0.485 | 0.400 | 12.400 | 0.022 | <LOD | 0.045 | 4.400 | 1.800 |
| PJS006 | 0.530 | 3.500 | 0.518 | 1.600 | 7.400 | 0.029 | 0.010 | 0.065 | 5.800 | 1.800 |
| PJS007 | <LOD | 0.250 | 0.084 | <LOD | 5.900 | 0.021 | <LOD | 0.004 | <LOD | 0.500 |
| PJS008 | 0.110 | 1.300 | 0.242 | <LOD | 11.200 | <LOD | <LOD | 0.021 | <LOD | 1.400 |
| PJS009 | <LOD | <LOD | 0.068 | <LOD | 6.600 | <LOD | <LOD | 0.001 | <LOD | 0.600 |
| PJS010 | 0.380 | 2.500 | 0.407 | 0.100 | 7.000 | 0.344 | <LOD | 0.066 | 2.000 | 2.400 |
| PJS011 | 0.025 | 0.800 | 0.131 | <LOD | 12.800 | 1.386 | <LOD | 0.011 | 7.000 | 0.800 |
| PJS012 | 0.025 | 0.700 | 0.191 | <LOD | 5.900 | 0.027 | <LOD | 0.015 | <LOD | 0.500 |
| PJS013 | 0.450 | 3.900 | 0.7 | 1.300 | 7.400 | 0.022 | 0.010 | 0.069 | 3.000 | 1.500 |
| PJS014 | 0.080 | 1.500 | 0.22673 | <LOD | 10.100 | <LOD | <LOD | 0.020 | 0.800 | 0.900 |
| Sample ID | Mg (%) | Mn (mg/kg) | Mo (mg/kg) | Na (%) | Ni (mg/kg) | P (mg/kg) | Pb (mg/kg) | Rb (mg/kg) | Sc (mg/kg) | Sn (mg/kg) |
| PJS001 | 0.025 | 18.600 | <LOD | <LOD | 0.800 | 22.000 | 0.840 | <LOD | 0.800 | <LOD |
| PJS002 | 0.038 | 23.600 | <LOD | <LOD | 1.500 | 41.000 | 2.160 | <LOD | 1.800 | 0.050 |
| PJS003 | 0.097 | 109.100 | <LOD | <LOD | 3.300 | 60.000 | 3.060 | 1.000 | 2.200 | 0.050 |
| PJS004 | 0.008 | 37.900 | <LOD | <LOD | 0.500 | 15.000 | 0.640 | <LOD | 0.900 | <LOD |
| PJS005 | 0.046 | 170.300 | <LOD | <LOD | 2.600 | 80.000 | 4.610 | <LOD | 2.600 | <LOD |
| PJS006 | 0.084 | 86.100 | <LOD | <LOD | 2.900 | 66.000 | 3.550 | <LOD | 3.000 | 0.050 |
| PJS007 | 0.008 | 18.500 | <LOD | <LOD | 0.400 | 10.000 | 0.490 | <LOD | 0.800 | <LOD |
| PJS008 | 0.020 | 22.900 | <LOD | <LOD | 1.000 | 24.000 | 1.380 | <LOD | 1.400 | <LOD |
| PJS009 | 0.003 | 16.200 | <LOD | <LOD | 0.200 | 10.000 | 0.560 | <LOD | <LOD | <LOD |
| PJS010 | 0.078 | 92.800 | <LOD | <LOD | 2.500 | 38.000 | 2.240 | <LOD | 1.400 | <LOD |
| PJS011 | 0.016 | 38.400 | 0.025 | 0.017 | 0.900 | 46.000 | 1.850 | <LOD | 1.000 | <LOD |
| PJS012 | 0.017 | 65.100 | <LOD | <LOD | 1.600 | 33.000 | 0.890 | <LOD | 0.800 | <LOD |
| PJS013 | 0.082 | 51.100 | <LOD | <LOD | 3.000 | 17.000 | 4.280 | <LOD | 3.500 | 0.100 |
| PJS014 | 0.031 | 41.500 | <LOD | <LOD | 1.300 | 26.000 | 1.840 | <LOD | 0.700 | <LOD |
| Sample ID | Sr (mg/kg) | Th (mg/kg) | Ti_% | U (mg/kg) | V (mg/kg) | W (mg/kg) | Y (mg/kg) | Zn (mg/kg) | ||
| PJS001 | 0.600 | <LOD | 0.007 | 0.177 | 4.990 | <LOD | <LOD | 2.500 | ||
| PJS002 | 0.900 | <LOD | 0.010 | 0.297 | 9.990 | <LOD | 0.660 | 7.000 | ||
| PJS003 | 3.800 | <LOD | 0.016 | 0.460 | 15.370 | <LOD | 1.040 | 1 < LOD | ||
| PJS004 | 0.400 | <LOD | 0.002 | 0.051 | 2.290 | <LOD | <LOD | <LOD | ||
| PJS005 | 1.900 | <LOD | 0.009 | 0.569 | 17.370 | <LOD | 2.170 | 11.000 | ||
| PJS006 | 3.200 | <LOD | 0.013 | 0.549 | 18.550 | <LOD | 2.920 | 12.000 | ||
| PJS007 | 0.300 | <LOD | 0.001 | 0.073 | 2.570 | <LOD | <LOD | <LOD | ||
| PJS008 | 1.200 | <LOD | 0.005 | 0.191 | 7.250 | <LOD | <LOD | <LOD | ||
| PJS009 | 0.200 | <LOD | 0.001 | 0.178 | 2.610 | <LOD | <LOD | <LOD | ||
| PJS010 | 2.700 | <LOD | 0.013 | 0.340 | 12.700 | <LOD | 1.290 | 13.000 | ||
| PJS011 | 1.700 | <LOD | 0.002 | 0.203 | 3.810 | <LOD | 0.440 | 2.500 | ||
| PJS012 | 0.800 | <LOD | 0.004 | 0.111 | 4.210 | <LOD | 0.090 | 6.000 | ||
| PJS013 | 0.900 | 0.500 | 0.016 | 0.497 | 23.270 | 0.100 | 1.330 | 9.000 | ||
| PJS014 | 1.800 | <LOD | 0.005 | 0.198 | 6.980 | <LOD | 0.560 | 2.500 |
Disclaimer/Publisher’s Note: The statements, opinions and data contained in all publications are solely those of the individual author(s) and contributor(s) and not of MDPI and/or the editor(s). MDPI and/or the editor(s) disclaim responsibility for any injury to people or property resulting from any ideas, methods, instructions or products referred to in the content. |
© 2023 by the authors. Licensee MDPI, Basel, Switzerland. This article is an open access article distributed under the terms and conditions of the Creative Commons Attribution (CC BY) license (https://creativecommons.org/licenses/by/4.0/).
Share and Cite
Jacques, P.D.; Viglio, E.P.; de Oliveira d’El Rei Pinto, D. Environmental Geochemical Analysis in the Yanomami Indigenous Land, Mucajaí River Basin, State of Roraima, Brazil. Toxics 2023, 11, 861. https://doi.org/10.3390/toxics11100861
Jacques PD, Viglio EP, de Oliveira d’El Rei Pinto D. Environmental Geochemical Analysis in the Yanomami Indigenous Land, Mucajaí River Basin, State of Roraima, Brazil. Toxics. 2023; 11(10):861. https://doi.org/10.3390/toxics11100861
Chicago/Turabian StyleJacques, Patricia Duringer, Eduardo Paim Viglio, and Daniel de Oliveira d’El Rei Pinto. 2023. "Environmental Geochemical Analysis in the Yanomami Indigenous Land, Mucajaí River Basin, State of Roraima, Brazil" Toxics 11, no. 10: 861. https://doi.org/10.3390/toxics11100861