Article

Impact of Arieş River Contaminants on Algae and Plants

1
Department of Experimental Biology, National Institute of Research and Development for Biological Sciences, Branch Institute of Biological Research Cluj-Napoca, 48 Republicii Street, 400015 Cluj-Napoca, Romania
2
Faculty of Biology and Geology, Babeș-Bolyai University, 1 M. Kogălniceanu Street, 400084 Cluj-Napoca, Romania
3
Centre for Systems Biology, Biodiversity and Bioresource, Babeș-Bolyai University, 5-7 Clinicilor Street, 400006 Cluj-Napoca, Romania
4
Department of Horticulture, Sapientia University, 2 Sighișoarei Rd., 540485 Târgu Mureș, Romania
5
Department of Chemistry and Biochemistry, University of Agricultural Sciences and Veterinary Medicine Cluj-Napoca, Calea Mănăstur 3-5, 400372 Cluj-Napoca, Romania
6
Institute of Public Health Prof. Dr. I. Moldovan, 6 Louis Pasteur Street, 400349 Cluj-Napoca, Romania
7
Doctoral School “Environmental Science”, Babeș-Bolyai University, 1 M. Kogălniceanu Street, 400084 Cluj-Napoca, Romania
8
Faculty of Environmental Science and Engineering, Research Institute for Sustainability and Disaster Management Based on High Performance Computing, Babeș-Bolyai University, 30 Fantanele Street, 400294 Cluj-Napoca, Romania
*
Author to whom correspondence should be addressed.
These authors contributed equally to this work and share first authorship.
Toxics 2023, 11(10), 817; https://doi.org/10.3390/toxics11100817
Submission received: 18 August 2023 / Revised: 25 September 2023 / Accepted: 26 September 2023 / Published: 28 September 2023
(This article belongs to the Special Issue Ecotoxicity of Contaminants in Water and Sediment)

Abstract

:
The Arieş River (Western Romania) represents one of the most important affluents of the Mureş River, with great significance in the Mureş Tisza basin. The environmental quality of the Arieş basin is significantly affected by both historic mining activities and contemporary impacts. Thus, an evaluation of the effects of the main contaminants found in water (organochlorine pesticides—OCPs, monocyclic aromatic hydrocarbons—MAHs, polycyclic aromatic hydrocarbons—PAHs, and metals) on cyanobacteria and plants was performed. Among OCPs, hexachlorocyclohexane isomers, dichlorodiphenyltrichloroethane, and derivatives were detected in plants while admissible concentrations were detected in water. Among MAHs, high levels of benzene were detected both in water and in plants. The levels of PAHs exceeded the allowable values in all samples. Increased concentrations of metals in water were found only at Baia de Arieş, but in plants, all metal concentrations were high. The pH, nitrates, nitrites, and phosphates, as well as metals, pesticides, and aromatic hydrocarbons, influenced the physiological characteristics of algae, test plants, and aquatic plants exposed to various compounds dissolved in water. Considering that the Arieş River basin is the site of intense past mining activities, these data provide information about the impact on water quality as a consequence of pollution events.

1. Introduction

Because life cannot exist on Earth without water, it is crucial to preserve water supplies and the environment from all types of pollution. The availability and quality of water are two of the most important concerns that humanity has recently confronted [1]. Future water availability is uncertain due to rising freshwater demand brought on by population growth, altered land use, and climate change [2]. Water regulations were developed in the European Union (EU) Water Framework Directive of 2000 and were implemented in EU Member States in 2003. The new deadline of 2027 has replaced the initial 2015 deadline for achieving an “excellent status” [3]. This implies achieving an ‘excellent ecological and chemical state’ for surface waters and a ‘good chemical and quantitative status’ for groundwater. It also states that the water bodies’ status shall not degrade [3]. Achieving the 2030 Agenda for Sustainable Development is critical for future generations as the Sustainable Development Goals aim for universal access to and sustainable management of water and sanitation [1]. It is estimated that 80% of all industrial and municipal wastewater is discharged into the environment untreated, causing harm to human health and ecosystems [1]. In many parts of the world, wasteful use of water for food production has resulted from a lack of water valuation [4]. Pollution of water resources as a result of human activities (mining, metallurgical processing of metals, agriculture, domestic waste, etc.) entails multiple risks to human and animal health [5], ecological risks [6], and environmental risks [7]. Parasitic, viral, and bacterial infections [8]; gastrointestinal ailments [9]; cancer [10]; and neurological problems [11] are all dangers connected with polluted water. As a result, safeguarding water quality is critical to avoid these negative consequences. At the same time, people must be educated about the environment and the harmful impacts of water contamination.
The Arieş River is situated in Western Romania and represents one of the most important right-side affluents of the Mureş River. Due to its geographic position and its significance in the Mureş Tisza basin, the Arieş River and its water quality play a significant role in the preservation of our ecosystems [12]. The Arieş River basin contains both inactive and active metal mines that may contribute to existing and future pollution. Two of the most important mining centers situated in the Arieş River catchment are Roşia Poieni and Roşia Montană [13,14]. In Romania, water quality is monitored according to the principles of the Integrated Water Monitoring System (IWMS), restructured according to European Directives. The Law 310/2004 amending the Law 107/1996 includes the provisions of the Framework Directive 60/2000/EEC and other EU Water Directives. In summary, there are 12 classes of quality indicators that are used to monitor water quality: oxygen regime, water aggression indicators, salinity indicators, presence of nutrients, general inorganic contaminants, general organic contaminants, microporous heavy metals, microporous pesticides, radioactivity, microbiology, biology, and flow. The allowable values for basic indicators of surface water pollution are shown in NTPA 001/2002 [15]. Some persistent contaminants have long-term effects on aquatic environments even after the pollution source is removed. The effects are diverse, including biological consequences (disappearance of plant and animal species, changes in aquatic biocenosis, development of thermophilic algae and anaerobic microorganisms, eutrophication, compromising agriculture via irrigation with polluted water), economic consequences (increased cost for water treatment, providing water from other sources, cost for treating people who become ill due to water pollution), and social consequences (compromising recreation areas, compromising urban and tourist areas, affecting protected areas, population migration due to the deterioration of water quality).
Numerous studies over the years have examined the Arieş River’s water quality based on the evaluation of physico-chemical parameters [16,17], contamination with heavy metals [12,18,19], with pesticides and organochlorines [20], chemical measurements of pore water and sediment in tailings [13], the composition of tailings’ minerals [21], the measurement of dissolved anions and cations by using capillary electrophoresis [22], or the effect of contaminated water on germination and growth rates of wheat seeds [23]. As previously shown, the index of saprobity of water exhibits a growing tendency from upstream to downstream in the Arieș River. Thus, the water quality upstream of Câmpeni is considered oligosaprobic (class I–II), being clear or very slightly polluted. Downstream of Câmpeni, the water belongs to class II, β-mesosaprobic or moderately polluted. The river water downstream of Baia de Arieș could be included in class II–III, i.e., β-α-mesosaprobic level with moderate to strong pollution, but in Sălciua—upstream and downstream—it could be included in class III–IV, i.e., β-α- and α-mesosaprobic level, being strongly polluted [24].
Considering that the huge quantities of tailings and waste generated over the years by mining still represent a permanent pollution source for surface and underground waters in the area, it is important that the water quality of the Arieş River should be monitored regularly. Moreover, the impact evaluation of water quality on organisms living in water ecosystems is also important, providing valuable information about the effects of long-term pollution and the cumulative effects of different chemical compounds dissolved in the water body. As many of previous articles focused on monitoring the pollution of the Arieș River with metals resulting from mining activities, the objective of our study was the investigation of the physiological and cytological effects of the main contaminants found in water such as organochlorine pesticides (OCPs), monocyclic aromatic hydrocarbons (MAHs), and polycyclic aromatic hydrocarbons (PAHs), usually used as solvents and trace and heavy metals on algae and plants, giving information about the water quality and its impact on the environment, organisms, and human health. All these compounds are highly persistent and bioaccumulating contaminants.

2. Materials and Methods

2.1. Sampling and Physico-Chemical Evaluation of Water

Water and aquatic plant samples were collected in September 2007 from various locations along the Arieş River (NW Romania): (1) Câmpeni upstream, (2) Câmpeni downstream, (3) Baia de Arieş upstream, (4) Baia de Arieş downstream, (5) Sălciua upstream, (6) Sălciua downstream, (7) Turda upstream, (8) Turda downstream, (9), Câmpia Turzii upstream, (10), Câmpia Turzii downstream, and (11) Abrud inflow. The collection points were selected based on the impacts of industrial activity (in Turda and Câmpia Turzii) and past mining activities (in Roşia Montană, Câmpeni, Abrud, and Baia de Arieş) on water resources.
The following physico-chemical parameters have been determined for water samples: pH and concentrations of NO3 (mg L−1), NO2 (mg L−1), PO4 (mg L−1), Cu (μg L−1), and Fe (μg L−1).

2.2. Assessment of Pollutant Compounds

The presence of pollutant compounds was determined in water and aquatic plant samples collected from the sites mentioned above within 24 h after collection. All the experiments carried out with algae and plants were set up within 24 h after the collection of water samples.

2.2.1. Analysis of Organochlorine Pesticides—OCPs

Gas chromatography (GC) with electron capture detection (ECD) and mass spectrometry (MS) were used to determine the following organochlorine pesticides (OCPs): hexachlorocyclohexane isomers (α, β, γ and δ-HCH), dichlorodiphenyl trichloro ethane (op’DDT, pp’DDT) and its metabolites (op’DDE, pp’DDE), aldrin, dieldrin, and endosulfan sulfate. The SR EN ISO 6468:2000 international reference standard method was used [25]. The samples were processed and analyzed following these steps: (i) Liquid–liquid extraction of organochlorine pesticides from water and solid–liquid extraction from plants, using high-purity petroleum ether or n-hexane as the extraction solvent—in case of plant material, the samples were crushed, then homogenized with the extraction solvent, and the extraction was performed via ultrasonication of the homogenate. The extract was separated by using centrifugation; (ii) anhydrous sodium sulfate dehydration of the organic extract; (iii) concentration of the extract using a rotary evaporator; and (iv) gas chromatographic analysis of the concentrated extract. This step was performed using an HP-608 capillary separation column (length 30 m, inner diameter 0.35 mm) and an electron capture detector. Separation was achieved via linear temperature programming of the column. Component identification is based on retention time, and quantitative analysis was performed using the external standard method and quantitative standard solutions (LGC Standards, Germany). The method used has a detection limit of 0.0001 μg/L of water.

2.2.2. Monocyclic and Polycyclic Aromatic Hydrocarbons

The monocyclic aromatic hydrocarbons (MAHs) were determined using the following protocol: (1) water sample processing via “head space”, which entails equilibration at 90 °C and (2) liquid–solid extraction in the case of plants (after pre-shredding of samples) using n-hexane. Ultrasounds were used to extract the sample, which was then concentrated in a rotary evaporator. Gas chromatography was used to analyze the gaseous phase in equilibrium with the thermally balanced sample. The components were separated on a capillary column, HP-5 (15 m × 0.53 mm × 0.25 m), using linear programming of the column temperature. A flame ionization detector was used. The qualitative analysis was based on retention time. The concentration was calculated using standard solutions of benzene, toluene, xylene, and ethylbenzene. Chemically pure water contaminated with known quantities of compounds was used as a control. The limits of detection (LODs) were 0.002 mg/L for water and 0.002 mg/kg for plant material. Water and plant samples were measured in triplicate, and the results are presented here as mean values.
The polycyclic aromatic hydrocarbon (PAH) measurements were accomplished using a gas chromatography–mass spectrometry detector (Agilent, Santa Clara, CA, USA). The extraction method involved the following stages: (1) liquid–liquid extraction of polycyclic aromatic hydrocarbons using the mixture of n-hexane-methylene chloride (3:2) as extractant and (2) liquid–solid extraction using ultrasounds for plant material. Extraction with n-hexane-methylene chloride was performed after preliminary grinding and homogenization of the samples, concentration of the extract in the rotary evaporator, and gas-chromatographic analysis of the concentrated extract. The separation was performed on a BP-5 capillary column (50 m × 0.32 mm × 0.25 m). Flame ionization detection combined with mass spectrometry was applied. The standard solutions included naphthalene (Nap), acenaphthylene (Acy), fluorene (Flo), phenanthrene (Phe)+anthracene (Ant), pyrene (Pyr), benzo(b)fluoranthene B(b)F, benzo(k)fluoranthene B(k)F, benzo(a)pyrene B(a)P, and benz(a)anthracene B(a)A+chrysene (Chr). The limits of detection (LODs) were 0.002 mg/L for water and 0.002 mg/kg for plant material. Water and plant samples were measured in triplicate, and the results are presented here as mean values.

2.2.3. Trace and Heavy Metals

Water samples were treated with concentrated nitric acid to adjust the pH to 1–2. Plant samples were dried at 105 °C until they reached a constant weight. The utilized method is based on the measurement of metal concentrations in acidulated samples in an air–air flame or through electrothermal atomization. For the determination of metals in water or plant material, the samples were previously mineralized. Control and water samples were treated with concentrated mineral acids, then oxygenated water, and heated to evaporation temperature. Following evaporation, the process was repeated with the same amount of nitric acid. Control and plant samples were treated with concentrated nitric acid and perchloric acid and heated on a sand bath to the evaporation temperature. The above mentioned steps were repeated until the residue turned white and was completely dry. Then, the samples were treated with 4% nitric acid and brought to a final volume (50 mL) through successive washings. The concentrations of lead (Pb), cadmium (Cd), copper (Cu), chromium (Cr), nickel (Ni), zinc (Zn), manganese (Mn), and iron (Fe) were determined using atomic absorption spectrometry in the air–acetylene flame (Ni, Zn, Fe) and via electrothermal atomization (Pb, Cd, Cu, Cr, Mn) using a spectrophotometer (Analyst 700, PerkinElmer, Woodbridge, ON, Canada) [26]. The absorbances were related to the calibration curve, and the corresponding metal concentrations were determined. The metal concentrations determined in water samples were expressed in mg/L and in plant samples in mg/kg dry weight. Standard solutions for each metal were prepared via sequential dilution of stock standards to 1000 ppm for the calibration curve.

2.3. Assessment of Water Quality via Ecotoxicological Studies with Algae

The standard ISO 8692:2012 [27] was used to analyze the water toxicity of the Arieş River. The tests were performed using water samples from the following sampling sites: Baia de Arieş downstream, Sălciua downstream, Turda upstream, Câmpia Turzii downstream, and Abrud inflow.
The test species was Scenedesmus opoliensis (PG. Richter) (Chlorophyceae, Chlorococcales), a fast-growing coenobia with four cells. This standard protocol describes a method for determining the suppression of algal development by soluble chemicals and mixtures in water. Four stock solutions were produced, autoclaved, and kept in the dark at 4 °C. These stock solutions were diluted to achieve the final nutrient concentrations in the test solutions. Exponentially growing cultures of selected green algae were exposed to various concentrations of the polluted water under defined conditions. The initial cell density in the test cultures was approximately 104 cells per mL. The test solutions were incubated for 72 h, with cell density measurements taken at 24 h intervals. The inhibition of growth was determined in relation to a control culture. Four water concentrations (25%, 50%, 75%, and 100%) were prepared by adding suitable aliquots to algal precultures. All operations were carried out under sterile conditions to avoid contamination. After inoculation, the test flasks were incubated in a culture chamber at 23 ± 2 °C under continuous illumination (400–700 nm spectral range and a light intensity of 60–100 μmol m−2 s−1). Cell density measurements were made, using the direct counting method, of living cells under a microscope with counting chambers. The pH was measured at the beginning of the test and after 72 h (Table 1). The test design included two replicates for each test concentration. The cell density in each flask was determined at 24, 48, and 72 h after the test started. The mean value of cell density for each concentration and for the control was plotted against time (0–72 h).
The percentage inhibition of the specific growth rate at each concentration (Iμt) was calculated according to the following formula:
Iμt = (μc − μt)/μc × 100
where μc is the mean control-specific growth rate and μt is the mean specific growth rate for the test concentration t. The acute endpoint, ErC50, concerning the concentration of tested water that results in a 50% reduction in growth rate relative to control within 72 h, was determined.

2.4. Evaluation of the Cytotoxic Potential of Water from Arieș

The Allium test [28] was used to assess the genotoxicity of water from Arieş River. Onion bulbs (Allium cepa L., cv. Galbena de Stuttgart) (2n = 16) approximately 3–4 cm in diameter were placed on the necks of 200 mL Erlenmeyer flasks filled with tap water for rhizogenesis. When the roots reached 1 cm in length, the bulbs were transferred on top of other flasks filled with water collected from the sampling sites described previously. Tap water was used as control.
The mitotic activity in the root meristem was assessed 5 days after the bulb transfer in water from Arieș. Root apices (2 cm in length) were fixed in Carnoy solution (2 h) and then washed in 70% ethanol to remove any traces of acetic acid and stored in Eppendorf tubes in 70% ethanol at 4 °C until examination. Root tips were treated with 1% acetic anhydride and macerated in 1 N HCl (10 min) at room temperature. Staining was made with 1% aceto-orcein (prepared in 45% acetic acid) for 24 h at room temperature. For each water sample, including the control, at least three root tips were microscopically examined in four repetitions.
The mitotic index was calculated by analyzing (1000 cells per water sample) the ratio between the cells in division (n) and the total number of analyzed cells (N) according to the following formula:
MI (%) = n/N
The relative frequency of division phases (I) was determined by calculating the prophase (p), metaphase (m), anaphase (a), and telophase (t) index as the ratio between the number of cells in each phase (d) and the total number of cells in division (D) according to the following formula:
I p. m. a. t (%) = d p. m. a. t/D
The frequency of abnormal mitosis, in particular the appearance of micronuclei, anaphase and telophase bridges, chromosomal fragments, and binuclear cells, was calculated as a percentage of the total number of cells in division.

2.5. Analysis of Carotenoids, Chlorophylls, and Fatty Acids from Phospholipids and Glycolipids

Total carotenoids were extracted from fresh aquatic plant material (2 g) with a mixture of methanol/ethyl acetate/petroleum ether (1:1:1, v/v/v). The obtained extract was repeatedly washed in a separation funnel to remove water and ethanol. The organic phase (acetate/petroleum ether) was dried over anhydrous sodium sulfate and evaporated to dryness using a rotatory evaporator (35 °C). The dry residue was dissolved in acetone (10 mL) and added to Ambersep 900 OH resin (1 g) in order to remove chlorophyll [29]. The samples were centrifuged, and an aliquot was used for spectrophotometric determination of total carotenoid content (Jasco V-530 UV-VIS spectrophotometer, Jasco Europe SRL, Cremella, Italy) according to the formula proposed by Britton et al. [30].
Another aliquot was evaporated, re-dissolved in the mobile phase, and analyzed on an HPLC system consisting of LC20 AT Shimadzu pumps, a Waters 990 photodiode detector, and a YMC C30 column (25 cm × 4.6 mm, particle diameter 5 μm). The mobile phase consisted of two solvent mixtures: A—methanol: tert-butyl-methyl-ether/water (81:15:4)— and B—consisting of the same components in a ratio of 6:90:4. A linear gradient from 1% B to 100% B in 90 min was used, with a flow rate of 0.8 mL/min and an injection volume of 20 μL. Individual carotenoids were identified by comparing their retention times, elution order on the C30 column, and UV-VIS spectra (λmax, spectral fine structure %III/II) with those of the available standards (β-carotene, lutein, and zeaxanthin) and with literature data for the other carotenoids. The composition of carotenoids extracts was expressed as the area percentage of each identified compound from the total area of carotenoids in the samples. Carotenoids standards were (Sigma-Aldrich, Saint Louis, MI, USA) used.
For chlorophylls analysis, the samples (0.2 g) were homogenized and repeatedly extracted with 80% acetone in water until the residue was colorless. The samples were filtered, and the chlorophyll concentration was determined according to the following formulas:
chl a (mg/g wet biomass) = (12.7 × E663 − 2.6 × E645) v/g
chl b (mg/g wet biomass) = (22.9 × E645 − 4.6 × E663) v/g
Here,
  • chl a—chlorophyll a
  • chl b-—chlorophyll b
  • E645—sample extinction at 645 nm
  • E663—sample extinction at 663 nm
  • v—volume of acetone extract
  • g—weight of samples extracted with acetone
Total lipids were extracted using the Folch method [31]. The phospholipids and glycolipids were separated using thin-layer chromatography on silica gel plates using, as the mobile phase, a mixture of methyl acetate:1-propanol:chloroform:methanol:KCl 0.25% (25:25:28:10:7.5) [31]. The standards used for identification of glycolipids and phospholipids were as follows: monogalactosyldiacylglycerol (MGDG), digalactosyldiacylglycerol (DGDG), phosphatidylethanolamine (PE), phosphatidylglycerol (PG), phosphatidic acid (PA), phosphatidylinositol (PI), phosphatidylserine (PS), and phosphatidylcholine (PC) (Sigma-Aldrich). The spots of glycolipids (MGDG and DGDG) and phospholipids (PC, PA, PI, PS, PG, and PE) were scraped together from the plate to form the two polar lipid fractions. Lipid samples on silica gel were transesterified as methyl esters (FAME) with 14% BF3/methanol and analyzed using gas chromatography with FID detection. A Shimadzu GC 17A system with a flame ionization detector (FID) and a Crompack Silica 25 MXO capillary column (25 m × 0.25 mm i.d., film thickness 0.25 mm) were used. The temperatures were as follows: 5 min at 150 °C, 4 °C/min gradient to 235 °C, and 5 min at 235 °C. The temperature of the injector was 260 °C, and that of the detector was 260 °C. The carrier gas used was helium. The identification of the fatty acid methyl esters was based on the comparison of their retention times with those of the FAME standards. The methyl esters of palmitic acid (16:0), palmitoleic acid (16:1), stearic acid (18:0), oleic acid (18:1 (9c), linoleic acid (18:2), and linolenic acid (18:3) were the standards used for the GC analysis (Sigma-Aldrich).

2.6. Chlorophyll Fluorescence Measurements

Young bean (Phaseolus vulgaris L.) plants were used to test the influence of polluted water on photosynthetic light use efficiency. Following germination, control plantlets were watered with 10 mL of dechlorinated tap water per plant every third day. A total of 60 plantlets (each experimental variant with five replicates) in pots filled with vermiculite were used. Before sowing, the substrate was saturated with Hoagland’s mineral nutrient solution to provide all the essential inorganic macro- and micronutrients. The plants were grown for three weeks in a growth chamber (Sanyo MLR-351H) under a 16 h photoperiod (photon flux density of 530 µmol m−2 s−1) at 23 °C during the light periods and 20 °C in the dark phases and 60% relative air humidity. The position of every plant in the growth chamber was changed randomly once every three days.
Parameters of induced chlorophyll a fluorescence were measured, in situ and in vivo on the first pair of leaves that developed after the greening of cotyledons, on five plantlets for each experimental variant with an FMS2 chlorophyll fluorometer (Hansatech, King’s Lynn, UK). The measurements were repeated twice on the two sides of the main vein and on the adaxial surface of leaf blades. To determine the conventional (non-modulated) parameters of chlorophyll fluorescence, the plantlets were dark-adapted for 15 min prior to measurements in order to stop every previous photosynthetic process in the leaves [32]. Ground chlorophyll fluorescence (Fo) was measured by exposing the leaves to a very weak red light flash (0.1 µmol m−2 s−1) while the transitory maximal fluorescence (Fm) was generated by a strong, saturating light pulse (10,000 µmol m−2 s−1 for 0.5 s). The potential quantum yield of photosystem II (PSII) was determined using both the Fv/Fm and the Fv/Fo ratios (where Fv = Fm − Fo) [33]. Fo and Fm were related to the same chlorophyll a quantity. For this reason, after the fluorescence measurements were ended, 0.25 g fresh weight of the leaf blades used for fluorescence measurements was ground in a mortar in the presence of magnesium carbonate and the photosynthetic pigments were extracted with 25 mL of 80% (v/v) acetone. The extracts were centrifuged for 10 min at 4000× g and 4 °C, and the absorbance of the supernatants was measured at 663 nm [34]. The pulse amplification-modulated chlorophyll fluorescence parameters were registered in constantly illuminated leaves upon application of modulating light flashes. Steady-state fluorescence was measured under continuous illumination with 800 µmol m−2 s−1 actinic light, and then, a saturating white light flash was used to record the modulated maximal fluorescence Fm’. The values of Fs and Fm’ were used to establish the effective quantum yield of PSII (Φ = (Fm’ − Fs)/Fs [35]. The non-photochemical quenching of the fluorescence signal (NPQ) was expressed with the relation (Fm − Fm’)/Fm’ [36]. The vitality index of the photosynthetic apparatus, determined at saturating irradiance (white light with 3000 µmol m−2 s−1 for 5 min), was expressed as the fluorescence decrease ratio or relative fluorescence decrease (Rfd) with the relation (Fm − Fs)/Fs [37]. The chlorophyll fluorescence data were statistically evaluated with the R statistical package, using the Shapiro–Wilk test for normality analysis and Bartlett’s test for establishing the homogeneity of variances. Data sets were represented as means ± standard deviation (SD, n = 5). Differences were considered significant at p < 0.05, as determined with a one-way ANOVA followed by a Tukey HDS test.

3. Results

3.1. Assessment of Physico-Chemical Parameters of Water

The main physico-chemical parameters such as pH, anions, and cations assessed in water samples are shown in Table 1. The pH values were similar and near-neutral at most of the sampling sites except Turda upstream, where the pH was 6.85. The pH increased during algal growth (after 72 h). PO4 anions were detected at all sampling sites, but NO3 and NO2 were detected only at some of the sampling sites. Fe cations were detected at all sampling sites, and Cu as well, except at the Turda upstream sampling site.
Table 1. Physico-chemical (NO3, NO2, PO4 expressed in mg/L, and Cu, Fe in μg/L) * parameters of Arieş River water.
Initial pHpH after 72 hNO3 NO2 PO4 Cu Fe
Baia de Arieș downstream7.31 ± 0.118.15 ± 0.140.8 ± 0.060.42 ± 0.050.89 ± 0.080.01 ± 0.0148 ±2.6
Sălciua downstream7.36 ± 0.128.12 ± 0.1300.065 ± 0.040.89 ± 0.070.12 ± 0.0558 ± 4.2
Turda upstream6.85 ± 0.137.15 ± 0.11000.66 ± 0.050440 ± 10.2
Câmpia Turzii downstream7.85 ± 0.168.61 ± 0.140.8 ± 0.050.42 ± 0.030.89 ± 0.060.01 ± 0.0148 ± 3.5
Abrud inflow6.4 ± 0.156.52 ± 0.15000.89 ± 0.040.05 ± 0.02440 ± 12.3
* Data represent the mean values ± standard deviation (SD) of three replicates. The pH after 72 h represents the pH changes during the algal growth.

3.2. Assessment of Pollutant Compounds

3.2.1. Organochlorine Pesticides

The concentrations of OCPs varied between 0.001 and 0.041 μg/L in water samples and 0.49 and 50.33 μg/kg DW in aquatic plants (Table 2). Two hexachlorocyclohexane isomers (α-HCH and γ-HCH) were mainly identified in water samples from upstream areas, while β- and δ- HCH isomers were mainly present, along with the other isomers, in water samples from the downstream sites Câmpia Turzii and Turda and Abrud flow. Among HCH isomers, the highest concentration in water samples was registered for α-HCH (0.041 μg/L). The pesticide endosulfan sulfate was identified only in six water samples (0.006–0.016 μg/L) while the 1,1-dichloro-2,2-bis(4-chlorophenyl)ethane—DDE and dichlorodiphenyltrichloroethane (DDT) isomers were present only in one water sample from Câmpia Turzii downstream in relatively low concentrations (0.003–0.006 μg/L). OCPs were detected in much higher concentrations in aquatic plants (Table 2) compared to the analyzed water samples. OCP concentrations in plant samples ranged from 0.49 to 50.33 μg/kg DW (dry weight) for HCH isomers and 0.2 to 4.63 μg/kg DW for dichlorodiphenyl tri-chloro ethane (DDT) and its metabolites (DDEs). Aldrin and dieldrin were absent in both water and plant samples, while high levels (0.49–1.80 μg/kg DW) of endosulfan sulfate were detected in plant samples from Sălciua, Câmpia Turzii, and Turda localities. Overall, the range of identified pesticides was much wider in plants than in water samples, with almost all samples containing not only HCH isomers but also DDE and DDT isomers. The highest OPC concentrations were registered for γ-HCH (50.33 μg/kg) in aquatic plant samples from Sălciua downstream.

3.2.2. Monocyclic and Polycyclic Aromatic Hydrocarbons

The levels of MAHs and PAHs detected in the Arieş River basin are presented in Table 3 and Table 4. Among the assessed MAHs, benzene was the main pollutant in water samples (0.07–8.01 mg/L), while in plants, the highest levels (6.98 mg/L) were registered in samples from Turda downstream. Ethylbenzene was not detected in any of the analyzed samples, whereas xylene was present in low concentrations in water samples (0.28–0.51 mg/L) and in the highest concentration (3.02 mg/kg DW) in plant samples from Turda downstream. Toluene was detected mainly in water samples (0.19–0.48 mg/L) at all sites and only at three sites in plant material, with the highest concentration (0.76 mg/kg) being at Câmpeni upstream (Table 3).
Naphthalene and acenaphthylene were not found in any plant or water samples from any sampling site, while pyrene and benzo(a)pyrene were only found in plant samples from Câmpeni upstream and downstream, respectively (Table 4). The other studied PAHs were present in different concentrations, either in water samples or in plant samples, only at some sites. Most of the PAHs were identified at all sampling sites and were mainly present in plant material and less in water. The highest concentration of PAHs was 53.0 mg/kg of benzo(b)fluoranthene and benzo(k)fluoranthene in plant material from Sălciua downstream. Benzo(a)pyrene (BaP, 0.81 mg/kg) was found only in plant material from Câmpeni upstream.

3.2.3. Trace and Heavy Metals

Some of the metals investigated were not detected in Arieş water, such as Pb, Cr, and Ni. Cadmium was detected only in Abrud inflow (0.008 mg/kg), with the concentration being above the imperative value according to EU Directive 75/440/EEC [38]. Copper was also detected, but only at Sălciua upstream, Baia de Arieş upstream, and Abrud inflow, where the concentrations were above the imperative value according to EU Directive 75/440/EEC. Manganese was detected at all sampling sites, with concentrations ranging between 0.034 mg/kg in Câmpia Turzii downstream and 5.136 mg/kg in Abrud inflow. Zinc and iron were detected at all sampling sites as well. Zn concentrations at all sampling sites were below the target or imperative values according to 75/440/EEC. Iron was detected in lower concentrations, ranging between 0.071 mg/kg at Câmpia Turzii upstream and 0.962 mg/kg at Câmpeni downstream and Sălciua upstream. The highest Fe concentration was detected in water collected from Sălciua downstream (5.462 mg/kg) (Table 5).
In plants collected from different sampling sites, all trace metals were detected, with the highest concentrations being in plants from the downstream sites of the cities, except in plants collected from Sălciua upstream, which showed higher concentrations of all metals than plants from Sălciua downstream (Table 5). Higher concentrations of Pb were detected in plants collected from the sector Sălciua–Câmpia Turzii–Turda–Baia de Arieş. Cadmium concentrations were similar in plants collected from all sampling sites, with the highest concentration being found in plants from Baia de Arieş downstream (0.134 mg/kg). High concentrations of copper were found in plants from Sălciua upstream (8.037 mg/kg), Baia de Arieş upstream (10.559 mg/kg), and Baia de Arieş downstream (25.509 mg/kg). Manganese concentrations were variable in plants from different sample sites, with the lowest concentration being found in plants from Sălciua downstream (2.657 mg/kg) and the highest concentration being found in plants from Baia de Arieş downstream (89.38 mg/kg), but high Mn concentrations were found in plants from Sălciua upstream (34.034 mg/kg) and Baia de Arieş upstream (38.84 mg/kg). Chromium concentrations were similar in plants from all sampling sites except the plants from Câmpia Turzii upstream and downstream (0.36 mg/kg). The highest concentrations of nickel were detected in plants from the Câmpia Turzii upstream and downstream sampling sites (about 3.2 mg/kg), Turda upstream and downstream (about 3.3 mg/kg), and Baia de Arieş downstream (3.057 mg/kg). Zinc concentrations were higher in plants from Sălciua upstream and Baia de Arieş upstream (about 6.4 mg/kg), with the highest concentration being detected in plants from Baia de Arieş downstream (18.585 mg/kg). Lead was detected in high concentrations in plants from all sampling sites, with the highest values found at Câmpia Turzii upstream and downstream (about 380 mg/kg).

3.3. Assessment of Water Quality via Ecotoxicological Studies with Algae

The main physico-chemical parameters that affect algal growth are pH, type of medium, preculture conditions, and strain selection. The pH increased during algal growth, shifting to a more alkaline reaction due to the depletion of dissolved carbon dioxide, which is used in algal photosynthesis (Table 1). A strong negative correlation was established between the growth medium concentration and the growth rate of the algal cultures (Table 6). The highest values were recorded for Câmpia Turzii, downstream from the industrial zone (r = −0.91), and the lowest values were recorded for the sampling site located downstream of Baia de Arieş (r = −0.69), a former gold mine that is currently closed. The percentage inhibition of algal culture ranged between 11.91% and 82.40% according to the tested concentrations (Table 7). Considering the effect of chemical parameters of polluted water on growth inhibition, significant positive correlations with pH (r = 0.61), nitrate (r = 0.58), and nitrite (r = 0.56) were recorded when the algal culture in the study was grown in river water (100%). For the concentrations of 25%, 50%, and 75%, very weak or no significant correlations with these parameters were found. The ErC50 values were between 22.05 for the Baia de Arieş downstream sampling site and 60.7 for Turda upstream, indicating a lower ecotoxic effect upstream of Turda compared to downstream of Baia de Arieş, where the concentration of test water, which resulted in a 50% reduction in growth rate relative to the control, was much lower.

3.4. Evaluation of the Cytotoxic Potential of Water from the Arieș River

The water samples from different sites exhibited varying impacts on the mitotic index, frequency of mitotic divisions, and occurrence of chromosomal aberrations in onion-root meristematic cells. The chromosomal aberrations showed the highest value (2.5) in plants treated with water from Abrud inflow, while the lowest value was noted alongside control in plants treated with water from Sălciua downstream and Câmpia Turzii upstream (0.4) (Table 8). Concerning instances of abnormal mitosis, these were present in cells treated with water from Sălciua upstream (0.1), Turda upstream (0.1), Câmpia Turzii downstream (0.1), and Abrud inflow (0.2) (Table 8).

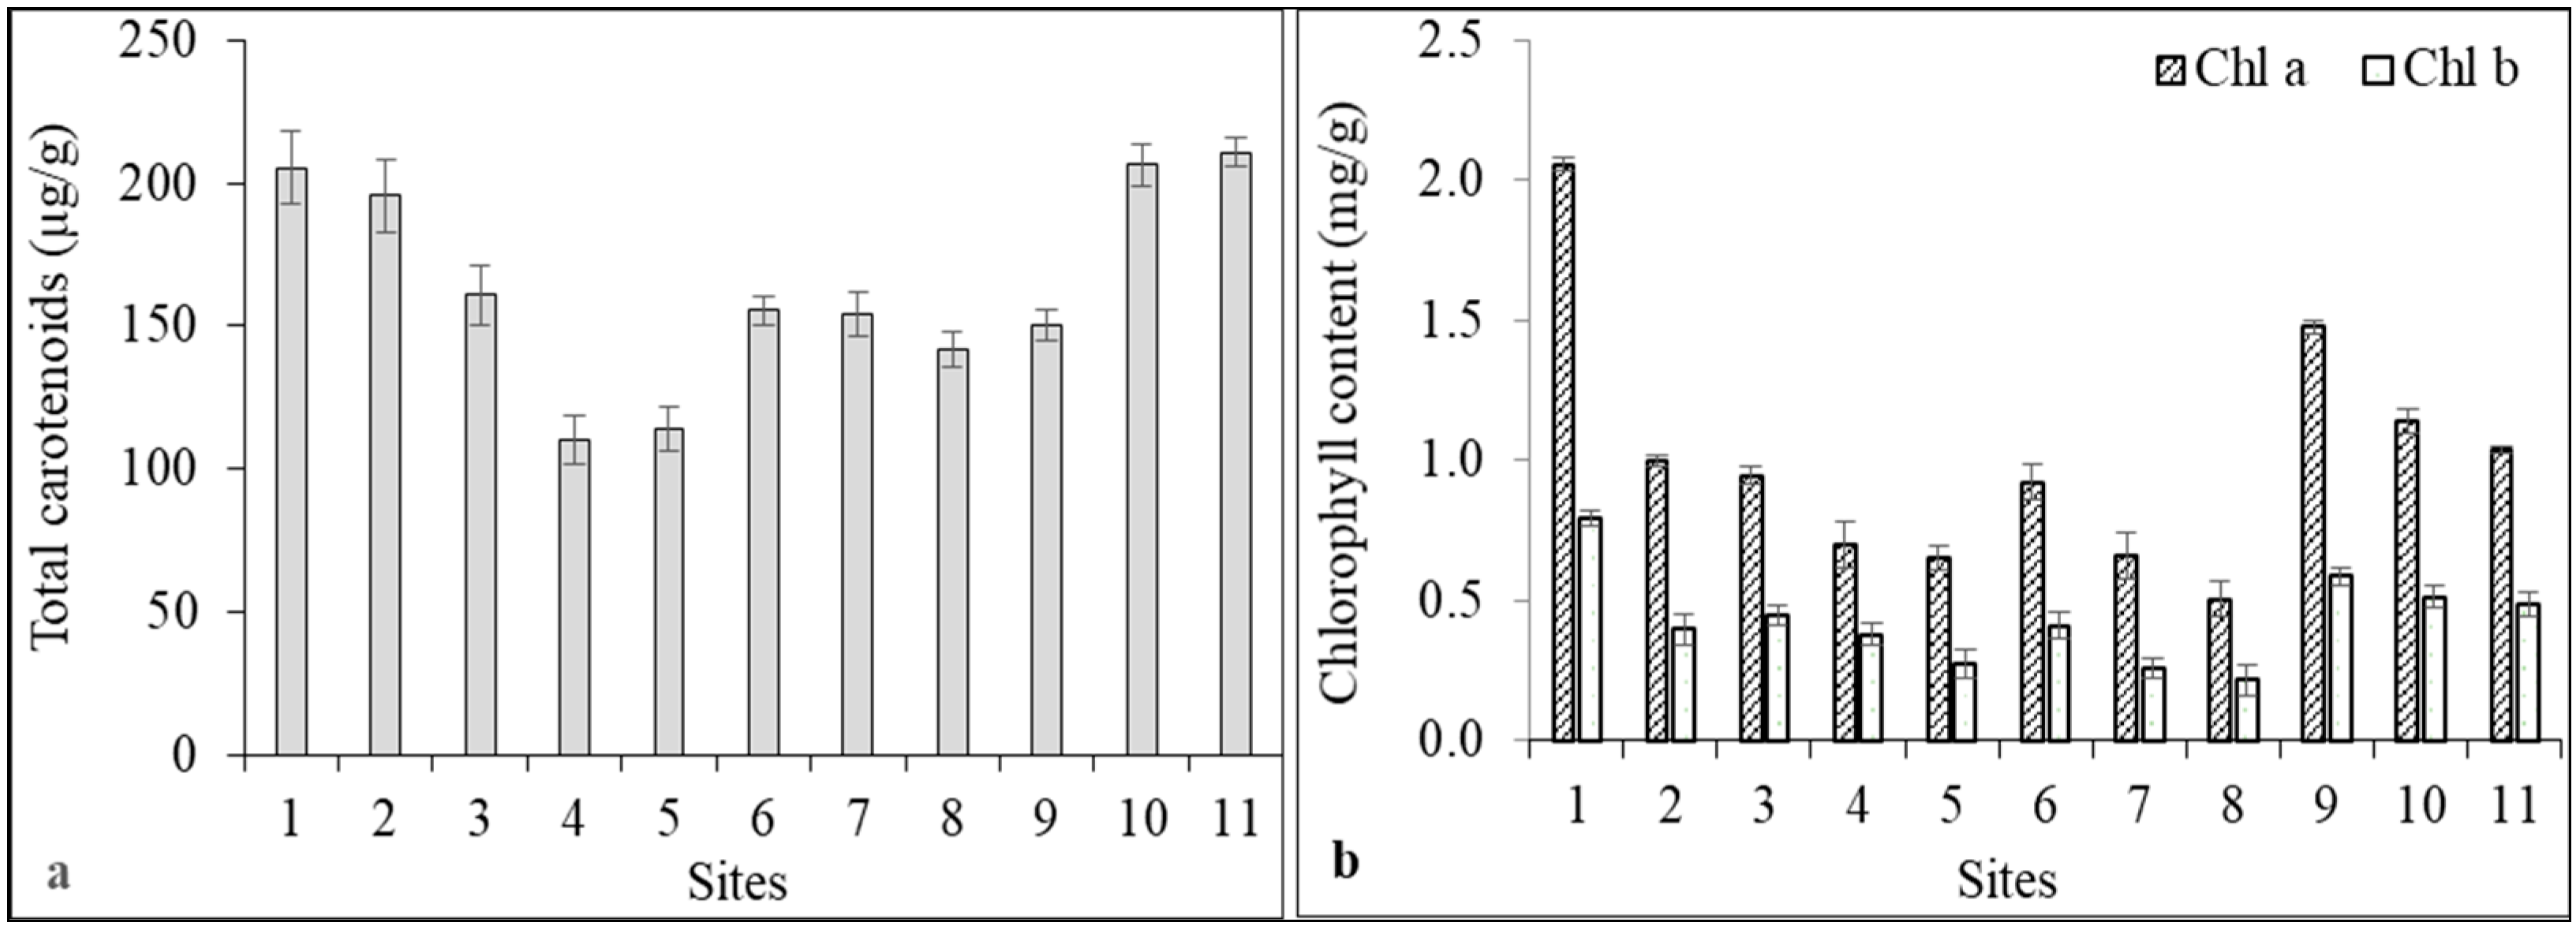
3.5. Analysis of Carotenoids, Chlorophylls, and Fatty Acids from Phospholipids and Glycolipids

In the present study, we measured chlorophyll a (Chl a), chlorophyll b (Chl b), and total carotenoids from aquatic plants using classic spectrophotometric methods. Moreover, individual carotenoid content was determined using HPLC-PDA. The total carotenoid content ranged between 110.23 and 210.80 µg/g, with the highest concentration being for Abrud inflow and Câmpeni upstream and the lowest for Sălciua downstream and Câmpia Turzii upstream (Figure 1a). Chl a ranged between 0.51 and 2.06 mg/g while Chl b content was 0.21–0.79 mg/g in aquatic plant samples (Figure 1b). The Chl a/Chl b ratio ranged between 1.86 and 2.59. The lowest values for chlorophyll concentration were recorded for the samples from Turda downstream, Câmpia Turzii upstream, Sălciua downstream, and Turda upstream.
Photosynthetic tissues primarily contain the same major carotenoid pigments, which include beta-carotene, lutein, violaxanthin, and neoxanthin. Several other minor carotenoids can be identified in certain species: antheraxanthin, zeaxanthin, β-cryptoxanthin, 5,6-lutein-epoxide, α-carotene and lactucaxanthin [26]. The HPLC-PDA analysis of the aquatic plant samples highlighted the same pattern, as shown in Table 9. Lutein was the major pigment in all the samples, representing 46–63% of the total carotenoids, followed by β-carotene, with 27–41%; neoxanthin; and violaxanthin. Zeaxanthin and antheraxanthin were found in low amounts in all analyzed samples, below 1% and up to 3.2%, respectively. Differences in the composition of carotenoid pigments existed, but these variances cannot be solely attributed to environmental factors since the collected samples encompassed various species.
In the present study, we extracted and separated two major classes of polar (complex) lipids, glycerophospholipids and glyceroglycolipids, and determined their fatty acid profiles using gas chromatography (Table 10 and Table 11). The major fatty acids in aquatic plant phospholipids were palmitic acid (26–42%) and linolenic acid (22–35%), followed by linoleic acid (13.6–21%). The variations between the fatty acid concentrations of the samples were quite important and could have been caused both by external factors and by the variability of the plant material. Nevertheless, it was observed that the decrease in linoleic acid coincided with an increase in the proportion of linolenic acid and saturated acids. The Double Bond Index (DBI), as a measure of unsaturation degree, varied from 1.95 to 3.53 in the case of phospholipids, with an average value of 2.92.
Concerning glyceroglycolipids, a much higher percentage was observed for linolenic acid (43–65%) than otherwise expected. The linoleic acid content was lower in most of the glyceroglycolipid samples, as were the contents of palmitic and stearic acids. In general, the degree of unsaturation of glycolipids was much higher, with a percentage of 63–75% unsaturated fatty acids, compared to phospholipids with 45–59% AGN. This profile is even better depicted by the DBI values, which ranged from 4.69 to 8.91 with an average of 5.82.

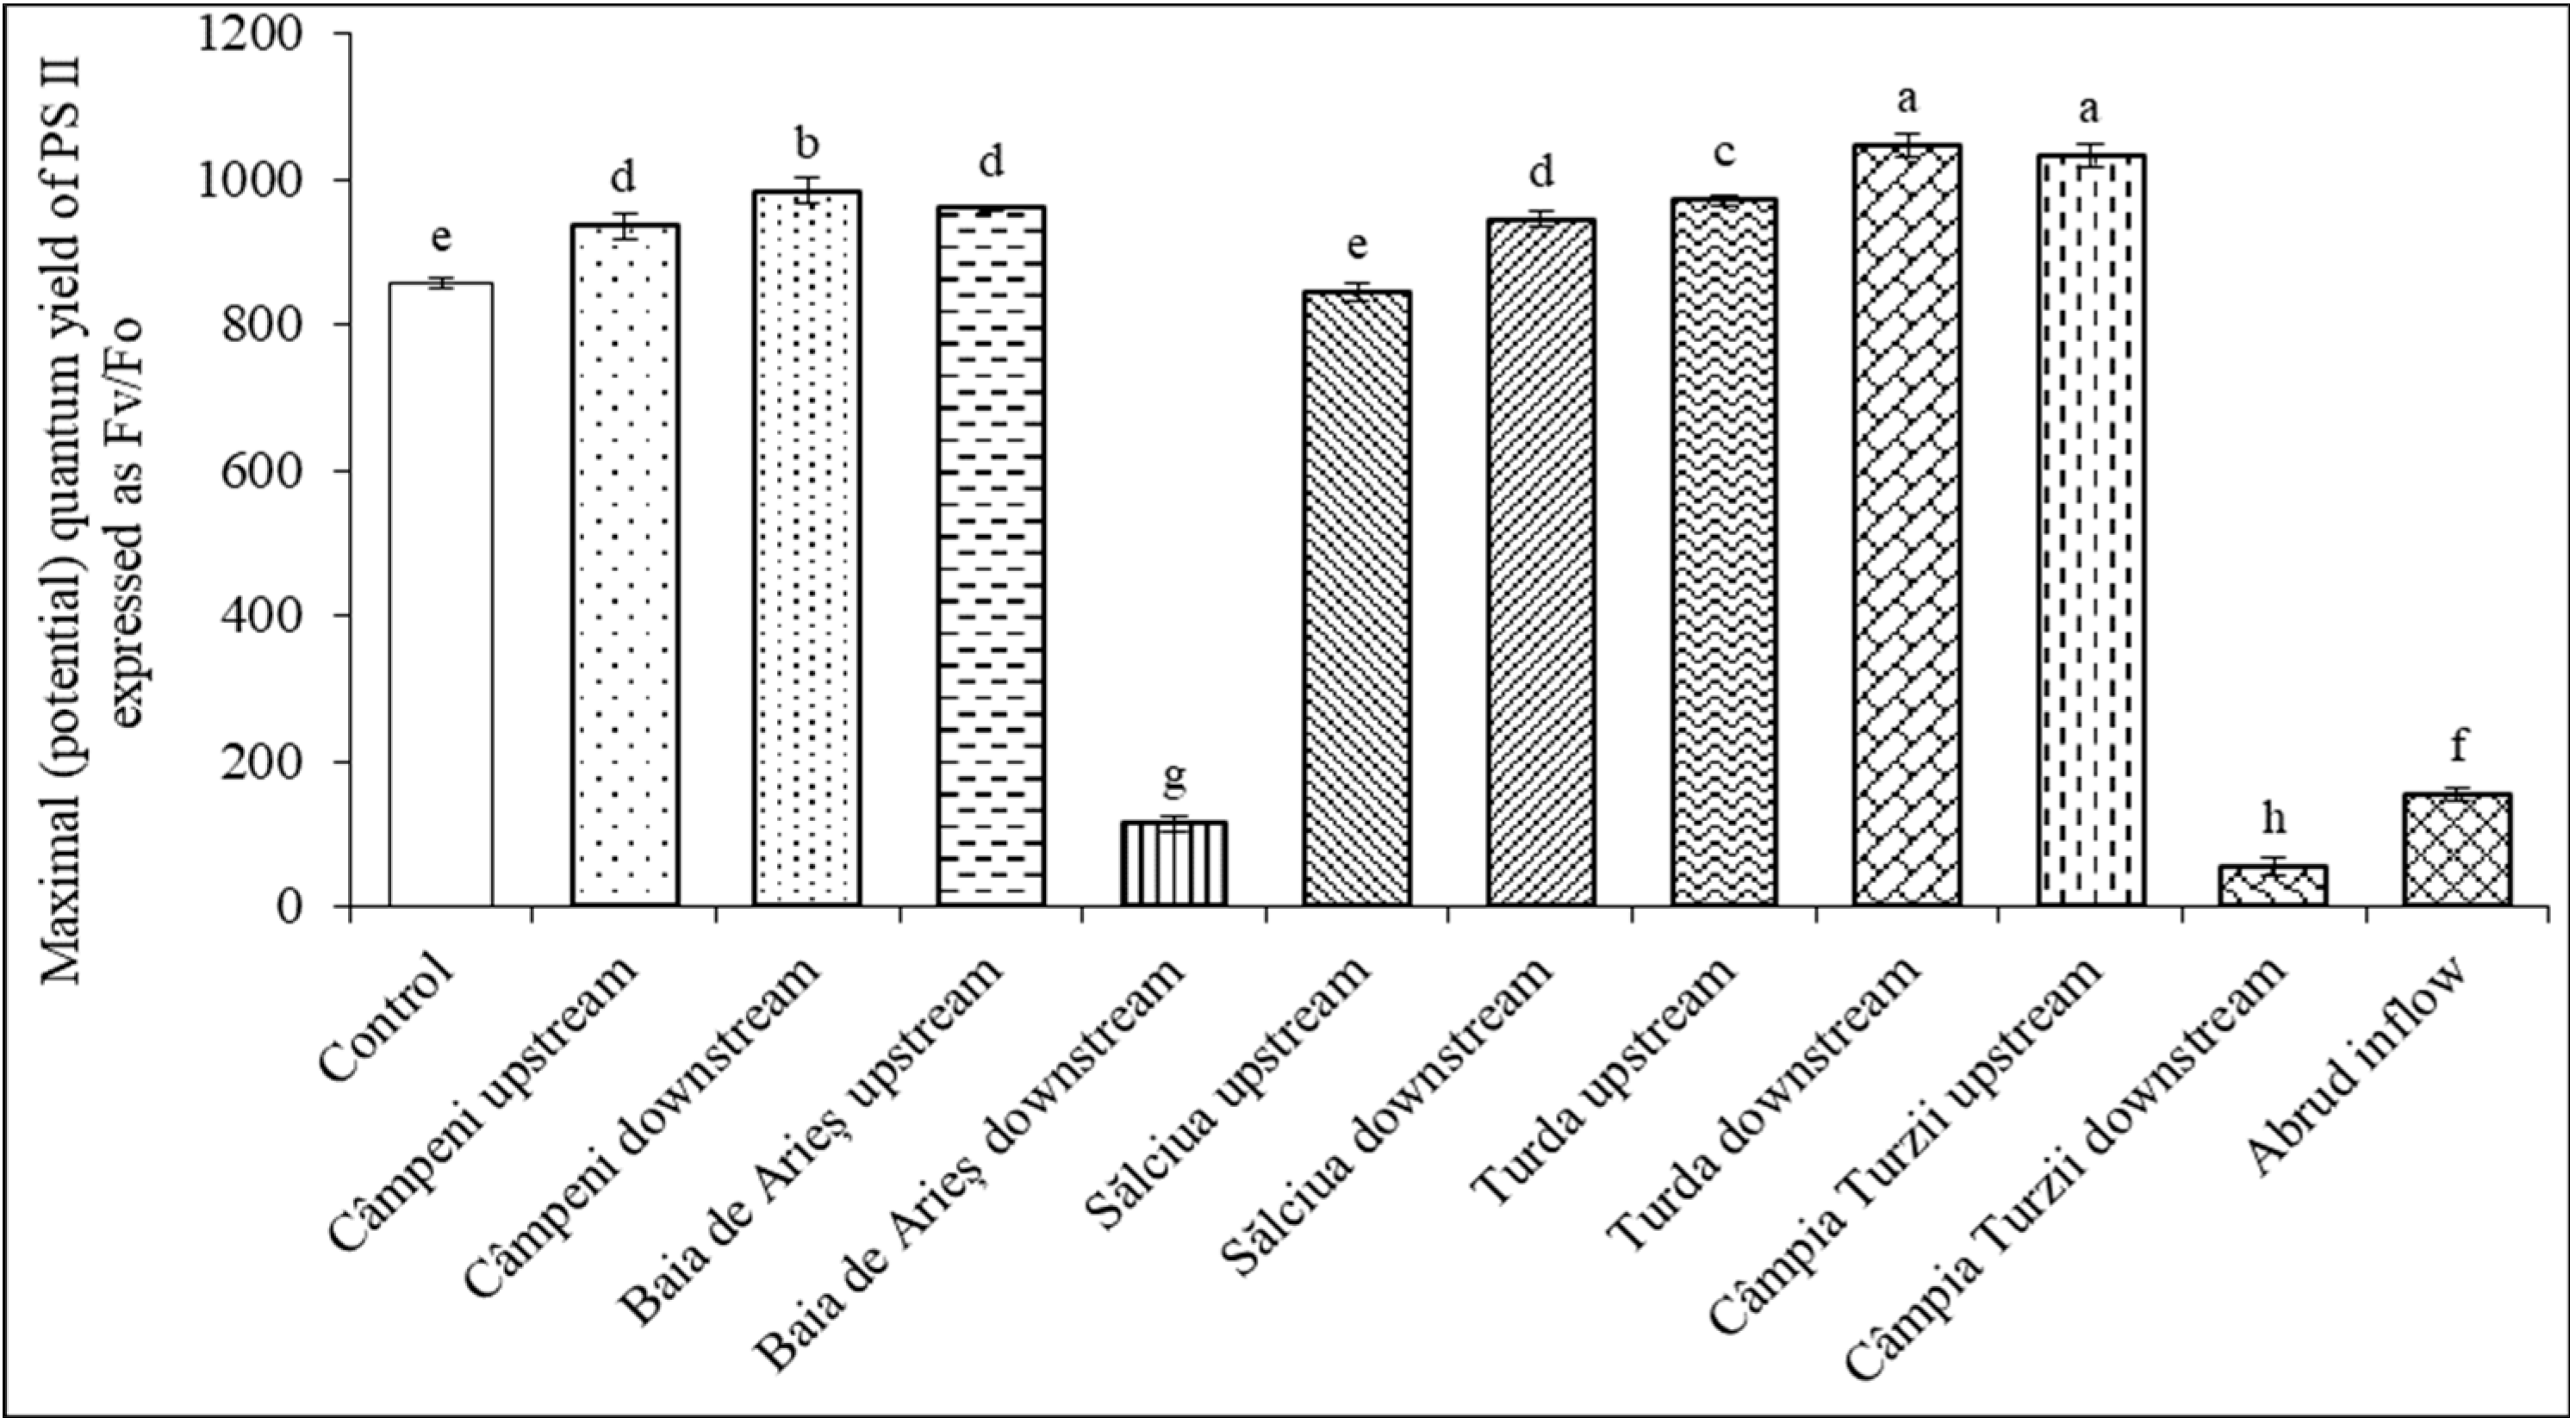
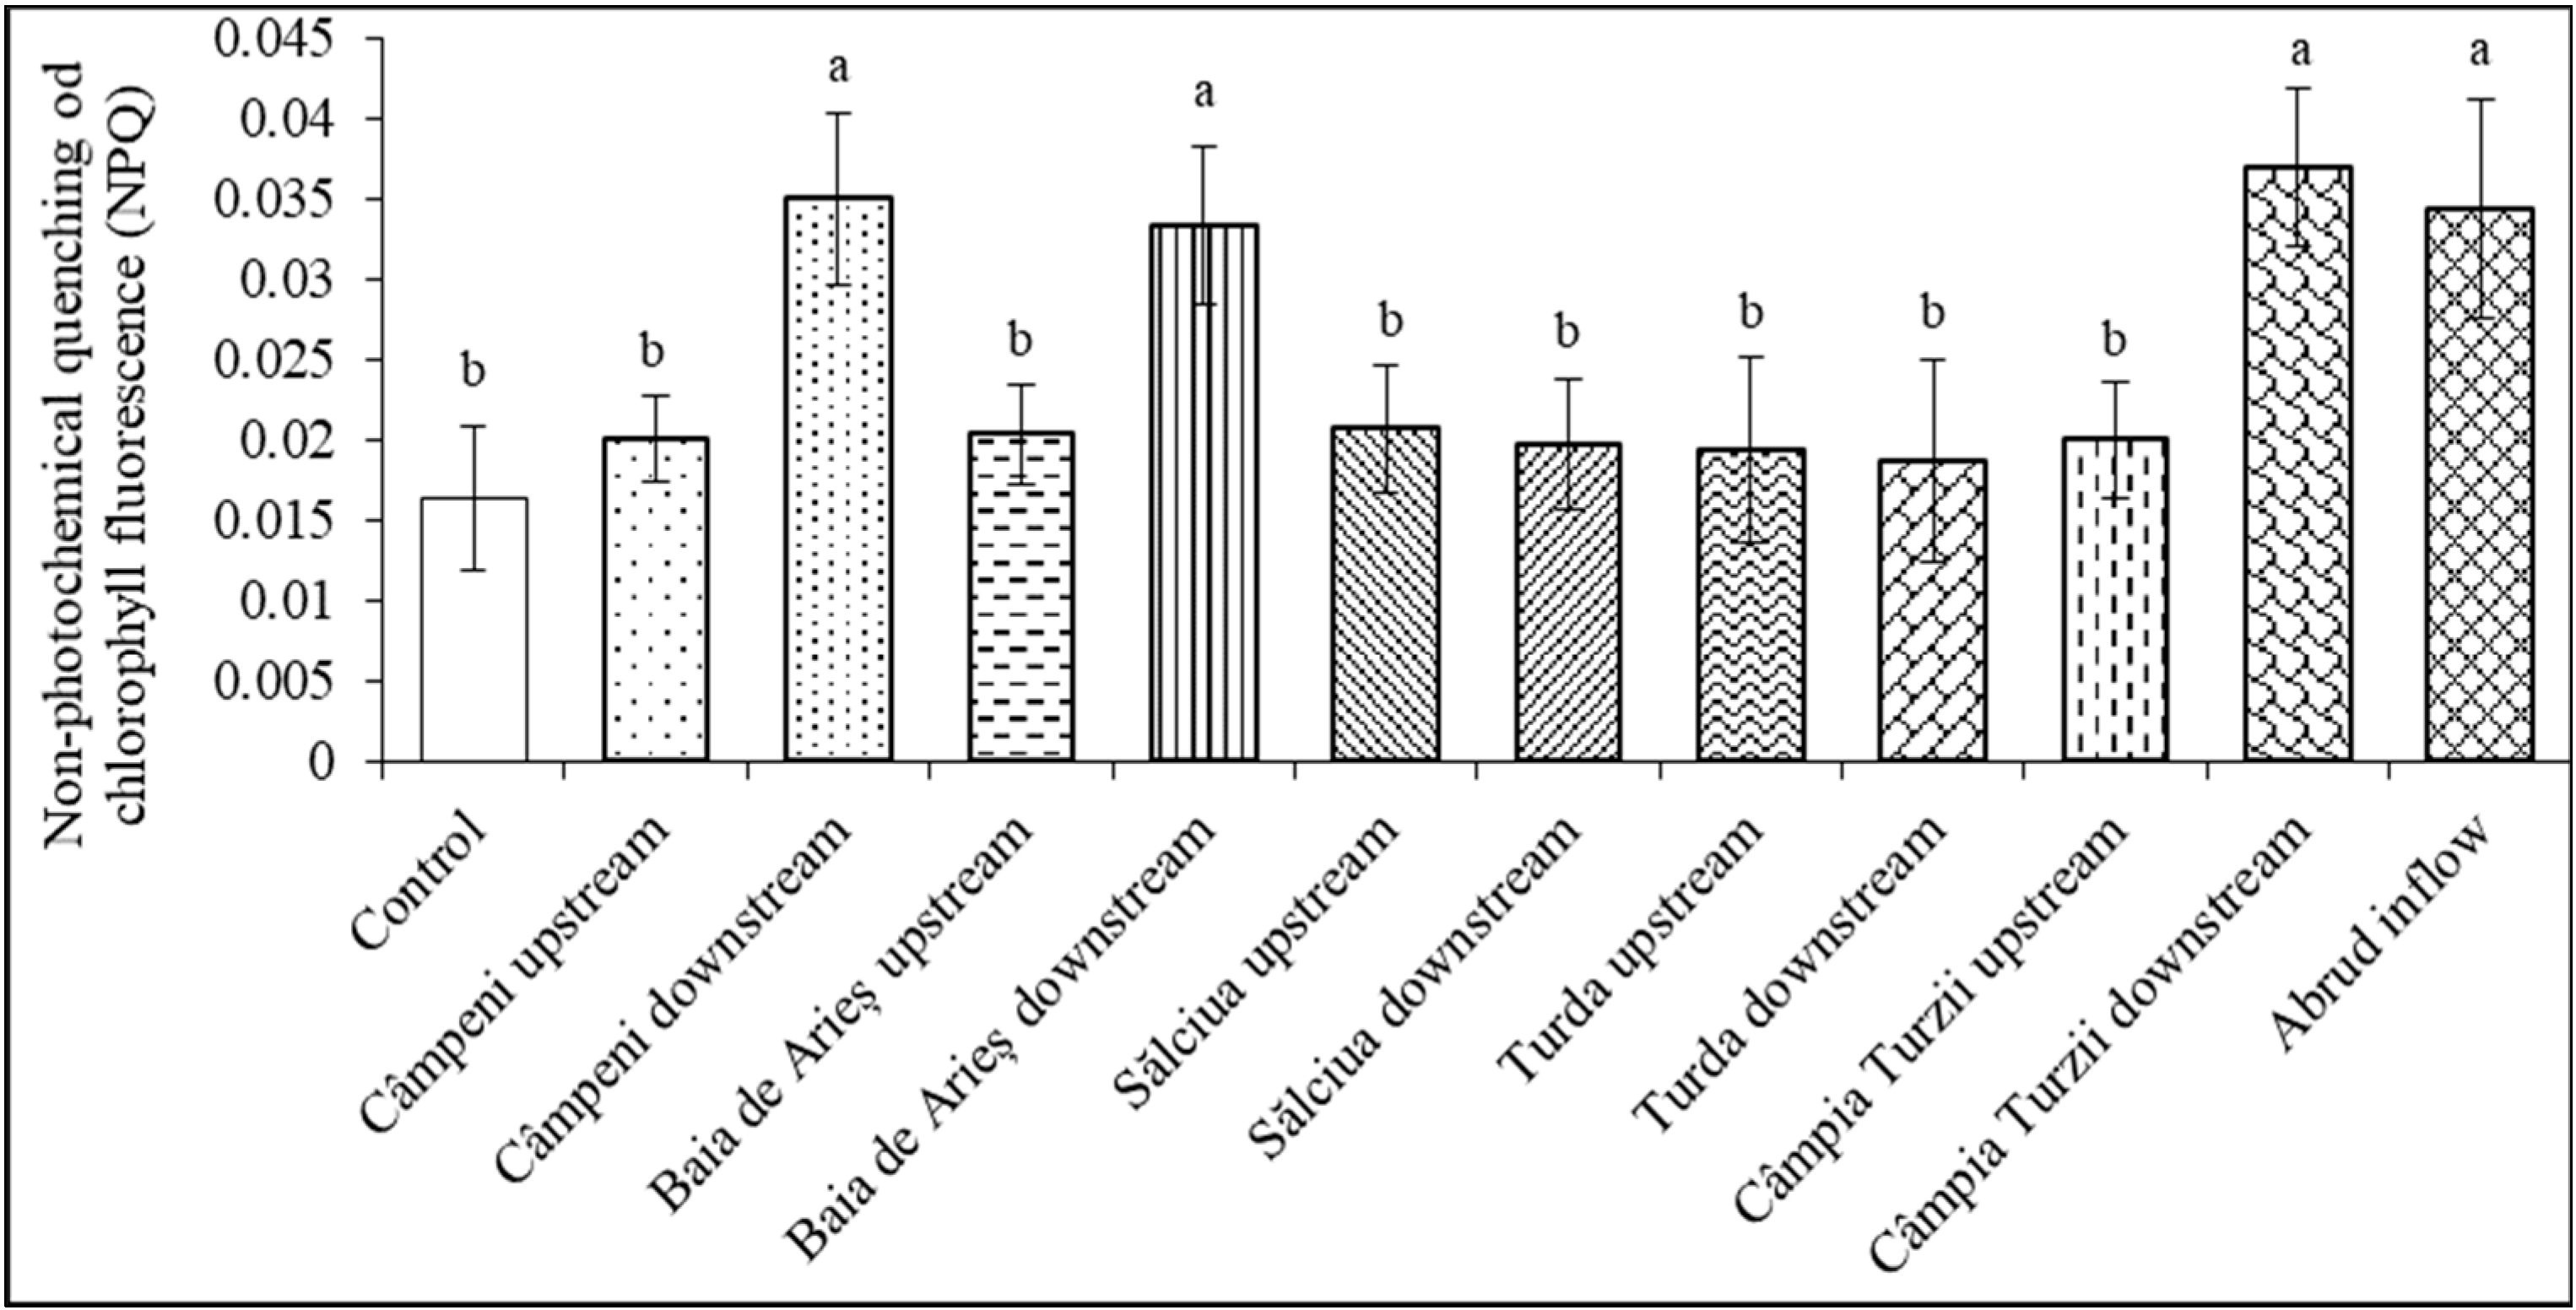
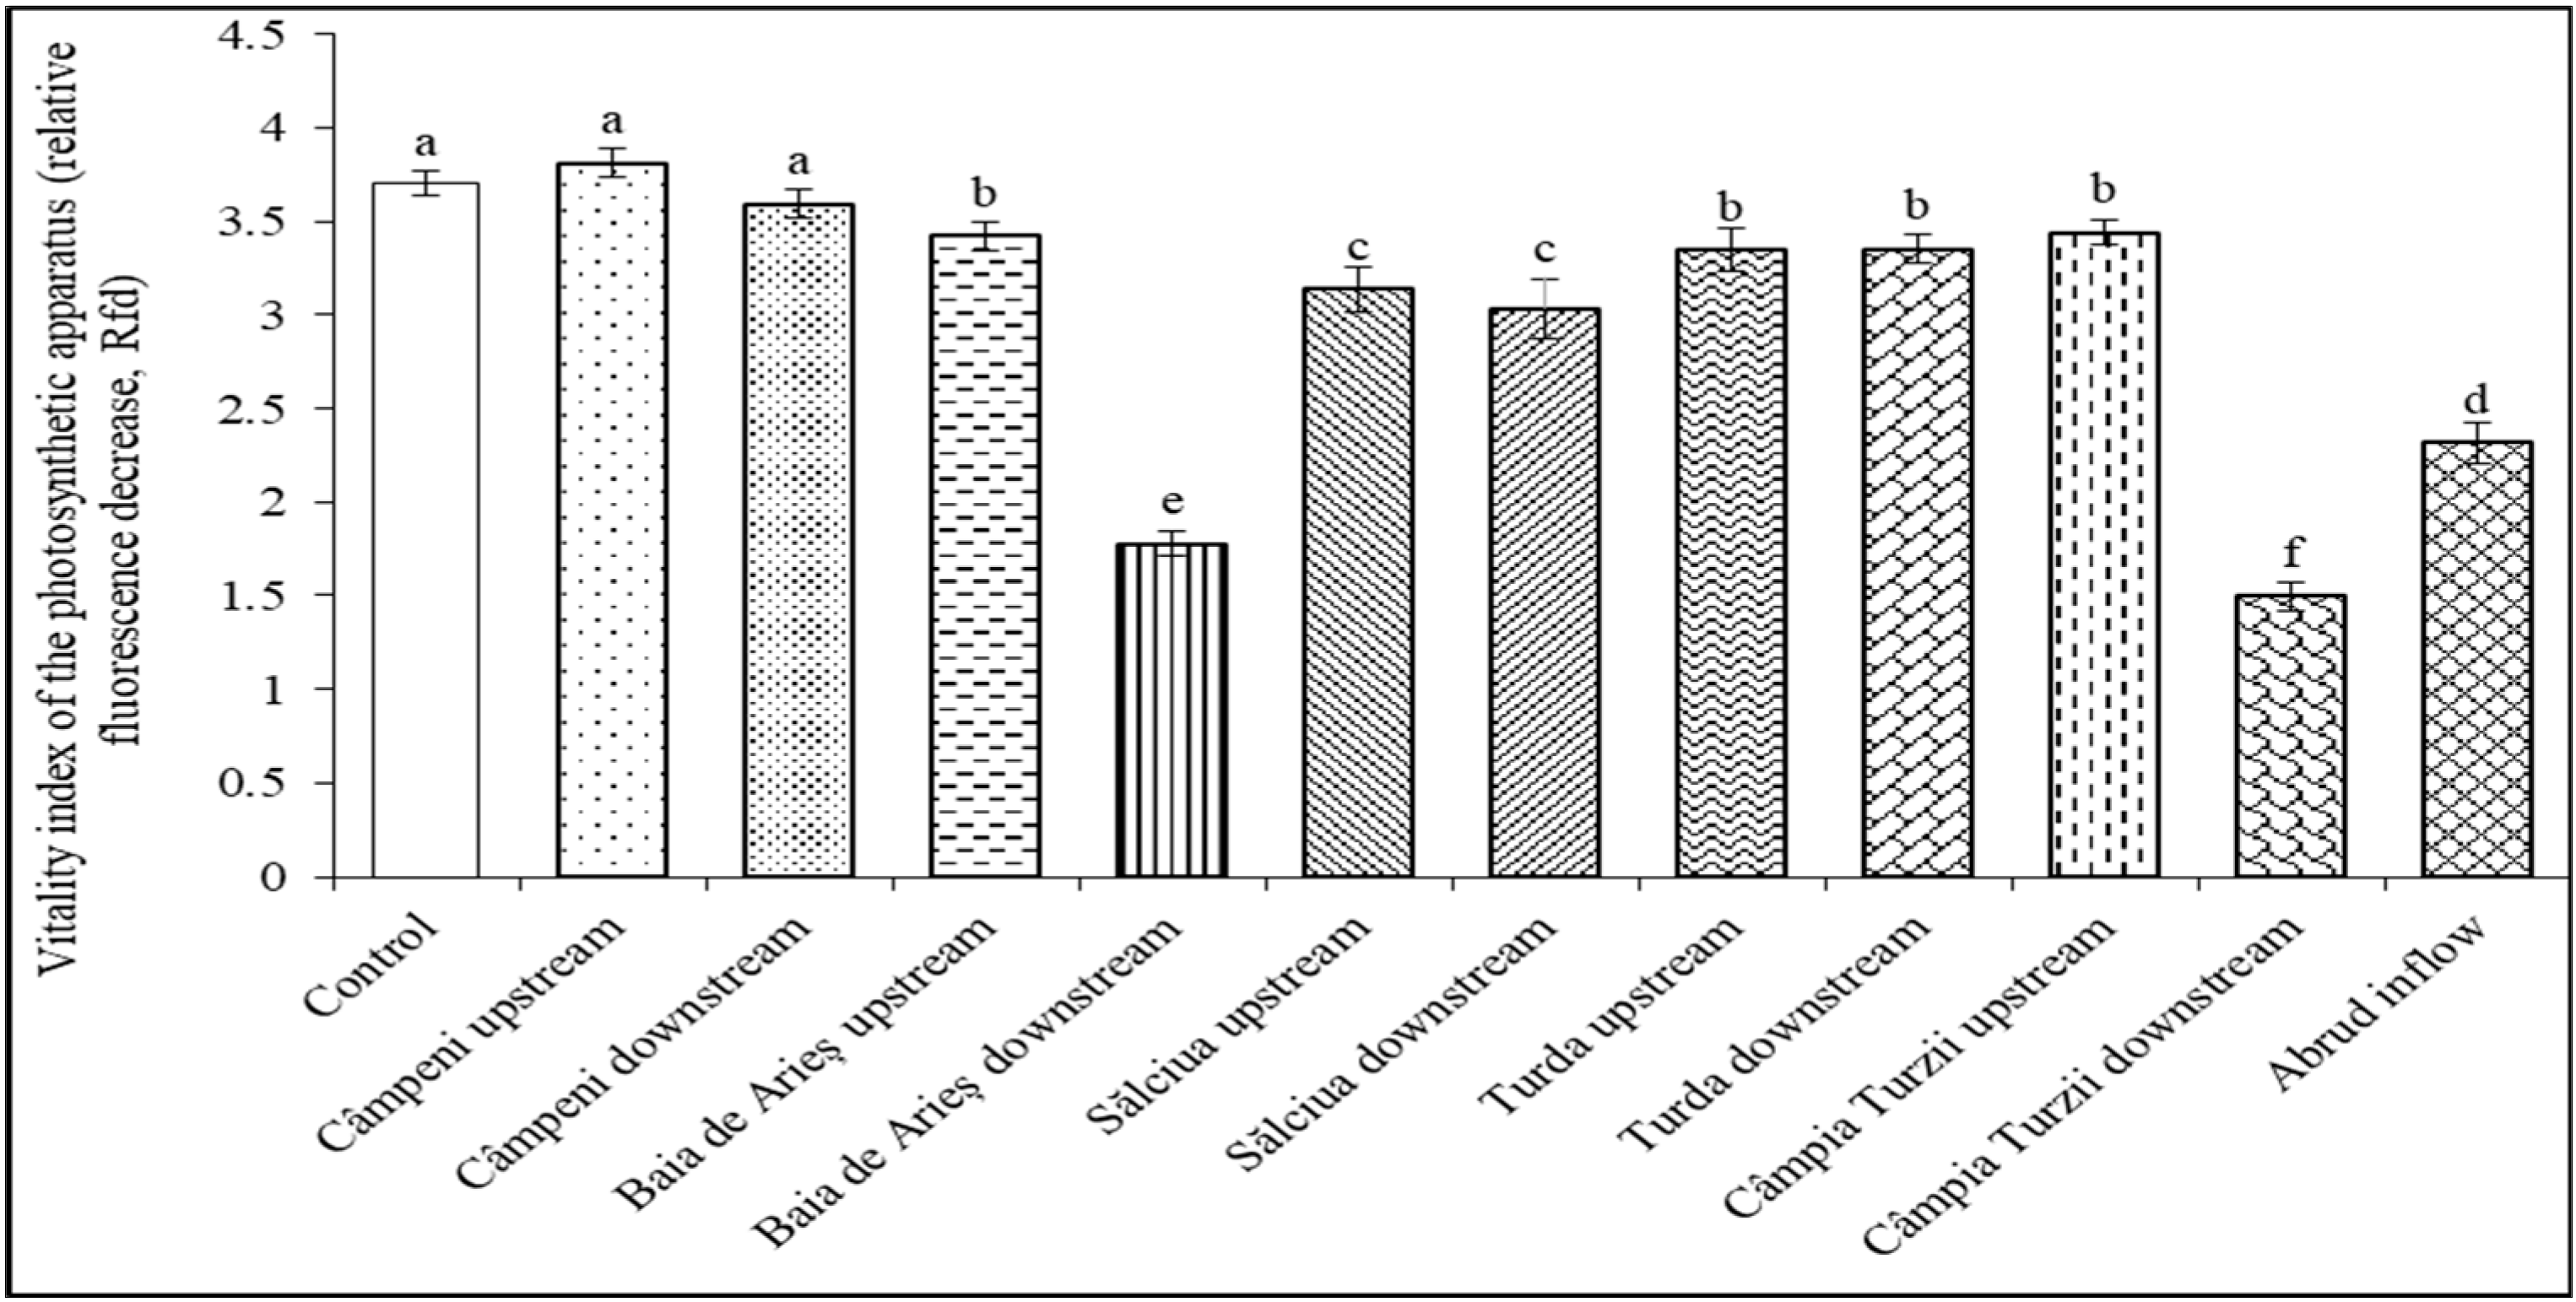
3.6. Chlorophyll Fluorescence Parameters

In bean leaves grown under similar photon flux densities and temperature regimes, Fo values significantly decreased in plants treated with water from Baia de Arieş downstream, Câmpia Turzii downstream, and Abrud inflow (Table 12). Chemical analyses of the water revealed that in water from Baia de Arieş downstream, there are higher concentrations of certain metals (especially copper, manganese, and iron) and monocyclic aromatic hydrocarbons (mainly benzene and toluene). At Câmpia Turzii downstream, the water contained organochlorinated pesticides and higher amounts of xylene while in Abrud inflow, there were higher quantities of both metals (mainly zinc and manganese) as well as monocyclic and polycyclic aromatic hydrocarbons (especially fluorene).
In bean plants treated with water from the Arieș River, a pronounced decrease in Fm (expressed on a chlorophyll unit basis) could be registered under the influence of the same water sample, which also caused a decay in ground fluorescence, i.e., Baia de Arieș downstream, Câmpia Turzii downstream, and Abrud inflow (Table 12). One of the most largely used parameters of induced chlorophyll fluorescence in plant-stress physiological studies is the potential or maximal quantum yield of PSII (expressed as Fv/Fm or as Fv/Fo). The most significant declines of the Fv/Fm ratio were identified in plants treated with water from Câmpia Turzii downstream and Baia de Arieș downstream (Figure 2).
In bean plants treated with water from the Arieș River, significant decreases in the effective quantum efficiency were recorded in two cases: under the influence of organic contaminants (organochlorinated pesticides and monocyclic aromatic hydrocarbons) from Câmpia Turzii downstream and in the presence of water polluted with trace metals from the mining region of Baia de Arieș (Table 12). In leaves, a statistically significant increase in NPQ values was induced by water from Câmpeni downstream (where polycyclic aromatic hydrocarbons and higher concentrations of ferric ions were detected), Baia de Arieş downstream (with high concentrations of metals and monocyclic aromatic hydrocarbons), Câmpia Turzii downstream (with organochlorinated pesticides), and Abrud inflow (with trace metals and certain aromatic hydrocarbons) (Figure 3).
The chlorophyll fluorescence decrease ratio (Rfd), also known as the vitality index of the photosynthetic apparatus, is frequently used as an overall vitality marker in stress physiology studies. The influence of polluted water on the photosynthetic performance of bean leaves showed that the vitality index of the photosynthetic apparatus (expressed as Rfd) was a sensitive marker for the presence of reduced concentrations of inorganic and organic water contaminants (mainly trace metals, pesticides, and aromatic hydrocarbons). The vitality index values were not significantly modified in the case of water from Câmpeni upstream and Câmpeni downstream, suggesting that in this region, the water does not exert an obvious polluting effect on the examined plants. A moderate but statistically significant decrease in the vitality index was registered under the influence of water from Baia de Arieş upstream, Turda upstream and downstream, and Câmpia Turzii upstream. A further decrement could be observed in plants treated with water from Sălciua upstream and downstream. The lowest values of the vitality index were obtained for plants treated with water from Baia de Arieş downstream, Câmpia Turzii downstream, and Abrud inflow (Figure 4).

4. Discussion

4.1. Analysis of Organochlorine Pesticides

OCPs are the most widely encountered contaminants, being described as persistent and bioaccumulating substances prone to long-range transportation [40]. Although severely restricted or banned in many countries, OCPs still appear as contaminants, both in food as well as in the environment [41]. In our study, the major contaminants were mainly found in aquatic plant samples and were represented by HCH isomers, DDTs, and derivatives, as well as endosulfan sulfate. Among HCHs, the dominant isomers were β-and γ-HCH, with these data being consistent with the intensive use of γ-HCH (lindane) as a pesticide over the years in the studied area and the challenge associated with the environmental degradation of HCHs [20].
According to the European Directive 2008/105/EC for surface waters, the maximum limit for hexachlorocyclohexane is 0.04 μg/L and for endosulfan, 0.01 μg/L [42]. The OPC levels in the water samples analyzed in our study were slightly higher than MACs for α-HCH (0.041 μg/L for α-HCH) and endosulfan sulfate (0.016 μg/L). OCPs were found to be mainly accumulated in aquatic plants (15.87 μg/kg for α-HCH; 50.33 μg/kg samples for γ-HCH; 3.78 μg/kg DW for DDTs; 4.63 μg/kg for DDEs; and 1.80 μg/kg for endosulfan sulfate). This might be explained by OCPs’ cumulative properties and the bioaccumulation potential of many living organisms including plants, and, thus, their potential migration along food chains [43].
We detected residual OCPs that have been extensively used in the past and have, due to their long-time persistence in the environment, accumulated in higher concentrations in aquatic plants. However, OCPs (0.1445–0.3164 μg/L) were detected in two surface water samples collected in 2015 from the Arieş River, with HCH isomers, mainly γ-HCH, being the most predominant [20]. The authors showed that there was a fresh input of lindane (γ-HCH), a pesticide originating from dump deposits of the former Turda Chemical Plant and supposedly used only in past agricultural practices [20]. However, it seems that many of these pesticides (DDT, technical HCH—prohibited in Romania since 2003, lindane—forbidden since 2007), are still illegally applied and are continuously detected in relatively high concentrations in the environment [20,44]. There are several other studies occasionally reporting OPC levels significantly above the regulatory limits and not only in the network of internal rivers [45,46].

4.2. Monocyclic and Polycyclic Aromatic Hydrocarbons

MAHs are composed of single-aromatic-ring compounds, such as benzene, toluene, ethylbenzene, and xylenes (BTEX), that are widely used as solvents [47]. Among the investigated MAHs, only benzene can be found on the watch list of substances for Union-wide monitoring in the field of water policy pursuant to Directive 2008/105/EC of the European Parliament and of the European Council [42]. According to this directive, the maximum allowable concentration (MAC) for benzene in surface waters is 50 μg/L. The levels registered for benzene in the present study in both water and plant samples were extremely high, ranging between 0.07–8.01 mg/L in water samples and 0.59–6.98 mg/kg DW in plant samples. In particular, water samples from Abrud inflow showed exceptionally high levels of benzene (8.01 mg/L). This could potentially be attributed solely to leaks originating from hazardous waste sites containing benzene or spills of petrol and petroleum products. Moreover, this collection point is located near the Roşia Poieni mine, the second largest copper deposit in Europe. Contamination of water, especially with benzene, is considered a major health issue since benzene is a highly volatile compound that is rapidly absorbed following inhalation [48]. Benzene is not persistent in surface waters, being either volatilized or degraded by bacteria, but if it exists deeper down in the groundwater, it is more persistent [49]. It has a half-life lasting from a few days to weeks, up to 28 days in groundwater while, in the air, it has a half-life of about 5 days [48,49]. The published research on water contamination with benzene is mainly related to regions hosting different industries: point emissions [48], gasworks [49] and chemical plants [50]. MAHs are often reported in water and wastewater [51] and are known as toxic chemicals [52]. BTEX concentrations reported in effluents, spills, and top soil were up to 1.5 mg/kg (mg/dm3 for liquid samples) [53].
The values registered in water samples for toluene and xylene were within the acceptable limits (1 and 10 mg/L, respectively) according to WHO guidelines for drinking water [54].
According to the EU’s Drinking Water Directive (EU) 2020/2184, the sum of benzo(b)fluoranthene, benzo(k)fluoranthene, benzo(ghi)perylene, and indeno(1,2,3-cd)pyrene must not exceed 0.1 μg/L in drinking water [55]. However, the maximum limit imposed by the European Directive 2008/105/EC for fluoranthene only in surface waters was 0.1 μg/L [42]. In addition, the amount of benzo(a)pyrene must not exceed 0.1 μg/ in surface waters, while there are no applicable limits for BbF and BkF [42]. In our study, PAH concentrations exceeded the allowable values in all samples and at all sites compared to drinking water limits. Thus, BbF and BkF were the main PAH contaminants registered in plants while BaA and Chr, and Phe and Ant, were the only PAHs detected in water samples at three sites: BaA and Chr at Abrud inflow (2 µg/L) and Câmpeni upstream (30.3 µg/L) and Phe and Ant only at Sălciua upstream (2.2 µg/L). According to published data, the presence of Chr indicates coal combustion, while BaA and BbF may originate mostly from vehicle emissions and the burning of fossil fuels [56]. The PAH levels detected in our study were higher than those registered in surface waters and sediments collected from Tisza and its tributaries, ranging from 1.22 to 260.26 ng/L in water samples and 4.94 to 10.62 μg/kg in sediment [57] or in the Olt River, with total PAH concentrations in water ranging from 1.3 to 46.2 ng/L and sediment content from 1.78 to 614.04 μg/kg [58]. PAHs are widely distributed in the environment [59,60]. The presence of the identified aromatic hydrocarbons can be due to the spillage of petroleum products or the discharge in the Arieş River of waste waters resulting from economic activities containing these compounds. It was underlined that generally, PAH pollution is closely associated to the level of socio-economic development in the local area, the resident population, and the industry [59]. PAH pollution has been concentrated mainly in water pollution in specific river segments or reservoirs [61]. The presence of benzene in surface waters represents a high risk because this compound is carcinogenic. Given its presence in gasoline, it appears as a pollutant whenever such fuels reach water, air, and soil.

4.3. Trace and Heavy Metals

Despite the long history of metal mining activity in Romania, there has not been a systematic evaluation of the effects of metal dumping into local rivers. Previous data showed that the Arieş River is polluted mostly with Cu and Zn (due to mining activities in the Arieş hydrographic basin), but also with significant levels of Cd and Fe [62]. The Arieş River is of particular interest because of the significant damages caused by precious metal exploitation. The metal concentrations found in our study in Arieş River water were below those detected in previous studies; this was probably due to the cessation of mining in the area. Thus, the metal concentrations declined with distance from the mine and time due to the self-decontamination processes in the zone [63]. Previous results showed exceeding-EU-imperative values for Cd, Cu, and Zn by 7.6, 58, and 1.8 times in the Abrud River downstream of the Bucium mine [64]. Cu and Zn concentrations increase downstream of the mining-affected tributary Arieş, contributing to the contamination of the sediments in the Arieş River, especially in Abrud and Baia de Arieş, as shown in our study. The main source of Cu in the water of the Arieş River is the Roşia Poieni, located 12 km upstream from Baia de Arieş [65]. A previous study showed that despite the significant metal inputs from the Roşia Montană and Roşia Poieni mining areas, the metal concentrations in the Arieş River were high only for Mn, Cu, Fe, and Pb [14]. This explains our results as well; lower concentrations were found most probably due to the dilution effect that occurs as a result of the low flow rate of the tributary Arieş compared with the flow rate of the Arieş River [66]. Excepting Baia de Arieş, where, usually, increased concentrations of Cr, Zn, As, Se, Cd, Pb, and U were found, at the other sites, only traces of heavy metals were found. Dilution is probably the main factor that explains the low metal concentrations in the Arieş River, but other processes, such as adsorption, absorption, chemical precipitation, and complexing, occur and lead to changes in the composition of the surface waters [22].
Generally, the surface water in the middle part of the Arieş River basin, near and downstream of the gold mine impoundment, showed high pollution with metals [19], but more distant sectors were less polluted, as shown in the present study. Other studies showed that mining activity in the Arieş basin has affected metal concentrations in surface water, such as those of Pb, Cu, Cd, and Zn. The high concentrations of these metals and the low pH values suggest that, even closed, the mines and tailings dams represent continuous pollution sources for natural waters [12]. In contrast to the results on Arieş water, tailings were found to be highly contaminated with various metals including As, Cu, Cd, and Pb, which could be considered potential sources of soil, surface water, and groundwater contamination [21]. Although the heavy metal concentration did not exceed the maximum allowable levels, except for Fe, Mn, and Pb, the Arieş River water was categorized as susceptible due to persistent long-term pollution [17]. Based on multiple pollution indices, the central section of the Arieş River, particularly downstream from the gold mine impoundment, exhibited a notably elevated pollution level. Potential Ecological Risk Index values for soil and sediments were in the order Cu > Ni > Pb > Hg > Cr > As > Mn > Zn > Cd and As > Cu > Cr > Cd > Pb > Ni > Hg > Mn > Zn, respectively [19].
However, heavy metals accumulated in the sediments had had an adverse impact on the aquatic flora. All metal concentrations in plants were high, especially those of Pb, Cu, and Zn in the sector Sălciua–Câmpia Turzii–Turda–Baia de Arieş. The metal concentrations in plant species irrigated with contaminated water were previously examined. The results varied significantly across plant species and sampling sites, exerting a substantial influence on the plants’ absorption capacity as previously discussed. Generally, the results showed that vegetables contained high concentrations of metals [67]. This explains the high concentration of metals found in plant samples from aqueous ecosystems that are continuously exposed to heavy metal pollution.

4.4. Assessment of Water Quality via Ecotoxicological Studies with Algae

In previous studies on Scenedesmus obliquus [68], the highest rate of biomass-specific growth and biomass productivity were associated with relatively low pH (6 pH) and relatively high temperatures (30 °C). The pH higher than 8 measured in this study may be one of the causes of algal growth inhibition. This aspect may be one of the shortcomings of the standard protocol because the depletion of carbon dioxide (in solution and in the headspace of the closed flasks) is an unusual situation in natural habitats. For optimal acidic growth in laboratory conditions, some compensatory measures, such as adapting the algal culture volume/headspace volume ratio, reducing pH, and increasing bicarbonate concentration, should be considered to maintain carbon dioxide availability. In water samples from Turda upstream, no nitrates, nitrites, or copper were detected, but a high level of iron was recorded, indicating a low level of pollution and oligotrophic conditions. Water samples from Câmpia Turzii downstream and Baia de Arieş contained nitrates, nitrites, and traces of copper. For these sites, the main sources of nitrate contamination are fertilizers and animal waste from agricultural areas adjacent to the water course. The level of phosphates was high and constant along the river. The usual sources of phosphate contamination are sewage, industrial waste, fertilizer, and runoff from agricultural sites. At high levels, phosphates sustain algal growth and eutrophication. The iron concentrations from Turda upstream and Abrud inflow were higher (440 μg/mL) compared to other sites due to local industrial-specific contamination.
Mining activity-induced pollution persists over an extended period, and waste containing heavy metals could continue to be released through rainfall. The highest differences among the growth rates compared to control were recorded for Turda upstream and Abrud inflow, where the highest level of iron was also registered.
It is considered that the growth rate is more appropriate against deviations in test conditions, allowing improved interpretations and comparisons between studies [69]. Even if the amounts of nitrates and nitrites are low, the cumulative effect of different factors, such as pH, may explain these results. Weak-to-medium negative correlations with copper (−0.49) and iron (−0.34) were recorded for the river water. The copper induced an increased trend of inhibition in relation to the concentration of the culture medium (r ranging from 0.47 at Iμ25% to 0.92 at Iμ75%). According to some perspectives [70], the currently accepted standard protocols employed within regulatory frameworks contain several shortcomings with regard to the physico-chemical and biological aspects of algal toxicity.

4.5. Evaluation of the Cytotoxic Potential of Water from the Arieș River

The Allium test was widely used to establish the level of cytotoxicity and genotoxicity in water [71,72]. Biological indicators have the advantage of sensitivity in detecting contaminants. The effects of tested waters on the mitotic index were quite moderate, varying insignificantly between control and the lowest value obtained for Baia de Arieş downstream. These results demonstrate the lack of phytotoxic effects or disturbances regarding cell multiplication in the Allium root meristem under treatment. On the other hand, the results regarding chromosomal aberrations showed a certain cytogenotoxic effect of water from certain locations. However, no micronuclei were observed, the occurrence of which has frequently been reported in cases of waters contaminated with heavy metals and cyanides [73]. Regarding the cytogenetic effect of waters (based on the Allium test) polluted with heavy metals and cyanides in Bulgaria, a decrease in cell division and the presence of abnormal mitoses were reported [73]. Although the evaluated waters did not exhibit significant cytotoxic effects in the Allium test, they still have deteriorated water quality and pose a threat to all organisms relying on them.

4.6. Analysis of Carotenoids, Chlorophylls, and Fatty Acids from Phospholipids and Glycolipids

It is worth mentioning that in the majority of the samples, there was a strong correlation between the chlorophyll content and the total carotenoid content. While plants from Câmpeni upstream and Abrud inflow presented the highest amounts of both chlorophylls and carotenoids, those collected from Sălciua downstream, Câmpia Turzii upstream, and Turda upstream exhibited the lowest pigment content. Moreover, plants from Baia de Arieş downstream had the lowest ratio of Chl a/Chl b. Plants from Câmpeni upstream, which showed the lowest level of contamination with trace and heavy metals, organochlorine pesticides, and PAHs, displayed the highest content of photosynthetic pigments. Plants from Sălciua upstream and Turda downstream had likewise accumulated significant levels of lead, iron, and chromium.
There are numerous studies showing that the quantitative and qualitative modifications of the membrane lipids play critical roles in inducing plant tolerance to stress, including xenobiotics like heavy metals, pesticides, etc. Key events among these modifications include the release of linolenic acid from membrane lipids by lipases and changes in unsaturation degree, which are mediated by desaturases [74]. PUFAs are released from membrane lipids and act as modulators of the signal transduction brought on by stress-inducing factors, particularly linoleic acid. Furthermore, it is well documented that xenobiotics, apart from their direct impact on fatty acid biosynthesis, can trigger the oxidation of highly sensitive polyunsaturated fatty acids. This oxidative process leads to changes in the composition of membrane fatty acids, finally compromising membrane activity [75,76].
Plants exhibit varying responses when subjected to the stress induced by heavy metals. Therefore, examining the fatty acid composition in two halophyte species (Sesuvium portulacastrum and Mesembryanthemum crystallinum) exposed to high doses of cadmium showed that in the case of M. crystallinum, the content of linolenic acid (C18:3) decreases and linoleic acid (C18:2) increases, while in S. portulacastrum, no significant changes in the composition were observed [77]. Differences may appear within the same species, depending on the organ analyzed. The decreases in the level of unsaturated fatty acids, fatty acid length (increase C16:0 to C18:0 ratio), and unsaturation degree (DBI) were also observed in the case of membrane lipids from the roots of cucumber seedlings treated with Cd, Ni, and, to a lesser extent, Cu [78]. The same effect was reported for spinach leaves in response to cadmium contamination [79]. However, in a more recent study, PUFA levels increased and oleic acid decreased in wheat plants treated with cadmium [80]. Although there have been fewer studies on the effect of heavy metals on lipid metabolism in aquatic plants, the mechanisms involved seem to be similar to those in terrestrial plants. Some authors have investigated the effect of copper ions (100 µM) on the lipid composition of subcellular membranes in Hydrilla verticillate [81]. In addition to the decrease in photosynthetic pigments, copper exposure induced lipid peroxidation, enhanced membrane permeability, decreased the lipid content, and affected the lipid and fatty acid composition of the membranes of chloroplasts, mitochondria, and microsomes. The profiles of fatty acids in total lipid extracts revealed that the main species were C18:3 (29–52%), C16:0 (18–27%), and C18:2 (11–18%), depending on the type of membrane. The C18:3/C16:0 ratio of chloroplast lipids decreased from 2.9 (control) to 0.7 in copper-treated cells after 24 h due to an increase in saturated fatty acids and a decrease in unsaturated fatty acids, mainly in the chloroplasts and microsomes.
In addition to membrane lipids (phospholipids, glycolipids, suberin, and cutins) that act as structural barriers to the environment, plants also contain neutral lipids (triacylglycerols), which are energy substrates in various metabolic processes. Polar lipids (like glycerophospholipids, glyceroglycolipids, sphingholipids, and cholesterol) are the major constituents of plant membranes. Hence, plants are characterized by a specific lipid and fatty acid composition within each cellular compartment and organelles. While PG, DPG, and PI can be found in thylacoids, phosphatidylcholine (PC) and phosphatidyl-ethanolamine (PE) are the most significant phospholipids and are the major constituents of extrachloroplastic membranes (the endoplasmic reticulum, the plasma membrane, the membranes of the Golgi apparatus, peroxisomes, glyoxysomes, the nucleus, and mitochondria). Thylakoids are distinguished by their so-called lateral asymmetry and have a completely distinct lipid composition from the other membranes, consisting predominantly of glyceroglycolipids. MGDG and PG are mainly found in the outer membrane and DGDG and SQDG in the inner one. Generally, phospholipids have two major fatty acids, which exist in the ratios 18:2 and 16:0. Both the ratio between phospholipids and their composition in fatty acids are closely dependent on the membrane type and on the plant material. Due to fluctuations in the levels of unsaturated fatty acids, which are recognized for their impact on membranes’ physical properties, plants respond to biotic and abiotic stress by modifying the fluidity of their membranes [74].

4.7. Chlorophyll Fluorescence Parameters

Biotic and abiotic stresses highly influence photosynthesis in plants; therefore, studying photosynthesis represents an effective way to reveal the mechanisms of their adaptation to different environments [82]. Chlorophyll fluorescence (Fo) is considered a useful tool to investigate the action mechanisms of adverse environmental factors, being an early and sensitive indicator of abiotic stress and a reliable marker of the protective capacity of plants against photooxidative damage and other mechanisms of stress tolerance [32,33].
Measurements of Fo reflect that water pollution with heavy metals and organic xenobiotics may affect light energy capture and transfer in the photosynthetic pigment antennae of leaves, impairing the accumulation of a suitable quantity of energy for the primary production of new plant metabolites. The fact that certain water samples (e.g., from Baia de Arieș downstream to Turda and Câmpia Turzii upstream) increased the value of Fo may be related to a compensatory reaction through which the plants, upon sensing a moderate stress condition due to mild water pollution, extended their light-harvesting antennae in order to avoid a decrement in light energy income. Decreased Fo values were also reported when different plant species were exposed to copper toxicity and oxidative stress conditions, while increments of Fo were recorded under the influence of heat shock and excessive light intensity [83]. Exposure to chromium also modified the value of this parameter in maize seedlings [84].
Our results suggest that the same water contaminants that disturb the organization of the light-harvesting complexes also impair the photochemical reactions on the acceptor side of PSII as revealed by the transitory maximal fluorescence (Fm) parameter. Similar decrements in Fm values were reported for plants exposed to prolonged heat stress, heavy metal toxicity, and herbicides that withdraw electrons from PSI [85,86]. The results concerning the Fv/Fo ratio suggest that these river sectors contain the highest quantities of contaminants (mainly organochlorinated pesticides at Câmpia Turzii and metals and monocyclic aromatic hydrocarbons at Baia de Arieş), which affect the capacity of plants to use light energy in photosynthesis.
It was demonstrated that under the influence of certain abiotic stress factors, especially when plants are exposed to mild stressors, the potential quantum yield of PSII, expressed as the Fv/Fo ratio instead of Fv/Fm, may be used as a more sensitive physiological marker of moderate disturbances to the photosynthetic apparatus [33]. This is also the case for water contaminants existing in the Arieș River, which had more amplified effects on the Fv/Fo ratio than on Fv/Fm. These modified values indicate that minor alterations in water quality induce protective reactions in the photosynthetic apparatus that aim to better cope with the adverse influences of polluting agents. The effective quantum efficiency of PSII (Φ) in plants exposed to ambient light provides a measure of the linear electron transport rate in thylakoid membranes; thus, it may be considered a functional indicator of overall photosynthesis [85].
An indicator of the protective capacity of plants against adverse environmental factors that impair photochemical reactions and enhance photo-oxidative threats is the non-photochemical quenching of chlorophyll fluorescence (NPQ). Under normal conditions, its numeric value is very small, but as stressors induce defensive reactions, its value increases significantly, reflecting that tolerance has been developed [34]. Similar increments of NPQ to those that we obtained in this study have been previously reported [84] when green microalgae were grown in water polluted with micromolar concentrations of chromium (6+), cadmium, and nickel. Furthermore, increased NPQ values were recorded when plants were exposed to various environmental stress conditions that inhibited the photochemical reactions of photosynthesis and induced the dissipation of excess energy as heat [35,36].
The chlorophyll fluorescence decrease ratio (Rfd) is directly correlated to the net carbon dioxide assimilation rate of leaves, thus being an indicator of the capacity of plants to increase their net biomass under given environmental conditions or contaminants [37,83]. A decrease in the concentration of chlorophyll and carotenoid pigments has been observed in aquatic plants (Avicennia marina and Lemna trisulca) exposed to cadmium, zinc, and copper ions [87,88]. More recently, a study showed that in the case of the aquatic macrophyte Potamogeton pectinatus L., a concentration of copper above 1 μM inhibited photosynthesis and decreased the levels of chlorophyll and carotenoids [89]. When Ceratophyllum demersum L. was exposed to Cd and Pb, the levels of chlorophyll a and b and carotenoids decreased with increasing metal concentration and time [90]. When other plant species were exposed to copper and chromium in similar conditions, they responded differently. For instance, Eichhornia crassipes accumulated chromium in the roots, and the metal treatment increased chlorophyll in the leaves, while Salvinia biloba and Pistia stratiotes were negatively affected at the level of photosynthetic pigments [4]. Eichhornia sp. and Pistia sp. also showed significant decreases in chlorophyll a and chlorophyll b with increases in the concentration of chromium [91].
Certain aquatic plants can act as hyperaccumulators able to remove heavy metals alongside with other contaminants; this is an important practical trait for implementing aquatic phytoremediation strategies. As an example, Pontederia cordata can tolerate low concentrations of cadmium and sequester it in the roots, but at high doses, chlorophylls and carotenoids are significantly reduced (by more than 60%) [92].

5. Conclusions

Our study revealed that the main contaminants in aquatic plants were organochlorine pesticides (OCPs) and derivatives, as well as trace and heavy metals. This implies that these dangerous compounds were still present and persistent in the environment. Both water and plant samples, notably in the Abrud inflow region, contained high concentrations of benzene. This suggests a possible source of pollution, maybe from petroleum-related activities or hazardous waste sites, which can have negative health implications. The permitted limits for the quality of drinking water were surpassed by polycyclic aromatic hydrocarbons (PAHs) in the water samples. These substances are indicative of pollution sources such industrial discharges or petroleum products, notably in the downstream area of Baia de Arieș. While trace and heavy metal concentrations in water samples were below previously reported levels, most probably due to mining activity cessation, high concentrations of metals like Pb, Cu, and Zn were found in plants in certain areas, suggesting ongoing pollution in the sector Sălciua–Câmpia Turzii–Turda–Baia de Arieş.
Water pollution also revealed cytogenetic effects, such as chromosomal aberrations, on plants, indicating potential genetic damage caused by the contaminants. However, micronuclei, more severe indicators of genotoxicity, were not observed. Moreover, parameters of induced chlorophyll fluorescence proved to be early and sensitive markers of the influence of trace metals and organic xenobiotics on the light-energy use efficiency of primary producers. This method could be introduced as a tool for the prevention or early detection of pollution in the routine analysis of water quality by water management authorities, being extended to different primary producers of aquatic ecosystems.
Implementing a long-term monitoring program for Arieș River water quality is crucial for assessing the environmental and public health risks associated with persistent contaminants and ensuring the protection of aquatic ecosystems. Consequently, the studies can be expanded to encompass a broader array of taxonomic groups, including microorganisms, invertebrates, fish, and birds. Although many studies have reported various mining and industrial operations as the main sources of water pollution in the area, further investigations are required to pinpoint the exact origins of the main contaminants identified in our study (benzene and PAH contamination, OCPs, trace and heavy metals) and to thoroughly evaluate the ecological repercussions on aquatic plant and animal species. Furthermore, research should be conducted to examine the potential of aquatic plants in bioremediation efforts to identify indicator animals and bacteria relevant for characterizing the quality of aquatic environments, thereby exploring sustainable strategies for pollution mitigation. Finally, it is crucial to assess the potential health risks to the local population resulting from exposure to polluted water and aquatic products in order to ensure their protection. The environmental and public health concerns connected with water pollution in the Arieș River can be better understood and managed by undertaking these further investigations and acting on the prescribed conclusions.

Author Contributions

Conceptualization: A.H., A.B.-K., A.C.; Methodology: A.B.-K., M.K., C.D., L.F., A.P., A.M.; Validation: A.B.-K., A.H., A.C.; Formal analysis: A.B.-K., A.H., A.C.; Investigation: M.K., C.D., L.F., A.P., A.M.; Resources: A.B.-K., V.P.; Data curation: A.B.-K., A.H., V.P., A.C.; Original draft preparation: A.H., A.B.-K., A.C.; Writing—review and editing: A.H., A.B.-K., C.D., L.F., A.P., A.C. Funding acquisition: A.B.-K. All authors have read and agreed to the published version of the manuscript.

Funding

This research was supported by the Ministry of Education and Research through the project CEEX-06-11-61/26.07.2006 and by partial funding from the Ministry of Research, Innovation and Digitization through a Project for Excellence Financing in RDI project no. 2PFE/2021 and the Core Project BIORESGREEN, subproject BioClimpact, project no. 7N/03.01.2023, project code 23020401.

Institutional Review Board Statement

Not applicable.

Informed Consent Statement

Not applicable.

Data Availability Statement

Not applicable.

Conflicts of Interest

The authors declare no conflict of interest related to this article. The funders had no role in the design of the study, analyses, data interpretation, manuscript writing, or decision to publish the results.

References

  1. United Nations. The United Nations World Water Development Report 2021: Valuing Water; UNESCO: Paris, France, 2021; pp. 1–206. [Google Scholar]
  2. Okello, C.; Tomasello, B.; Greggio, N.; Wambiji, N.; Antonellini, M. Impact of Population Growth and Climate Change on the Freshwater Resources of Lamu Island, Kenya. Water 2015, 7, 1264–1290. [Google Scholar] [CrossRef]
  3. European Environment Agency, Official Site. Available online: https://www.eea.europa.eu/policy-documents/water-framework-directive-wfd-2000 (accessed on 22 March 2023).
  4. De Souza, M.; Koo-Oshima, S.; Kahil, T.; Wada, Y.; Qadir, M.; Jewitt, G.; Cudennec, C.; Uhlenbrook, S.; Zhang, L. Food and agriculture. In The United Nations World Water Development Report 2021: Valuing Water; UNESCO: Paris, France, 2021; pp. 67–78. [Google Scholar]
  5. Mitra, S.; Chakraborty, A.J.; Tareq, A.M.; Bin Emran, T.; Nainu, F.; Khusro, A.; Idris, A.M.; Khandaker, M.U.; Osman, H.; Alhumaydhi, F.A.; et al. Impact of heavy metals on the environment and human health: Novel therapeutic insights to counter the toxicity. J. King Saud Univ.-Sci. 2022, 34, 101865. [Google Scholar] [CrossRef]
  6. Jin, B.; Wang, J.; Lou, W.; Wang, L.; Xu, J.; Pan, Y.; Peng, J.; Liu, D. Pollution, ecological risk and source identification of heavy metals in sediments from the Huafei River in the eastern suburbs of Kaifeng, China. Int. J. Environ. Res. Public Health 2022, 19, 11259. [Google Scholar] [CrossRef]
  7. Kiliç, Z. Water pollution: Causes, negative effects and prevention methods. IZU J. Inst. Sci. Tech. 2021, 3, 129–132. [Google Scholar] [CrossRef]
  8. Haseena, M.; Malik, M.F.; Javed, A.; Arshad, S.; Asif, N.; Zulfiqar, S.; Hanif, J. Water pollution and human health. Environ. Risk Assess. Remediat. 2017, 1, 16–19. [Google Scholar] [CrossRef]
  9. Zhang, H.; Xia, Y.; Chang, Q.; Zhang, X.; Zhao, Y. Association between water source and chronic gastrointestinal diseases in Chinese: A cross-sectional and longitudinal study. Front. Public Health 2022, 10, 992462. [Google Scholar] [CrossRef]
  10. Panis, C.; Candiotto, L.Z.P.; Gaboardi, S.C.; Gurzenda, S.; Cruz, J.; Castro, M.; Lemos, B. Widespread pesticide contamination of drinking water and impact on cancer risk in Brazil. Environ. Int. 2022, 165, 107321. [Google Scholar] [CrossRef]
  11. Bondy, S.C.; Campbell, A. Water Quality and Brain Function. Int. J. Environ. Res. Public Health 2018, 15, 2. [Google Scholar] [CrossRef]
  12. Ozunu, A.; Ştefănescu, L.; Costan, C.; Miclean, M.; Modoi, C.; Vlad, S.N. Surface water pollution generated by mining activities. Case study: Arieş River middle catchment basin, Romania. Environ. Eng. Manag. J. 2009, 8, 809–815. [Google Scholar] [CrossRef]
  13. Friedel, M.J.; Tindall, J.A.; Sardan, D.; Fey, D.L.; Poputa, G.L. Reconnaissance study of water quality in the mining-affected Arieş River Basin, Romania. In Open-File Report; U. S. Geological Survey: Asheville, NC, USA, 2008; p. 40. [Google Scholar]
  14. Levei, E.; Senila, M.; Miclean, M.; Abraham, B.; Roman, C.; Stefanescu, L.; Moldovan, O.T. Influence of Roşia Poieni and Roşia Montană mining areas on the water quality of the Arieş River. Environ. Eng. Manag. J. 2011, 10, 23–29. [Google Scholar] [CrossRef]
  15. Morar, F.; Rus, D.; Petru-Dragos, M. Management of Surfaces Water Resources—Ecological Status. In Water Resources Management in Romania; Springer: Cham, Switzerland, 2019; p. 133. [Google Scholar]
  16. Butiuc-Keul, A.; Momeu, L.; Craciunas, C.; Dobrota, C.; Cuna, S.; Balas, G. Physico-chemical and biological studies on water from Arieş River (Romania). J. Environ. Manag. 2012, 95, S3–S8. [Google Scholar] [CrossRef] [PubMed]
  17. Moldovan, A.; Hoaghia, M.A.; Török, A.I.; Roman, M.; Mirea, I.C.; Barabas, R.; Micle, V.; Cadar, O. Spatial Variation of Water Chemistry in Arieş River Catchment, Western Romania. Appl. Sci. 2021, 11, 6592. [Google Scholar] [CrossRef]
  18. Corcheş, M.T. Study of the natural pollution of the Arieş River. J. Agroaliment. Process. Technol. 2011, 17, 330–334. [Google Scholar]
  19. Moldovan, A.; Török, A.I.; Kovacs, E.; Cadar, O.; Mirea, I.C.; Micle, V. Metal Contents and Pollution Indices Assessment of Surface Water, Soil, and Sediment from the Arieş River Basin Mining Area, Romania. Sustainability 2022, 14, 8024. [Google Scholar] [CrossRef]
  20. Miclean, M.; Lacrimioara, S.; Oana, C.; Roman, M.; Melinda, H.K. Determination of organochlorine pesticides in areas river water near anindustrial dump using SPE/HS-SPME/GC-ECD method. Agric. Sci. Pract. 2015, 93, 123–127. [Google Scholar]
  21. Levei, E.; Frentiu, T.; Ponta, M.; Tanaselia, C.; Borodi, G. Characterization and assessment of potential environmental risk of tailings stored in seven impoundments in the Arieş River basin, Western Romania. Chem. Cent. J. 2013, 7, 5. [Google Scholar] [CrossRef]
  22. Forray, F.L.; Hallbauer, D.K. A study of the pollution of the Arieş River (Romania) using capillary electrophoresis as analytical technique. Environ. Geol. 2000, 39, 1372–1384. [Google Scholar] [CrossRef]
  23. Keul, M.; Halmagyi, A. Die wirkung von Wasserproben des Arieș-Flusses (Rumanische Westgebirge) auf keimung und keimlingswachstum von winterweizen (Triticum aestivum L.). Stud. Cercet. Biol. 2011, 17, 13–24. [Google Scholar]
  24. Momeu, L.; Péterfi, L.S. Water quality evaluation of the drainage basin of the Aries River, using epiphytic diatoms as bioindicators. Contrib. Bot. 2007, 17, 57–65. [Google Scholar]
  25. SR EN ISO 6468:2000; Water quality. Determination of certain organochlorine insecticides, polychlorinated biphenyls and chlorobenzenes. Gaz chromatographic method after liquid-liquid extraction. ISO: Washington, DC, USA, 2000.
  26. Ammann, A.A. Inductively coupled plasma mass spectrometry (ICP MS): A versatile tool. J. Mass Spectrom. 2007, 42, 419–427. [Google Scholar] [CrossRef]
  27. ISO 8692; Water Quality—Fresh Water Algal Growth Inhibition Test with Unicellular Green Algae. ISO: London, UK, 2012.
  28. Fiskesjö, G. The Allium test as a standard in environmental monitoring. Hereditas 1985, 102, 99–112. [Google Scholar] [CrossRef] [PubMed]
  29. Larsen, E.; Christensen, L.P. Simple saponification method for the quantitative determination of carotenoids in green vegetables. J. Agric. Food Chem. 2005, 53, 6598–6602. [Google Scholar] [CrossRef] [PubMed]
  30. Britton, G.; Liaaen-Jensen, S.; Pfander, H. Carotenoids, Volume 1A: Isolation and Analysis; Birkhäuser Verlag: Basel, Switzerland, 1995; Volume 1, 328p. [Google Scholar]
  31. Heape, A.M.; Juguelin, H.; Boiron, F.; Cassagne, C. Improved one dimensional thin layer chromatographic technique for polar lipids. J. Chromatogr. 1985, 322, 391–395. [Google Scholar] [CrossRef] [PubMed]
  32. Buonasera, K.; Lambreva, M.; Rea, G.; Touloupakis, E.; Giardi, M.T. Technological applications of chlorophyll a fluorescence for the assessment of environmental contaminants. Anal. Bioanal. Chem. 2011, 401, 1139–1151. [Google Scholar] [CrossRef]
  33. Maxwell, K.; Johnson, G.N. Chlorophyll fluorescence—A practical guide. J. Experim. Bot. 2000, 51, 659–668. [Google Scholar] [CrossRef]
  34. Wellburn, A.R. The spectral determination of chlorophylls a and b, as well as total carotenoids, using various solvents with spectrophotometers of different resolution. J. Plant Physiol. 1994, 144, 307–313. [Google Scholar] [CrossRef]
  35. Kalaji, H.M.; Rackova, L.; Paganova, V.; Swoczyna, T.; Rusinowski, S.; Sitko, K. Can chlorophyll-a fluorescence parameters be used as bioindicators to distinguish between drought and salinity stress in Tilia cordata Mill.? Environ. Experim. Bot. 2018, 152, 149–157. [Google Scholar] [CrossRef]
  36. Ruban, A.V. Nonphotochemical chlorophyll fluorescence quenching: Mechanism and effectiveness in protecting plants from photodamage. Plant Physiol. 2016, 170, 1903–1916. [Google Scholar] [CrossRef]
  37. Lichtenthaler, H.K.; Buschmann, C.; Knapp, M. How to correctly determine the different chlorophyll fluorescence parameters and the chlorophyll fluorescence decrease ratio Rfd of leaves with the PAM fluorometer. Photosynthetica 2005, 43, 379–393. [Google Scholar] [CrossRef]
  38. Council Directive 75/440/EEC of 16 June 1975 concerning the quality required of surface water intended for the abstraction of drinking water in the Member States. Off. J. Law 1975, 194, 26–31.
  39. Quartacci, M.F.; Cosi, E.; Navari-Izzo, F. Lipids and NADPH-dependent superoxide production in plasma membrane vesicles from roots of wheat grown under copper deficiency or excess. J. Exp. Bot. 2001, 52, 77–84. [Google Scholar] [PubMed]
  40. Taiwo, A.M. A review of environmental and health effects of organochlorine pesticide residues in Africa. Chemosphere 2019, 220, 1126–1140. [Google Scholar] [CrossRef] [PubMed]
  41. Birghila, S.; Bratu, M.M.; Coatu, V.; Damir, N.-A. Levels, Sources and Risk Characterization of Organochlorine Pesticides in Beer Samples from Romania. Rev. Chim. 2020, 71, 364–370. [Google Scholar] [CrossRef]
  42. European parliament. Directive 2008/105/EC of the European Parliament and of the Council of 16 December 2008 on environmental quality standards in the field of water policy, amending and subsequently repealing Council Directives 82/176/EEC, 83/513/EEC, 84/156/EEC, 84/491/EEC, 86/280/EEC and amending Directive 2000/60/EC of the European Parliament and of the Council. Off. J. 2023, L 348, 84–97. [Google Scholar]
  43. Lushchak, V.I.; Matviishyn, T.M.; Husak, V.V.; Storey, J.M.; Storey, K.B. Pesticide toxicity: A mechanistic approach. EXCLI J. 2018, 17, 1101–1136. [Google Scholar] [PubMed]
  44. Ferencz, L.; Balog, A.A. Pesticide survey in soil, water and foodstuffs from Central Romania. Carpathian J. Earth Environ. Sci. 2010, 5, 111–118. [Google Scholar]
  45. Ene, A.; Bogdevich, O.; Sion, A. Levels and distribution of organochlorine pesticides (OCPs) and polycyclic aromatic hydrocarbons (PAHs) in topsoils from SE Romania. Sci. Total Environ. 2012, 439, 76–86. [Google Scholar] [CrossRef]
  46. Chiţescu, C.L.; Ene, A.; Geana, E.-I.; Vasile, A.M.; Ciucure, C.T. Emerging and persistent contaminants in the aquatic ecosystems of the lower Danube Basin and North West Black Sea region—A Review. Appl. Sci. 2021, 11, 9721. [Google Scholar] [CrossRef]
  47. Soleimani, E. Benzene, toluene, ethylbenzene, and xylene: Current analytical techniques and approaches for biological monitoring. Rev. Anal. Chem. 2020, 39, 168–187. [Google Scholar] [CrossRef]
  48. WHO. Guidelines for Drinking-Water Quality, 2nd ed.; Health Criteria and Other Supporting Information; World Health Organization: Geneva, Switzerland, 1996. [Google Scholar]
  49. Billersjö, S. In-situ remediation of benzene-contaminated groundwater—A bench-scale study. TRITA-LWR Degree Proj. 2013, 13, 37. [Google Scholar]
  50. International Agency for Research on Cancer. Some Industrial Chemicals and Dyestuffs; IARC Monographs on the Evaluation of the Carcinogenic Risk of Chemicals to Humans; IARC: Lyon, France, 1982; Volume 29, pp. 93–148. [Google Scholar]
  51. Wu, B.; Tan, X.; Teo, W.K.; Li, K. Removal of benzene/toluene from water by vacuum membrane distillation in a PVDF hollow fiber membrane module. Sep. Sci. Technol. 2005, 40, 2679–2695. [Google Scholar] [CrossRef]
  52. Yusiasih, R.; Marvalosha, R.; Suci, S.D.S.; Yuliani, E.; Pitoi, M.M. Low volume liquid-liquid extraction for the determination of benzene, toluene, and xylene in water by GC-FID and HPLC-UV. IOP Conf. Ser. Earth Environ. Sci. 2018, 277, 012019. [Google Scholar] [CrossRef]
  53. Ukoha, P.O.; Ekere, N.R.; Timothy, C.L.; Agbazue, V.E. Benzene, Toluene, ethylybenzene and xylenes (Btex) contamination of soils and water bodies from alkyd resin and lubricants industrial production plant. J. Chem. Soc. Niger. 2015, 40, 51–55. [Google Scholar]
  54. WHO. A Global Overview of National Regulations and Standards for Drinking-Water Quality, 2nd ed.; World Health Organization: Geneva, Switzerland, 2021. [Google Scholar]
  55. European Union (EU). Directive (EU) 2020/2184 of the European Parliament and of the Council of 16 December 2020 on the quality of water intended for human consumption. Off. J. Eur. Union 2020, 435, 1–62. [Google Scholar]
  56. Grmasha, R.A.; Abdulameer, M.H.; Stenger-Kovács, C.; Al-Sareji, O.J.; Al-Gazali, Z.; Al-Juboori, R.A.; Meiczinger, M.; Hashim, K.S. Polycyclic aromatic hydrocarbons in the surface water and sediment along Euphrates River system: Occurrence, sources, ecological and health risk assessment. Mar. Pollut. Bull. 2023, 187, 114568. [Google Scholar] [CrossRef]
  57. Beldean-Galea, M.S.; Mihăiescu, R.; Arghiuş, V.; Croitoru, A.; Horvath, C.; Coman, V. Occurrence and sources of polycyclic aromatic hydrocarbons in the Tisza River and its Romanian tributaries. Water Air Soil Pollut. 2016, 227, 377. [Google Scholar] [CrossRef]
  58. Ciucure, C.T.; Geana, E.I.; Chitescu, C.L.; Badea, S.L.; Ionete, R.E. Distribution, sources and ecological risk assessment of polycyclic aromatic hydrocarbons in waters and sediments from Olt River dam reservoirs in Romania. Chemosphere 2023, 311, 137024. [Google Scholar] [CrossRef]
  59. Yu, H.; Liu, Y.; Han, C.; Fang, H.; Weng, J.; Shu, X.; Pan, Y.; Ma, L. Polyciclic hydrocarbons in surface waters from the seven main river basins of China: Spatial distribution, source apportionment, and potential risk assessment. Sci. Total Environ. 2021, 752, 141764. [Google Scholar] [CrossRef]
  60. Apata, A.; Ololade, I.A.; Oladoja, N.A.; Alabi, B.A.; Ololade, O.O. Polycyclic aromatic hydrocarbons in selected rivers in southwestern Nigeria: Seasonal distribution, source apportionment and potential risk assessment. Reg. Stud. Mar. Sci. 2022, 52, 102318. [Google Scholar] [CrossRef]
  61. Wang, Y.Z.; Zhang, S.L.; Cui, W.Y.; Meng, X.Z.; Tang, X.Q. Polycyclic aromatic hydrocarbons and organochlorine pesticides in surface water from the Yongding River basin, China: Seasonal distribution, source apportionment, and potential risk assessment. Sci. Total. Environ. 2018, 618, 419–429. [Google Scholar] [CrossRef]
  62. Senila, M.; Levei, E.; Miclean, M.; Tanaselia, C.; David, L.; Cordos, E. Study regarding the water quality in Arieş catchment. Chem. Bull. Politeh. Univ. Timişoara 2007, 52, 169–172. [Google Scholar]
  63. Marin, C.; Tudorache, A.; Moldovan, O.A.; Povara, I.; Rajka, G. Assessing the contents of arsenic and of some heavy metals in surface flows and in the hyporheic zone of the Arieş stream catchment area, Romania. Carpathian J. Earth Environ. Sci. 2010, 5, 13–24. [Google Scholar]
  64. Bird, G.; Brewer, P.A.; Macklin, M.G.; Serban, M.; Balteanu, D.; Driga, B. Heavy metal contamination in the Arieş River catchment, western Romania: Implications for development of the Roşia Montană gold deposit. J. Geochem. Explor. 2005, 86, 26–48. [Google Scholar] [CrossRef]
  65. Bodoczi, A.; Carpa, R. The quantitative variation of some ecophysiological group of bacteria from Arieş River sediments affected by pollution. Carpathian J. Earth Environ. Sci. 2010, 5, 145–152. [Google Scholar]
  66. Senila, M.; Levei, E.A.; Senila, L.R.; Roman, M. Preliminary investigation concerning metals bioavailability in waters of Arieş River catchment by using the diffusive gradients in thin films technique. J. Chem. 2015, 2015, 762121. [Google Scholar] [CrossRef]
  67. Abrham, F.; Gholap, A.V. Analysis of heavy metal concentration in some vegetables using atomic absorption spectroscopy. Pollution 2021, 7, 205–216. [Google Scholar]
  68. Guedes, A.C.; Amaro, H.M.; Pereira, R.D.; Maalcata, F.X. Effects of temperature and pH on growth and antioxidant content of the microalga Scenedesmus obliquus. Biotechnol. Prog. 2011, 27, 1218–1224. [Google Scholar] [CrossRef]
  69. Bergtold, M.; Dohmen, G.P. Biomass or growth rate endpoint for algae and aquatic plants: Relevance for the risk assessment of herbicides. Integr. Environ. Assess. Manag. 2011, 7, 237–247. [Google Scholar] [CrossRef]
  70. Janssen, C.R.; Heijerick, D.G. Algal toxicity tests for environmental risk assessments of metals. Rev. Environ. Contam. Toxicol. 2003, 178, 23–52. [Google Scholar]
  71. Barbério, A.; Barros, L.; Voltolini, J.C.; Mello, M.L.S. Evaluation of the cytotoxic and genotoxic potential of water from the River Paraíba do Sul, in Brazil, with the Allium cepa L. test. Braz. J. Biol. 2009, 69, 837–842. [Google Scholar] [CrossRef]
  72. Sacramento, E.B.; de Almeida Azevedo, C.; Abreu, S.T.; Borba, H.R.; Moreira de Lima, V. Evaluation of the cytotoxic and genotoxic potential of waters of the Paraíba do Sul River Basin—RJ through the Allium cepa test system. Rev. Ambient. Água 2020, 15, e2521. [Google Scholar] [CrossRef]
  73. Staykova, T.; Ivanova, E.; Velcheva, I. Cytogenetic effect of heavy-metal and cyanide in contaminated waters from the region of southwest Bulgaria. J. Cell Mol. Biol. 2005, 4, 41–46. [Google Scholar]
  74. Upchurch, R.G. Fatty acid unsaturation, mobilization, and regulation in the response of plants to stress. Biotechnol. Lett. 2008, 30, 967–977. [Google Scholar] [CrossRef]
  75. Guedard, M.L.; Faure, O.; Besseoule, J.J. Early changes in the fatty acid composition of photosynthetic membrane lipids from Populus nigra grown on a metallurgical landfill. Chemosphere 2012, 88, 693–698. [Google Scholar] [CrossRef]
  76. Mourato, M.P.; Moreira, I.N.; Leitão, I.; Pinto, F.R.; Sales, J.R.; Martins, L.L. Effect of heavy metals in plants of the genus Brassica. Int. J. Mol. Sci. 2015, 16, 17975–17998. [Google Scholar] [CrossRef]
  77. Nouairi, I.; Ghnaya, T.; Youssef, N.B.; Zarrouk, M.; Ghorbel, M.H. Changes in content and fatty acid profiles of total lipids of two halophytes: Sesuvium portulacastrum and Mesembryanthemum crystallinum under cadmium stress. J. Plant Physiol. 2006, 163, 1198–1202. [Google Scholar] [CrossRef]
  78. Kabala, K.; Janicka-Russak, M.; Burzynski, M.; Klobus, G. Comparison of heavy metal effect on the proton pumps of plasma membrane and tonoplast in cucumber root cells. J. Plant Physiol. 2008, 165, 278–288. [Google Scholar] [CrossRef]
  79. Zemanová, V.; Pavlík, M.; Pavlíková, D.; Kyjaková, P. Changes in the contents of amino acids and the profile of fatty acids in response to cadmium contamination in spinach. Plant Soil Environ. 2015, 61, 285–290. [Google Scholar] [CrossRef]
  80. Ghasemzadeh, N.; Iranbakhsh, A.; Oraghi-Ardebili, Z.; Saadatmand, S.; Jahanbakhsh-Godehkahriz, S. Cold plasma can alleviate cadmium stress by optimizing growth and yield of wheat (Triticum aestivum L.) through changes in physio-biochemical properties and fatty acid profile. Environ. Sci. Pollut. Res. 2022, 29, 35897–35907. [Google Scholar] [CrossRef]
  81. Rozentsvet, O.A.; Nesterov, V.N.; Sinyutina, N.F. The effect of copper ions on the lipid composition of subcellular membranes in Hydrilla verticillata. Chemosphere 2012, 89, 108–113. [Google Scholar] [CrossRef]
  82. Rao, L.; Li, S.; Cui, X. Leaf morphology and chlorophyll fluorescence characteristics of mulberry seedlings under waterlogging stress. Sci. Rep. 2021, 11, 13379. [Google Scholar] [CrossRef]
  83. Sherin, G.; Aswathi, K.P.R.; Puthur, J.T. Photosynthetic functions in plants subjected to stresses are positively influenced by priming. Plant Stress 2022, 4, 100079. [Google Scholar] [CrossRef]
  84. Zou, J.; Yu, K.; Zhang, Z.; Jiang, W.; Liu, D. Antioxidant response system and chlorophyll fluorescence in chromium (VI)-treated Zea mays L. seedlings. Acta Biol. Cracov. Ser. Bot. 2009, 52, 23–33. [Google Scholar]
  85. Kumar, K.S.; Dahms, H.U.; Lee, J.S.; Kim, H.C.; Lee, W.C.; Shin, K.H. Algal photosynthetic responses to toxic metals and herbicides assessed by chlorophyll a fluorescence. Ecotox. Environ. Saf. 2014, 104, 51–71. [Google Scholar] [CrossRef]
  86. Fodorpataki, L.; Plugaru, S.R.C.; Molnar, K.; Marossy, P.; Tompa, B.; Barna, S. The use of green microalgal cultures for bioremediation of freshwater environments polluted with chromium, nickel and cadmium. In Bioremediation: Advances in Research and Applications; Kuddus, M., Ed.; Nova Science Publ.: New York, NY, USA, 2018; pp. 71–112. [Google Scholar]
  87. Prasad, M.N.V.; Malec, P.; Waloszek, A.; Bojko, M.; Strzałka, K. Physiological responses of Lemna trisulca L. (duckweed) to cadmium and copper bioaccumulation. Plant Sci. 2001, 161, 881–889. [Google Scholar] [CrossRef]
  88. MacFarlane, G.R.; Burchett, M.D. Toxicity, growth and accumulation relationships of copper, lead and zinc in the grey mangrove Avicennia marina (Forsk.) Vierh. Mar. Environ. Res. 2002, 54, 65–84. [Google Scholar] [CrossRef]
  89. Costa, M.B.; Tavares, F.V.; Martinez, C.B.; Colares, I.G.; de Martins, C.M.G. Accumulation and effects of copper on aquatic macrophytes Potamogeton pectinatus L.: Potential application to environmental monitoring and phytoremediation. Ecotoxicol. Environ. Saf. 2018, 155, 117–124. [Google Scholar] [CrossRef]
  90. Dogan, M.; Karatas, M.; Aasim, M. Cadmium and lead bioaccumulation potentials of an aquatic macrophyte Ceratophyllum demersum L.: A laboratory study. Ecotoxicol. Environ. Saf. 2018, 148, 431–440. [Google Scholar] [CrossRef]
  91. Mondal, N.K.; Nayek, P. Hexavalent chromium accumulation kinetics and physiological responses exhibited by Eichhornia sp. and Pistia sp. Int. J. Environ. Sci. Technol. 2020, 17, 1397–1410. [Google Scholar] [CrossRef]
  92. Xin, J.; Ma, S.; Li, Y.; Zhao, C.; Tian, R. Pontederia cordata, an ornamental aquatic macrophyte with great potential in phytoremediation of heavy-metal-contaminated wetlands. Ecotoxicol. Environ. Saf. 2020, 203, 111024. [Google Scholar] [CrossRef]
Figure 1. Pigment content in aquatic plants collected from the course of the Arieş River: (a) total carotenoids; (b) Chlorophyll a and Chlorophyll b. The 11 samples represent the collection sites: (1) Câmpeni upstream, (2) Câmpeni downstream, (3) Baia de Arieş upstream, (4) Baia de Arieş downstream, (5) Sălciua upstream, (6) Sălciua downstream, (7) Turda upstream, (8) Turda downstream, (9) Câmpia Turzii upstream, (10) Câmpia Turzii downstream, and (11) Abrud inflow. The data represent the mean values ± SD of three replicates.
Toxics 11 00817 g001
Figure 2. Influence of water samples from the Arieş River on the maximal quantum yield of photosystem II (PSII), expressed as the Fv/Fo chlorophyll fluorescence ratio, in leaves of bean plants. Vertical bars represent ± SD from means (n = 5); different letters indicate significant differences at the p < 0.05 level.
Toxics 11 00817 g002
Figure 3. Influence of water samples from the Arieş River on the non-photochemical quenching of chlorophyll fluorescence in leaves of bean plants. Vertical bars represent ± SD from means (n = 5), different letters indicate significant differences at the p < 0.05 level.
Toxics 11 00817 g003
Figure 4. Influence of water samples from the Arieş River on the vitality index of the photosynthetic apparatus, expressed as relative fluorescence decrease levels, in leaves of bean plants. Vertical bars represent ±SE from mean values (n = 5); different letters indicate significant differences at the p < 0.05 level.
Toxics 11 00817 g004
Table 2. Organochlorine pesticide concentrations in water (μg/L) and plant (μg/kg DW)samples collected from the Arieş basin.
α-HCHβ-HCHγ-HCHδ-HCHOp-DDTpp-DDTop-DDEpp-DDEAldrinDieldrinEndosulfan Sulfate
Câmpeni upstreamwater0.002ND0.003NDNDNDNDNDNDNDND
plants10.111.126.450.860.75ND2.881.56NDNDND
Câmpeni downstreamwater0.003ND0.005NDNDNDNDNDNDND0.006
plants1.38ND1.47ND3.783.104.631.78NDNDND
Baia de Arieș upstreamwater0.004ND0.0050.002NDNDNDNDNDND0.014
plants1.84ND1.011.180.762.481.82NDNDNDND
Baia de Arieș downstreamwater0.002ND0.002NDNDNDNDNDNDND0.006
plants13.214.751.872.113.43ND3.630.98NDNDND
Sălciua upstreamwater0.005ND0.008NDNDNDNDNDNDNDND
plants4.05ND4.111.82NDND1.67NDNDNDND
Sălciua downstreamwater0.003ND0.002NDNDNDNDNDNDNDND
plants15.873.5050.330.493.771.461.040.55NDND1.80
Câmpia Turzii upstreamwater0.0240.0050.0050.0032NDNDNDNDNDND0.010
plants0.67ND0.940.520.361.991.35NDNDND1.00
Câmpia Turzii downstreamwater0.0410.0100.0020.0050.0060.0060.003NDNDND0.016
plants3.521.500.900.561.410.601.770.53NDND1.43
Turda upstreamwater0.004ND0.0020.001NDNDNDNDNDNDND
plants1.14ND0.50NDNDND0.31NDNDNDND
Turda downstreamwater0.0210.0040.0040.003NDNDNDNDNDND0.007
plants4.182.440.72ND0.970.712.060.20NDND0.49
Abrud flowwater0.0010.0030.0030.002NDNDNDNDNDNDND
plants0.820.972.24NDNDND2.940.58NDNDND
DW—dry weight, ND—not detected. Limit of detection: 0.0001 μg/L.
Table 3. Monocyclic aromatic hydrocarbon concentrations in water (mg/L ± SD) * and aquatic plant (mg/kg DW ± SD) samples collected from the Arieş basin.
BenzeneTolueneXyleneEthylbenzene
Câmpeni upstreamwater1.58 ± 0.090.29 ± 0.04NDND
plants0.59 ± 0.130.76 ± 0.08NDND
Câmpeni downstreamwater1.12 ± 0.360.35 ± 0.110.41 ± 0.07ND
plants1.48 ± 0.081.14 ± 0.05NDND
Baia de Arieș upstreamwater2.60 ± 0.170.42 ± 0.08NDND
plants2.01 ± 0.13NDNDND
Baia de Arieș downstreamwater1.84 ± 0.090.42 ± 0.070.28 ± 0.11ND
plantsNDNDNDND
Sălciua upstreamwater3.28 ± 0.110.27 ± 0.070.45 ± 0.05ND
plantsNDNDNDND
Sălciua downstreamwater0.07 ± 0.040.23 ± 0.080.42 ± 0.09ND
plantsNDNDNDND
Turda upstreamwaterND0.48 ± 0.09NDND
plantsNDNDNDND
Turda downstreamwater0.75 ± 0.060.24 ± 0.04NDND
plants6.98 ± 0.050.71 ± 0.073.02 ± 0.11ND
Câmpia Turzii upstreamwater0.23 ± 0.050.21 ± 0.080.39 ± 0.07ND
plantsNDNDNDND
Câmpia Turzii downstreamwaterND0.19 ± 0.050.50 ± 0.09ND
plantsNDNDNDND
Abrud inflowwater8.01 ± 0.100.25 ± 0.050.51 ± 0.05ND
plantsNDNDNDND
* Data represent the mean values ± standard deviation (SD) of three replicates; DW—dry weight; ND—not detected. Limit of detection: 0.002 mg/L.
Table 4. Polycyclic aromatic hydrocarbon concentrations in water (μg/L ± SD) * and aquatic plant (mg/kg ± SD) samples collected from the Arieş basin.
NapAcyFloPh + AntPyrBbF + BkFBaPBaA + Chr
Câmpeni upstreamwaterNDNDNDNDNDNDND30.3 ± 0.33
plantsNDND0.34 ± 0.04NDND3.6 ± 0.320.81 ± 0.030.60 ± 0.08
Câmpeni downstreamwaterNDNDNDNDNDNDNDND
plantsNDNDNDND0.15 ± 0.0430.6 ± 0.16ND0.33 ± 0.06
Baia de Arieș upstreamwaterNDNDNDNDNDNDNDND
plantsNDNDND0.09 ± 0.02ND43.3 ± 0.57ND0.75 ± 0.05
Baia de Arieș downstreamwaterNDNDNDNDNDNDNDND
plantsNDND0.30 ± 0.01NDND3.07 ± 0.05ND2.98 ± 0.09
Sălciua upstreamwaterNDNDND2.2 ± 0.03NDNDNDND
plantsNDND0.28 ± 0.07NDNDNDNDND
Sălciua downstreamwaterNDNDNDNDNDNDNDND
plantsNDND0.61 ± 0.072.25 ± 0.08ND53.0 ± 3.27ND1.90 ± 0.24
Turda upstreamwaterNDNDNDNDNDNDNDND
plantsNDND0.29 ± 0.08NDNDNDNDND
Turda downstreamwaterNDNDNDNDNDNDNDND
plantsNDNDNDNDNDNDNDND
Câmpia Turzii upstreamwaterNDNDNDNDNDNDNDND
plantsNDND0.46 ± 0.05NDNDNDND0.74 ± 0.04
Câmpia Turzii downstreamwaterNDNDNDNDNDNDNDND
plantsNDNDNDNDNDNDND1.11 ± 0.06
Abrud inflowwaterNDNDNDNDNDNDND2.0 ± 0.41
plantsNDND0.47 ± 0.07NDND21.1 ± 0.04NDND
* Data represent the mean values ± standard deviation (SD) of three replicates; ND—not detected; limit of detection: 0.001 mg/L; naphthalene (Nap), acenaphthylene (Acy), fluorene (Flo), phenanthrene (Ph) + anthracene (Ant), pyrene (Pyr), benzo(b)fluoranthene BbF + benzo(k)fluoranthene BkF, benzo(a)pyrene BaP, benz(a)anthracene BaA + chrysene (Chr).
Table 5. Trace and heavy metal concentrations in water (μg/L) and aquatic plant (mg/kg DW) * samples collected from the Arieş basin.
PbCdCuMnCrNiZnFe
Câmpeni upstreamwaterNDNDND0.078NDND0.0050.432
plants0.1890.0070.4219.4080.1320.8551.627135.23
Câmpeni downstreamwaterNDND0.0110.288NDND0.0120.962
plants0.2010.0080.39913.3390.1251.0561.204127.15
Baia de Arieș upstreamwaterNDND0.0610.491NDND0.1482.182
plants0.3720.05810.55938.840.1091.3586.502198.65
Baia de Arieș downstreamwaterNDND0.0440.313NDND0.0532.442
plants0.7940.13425.50989.380.1233.05718.585286.14
Sălciua upstreamwaterNDND0.0460.499NDND0.070.962
plants0.4190.0538.03734.0340.1670.8566.432193.26
Sălciua downstreamwaterNDND0.1210.818NDND0.3955.462
plants0.1240.0150.7562.6570.0703.2061.45854.89
Turda upstreamwaterNDND0.0180.07NDND0.0150.259
plants0.3660.0041.23012.0160.2093.3172.314229.52
Turda downstreamwaterNDND0.0160.045NDND0.0070.18
plants0.4190.0061.74610.880.2513.3032.455303.83
Câmpia Turzii upstreamwaterNDND0.0130.055NDND0.0090.122
plants0.5270.0071.89519.4580.3653.2833.427380.43
Câmpia Turzii downstreamwaterNDND0.0110.034NDNDND0.071
plants0.6500.0112.29825.4380.3612.6734.742384.82
Abrud inflowwaterND0.0080.0475.136NDND0.2412.129
plants0.4000.0441.08110.6960.0550.6915.398156.69
75/440/EEC target value; imperative value (mg/L)0; 0.050.001; 0.0050.02; 0.05 0.5; 3.0
* DW—dry weight; ND—not detected.
Table 6. Growth rate of Scendesmus opoliensis in water (%) from the Arieș River.
Time DurationControl255075100r *
Baia de Arieș downstream
24 h2.40.92.050.60.35−0.72
48 h2.951.12.81.551.1−0.69
72 h3.81.93.10.91.5−0.75
Sălciua downstream
24 h2.40.850.450.40.9−0.78
48 h2.951.150.450.550.7−0.85
72 h3.81.350.90.21.4−0.77
Turda upstream
24 h2.41.250.950.40.65−0.89
48 h2.951.31.150.50.65−0.88
72 h3.81.81.350.550.85−0.91
Câmpia Turzii downstream
24 h2.41.251.150.750.2−0.90
48 h2.951.851.40.950.45−0.91
72 h3.82.251.551.050.6−0.91
Abrud inflow
24 h2.40.70.30.10.4−0.79
48 h2.951.60.90.40.6−0.78
72 h3.82.01.80.91.2−0.77
* Correlation index between the growth medium concentration and the growth rate of the algal cultures.
Table 7. Inhibition (%) of Scendesmus opoliensis-culture growth rate in water (%) based on samples from the Arieș River.
255075100ErC50 > *
Baia de Arieș downstream56.6728.2174.8064.7322.05
Sălciua downstream49.7057.8382.4063.8543.15
Turda upstream11.9136.1761.7068.0860.70
Câmpia Turzii downstream34.5152.5866.1276.7747.50
Abrud inflow 46.6055.0071.6061.6045.45
* The acute endpoint = concentration of chemicals that reduces the growth rate of an algal population by 50% in 72 h.
Table 8. The effects of water from the Arieş River on the mitotic index, frequency of mitotic divisions, chromosomal aberrations, and abnormal mitosis (% ± SD) * in onion-root meristematic cells.
Mitotic Index ProphaseMetaphaseAnaphaseTelophaseChromosomal AberrationsAbnormal Mitosis
Control10.8 ± 1.337.4 ± 9.518.1 ± 4.812.2 ± 5.032.0 ± 7.40.1 ± 0.50.0 ± 0.0
Câmpeni upstream10.3 ± 1.538.3 ± 7.019.6 ± 4.613.4 ± 3.127.9 ± 5.80.8 ± 1.40.0 ± 0.1
Câmpeni downstream11.7 ± 2.444.3 ± 4.616.6 ± 3.111.4 ± 3.127.0 ± 5.20.6 ± 0.90.0 ± 0.1
Baia de Arieş upstream10.6 ± 2.141.7 ± 5.716.3 ± 3.213.4 ± 4.127.8 ± 4.00.8 ± 1.10.0 ± 0.1
Baia de Arieş downstream9.6 ± 1.144.0 ± 5.518.7 ± 5.310.6 ± 1.825.7 ± 7.50.9 ± 1.00.0 ± 0.1
Sălciua upstream10.3 ± 2.440.9 ± 4.919.0 ± 3.410.6 ± 0.628.6 ± 5.30.9 ± 1.70.1 ± 0.0
Sălciua downstream9.7 ± 1.040.1 ± 6.418.1 ± 4.711.7 ± 3.529.7 ± 5.70.4 ± 0.90.0 ± 0.0
Turda upstream11.6 ± 1.544.3 ± 5.115.8 ± 4.112.2 ± 3.736.4 ± 3.71.2 ± 1.70.1 ± 0.1
Turda downstream10.0 ± 1.345.0 ± 6.516.2 ± 3.613.2 ± 2.924.7 ± 5.30.9 ± 1.20.0 ± 0.1
Câmpia Turzii upstream11.0 ± 1.340.3 ± 5.018.9 ± 3.812.6 ± 4.027.7 ± 4.70.4 ± 0.70.0 ± 0.0
Câmpia Turzii downstream10.3 ± 1.737.9 ± 9.015.2 ± 3.712.9 ± 5.032.0 ± 9.21.8 ± 1.30.1 ± 0.1
Abrud inflow11.2 ± 1.441.3 ± 4.818.0 ± 4.112.2 ± 4.325.9 ± 3.42.5 ± 1.90.2 ± 0.2
* Data represent mean values (%) ± standard deviation (SD).
Table 9. Individual carotenoid content (μg/g ± SD) in aquatic plant samples from the Arieş River.
TotalNeoxanthinViolaxanthinAnteraxanthinLuteinZeaxanthinβ-Carotene
Câmpeni upstream205.50 ± 12.503.29 ± 0.300.82 ± 0.170.62 ± 0.09117.14 ± 5.820.41 ± 0.0884.67 ± 3.91
Câmpeni downstream195.63 ± 12.5510.17 ± 0.8110.96 ± 0.634.11 ± 0.3694.30 ± 4.181.76 ± 0.1462.99 ± 4.23
Baia de Arieș upstream150.50 ± 5.509.48 ± 0.416.77 ± 0.452.71 ± 0.1869.08 ± 5.110.15 ± 0.0661.86 ± 3.45
Baia de Arieș downstream206.33 ± 7.515.57 ± 0.345.36 ± 0.222.68 ± 0.19130.40 ± 8.30ND56.12 ± 3.11
Sălciua upstream160.77 ± 10.7510.61 ± 0.808.68 ± 0.565.14 ± 0.3480.87 ± 4.230.80 ± 0.0951.28 ± 3.54
Sălciua downstream110.23 ± 8.753.42 ± 0.333.75 ± 0.410.22 ± 0.0866.69 ± 5.140.44 ± 0.1033.18 ± 1.44
Turda upstream154.20 ± 7.523.70 ± 0.314.47 ± 0.303.55 ± 0.2982.65 ± 3.870.46 ± 0.1158.44 ± 2.87
Turda downstream141.97 ± 6.018.38 ± 0.559.23 ± 0.422.98 ± 0.1874.39 ± 4.25ND46.14 ± 1.89
Câmpia Turzii upstream113.97 ± 8.003.53 ± 0.402.17 ± 0.330.91 ± 0.1668.72 ± 5.560.57 ± 0.1140.12 ± 2.18
Câmpia Turzii downstream155.37 ± 5.044.51 ± 0.294.35 ± 0.310.62 ± 0.1094.93 ± 3.661.24 ± 0.0847.39 ± 2.23
Abrud inflow210.80 ± 5.017.38 ± 0.484.43 ± 0.393.16 ± 0.21108.35 ± 7.950.21 ± 0.0782.00 ± 4.47
Data represent the mean values ± standard deviation (SD) of three replicates; ND—not detected.
Table 10. Fatty acid composition (% of total fatty acids) of phospholipids in aquatic plant samples from the Arieş River.
Palmitic
Acid
C16:0
Palmitoleic
Acid
C16:1 (n-7)
Stearic Acid
C18:0
Oleic Acid
C18:1 (n-9)
Linoleic Acid
C18:2 (n-6)
Linolenic Acid
C18:3 (n-3)
SFA
*
UFA **DBI
***
Câmpeni upstream37.01 ± 0.510.81 ± 0.076.73 ± 0.287.05 ± 0.2716.31 ± 0.4432.09 ± 0.5243.74 56.263.13
Câmpeni downstream42.94 ± 0.732.3 ± 0.114.26 ± 0.174.11 ± 0.2217.17 ± 0.4228.89 ± 0.2447.20 52.472.70
Baia de Arieș upstream33.27 ± 0.384.68 ± 0.1915.66 ±0.503.75 ± 0.2018.66 ± 0.3423.71 ± 0.3548.93 50.802.39
Baia de Arieș downstream26.98 ± 0.301.21 ± 0.0816.75 ±0.424.14 ± 0.2616.02 ± 0.3534.83 ± 0.4743.73 56.203.24
Sălciua upstream48.74 ± 0.752.49 ± 0.135.83 ± 0.155.93 ± 0.2412.52 ± 0.4024.34 ± 0.3154.57 45.281.95
Sălciua downstream28.71 ± 0.314.04 ± 0.258.85 ± 0.289.3 ± 0.3820.88 ± 0.3528.02 ± 0.3534.54 65.263.71
Turda upstream37.55 ± 0.403.71 ± 0.247.63 ± 0.245.65 ± 0.2619.89 ± 0.4025.40 ± 0.3145.18 54.642.77
Turda downstream35.14 ± 0.475.93 ± 0.2817.51 ±0.494.77 ± 0.2213.65 ± 0.3122.60 ± 0.3552.65 46.952.01
Câmpia Turzii upstream30.62 ± 0.333.41 ± 0.119.12 ± 0.336.64 ± 0.3021.04 ± 0.4128.87 ± 0.3639.74 59.963.49
Câmpia Turzii downstream36.05 ± 0.350.28 ± 0.045.83 ± 0.262.34 ± 0.1521.17 ± 0.3334.24 ± 0.4441.88 58.033.53
Abrud inflow27.77 ± 0.290.94 ± 0.0716.96 ±0.343.21 ± 0.1215.77 ± 0.3335.06 ± 0.4144.73 54.983.15
Data represent the mean values ± standard deviation (SD) of three replicates. * SFA = Σ % SFA (Saturated Fatty Acids); ** NFA = Σ% UFA (Unsaturated Fatty Acids); *** DBI = Double Bond Index (DBI = [(1×% monoenoic FA) + (2×% dienoic FA + 3×% trienoic FA]/Σ% SFA, [39]).
Table 11. Fatty acid composition (% of total fatty acids) of glycolipids in aquatic plant samples from the Arieş River.
Palmitic
Acid
C16:0
Palmitoleic
Acid
C16:1 (n-7)
Stearic Acid
C18:0
Oleic Acid
C18:1 (n-9)
Linoleic Acid
C18:2 (n-6)
Linolenic Acid
C18:3 (n-3)
SFA *UFA **DBI ***
Câmpeni upstream24.76 ± 0.322.01 ± 0.1011.45 ± 0.411.53 ± 0.105.41 ± 0.2754.53 ± 1.0536.2163.484.91
Câmpeni downstream26.01 ± 0.330.43 ± 0.071.83 ± 0.091.62 ± 0.1122.05 ± 0.3148.03 ± 1.0227.8472.136.83
Baia de Arieș upstream27.14 ± 0.290.52 ± 0.066.04 ± 0.203.62 ± 0.2212.41 ± 0.2850.12 ± 1.1233.1866.675.40
Baia de Arieș downstream22.85 ± 0.323.09 ± 0.198.80 ± 0.332.90 ± 0.148.00 ± 0.2653.64 ± 1.0831.6567.635.78
Sălciua upstream32.53 ± 0.380.40 ± 0.082.49 ± 0.178.77 ± 0.2912.20 ± 0.2243.56 ± 0.8735.0264.934.69
Sălciua downstream29.12 ± 0.330.42 ± 0.062.29 ± 0.172.55 ± 0.1616.28 ± 0.2948.29 ± 0.7531.4167.545.74
Turda upstream28.62 ± 0.310.44 ± 0.052.66 ± 0.143.24 ± 0.2518.03 ± 0.3546.78 ± 1.1131.2868.495.76
Turda downstream30.49 ± 0.360.54 ± 0.052.77 ± 0.158.95 ± 0.2812.4 ± 0.2144.82 ± 1.0533.2666.715.07
Câmpia Turzii upstream28.32 ± 0.340.45 ± 0.052.38 ± 0.183.75 ± 0.2017.11 ± 0.3047.66 ± 0.6930.7068.975.91
Câmpia Turzii downstream20.26 ± 0.280.60 ± 0.083.88 ± 0.131.55 ± 0.117.67 ± 0.3165.89 ± 1.2124.1475.718.91
Abrud inflow22.95 ± 0.302.42 ± 0.1412.57 ± 0.361.69 ± 0.095.12 ± 0.2955.05 ± 0.9935.5264.285.05
Data represent the mean values ± standard deviation (SD) of three replicates. * SFA = Σ% SFA (Saturated Fatty Acids); ** NFA = Σ% UFA (Unsaturated Fatty Acids); *** DBI = Double Bond Index (DBI = [(1×% monoenoic FA) + (2×% dienoic FA + 3×% trienoic FA]/Σ% SFA), [39]).
Table 12. Induced chlorophyll fluorescence parameters (means ± SE) * in leaves of bean plants treated with water samples collected from the Arieș River.
FoFmFv/FmΦ
Control254 ± 1 d1363 ± 2.68 f0.831 ± 0.014 a0.763 ± 0.005 a
Câmpeni upstream242 ± 3 e1425.6 ± 7.81 d0.828 ± 0.017 a0.765 ± 0.008 a
Câmpeni downstream276.6 ± 3.5 c1546.6 ± 4.59 c0.819 ± 0.026 a0.769 ± 0.007 a
Baia de Arieș upstream307 ± 3 b1577.6 ± 8.96 b0.814 ± 0.015 a0.755 ± 0.014 a
Baia de Arieș downstream112.4 ± 4.5 g338.6 ± 7.17 g0.654 ± 0.013 d0.623 ± 0.011 c
Sălciua upstream285 ± 4 c1417 ± 9.83 d0.789 ± 0.008 b0.750 ± 0.013 a
Sălciua downstream217 ± 4 f1379.3 ± 8.11 e0.787 ± 0.007 b0.748 ± 0.016 a
Turda upstream255.6 ± 4.5 d1484 ± 6.75 c0.817 ± 0.016 a0.757 ± 0.005 a
Turda downstream348 ± 6 a1744 ± 11.20 a0.796 ± 0.020 b0.750 ± 0.016 a
Câmpia Turzii upstream299.2 ± 4 b1632.6 ± 7.61 b0.808 ± 0.019 a0.741 ± 0.019 a
Câmpia Turzii downstream112.2 ± 6 g280.3 ± 8.06 h0.590 ± 0.009 e0.530 ± 0.021 d
Abrud inflow95 ± 4 h346.6 ± 6.28 g0.715 ± 0.012 c0.690 ± 0.017 b
* Data represent mean values ± standard error (n = 5); different superscript letters indicate significant differences at the p < 0.05 level (separately for each column). Fo—ground chlorophyll fluorescence; Fm—transitory maximal fluorescence; Fv—variable chlorophyll fluorescence; Φ—effective quantum efficiency of PSII.
Disclaimer/Publisher’s Note: The statements, opinions and data contained in all publications are solely those of the individual author(s) and contributor(s) and not of MDPI and/or the editor(s). MDPI and/or the editor(s) disclaim responsibility for any injury to people or property resulting from any ideas, methods, instructions or products referred to in the content.

