1. Introduction
Sodium is an essential nutrient for the maintenance of human health. The recommended minimum daily intake of sodium is 500 mg [
1]. However, excessive sodium intake has been identified as a health risk as it can lead to health problems such as stroke and cardiovascular disease [
2]. The issue of excessive sodium intake is particularly problematic in South Korea since it has one of the highest sodium consumption rates in the world [
1].
Similarly, while sugar has now become a major component of our daily nutrition [
3], the excessive consumption of sugar is associated with the risk of weight gain and cardiometabolic problems [
4]. And excessive sugar intake, as well as sodium intake is also a health problem in South Korea as the sugar-sweetened beverage (SSB) consumption rate among adults increased from 66% to 69% between 2001 and 2009 [
5].
In response to these situations, the food industry has been reducing the sodium and sugar contents of products to meet government health guidelines [
6]. However, food reformulation efforts alone are insufficient for inducing healthy consumption patterns among consumers. Depending on external and consumer-related factors, the results of these efforts can vary. Previous studies have shown that variables such as age, gender, income, health (whether they smoke, whether they have certain diseases, etc.), special diet, and price sensitivity have a significant impact on consumer attitudes toward low-sodium or-low-sugar products [
7,
8,
9,
10,
11,
12].
Therefore, this study investigates how consumers’ purchase intention for low-sodium/low-sugar products differs depending on their previous choices, level of unhealthy = tasty intuition (UTI), and food neophobia. As stimuli, we use soy sauce products to represent a sodium-based food category and yogurt products to represent a sugar-based food category. In comparison to regular products, we assume that the low-sodium and low-sugar versions of both the soy sauce and yogurt are relatively new to consumers, while the regular versions are familiar to consumers in South Korea.
2. Theoretical Framework
2.1. Cognitive Dissonance Theory
According to Festinger’s dissonance theory, two cognitions that are related to each other can be either consonant or dissonant. If the two cognitions are consonant, then one follows consistently with the other. However, if the two cognitions are dissonant, the opposite of one cognition is consistent with the other. When dissonance occurs, an individual experiences psychological discomfort, and in order to reduce this discomfort, the individual is motivated to avoid any information that is likely to aggravate this dissonance [
13]. Some of the important research generated by cognitive dissonance theory can be classified as based on the free-choice paradigm, belief-disconfirmation paradigm, effort-justification paradigm, and induced-compliance paradigm [
14].
Among these paradigms, we will focus on the free-choice paradigm and belief-disconfirmation paradigm in this study. According to the free-choice paradigm, the choice between similarly valued alternatives triggers a psychological tension mediated by the preferred aspects of the rejected alternative and the unpreferred aspects of the selected alternative [
13]. This tension is relieved by reassessing the options after the choice has been made [
15,
16]. The concept that choice shapes preference has been widely accepted by many researchers for many years [
17].
This idea was demonstrated in 1956 by an experiment conducted by psychologist Jack Brehm, and the results have been replicated numerous times since [
18,
19]. In Brehm’s experiment, participants were required to select one out of two similarly valued items and then evaluate the selected item. As a result, they rated the selected item as better than they did initially, while they rated the rejected item as worse [
20].
According to the belief-disconfirmation paradigm, dissonance occurs when people are exposed to information that does not match their beliefs. If the dissonance is not diminished by altering one’s own beliefs, then the dissonance can lead to the rejection or refutation of the new information [
14].
Following dissonance theory, the prior choice of a particular soy sauce or yogurt product will lead to a preference for this previously selected product. Therefore, even if new information is provided later regarding a low-sodium or low-sugar alternative, those who have already chosen a regular product will disregard this new information as it is dissonant to their existing preference. By referring to previous research that has stated that preference is almost identical to purchase intention and is a good predictor of it [
21], it can be predicted that:
H1a: Consumers who once chose a regular soy sauce will have a lower purchase intention for a low-sodium soy sauce regardless of additional information about the low-sodium soy sauce product.
H1b: Consumers who once chose a regular yogurt will have a lower purchase intention for a low-sugar yogurt regardless of additional information about the low-sugar yogurt product.
2.2. Unhealthy = Tasty Intuition (UTI)
Many researchers have posited and identified the positive effects of providing consumers with easily identified healthy foods [
22,
23,
24]. However, not all consumers will necessarily be more likely to buy certain products because they seem healthier [
25]. For example, some consumers will not choose healthier products over less healthy ones within the same food categories. For those consumers, a food with relatively healthy names, such as salad are perceived as less tasty than the same food with relatively unhealthy names, such as pasta [
26].
Connected to this rationale is the UTI that some people hold [
27]. According to Raghunathan et al., UTI is a belief held by consumers that the healthiness and tastiness of a food product have a negative correlation. In other words, when information is provided to consumers indicating that a product is healthy, the worse they infer its taste. There are two main sources for this belief. First, this intuition is generated internally from a more general belief that there is an inverse relationship between utilitarian and hedonic values. Along with this internal source of UTI, mass media and personal communications instill consumers with views that are compatible with this intuition.
However, the relationship between UTI and its consequences may be more complicated than we think [
26]. Furthermore, it is also important to highlight that the degree of UTI varies among consumers. Previous studies have indicated that there are consumers who are less likely to believe that unhealthy foods are tastier [
26,
28]. For instance, health-conscious consumers are less likely to base food decisions on UTI because they may place greater importance on health over taste [
29,
30]. To illustrate this, the taste expectations of dieters for healthy foods are more positive than those of non-dieters [
26]. In fact, one previous study found an intuition opposite to UTI that exists in France in which healthy foods are believed to be tastier than unhealthy foods [
31].
In the present study, UTI is indicated by the consumer tendency to evaluate healthy food as less tasty when given product information (nutrient contents, labels on the package, etc.). In this study, we consider healthy foods as those that are low in sodium or sugar. Therefore, it can be assumed that consumers with a lower UTI will have a higher purchase intention for low-sodium/low-sugar products. Thus, it is predicted that:
H2a: Consumers with a lower UTI will have a higher purchase intention for a low-sodium soy sauce product.
H2b: Consumers with a lower UTI will have a higher purchase intention for a low-sugar yogurt product
2.3. Food Neophobia
Underlying the relationship between a change in the taste of a product and the consumer acceptance of it is the feeling that consumers have when they are unfamiliar with the changed taste. In this context, the concept of food neophobia can be described as a consumer reluctance or unwillingness to try an unfamiliar product [
32]. People expect novel foods to be unfavorable or even dangerous as compared to familiar ones, and this tendency lowers their willingness to try novel foods [
33].
One of the ways to reduce food neophobia is to expose individuals to and increase familiarity with unfamiliar foods [
34,
35,
36]. However, since the degree to which people are exposed to novel foods varies, attempts to reduce food neophobia by increasing familiarity or exposure should be made with caution [
37]. Previous studies have revealed that there is a positive relationship between age and food neophobia [
32,
38,
39]. Other variables, such as culture, education, and income, can also influence the degree of individual food neophobia [
38,
40,
41,
42,
43]
In addition, the tendency for food neophobia can vary from person to person [
32,
44]. While food neophobics tend to reject and avoid unfamiliar foods without even trying them [
45], food neophilics enjoy trying unknown foods [
46,
47].
In the food industry, it is sometimes inevitable that alterations in flavor will result from changes in the sodium/sugar content of a food product, and consumers must make a hedonic adjustment to the change in flavor in order to become accustomed to the reformulated (low-sodium/low-sugar) product [
48]. As a result, this could influence the long-term consumer acceptance of a product [
49].
Marketing strategies related to increasing consumer familiarity with novel foods have shown the potential to introduce these products into the market successfully [
50]. Therefore, in order to ensure the market success of reformulated food products, such as with sodium or sugar-reduced foods, it is imperative to verify the purchase intentions of consumers for these products in consideration of their level of food neophobia. Therefore, we suggest the following hypotheses:
H3a: Consumers with a lower tendency toward food neophobia will have a higher purchase intention for a low-sodium soy sauce product.
H3b: Consumers with a lower tendency toward food neophobia will have a higher purchase intention for a low-sugar yogurt product.
3. Materials and Methods
3.1. Stimuli Materials
The two products chosen for the study were (1) soy sauce as a sodium-based product and (2) yogurt as a sugar-based product (
Appendix A). The experiments were designed to reflect all the brands of products sold in the actual markets to increase external validity. To do so, pictures of the real products, as well as their information (brand, price, and volume) were given to the participants at the early stage of the experiment. Soy sauce was selected as a stimulus in the first experiment and used as a representative product for the sodium-based product category because it has traditionally been used in South Korea and is assumed to be one of the main reasons why Korea’s sodium consumption is one of the highest in the world [
1]. Although soy sauce is recognized worldwide for its many health benefits as a fermented food, it also has the potential to cause high blood pressure and diabetes since it accounts for 20.8% of the daily sodium consumption in Korea [
51]. In the case of sugar intake, yogurt is selected as a stimulus for this study because it is one of Korea’s major sugar sources, according to the Korea Ministry of Food and Drug Safety [
52]. Therefore, yogurt will be presented to experiment participants as a sugar-based product in the second experiment.
In order to select the soy sauce products for this study, brands with the highest sales were selected based on a report from the Korea Agro-Fisheries and Food Trade Corporation [
53]. For the low-sugar yogurt products, on the other hand, the products with the highest sales volume on the E-Mart Mall, one of the largest Korean retail chains, were selected.
3.2. Participants
The effects of consumers’ previous choices, UTI, and food neophobia on the purchase intention for a low-sodium soy sauce product and a low-sugar yogurt product were studied among Korean housewives. Housewives were selected as the subject of our study because they are the main decision-makers for soy sauce and yogurt purchases in a market shopping context.
The data was collected from an online panel established by a leading online research company in the winter of 2018. Ages of the members of the panel ranged from their 20s to 50s and were all legally capable of consenting to participation. Participants of this study were at first gathered by answering the e-mail whether to participate in the study.
In the soy sauce experiment, respondents were asked whether they had bought soy sauce in the prior 6 months in order to screen out respondents who do not have recent experience of purchasing soy sauce products. Of the 2989 respondents, 1913 answered that they have experiences of buying soy sauce products in the prior 6 months. Then, 1913 respondents, who have bought soy sauce in the prior 6 months, were asked to choose one of the choice-set of regular soy sauce and low-sodium soy sauce products. Of the 1913 respondents, 1628 (85.10%) had chosen a regular soy sauce product and 285 (14.90%) had chosen a low-sodium soy sauce product. For the convenience and balance of the demographic composition of the two sample groups, however, 233 respondents out of 285 who had selected the low-sodium product and 233 out of 1628 respondents who had selected the regular product (total 466) were sampled and studied. The number of samples for each group was assigned to distribute the demographic data, such as age, evenly. The average age of the 466 respondents was 39.4 years old (SD = 10.8).
Likewise, for the yogurt experiment, respondents were also asked whether they had bought yogurt in the prior 6 months. 1070 out of 1401 answered that they have experiences of buying yogurt products in the prior 6 months. Of the 1070 respondents, 662 (61.87%) had chosen a regular yogurt product and 408 (38.13%) had chosen a low-sugar yogurt product. Among these, 239 out of 662 respondents who had selected a low-sugar yogurt product and 246 out of 1070 respondents who had selected a regular yogurt product (total 485) were sampled and studied. The number of samples for each group was assigned for the same reason as in the first experiment. The average age of the participants was 39.4 years old (SD = 10.6).
3.3. Procedure
Both experiments were performed by an online survey. Prior to the survey, all of the respondents were told that the data and opinions gathered through the survey were confidential and to be used for research purposes only, following Section 33 of the Korean statistical law. Only participants who gave consent to participate in the survey pressed the “Next” button. Gathered data of the participants were non-identifiable and stored in the company’s database for 1 year.
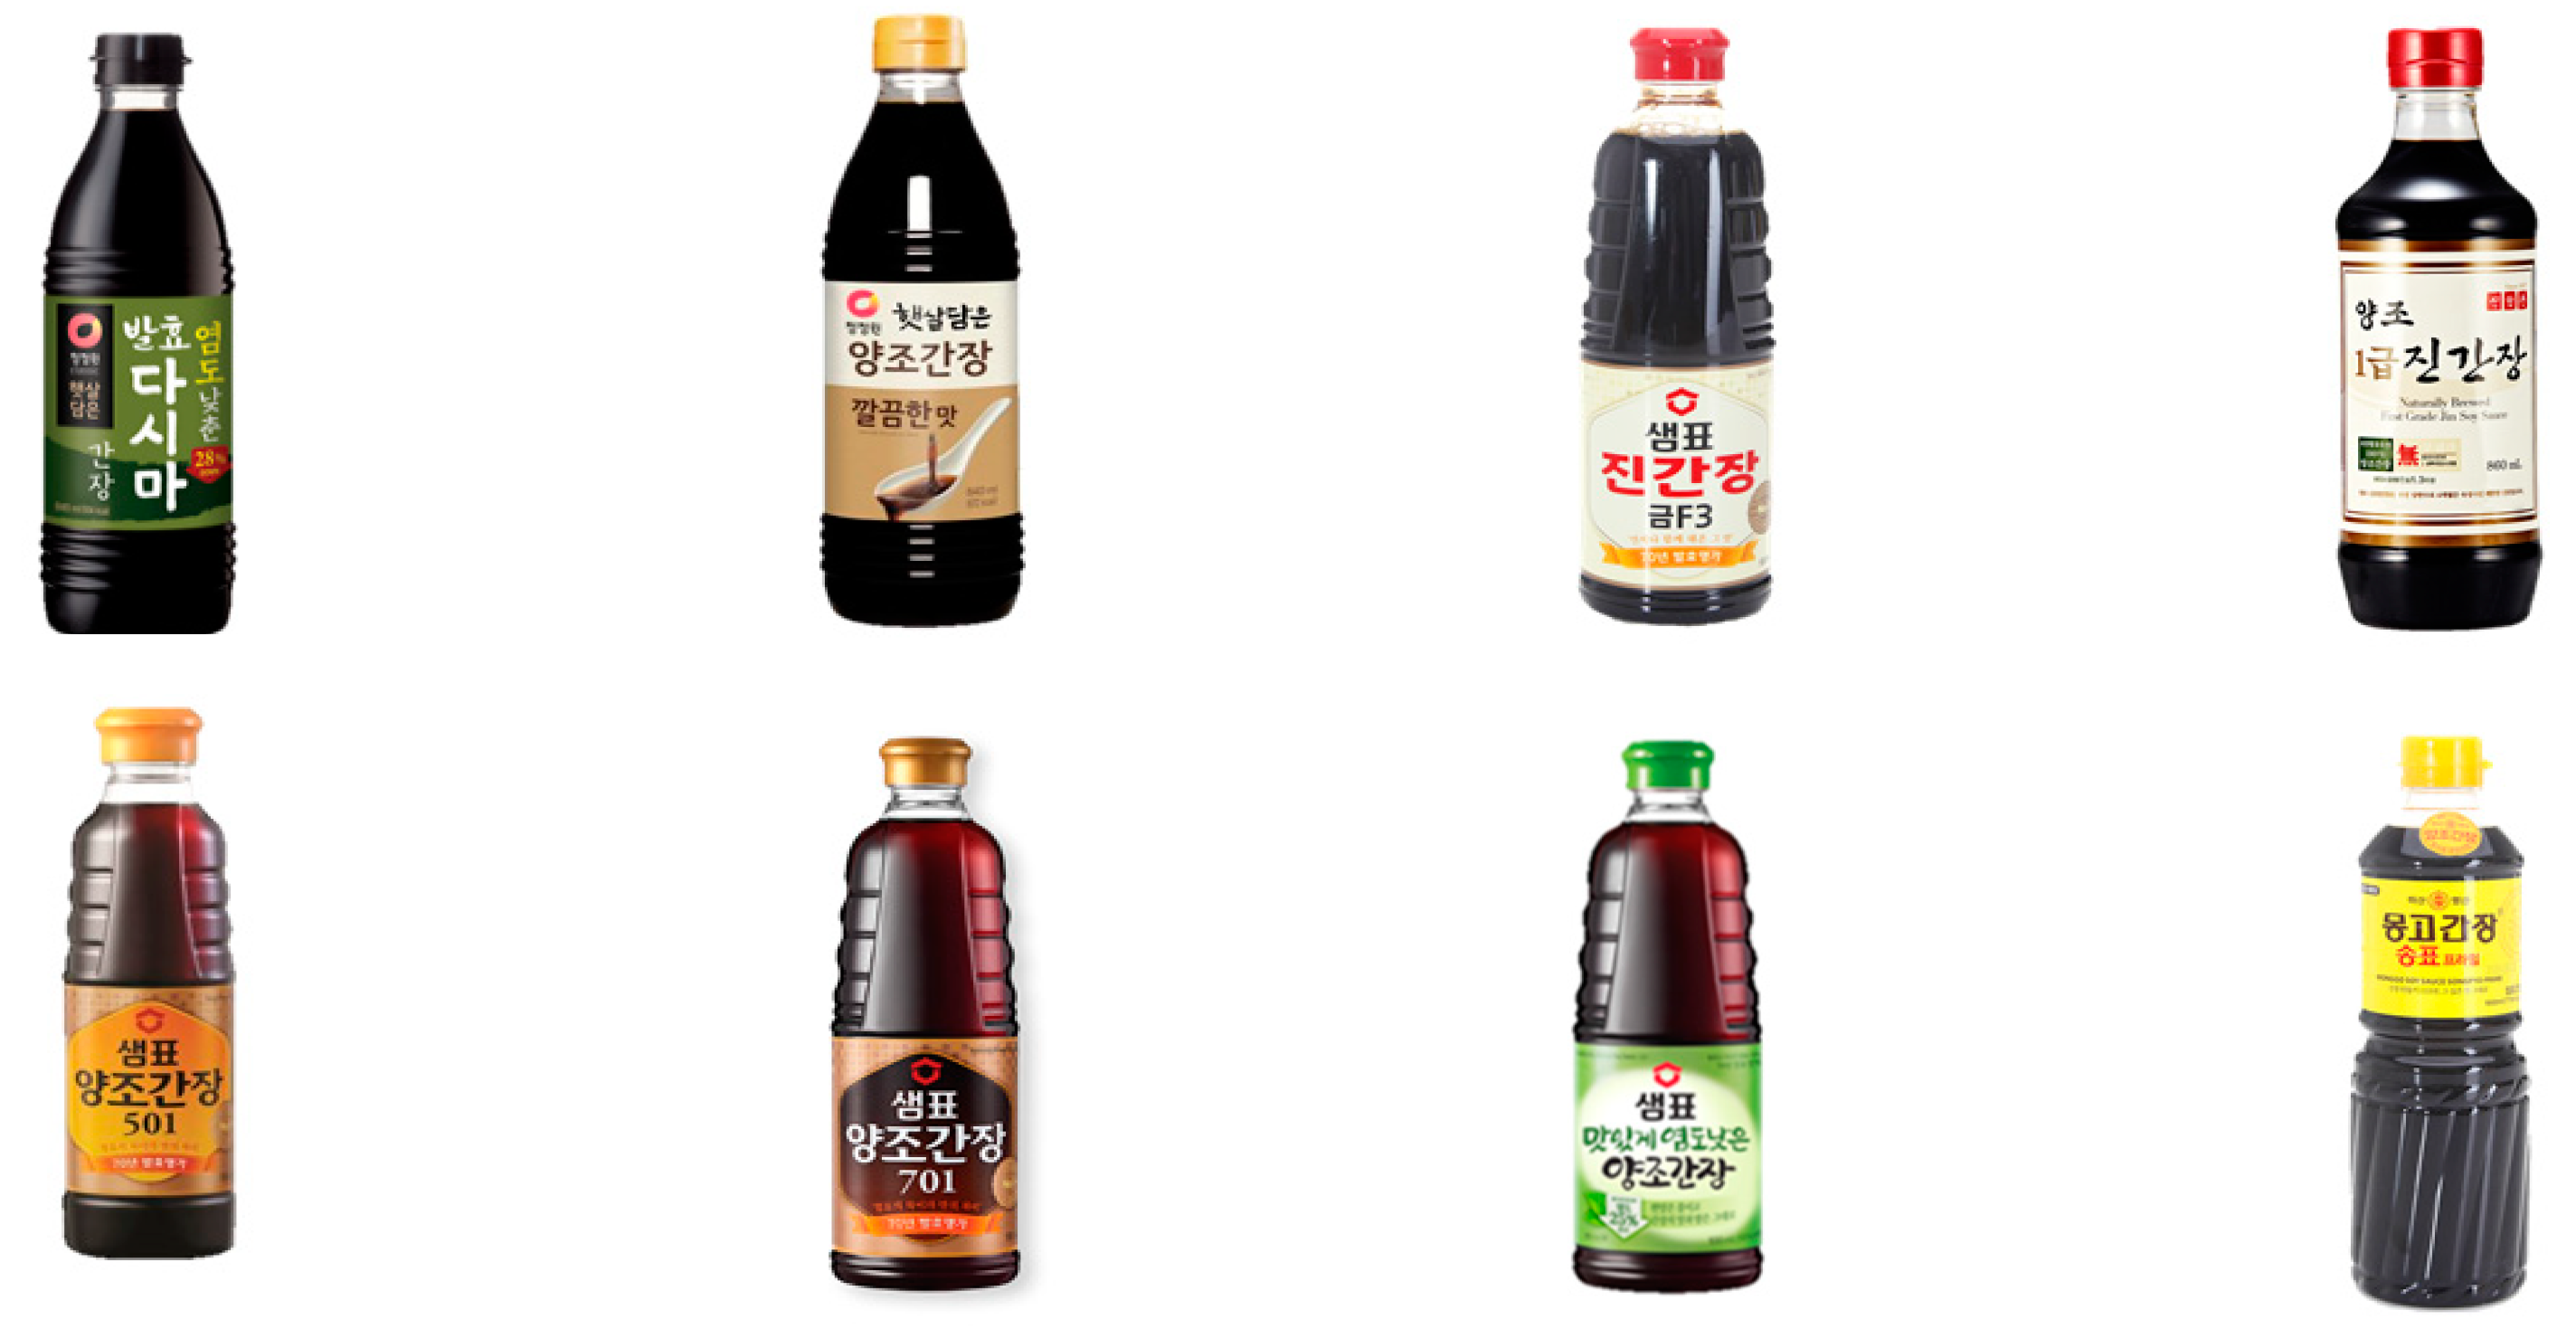
The survey of the soy sauce experiment was performed based on the scenario that the respondent had to buy soy sauce at the market for preparing meals. The 466 respondents were provided with images of eight soy sauce products currently sold at the market, with each including brief information on its volume, price, and unit price. Among the eight products, two were low-sodium and six were regular products, and respondents were asked to choose one.
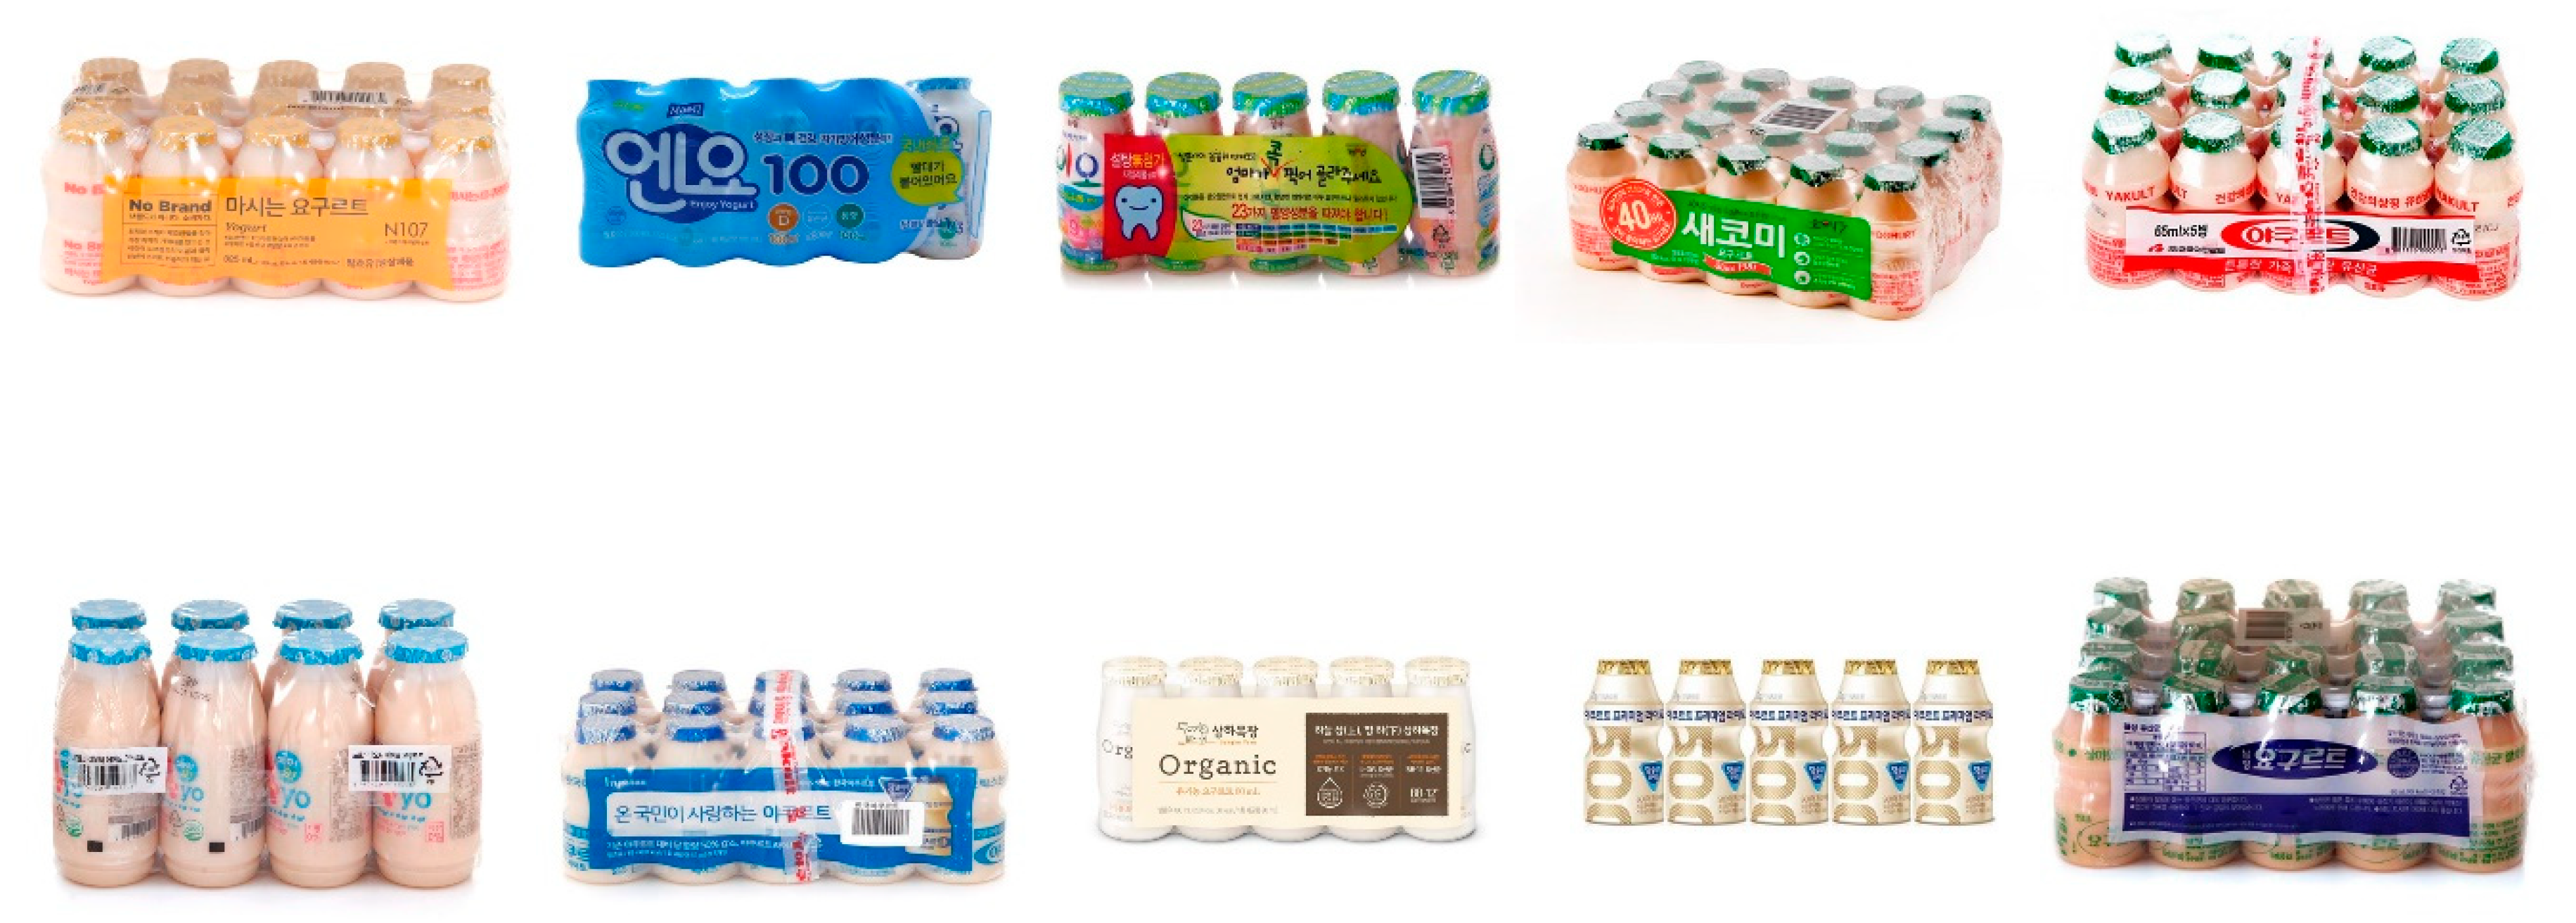
A similar design and procedure were applied in the yogurt experiment. The survey was also carried out based on the scenario that the respondent had to buy yogurt at the market. The 485 respondents were provided with images of seven yogurt products currently sold at the market, with each including brief information on its volume, price, and unit price. Among the seven products, three were low-sugar and four were regular products, and respondents were asked to choose one.
All of the respondents from both experiments were asked about their intention to purchase a low-sodium/low-sugar product. The study aimed to see how the sodium/sugar content of the product affects the consumer’s purchase intention of the product by providing them with additional information about low-sodium/sugar products immediately after the first choice of the participants. Those who had selected a low-sodium/low-sugar product in each experiment were given the information that the product they chose was low in sodium/sugar and were asked to evaluate their intention to purchase the product. On the other hand, those who had selected a regular product in each experiment were shown pictures and information for low-sodium/low-sugar products and were asked to evaluate their intention to purchase these products. The quality of the information given to both respondents in each experiment was controlled to be the same.
Next, the respondents from both experiments completed questionnaires regarding their UTI and food neophobia. Finally, basic demographic and personal information about the participants were taken in order to control the main independent variables. Information was collected about their interest in diet, family size, whether they have a family member suffering from atopy, high blood pressure, diabetes, or cancer, income, how often they cook at home, education level, and age.
3.4. Measures
Purchase intention was the main dependent variable in the study. To measure the purchase intention of a low-sodium/low-sugar product for each experiment, three items were rated on a 5-point scale (1 = ”very low” and 5 = ”very high”;
Table 1) [
54].
There were three main independent variables in this study: previous choice, UTI, and food neophobia. First, in order to measure the respondents’ previous choice, we divided the respondents into two groups based on whether they had chosen a low-sodium/low-sugar product or not. According to their choice, we assigned a dummy variable (PC) (Table 8).
Next, to measure the participants’ intuitive belief that the less healthy the food, the better its inferred taste, that is the UTI, they were asked to rate three items [
30] on a 5-point scale (1 = “strongly disagree” and 5 = ”strongly agree”;
Table 2).
Finally, the participants answered 10 items for a food neophobia scale (FNS) [
32] to measure their reluctance to eat and/or avoidance of novel foods based on a 5-point scale (1 = “strongly disagree” and 5 = ”strongly agree”;
Table 3). The higher the FNS score, the weaker the consumer’s food neophobia, and the lower the FNS score, the stronger the food neophobia. All items were written in Korean.
3.5. Data Analysis
Before conducting a multiple regression analysis to analyze the effects of the independent variables on the consumers’ purchase intention for the products of the study, the validity of each individual item from the questionnaire was assessed. To test the validity of our constructs, we used structural equation modeling to perform a confirmatory factor analysis with SmartPLS 2.0 and a bootstrap resample procedure [
55].
Reliability was confirmed with a Cronbach’s alpha. Generally, values that are greater than 0.70 represent a good measure [
56]. Then, individual item loadings were used to check convergent validity. A loading of 0.70 or higher from a partial least square method is considered adequate. The validity of the measurement model was evaluated by the composite reliability (CR) index, partial least squares (PLS) factor loadings, and average variance extracted (AVE). A value greater than 0.70 CR means that a construct maintains both its internal consistency and convergent validity [
57]. The recommended levels for PLS factor loadings and AVE are 0.70 and 0.50, respectively.
As can be seen in
Table 4 and
Table 5, the constructs from both experiments passed the reliability test since all of the Cronbach’s alpha values were higher than 0.70, indicating that the constructs have adequate internal consistency [
56]. In addition, values greater than 0.70 for CR show that the constructs have both internal consistency and convergent validity [
57].
This study used the square root of AVE (
Table 6 and
Table 7) and a cross-loading matrix to verify the discriminant validity of the measurement model. The square root should be larger than the correlations between the constructs [
58]. The amount of variance shared between the latent variables indicates the presence of a strong discriminant validity [
59].
Table 6 and
Table 7 show that for both experiments, each construct has a higher correlation with the measures than the other.
Subsequently, a multiple regression analysis was conducted with the three main independent variables: whether the respondents had previously selected a low-sodium soy sauce or not (previous choice), UTI, and food neophobia. Calculations were performed using RStudio version 3.4.4.
4. Results
The results from the soy sauce experiment and the yogurt experiment are as follows (
Table 8). First, the results from the soy sauce experiment revealed that among 466 respondents, those consumers who had previously chosen a regular soy sauce over low-sodium versions tended to have a lower purchase intention for a low-sodium product. Meanwhile, consumers who had a weaker intuition that delicious foods are not necessarily unhealthy (lower UTI) tended to have a higher purchase intention for a low-sodium soy sauce product. In addition, consumers who were less fearful of trying new foods (low food neophobia) tended to have a higher purchase intention for a low-sodium soy sauce product. These results support H1a, H2a, and H3a.
There were three control variables found in the results from the first experiment significant to the purchase intention for a low-sodium soy sauce: age, income, and diet interest. Consumers in their 20s and 30s had a lower purchase intention for a low-sodium soy sauce product compared to those who were in their 50s. On the other hand, consumers with a higher household income and consumers who were more interested in their diet had a higher purchase intention for a low-sodium soy sauce product.
The results from the yogurt experiment show that among 485 respondents, those consumers who had previously chosen a regular yogurt product over low-sugar versions tended to have a lower purchase intention for a low-sugar yogurt product. In addition, consumers who were less afraid of trying novel foods (low food neophobia) had a higher purchase intention for a low-sugar yogurt product. However, UTI was not a significant independent variable for the purchase intention for a low-sugar yogurt product. Therefore, the results support H1b and H3b but do not support H2b.
In the yogurt experiment, there were four control variables significant to the purchase intention for a low-sugar yogurt: age, diet interest, grocery shopping frequency, and family size. Consumers in their 20s had a lower purchase intention for a low-sugar yogurt product compared to those who were in their 50s. Older consumers, consumers who were more interested in their diet, and consumers who did their grocery shopping more frequently had a higher purchase intention for a low-sugar yogurt product. In addition, the larger the size of a consumer’s family, the higher the purchase intention for a low-sugar product.
5. Discussion
5.1. Consumers’ Previous Choice and the Purchase Intention for a Low-Sodium/Low-Sugar Product
The results from our study demonstrate that the previous choice shapes the preference of consumers. In other words, whether consumers had chosen a low-sodium/low-sugar product in the past or not make a significant impact on their purchase intention for these products. From the findings, we can draw some important implications.
In this study, respondents were asked to choose a product first from a choice set and were then informed about the low-sodium/low-sugar products. They were then asked to evaluate their purchase intention for these products. It should be noted that the presented information did not play a significant role in increasing the purchase intention for the low-sodium/low-sugar products. This is in line with our conjecture that those who had chosen regular products would disregard the information as it was dissonant with their preferences [
14].
The findings suggest that governmental agencies should divide consumers into segments and implement different strategies. We suggest dividing consumers into segments of (1) consumers who have never purchased sodium/sugar-based products, (2) consumers who buy low-sodium/low-sugar products, and (3) consumers who buy regular products.
First, for the (1) consumers who have never purchased sodium/sugar-based products but are prospective consumers, governmental agencies should consider strategies to raise awareness of these products. It is imperative to add low-sodium/low-sugar products to the consumer choice set. Next, there is a need to encourage (2) consumers who are already a customer of low-sodium/low-sugar products to repurchase them. In order to do that, it is suggested that governmental agencies introduce recipes and put labels on the products to make consumers more informed and increase their involvement.
Finally, strategies that instill dissonant cognitions to the behavior of consuming high-sodium/low-sugar products can be considered for (3) consumers who are already consuming regular products. Following an example used by Festinger (1957), some consumers may experience dissonance and divert their purchasing behaviors to reduce dissonance when they are faced with campaigns and public advertisements promoting that excessive sodium and sugar intake is bad for their health.
5.2. Consumers’ Unhealthy = Tasty Intuition and the Purchase Intention of a Low-Sodium/Low-Sugar Product
Consumers’ UTI made a significant impact on their purchase intention for a low-sodium soy sauce product. However, contrary to our expectations, it did not significantly influence the purchase intention for a low-sugar yogurt product. There may be some explanations for this. Soy sauce has a relatively high switching cost as it has a longer consumption period per purchase as compared to yogurt. In addition, soy sauce is not a product that is consumed directly, but rather, it is seasoning that adds saltiness during the cooking process. Thus, this saltiness itself is a highlight of soy sauce. Therefore, consumers with a high UTI will tend to have a significantly lower intention to purchase a low-sodium soy sauce product because purchasing it entails high uncertainty. On the other hand, yogurt is not a product eaten for sweetness alone, and therefore, UTI may not make a significant impact on consumer purchase intention in this case.
In addition, consumer perceptions of tastiness and healthiness can differ depending on the food product category [
60]. Food products can be divided into a tastiness-associated food category and a healthiness-associated food category [
61], yet some products can be perceived as having both tasty and healthy dimensions. In line with this idea, it is assumed that yogurt, unlike soy sauce, can be perceived as neutral in terms of healthiness and tastiness for consumers in Korea.
We can also speculate that Korea’s market environment affected the experiment results. Our data shows that 14.90% of the respondents selected a low-sodium soy sauce product and 85.10% selected a regular product. Meanwhile, the yogurt choices were more evenly distributed with 38.13% of respondents having selected a low-sugar yogurt product and 61.87% having selected a regular product. This suggests that consumer preconceptions about the taste of low-sugar yogurt have already disappeared or that there are already good tasting low-sugar yogurt products on the market, while there still exist preconceptions regarding the taste of low-sodium soy sauce.
Therefore, in order to increase consumers’ purchase intention for low-sodium products, especially for the soy sauce category, it is necessary to change the behavior of consumers in the long term by utilizing media-based promotion strategies. For example, media promotion strategies using contents such as specific and interesting sensory experiments and blind tests can be efficacious for overcoming consumer preconceptions that using low-sodium soy sauce will negatively affect the taste of food.
5.3. Consumers’ Food Neophobia and the Purchase Intention for a Low-Sodium/Low-Sugar Product
This study assumes that when a food product with lower sodium or sugar content is introduced by a widely accepted and long-established food brand, the consumer perceives the new product as novel relative to the original. Based on this assumption, we hypothesized that the weaker the food neophobia tendency of consumers, the stronger their purchase intention for low-sodium and low-sugar products. The results confirmed our hypothesis (H1a and H1b confirmed). One of the implications of this study is the interpretation of the consumer the consumption of soy sauce and yogurt products from a different perspective than previous studies. The study assumes that regular soy sauce and yogurt products are familiar to consumers, but are recognized as unfamiliar to consumers when the sodium and sugar contents are lower, respectively.
Although yogurt is a widely-consumed product category worldwide, soy-based foods, including soy sauce, are only recently being introduced to the Western world [
62]. For this reason, many prior studies have been conducted in consideration of the factors that affect Western consumers (i.e., food neophobia) in their consumption of soy products, which would be novel foods from their perspective [
63,
64,
65,
66,
67,
68,
69]. However, soybeans are a traditional food source in East and Southeast Asia [
70]. In particular, soy sauce is a product that has traditionally been used in many dishes in Korea. Therefore, it is a more reasonable explanation that, while soy sauce itself is not a new food for Korean consumers, low-sodium soy sauce reformulated from the original is considered a new product for Koreans.
There have been other studies that have considered consumers’ purchase intention of yogurt products and the effects of food neophobia [
71]. The yogurt items considered in those studies, however, were mainly functional products, such as probiotic yogurts [
72,
73]. However, the novelty covered in this study was not a novelty from adding a new nutritional ingredient to an existing product but rather from lowering the sugar content of a product already familiar to consumers.
The relationship between food neophobia and purchase intention for the products of our study indicates that alleviating consumer food neophobia for low-sodium/low-sugar content products may result in more positive consumer responses. Since a number of prior studies have demonstrated that repeated exposure to novels foods and flavors tends to enhance preferences [
34,
35,
36], increasing the amount of exposure to these products can be one way to reduce food neophobia and encourage consumers to acquire preferences for low-sodium/low-sugar products. Therefore, giving out food samples or, as in the case of low-sodium soy sauce, making and distributing recipe books using the product can be suggested.
5.4. Control Variables
Control Variables that had significant impacts on the purchase intention of low-sodium soy sauce products were age, income, and diet interest. The result is in line with previous studies. According to the previous research [
7], sodium content is considered significantly important in food purchases to older and middle-high income consumers. In addition, when it comes to the perception of low-sodium products, age, income, and family concern about diet-related problems are significant factors. Aged consumers with higher income levels and diet-related concerns within the family are more likely to recognize low-sodium products [
8].
On the other hand, control variables that had significant impacts on the purchase intention of low-sugar yogurt products were age, diet interest, grocery shopping frequency, and family size. While consumers in their 20s and 30s had significantly lower purchase intention for low-sodium soy sauce products compared to those in their 40s and 50s, only consumers in their 20s had significantly lower purchase intention for low-sugar yogurt product. On the other hand, consumers with bigger family size had significantly higher purchase intention for low-sugar yogurt product while they were not for a low-sodium soy sauce product. According to the report from the Korea Agro-Fisheries & Food Trade Corporation report, the ages of the yogurt product consumers are evenly distributed compared to other dairy products [
74]. As the number of family members increases, the age range of family members will also vary. In the case of a yogurt product, since the products are consumed by various ages compared to a soy sauce product, the increase in the number of family members would mean the increased demand for yogurt per household. This may explain why the Family size was a significant variable in the purchase intention of a low-sugar yogurt product compared to a low-sodium soy sauce product. In addition, according to a previous study, individuals who were more interested in losing their weights consumed low-sugar carbonated drinks such as Coca-Cola Light and Fanta Light significantly more than those who were not [
75]. It is consistent with our finding that as consumers are more interested in their diet, their purchase intention for a low-sugar yogurt product is significantly higher. Furthermore, previous researches show that consumers who do grocery shopping more often tend to buy healthier foods [
76], and college students who do not do grocery shopping tend to have poor eating habits, such as drinking more carbonated drinks or eating high-calorie food products compared to those who do grocery shopping at a convenience store or supermarkets [
77]. These findings explain why grocery shopping frequency had a significant impact on the purchase intention of low-sugar yogurt products in this study.
5.5. Limitations and Further Research
Many different factors influence consumers’ purchase intention for low-sodium/low-sugar products, and it is impossible to consider all of these factors in a single study. This study focused on the influence of external factors, specifically previous choice experience, and consumer-related factors (UTI, food neophobia) on the purchase intention for these products. Other factors, such as product-related factors, need further research.
In addition, many different low-sodium food products exist in the sodium-based food product category, and there are also many low-sugar food products on the market. As stimuli, the present study used soy sauce to represent the sodium-based food product category and yogurt to represent the sugar-based food product category. More food product categories should be considered in order to generalize our findings in future research.
Furthermore, sodium-based and sugar-based food products differ not only in their sensory characteristics but also in the situations where they are consumed and the people who consume them. Further research is needed to determine the factors that influence the purchase intention of low-sodium and low-sugar food products based on the qualitative differences between these two product categories. For instance, comparing sodium-based products and sugar-based products that are perceived in terms of the same dimension (healthiness vs. healthiness, tastiness vs. tastiness) can be one way to consider the qualitative differences of these two food product categories.
Moreover, in conducting online purchasing experiments and surveys with low-sodium soy sauce and low-sugar yogurt products and analyzing the results, it was difficult to control for variables such as brand, price, and volume due to the structure of the survey. There was a trade-off between internal validity on the one hand and external validity on the other hand in the experimental design process. In future experiments, there is a need to control the impact of these variables on consumer choice and purchase intention while conducting the surveys and analyzing the results.
Finally, this study was conducted mainly on the group that can be surveyed online easily due to the nature of the online survey. Therefore, there is a possibility that the research results could be age-biased because the panel members who participated in the survey were limited to their 20s to 50s. Future research needs to focus on recruiting samples to represent all ages.
6. Conclusions
This study has its originality and value in that the study has interpreted the consumer consumption of soy sauce and yogurt products from a different perspective than previous studies. The study begins with the assumption that regular soy sauce and yogurt products are familiar to consumers, but are recognized as unfamiliar to consumers when the sodium and sugar content is reformulated, respectively. This way, the present work helps expand the view of defining a new food product.
This study aimed to examine the consumer’s previous choice of low-sodium/sugar products, unhealthy = tasty intuition and the propensity of food neophobia influence their intention to purchase low-sodium/sugar products. The result turned out that the previous choice of regular soy sauce and yogurt products had a negative effect on the purchase intention for low-sodium soy sauce and low-sugar yogurt products. In addition, consumer’s strong UTI had a negative influence on the purchase intention for low-sodium soy sauce products, but no significant influence on that of low-sugar yogurt products. Furthermore, consumer’s stronger propensity for food neophobia had a negative effect on the purchase intention for both low-sodium soy sauce products and low-sugar products. The result also suggests that not only consumer’s previous experience and their disposition, but also demographic factors such as age, income, diet interest, and family size have an impact on purchase intention for these low-sodium/sugar products. Furthermore, it can be said that the factors have different impacts on the purchase intention depending on the product category and whether sodium or sugar is the main content of the product.
Author Contributions
Conceptualization, Y.P., D.L., S.P., and J.M.; methodology, Y.P. and D.L.; analysis, Y.P.; writing—original draft preparation, Y.P.; writing—review and editing, D.L. and J.M.; supervision, J.M. All authors have read and agreed to the published version of the manuscript.
Funding
This research received no external funding.
Conflicts of Interest
The authors declare no conflict of interest.
Appendix A
Figure A1.
Soy sauce products used as stimuli in the survey.
Figure A1.
Soy sauce products used as stimuli in the survey.
Figure A2.
Yogurt products used as stimuli in the survey.
Figure A2.
Yogurt products used as stimuli in the survey.
References
- Kim, S.; Kim, M.; Min, J.; Yoo, J.; Kim, M.; Kang, J.; Won, C.W. How Much Intake of Sodium Is Good for Frailty? The Korean Frailty and Aging Cohort Study (KFACS). J. Nutr. Health Aging 2019, 23, 503–508. [Google Scholar] [CrossRef] [PubMed]
- Strazzullo, P.; D’Elia, L.; Kandala, N.B.; Cappuccio, F.P. Salt intake, stroke, and cardiovascular disease: Meta-analysis of prospective studies. Br. Med. J. 2009, 339, 1–9. [Google Scholar] [CrossRef] [PubMed] [Green Version]
- Hagmann, D.; Siegrist, M.; Hartmann, C. Taxes, labels, or nudges? Public acceptance of various interventions designed to reduce sugar intake. Food Policy 2018, 79, 156–165. [Google Scholar] [CrossRef]
- Popkin, B.M.; Hawkes, C. Sweetening of the global diet, particularly beverages: Patterns, trends, and policy responses. Lancet Diabetes Endo 2016, 4, 174–186. [Google Scholar] [CrossRef] [Green Version]
- Han, E.; Kim, T.H.; Powell, L.M. Beverage consumption and individual-level associations in South Korea. BMC Public Health 2013, 13, 195. [Google Scholar] [CrossRef] [Green Version]
- Kremer, S.; Shimojo, R.; Holthuysen, N.; Koster, E.P.; Mojet, J. Consumer acceptance of salt-reduced “soy sauce” bread over repeated in home consumption. Food Qual. Prefer. 2013, 28, 484–491. [Google Scholar] [CrossRef]
- Bryła, P. Selected Predictors of the Importance Attached to Salt Content Information on the Food Packaging (a Study among Polish Consumers). Nutrients 2020, 12, 293. [Google Scholar] [CrossRef] [Green Version]
- Büyükkaragöz, A.; Baş, M.; Sağlam, D.; Cengiz, E. Consumers’ awareness, acceptance and attitudes towards functional foods in Turkey. Int. J. Consum. Stud. 2014, 38, 628–635. [Google Scholar] [CrossRef]
- Guardia, M.D.; Guerrero, L.; Gelabert, J.; Gou, P.; Arnau, J. Consumer attitude towards sodium reduction in meat products and acceptability of fermented sausages with reduced sodium content. Meat Sci. 2006, 73, 484–490. [Google Scholar] [CrossRef]
- Kim, M.K.; Lee, K.G. Consumer awareness and interest toward sodium reduction trends in Korea. J. Food Sci. 2014, 79, S1416–S1423. [Google Scholar] [CrossRef]
- Saleh, M.; Alhaidari, A.; Al-Mansour, A.; Al-Khudair, A. Health Awareness and Price Sensitivity as Predictors of Consumers’ Purchase Attitude towards Soft Drinks. Expert J. Mark. 2018, 6, 22–32. [Google Scholar]
- Nakmongkol, A. The Study of Consumer’s Attitudes and Behaviors towards Carbonate Soft Drinks. Master’s Thesis, Bangkok University, Bangkok, Thailand, 2009. [Google Scholar]
- Festinger, L. A Theory of Cognitive Dissonance; Stanford University Press: Stanford, CA, USA, 1957. [Google Scholar]
- Harmon-Jones, E.E.; Mills, J.E. Cognitive Dissonance: Progress on a Pivotal Theory in Social Psychology; American Psychological Association: Arlington, TX, USA, 1999. [Google Scholar]
- Bem, D.J. Self-Perception—An Alternative Interpretation of Cognitive Dissonance Phenomena. Psychol. Rev. 1967, 74, 183. [Google Scholar] [CrossRef] [PubMed]
- Bem, D.J. Self-perception theory. In Advances in Experimental Social Psychol; Elsevier: Amsterdam, The Netherlands, 1972; Volume 6, pp. 1–62. [Google Scholar]
- Ariely, D.; Norton, M.I. How actions create—Not just reveal—Preferences. Trends Cogn. Sci. 2008, 12, 13–16. [Google Scholar] [CrossRef] [PubMed]
- Lieberman, M.D.; Ochsner, K.N.; Gilbert, D.T.; Schacter, D.L. Do amnesics exhibit cognitive dissonance reduction? The role of explicit memory and attention in attitude change. Psychol. Sci. 2001, 12, 135–140. [Google Scholar] [CrossRef] [PubMed]
- Egan, L.C.; Santos, L.R.; Bloom, P. The origins of cognitive dissonance: Evidence from children and monkeys. Psychol. Sci. 2007, 18, 978–983. [Google Scholar] [CrossRef] [PubMed]
- Brehm, J.W. Postdecision changes in the desirability of alternatives. J. Abnorm. Soc. Psychol. 1956, 52, 384. [Google Scholar] [CrossRef] [Green Version]
- Banks, S. The Relationships between Preference and Purchase of Brands. J. Mark. 1950, 15, 145–157. [Google Scholar] [CrossRef]
- Rogers, P.J.; Hogenkamp, P.S.; de Graaf, C.; Higgs, S.; Lluch, A.; Ness, A.R.; Penfold, C.; Perry, R.; Putz, P.; Yeomans, M.R.; et al. Does low-energy sweetener consumption affect energy intake and body weight? A systematic review, including meta-analyses, of the evidence from human and animal studies. Int. J. Obes. 2016, 40, 381–394. [Google Scholar] [CrossRef] [Green Version]
- Liu, P.J.; Roberto, C.A.; Liu, L.J.; Brownell, K.D. A test of different menu labeling presentations. Appetite 2012, 59, 770–777. [Google Scholar] [CrossRef]
- Lee, W.C.J.; Shimizu, M.; Kniffin, K.M.; Wansink, B. You taste what you see: Do organic labels bias taste perceptions? Food Qual. Prefer. 2013, 29, 33–39. [Google Scholar] [CrossRef]
- Huang, Y.H.; Wu, J. Food pleasure orientation diminishes the “healthy = less tasty” intuition. Food Qual. Prefer. 2016, 54, 75–78. [Google Scholar] [CrossRef]
- Irmak, C.; Vallen, B.; Robinson, S.R. The Impact of Product Name on Dieters’ and Nondieters’ Food Evaluations and Consumption. J. Consum. Res. 2011, 38, 390–405. [Google Scholar] [CrossRef] [Green Version]
- Raghunathan, R.; Naylor, R.W.; Hoyer, W.D. The unhealthy equal tasty intuition and its effects on taste inferences, enjoyment, and choice of food products. J. Mark. 2006, 70, 170–184. [Google Scholar] [CrossRef]
- Howlett, E.A.; Burton, S.; Bates, K.; Huggins, K. Coming to a Restaurant Near You? Potential Consumer Responses to Nutrition Information Disclosure on Menus. J. Consum. Res. 2009, 36, 494–503. [Google Scholar] [CrossRef]
- Naylor, R.W.; Droms, C.M.; Haws, K.L. Eating with a Purpose: Consumer Response to Functional Food Health Claims in Conflicting Versus Complementary Information Environments. J. Public Policy Mark. 2009, 28, 221–233. [Google Scholar] [CrossRef] [Green Version]
- Mai, R.; Hoffmann, S. How to Combat the Unhealthy = Tasty Intuition: The Influencing Role of Health Consciousness. J. Public Policy Mark. 2015, 34, 63–83. [Google Scholar] [CrossRef]
- Werle, C.O.C.; Trendel, O.; Ardito, G. Unhealthy food is not tastier for everybody: The “healthy = tasty” French intuition. Food Qual. Prefer. 2013, 28, 116–121. [Google Scholar] [CrossRef]
- Pliner, P.; Hobden, K. Development of a Scale to Measure the Trait of Food Neophobia in Humans. Appetite 1992, 19, 105–120. [Google Scholar] [CrossRef]
- Pliner, P.; Pelchat, M.; Grabski, M. Reduction of Neophobia in Humans by Exposure to Novel Foods. Appetite 1993, 20, 111–123. [Google Scholar] [CrossRef]
- Pliner, P. The Effects of Mere Exposure on Liking for Edible Substances. Appetite 1982, 3, 283–290. [Google Scholar] [CrossRef]
- Birch, L.L.; Marlin, D.W. I don’t like it; I never tried it: Effects of exposure on two-year-old children’s food preferences. Appetite 1982, 3, 353–360. [Google Scholar] [CrossRef]
- Birch, L.L.; McPhee, L.; Shoba, B.C.; Pirok, E.; Steinberg, L. What kind of exposure reduces children’s food neophobia? Looking vs. tasting. Appetite 1987, 9, 171–178. [Google Scholar] [CrossRef]
- Siegrist, M.; Hartmann, C.; Keller, C. Antecedents of food neophobia and its association with eating behavior and food choices. Food Qual. Prefer. 2013, 30, 293–298. [Google Scholar] [CrossRef]
- Meiselman, H.; King, S.; Gillette, M. The demographics of neophobia in a large commercial US sample. Food Qual. Prefer. 2010, 21, 893–897. [Google Scholar] [CrossRef]
- Fernández-Ruiz, V.; Claret, A.; Chaya, C. Testing a Spanish-version of the food neophobia scale. Food Qual. Prefer. 2013, 28, 222–225. [Google Scholar] [CrossRef]
- Hursti, U.K.K.; Sjoden, P.O. Food and general neophobia and their relationship with self-reported food choice: Familial resemblance in Swedish families with children of ages 7–17 years. Appetite 1997, 29, 89–103. [Google Scholar] [CrossRef]
- Olabi, A.; Najm, N.E.; Kebbe Baghdadi, O.; Morton, J.M. Food neophobia levels of Lebanese and American college students. Food Qual. Prefer. 2009, 20, 353–362. [Google Scholar] [CrossRef]
- Ritchey, P.N.; Frank, R.A.; Hursti, U.K.; Tuorila, H. Validation and cross-national comparison of the food neophobia scale (FNS) using confirmatory factor analysis. Appetite 2003, 40, 163–173. [Google Scholar] [CrossRef]
- Tuorila, H.; Lahteenmaki, L.; Pohjalainen, L.; Lotti, L. Food neophobia among the Finns and related responses to familiar and unfamiliar foods. Food Qual. Prefer. 2001, 12, 29–37. [Google Scholar] [CrossRef]
- Knaapila, A.; Tuorila, H.; Silventoninen, K.; Keskitalo, K.; Kallela, M.; Wessman, M.; Peltonen, L.; Cherkas, L.F.; Spector, T.D.; Perola, M. Food neophobia shows heritable variation in humans. Physiol. Behav. 2007, 91, 573–578. [Google Scholar] [CrossRef]
- Heath, P.; Houston-Price, C.; Kennedy, O.B. Increasing food familiarity without the tears. A role for visual exposure? Appetite 2011, 57, 832–838. [Google Scholar] [CrossRef] [PubMed] [Green Version]
- Henriques, A.S.; King, S.C.; Meiselman, H.L. Consumer segmentation based on food neophobia and its application to product development. Food Qual. Prefer. 2009, 20, 83–91. [Google Scholar] [CrossRef]
- Schickenberg, B.A. Towards Strategies to Stimulate First Time Trial of Unfamiliar Healthful Food Products. Ph.D. Thesis, Maastricht University, Maastricht, The Netherlands, 2010. [Google Scholar]
- Kinnear, M.; de Kock, H.L. Would repeated consumption of sports drinks with different acidulants lead to hedonic adjustment? Food Qual. Prefer. 2011, 22, 340–345. [Google Scholar] [CrossRef]
- Chung, S.-J.; Vickers, Z. Influence of sweetness on the sensory-specific satiety and long-term acceptability of tea. Food Qual. Prefer. 2007, 18, 256–264. [Google Scholar] [CrossRef]
- Barcellos, M.D.d.; Aguiar, L.K.; Ferreira, G.C.; Vieira, L.M. Willingness to try innovative food products: A comparison between British and Brazilian consumers. BAR Braz. Adm. Rev. 2009, 6, 50–61. [Google Scholar] [CrossRef]
- Kim, S.-H.; Jeong, Y.-J. Domestic and international trends in sodium reduction and practices. Food Sci. Ind. 2016, 49, 25–33. [Google Scholar]
- Jung, J. Action plan for sugars reduction. Food Sci. Ind. 2016, 49, 12–16. [Google Scholar]
- Korea Agro-Fisheries&Food Trade Corporation. 2018 Processed Food Segment Market Status: Sauce and Dressing Market; 11-1543000-002434-01; Korea Agro-Fisheries&Food Trade Corporatio: Naju, Korea, 2018. [Google Scholar]
- Gefen, D. E-commerce: The role of familiarity and trust. Omega 2000, 28, 725–737. [Google Scholar] [CrossRef] [Green Version]
- Ringle, C.M.; Wende, S.; Will, A. SmartPLS 2.0 (M3) Beta; University of Hamburg: Hamburg, Germany, 2005. [Google Scholar]
- Knoke, D.; Bohrnstedt, G.W.; Mee, A.P. Statistics for Social Data Analysis; FE Peacock Publishers, Inc: Itasca, IL, USA, 1994. [Google Scholar]
- Werts, C.E.; Linn, R.L.; Joreskog, K.G. Intraclass Reliability Estimates—Testing Structural Assumptions. Educ. Psychol. Meas. 1974, 34, 25–33. [Google Scholar] [CrossRef]
- Fornell, C.; Larcker, D.F. Evaluating Structural Equation Models with Unobservable Variables and Measurement Error. J. Mark. Res. 1981, 18, 39–50. [Google Scholar] [CrossRef]
- Gefen, D.; Straub, D. A practical guide to factorial validity using PLS-Graph: Tutorial and annotated example. Commun. Assoc. Inf. Syst. 2005, 16, 5. [Google Scholar] [CrossRef] [Green Version]
- Cheong, Y.; Kim, K. The Interplay Between Advertising Claims and Product Categories in Food Advertising: A Schema Congruity Perspective. J. Appl. Commun. Res. 2011, 39, 55–74. [Google Scholar] [CrossRef]
- Wertenbroch, K. Consumption self-control by rationing purchase quantities of virtue and vice. Mark. Sci. 1998, 17, 317–337. [Google Scholar] [CrossRef]
- Fenko, A.; Backhaus, B.W.; van Hoof, J.J. The influence of product- and person-related factors on consumer hedonic responses to soy products. Food Qual. Prefer. 2015, 41, 30–40. [Google Scholar] [CrossRef]
- Roininen, K. Evaluation of Food Choice Behavior: Development and Validation of Health and Taste Attitude Scales. Ph.D. Thesis, University of Helsinki, Helsinki, Finland, 2001. [Google Scholar]
- Choe, J.Y.; Cho, M.S. Food neophobia and willingness to try non-traditional foods for Koreans. Food Qual. Prefer. 2011, 22, 671–677. [Google Scholar] [CrossRef]
- Schyver, T.; Smith, C. Reported attitudes and beliefs toward soy food consumption of soy consumers versus nonconsumers in natural foods or mainstream grocery stores. J. Nutr. Educ. Behav. 2005, 37, 292–299. [Google Scholar] [CrossRef]
- Moon, W.; Balasubramanian, S.K.; Rimal, A. Health claims and consumers’ behavioral intentions: The case of soy-based food. Food Policy 2011, 36, 480–489. [Google Scholar] [CrossRef]
- Martins, Y.; Pliner, P. Human food choices: An examination of the factors underlying acceptance/rejection of novel and familiar animal and nonanimal foods. Appetite 2005, 45, 214–224. [Google Scholar] [CrossRef]
- Hoek, A.C.; Luning, P.A.; Weijzen, P.; Engels, W.; Kok, F.J.; de Graaf, C. Replacement of meat by meat substitutes. A survey on person- and product-related factors in consumer acceptance. Appetite 2011, 56, 662–673. [Google Scholar] [CrossRef]
- Chang, J.B.; Moon, W.; Balasubramanian, S.K. Consumer valuation of health attributes for soy-based food: A choice modeling approach. Food Policy 2012, 37, 335–342. [Google Scholar] [CrossRef]
- Tu, V.P.; Husson, F.; Sutan, A.; Ha, D.T.; Valentin, D. For me the taste of soy is not a barrier to its consumption. And how about you? Appetite 2012, 58, 914–921. [Google Scholar] [CrossRef]
- Bimbo, F.; Bonanno, A.; Nocella, G.; Viscecchia, R.; Nardone, G.; De Devitiis, B.; Carlucci, D. Consumers’ acceptance and preferences for nutrition-modified and functional dairy products: A systematic review. Appetite 2017, 113, 141–154. [Google Scholar] [CrossRef] [PubMed] [Green Version]
- Urala, N.; Lahteenmaki, L. Consumers’ changing attitudes towards functional foods. Food Qual. Prefer. 2007, 18, 1–12. [Google Scholar] [CrossRef]
- Siegrist, M.; Stampfli, N.; Kastenholz, H. Consumers’ willingness to buy functional foods. The influence of carrier, benefit and trust. Appetite 2008, 51, 526–529. [Google Scholar] [CrossRef] [PubMed]
- Korea Agro-Fisheries&Food Trade Corporation. 2018 Processed Food Segment Market Report: Butter, Cheese, Fermented Milk; 11-1543000-002320-01; Korea Agro-Fisheries&Food Trade Corporation: Naju, Korea, 2018. [Google Scholar]
- Mullie, P.; Aerenhouts, D.; Clarys, P. Demographic, socioeconomic and nutritional determinants of daily versus non-daily sugar-sweetened and artificially sweetened beverage consumption. Eur. J. Clin. Nutr. 2012, 66, 150–155. [Google Scholar] [CrossRef] [Green Version]
- Moore, L.V.; Pinard, C.A.; Yaroch, A.L. Features in grocery stores that motivate shoppers to buy healthier foods, ConsumerStyles 2014. J. Community Health 2016, 41, 812–817. [Google Scholar] [CrossRef]
- VanKim, N.A.; Erickson, D.J.; Laska, M.N. Food shopping profiles and their association with dietary patterns: A latent class analysis. J. Acad. Nutr. Diet. 2015, 115, 1109–1116. [Google Scholar] [CrossRef] [Green Version]
Table 1.
Items used in the purchase intention (PI) scale.
Table 1.
Items used in the purchase intention (PI) scale.
| PI | Description |
|---|
| PI 1 | I am considering purchasing the product. |
| PI 2 | I will purchase the product as soon as possible. |
| PI 3 | If there is a chance, I have the intention to buy the product. |
Table 2.
Items used in the unhealthy = tasty intuition (UTI) scale.
Table 2.
Items used in the unhealthy = tasty intuition (UTI) scale.
| UTI | Description |
|---|
| UTI 1 | Things that are good for me rarely taste good. |
| UTI 2 | There is no way to make food healthier without sacrificing taste. |
| UTI 3 | Healthy food is usually less tasty. |
Table 3.
Items used in the food neophobia scale (FNS).
Table 3.
Items used in the food neophobia scale (FNS).
| FNS | Description |
|---|
| FNS 1 | I am constantly sampling new and different foods. |
| FNS 2 | I don’t trust new foods. (R) |
| FNS 3 | If I don’t know what is in a food, I won’t try it. (R) |
| FNS 4 | I like foods from different countries. |
| FNS 5 | Ethnic foods look too weird to eat. (R) |
| FNS 6 | At different parties, I will try new foods. |
| FNS 7 | I am afraid to eat things I have never had before. (R) |
| FNS 8 | I am very particular about the foods I will eat. (R) |
| FNS 9 | I will eat almost anything. |
| FNS 10 | I like to try new ethnic restaurants. |
Table 4.
Reliability and validity values from the first experiment: soy sauce products.
Table 4.
Reliability and validity values from the first experiment: soy sauce products.
| Constructs | Item | Factor Loading | Average Variance Extracted | Composite Reliability | Cronbach’s Alpha |
|---|
| Unhealthy = tasty intuition (UTI) | UTI 1 | 0.9021 | 0.8339 | 0.9377 | 0.9013 |
| UTI 2 | 0.9298 |
| UTI 3 | 0.9074 |
| Food neophobia (FNS) | FNS 2 | 0.8295 | 0.7184 | 0.8841 | 0.7184 |
| | FNS 4 | 0.9131 |
| | FNS 5 | 0.7959 |
| Purchase intention for a low-sodium soy sauce product (PI) | PI 1 | 0.8542 | 0.7504 | 0.9000 | 0.7504 |
| PI 2 | 0.8216 |
| PI 3 | 0.9201 |
Table 5.
Reliability and validity values from the second experiment: yogurt products.
Table 5.
Reliability and validity values from the second experiment: yogurt products.
| Constructs | Item | Factor Loading | Average Variance Extracted | Composite Reliability | Cronbach’s Alpha |
|---|
| Unhealthy = tasty intuition (UTI) | UTI 1 | 0.9216 | 0.7784 | 0.9129 | 0.8773 |
| UTI 2 | 0.7956 |
| UTI 3 | 0.9234 |
| Food neophobia (FNS) | FNS 2 | 0.7278 | 0.6126 | 0.8629 | 0.7882 |
| | FNS 4 | 0.8751 |
| | FNS 5 | 0.7579 |
| | FNS 8 | 0.7621 |
| Purchase intention for a low-sodium soy sauce product (PI) | PI 1 | 0.9055 | 0.7869 | 0.9171 | 0.8656 |
| PI 2 | 0.9018 |
| PI 3 | 0.8528 |
Table 6.
Correlations of the latent variables and the square root of the average variance extracted from the first experiment: soy sauce products.
Table 6.
Correlations of the latent variables and the square root of the average variance extracted from the first experiment: soy sauce products.
| | (1) | (2) | (3) |
|---|
| (1) Unhealthy = tasty intuition | (0.9132) | | |
| (2) Food neophobia | −0.1857 | (0.8476) | |
| (3) Purchase intention for a low-sodium soy sauce product | −0.1482 | 0.0983 | (0.8663) |
Table 7.
Correlations of the latent variables and the square root of the average variance extracted from the second experiment: yogurt products.
Table 7.
Correlations of the latent variables and the square root of the average variance extracted from the second experiment: yogurt products.
| | (1) | (2) | (3) |
|---|
| (1) Unhealthy = tasty intuition | (0.8823) | | |
| (2) Food neophobia | −0.1126 | (0.7827) | |
| (3) Purchase intention for a low-sodium soy sauce product | −0.0503 | 0.1723 | (0.8871) |
Table 8.
Multiple regression analysis results.
Table 8.
Multiple regression analysis results.
| | | Purchase Intention for a Low-Sodium Soy Sauce Product | Purchase Intention for a Low-Sugar Yogurt Product |
|---|
| Type | Independent Variable | Stan.B | p-Value | Stan.B | p-Value |
|---|
| Previous Choice | PC | 0.2905 | 0.0000 *** | 0.3554 | 0.0000 *** |
| Unhealthy = tasty intuition | UTI | −0.1067 | 0.0163 * | 0.0007 | 0.9875 |
| Food neophobia | FNS | 0.0955 | 0.0334 * | 0.1214 | 0.0048 ** |
| Control Variable | Age_20 a) | −0.2106 | 0.0003 *** | −0.1730 | 0.0011 ** |
| | Age_30 a) | −0.1409 | 0.0119 * | −0.0580 | 0.2756 |
| | Age_40 a) | −0.0665 | 0.2195 | −0.0895 | 0.0826 |
| | Income | 0.0863 | 0.0780 | −0.0416 | 0.3644 |
| | Diet Interest | 0.1440 | 0.0011 ** | 0.1019 | 0.0166 * |
| | Home Cooking interest | 0.0365 | 0.4376 | 0.0593 | 0.1757 |
| | Education | −0.0453 | 0.3293 | 0.0225 | 0.5960 |
| | Grocery shopping frequency | 0.0492 | 0.2580 | 0.1372 | 0.0011 ** |
| | Family size | 0.0098 | 0.8434 | 0.1364 | 0.0039 ** |
| | R2 | 0.1530 | 0.1851 |
| | F-statistic | 8.0000 | 10.1600 |
| | p-value | 0.0000 | 0.0000 |
© 2020 by the authors. Licensee MDPI, Basel, Switzerland. This article is an open access article distributed under the terms and conditions of the Creative Commons Attribution (CC BY) license (http://creativecommons.org/licenses/by/4.0/).


