Beyond Healthiness: The Impact of Traffic Light Labels on Taste Expectations and Purchase Intentions


Abstract
:1. Introduction
1.1. Theoretical Background
1.1.1. Reactance as a Driver of Undesired Effects of Nutrition Labels
1.1.2. Beliefs about the Negative Relation between Health and Taste as a Driver for Undesired Effects
1.1.3. Alternative Theoretical Accounts
1.2. Hypotheses
2. Method
2.1. Participants
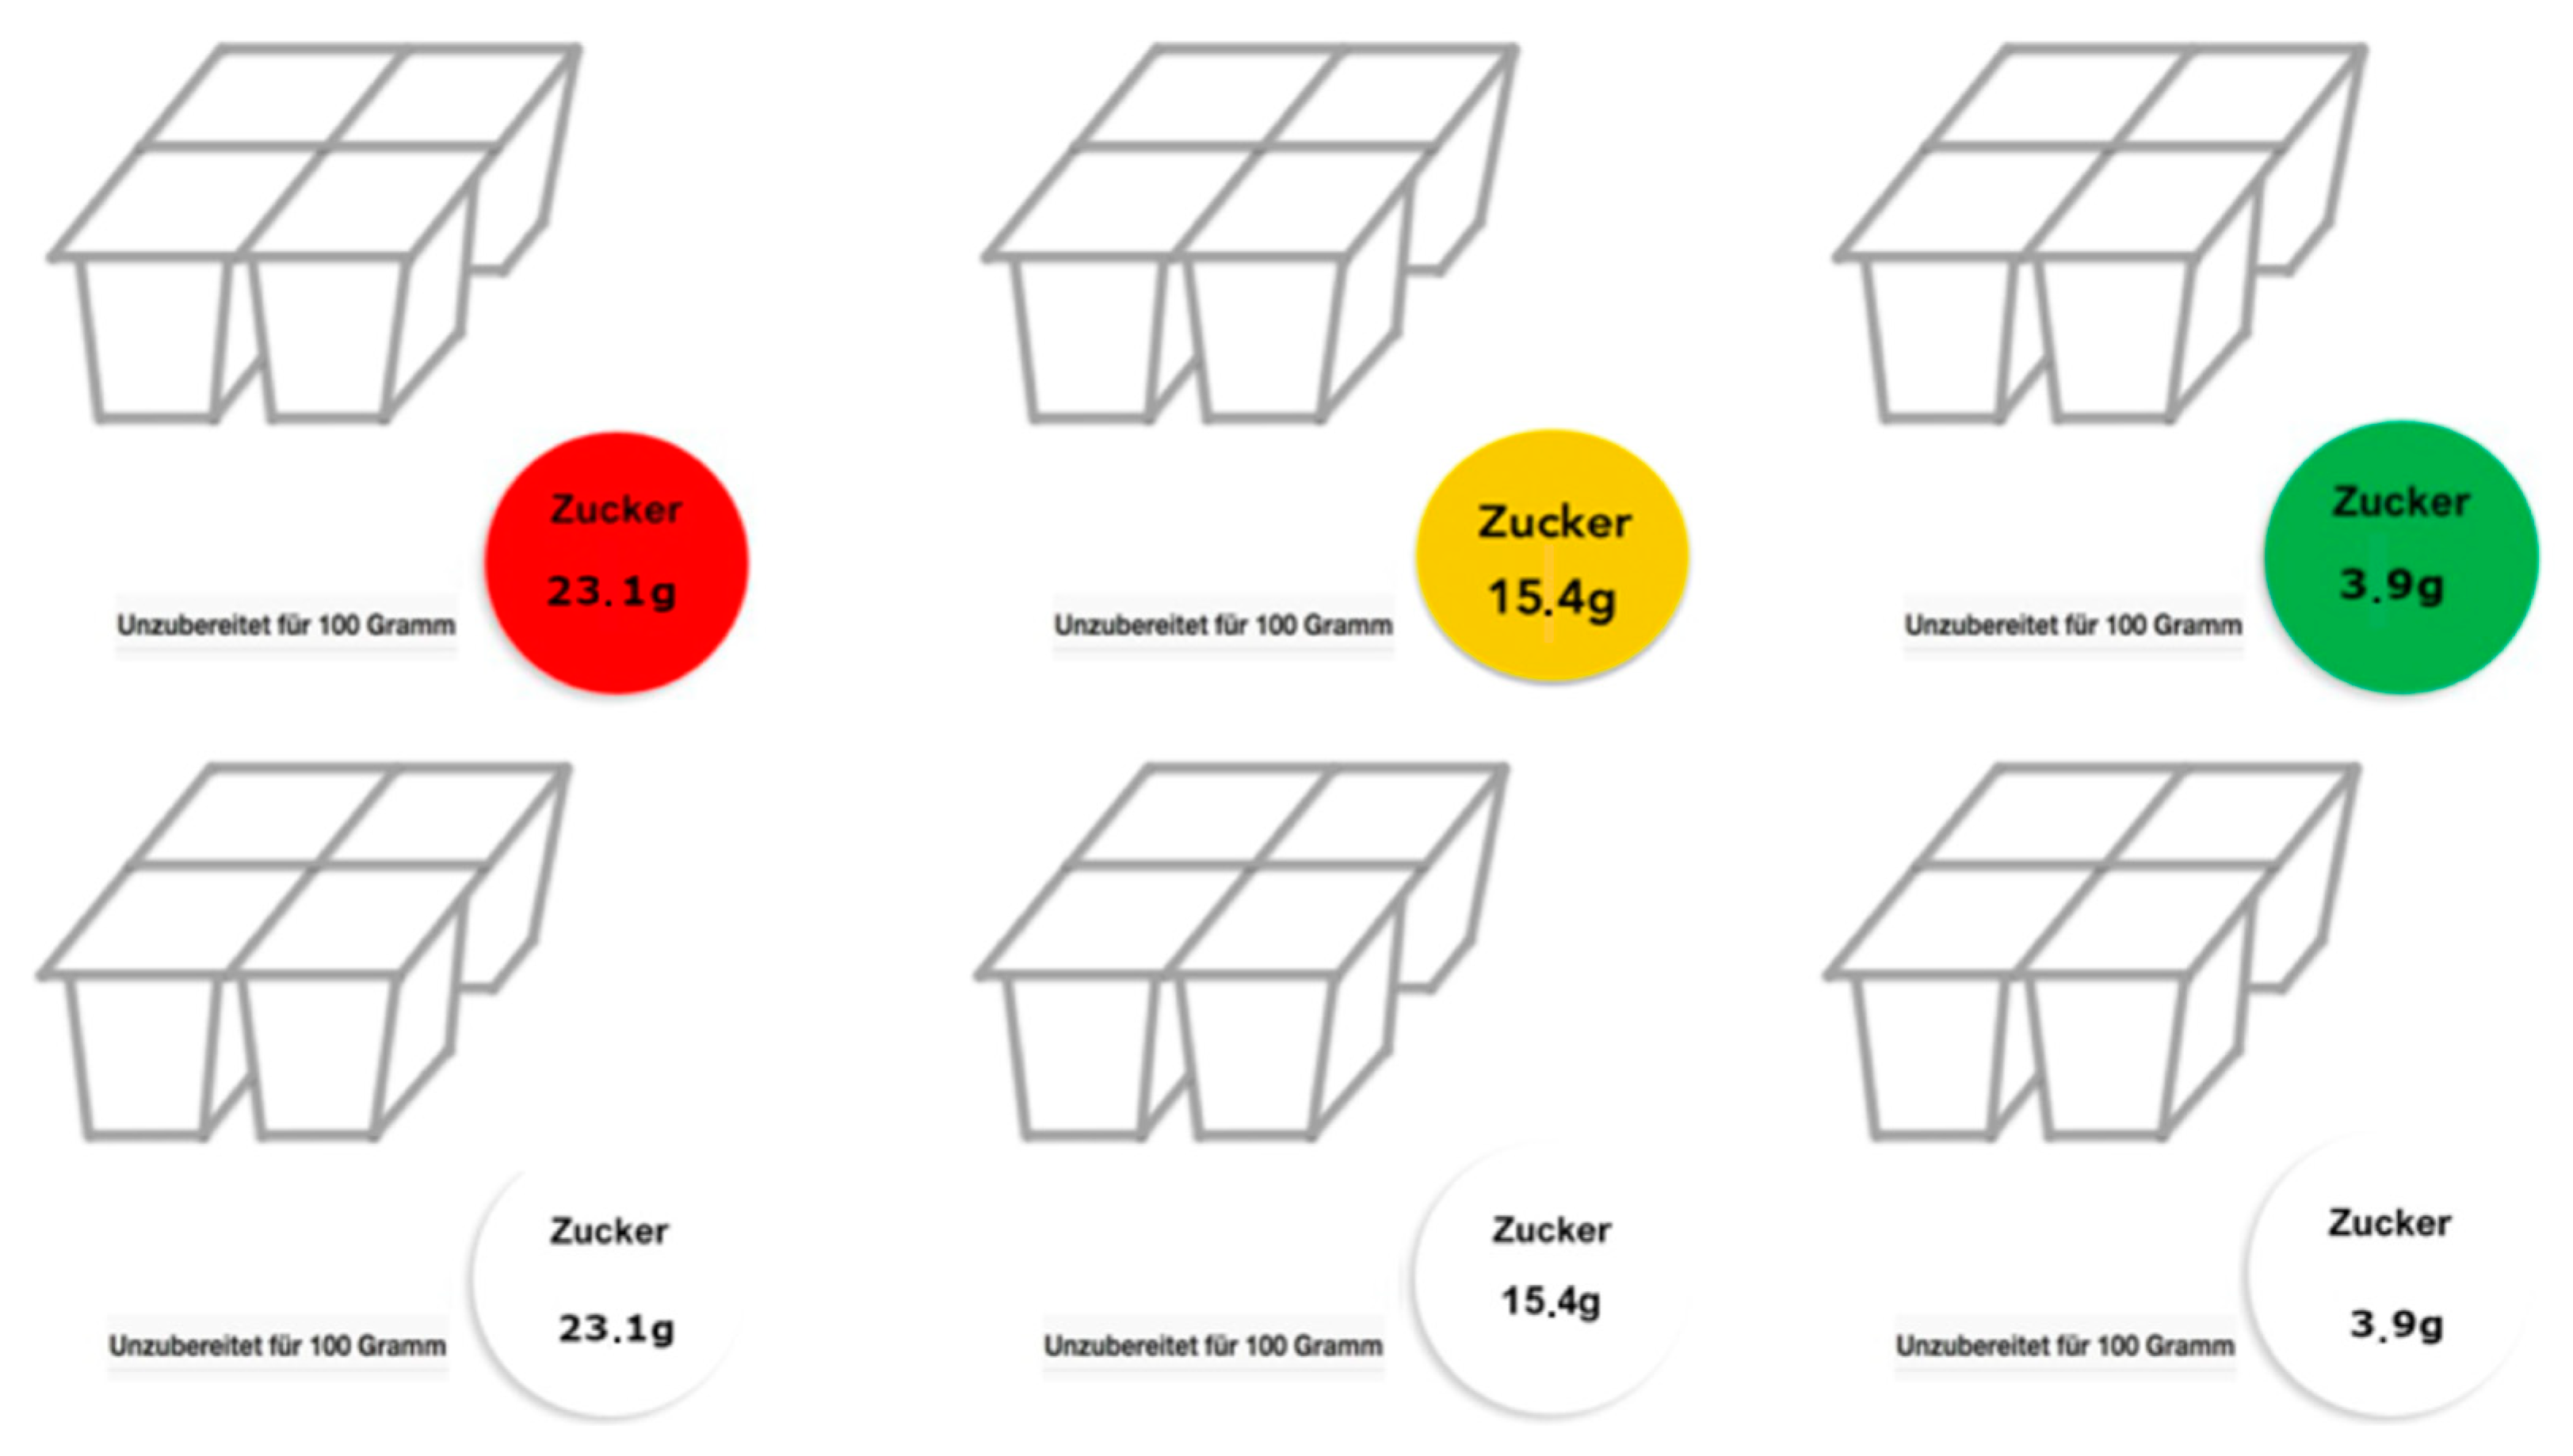
2.2. Materials
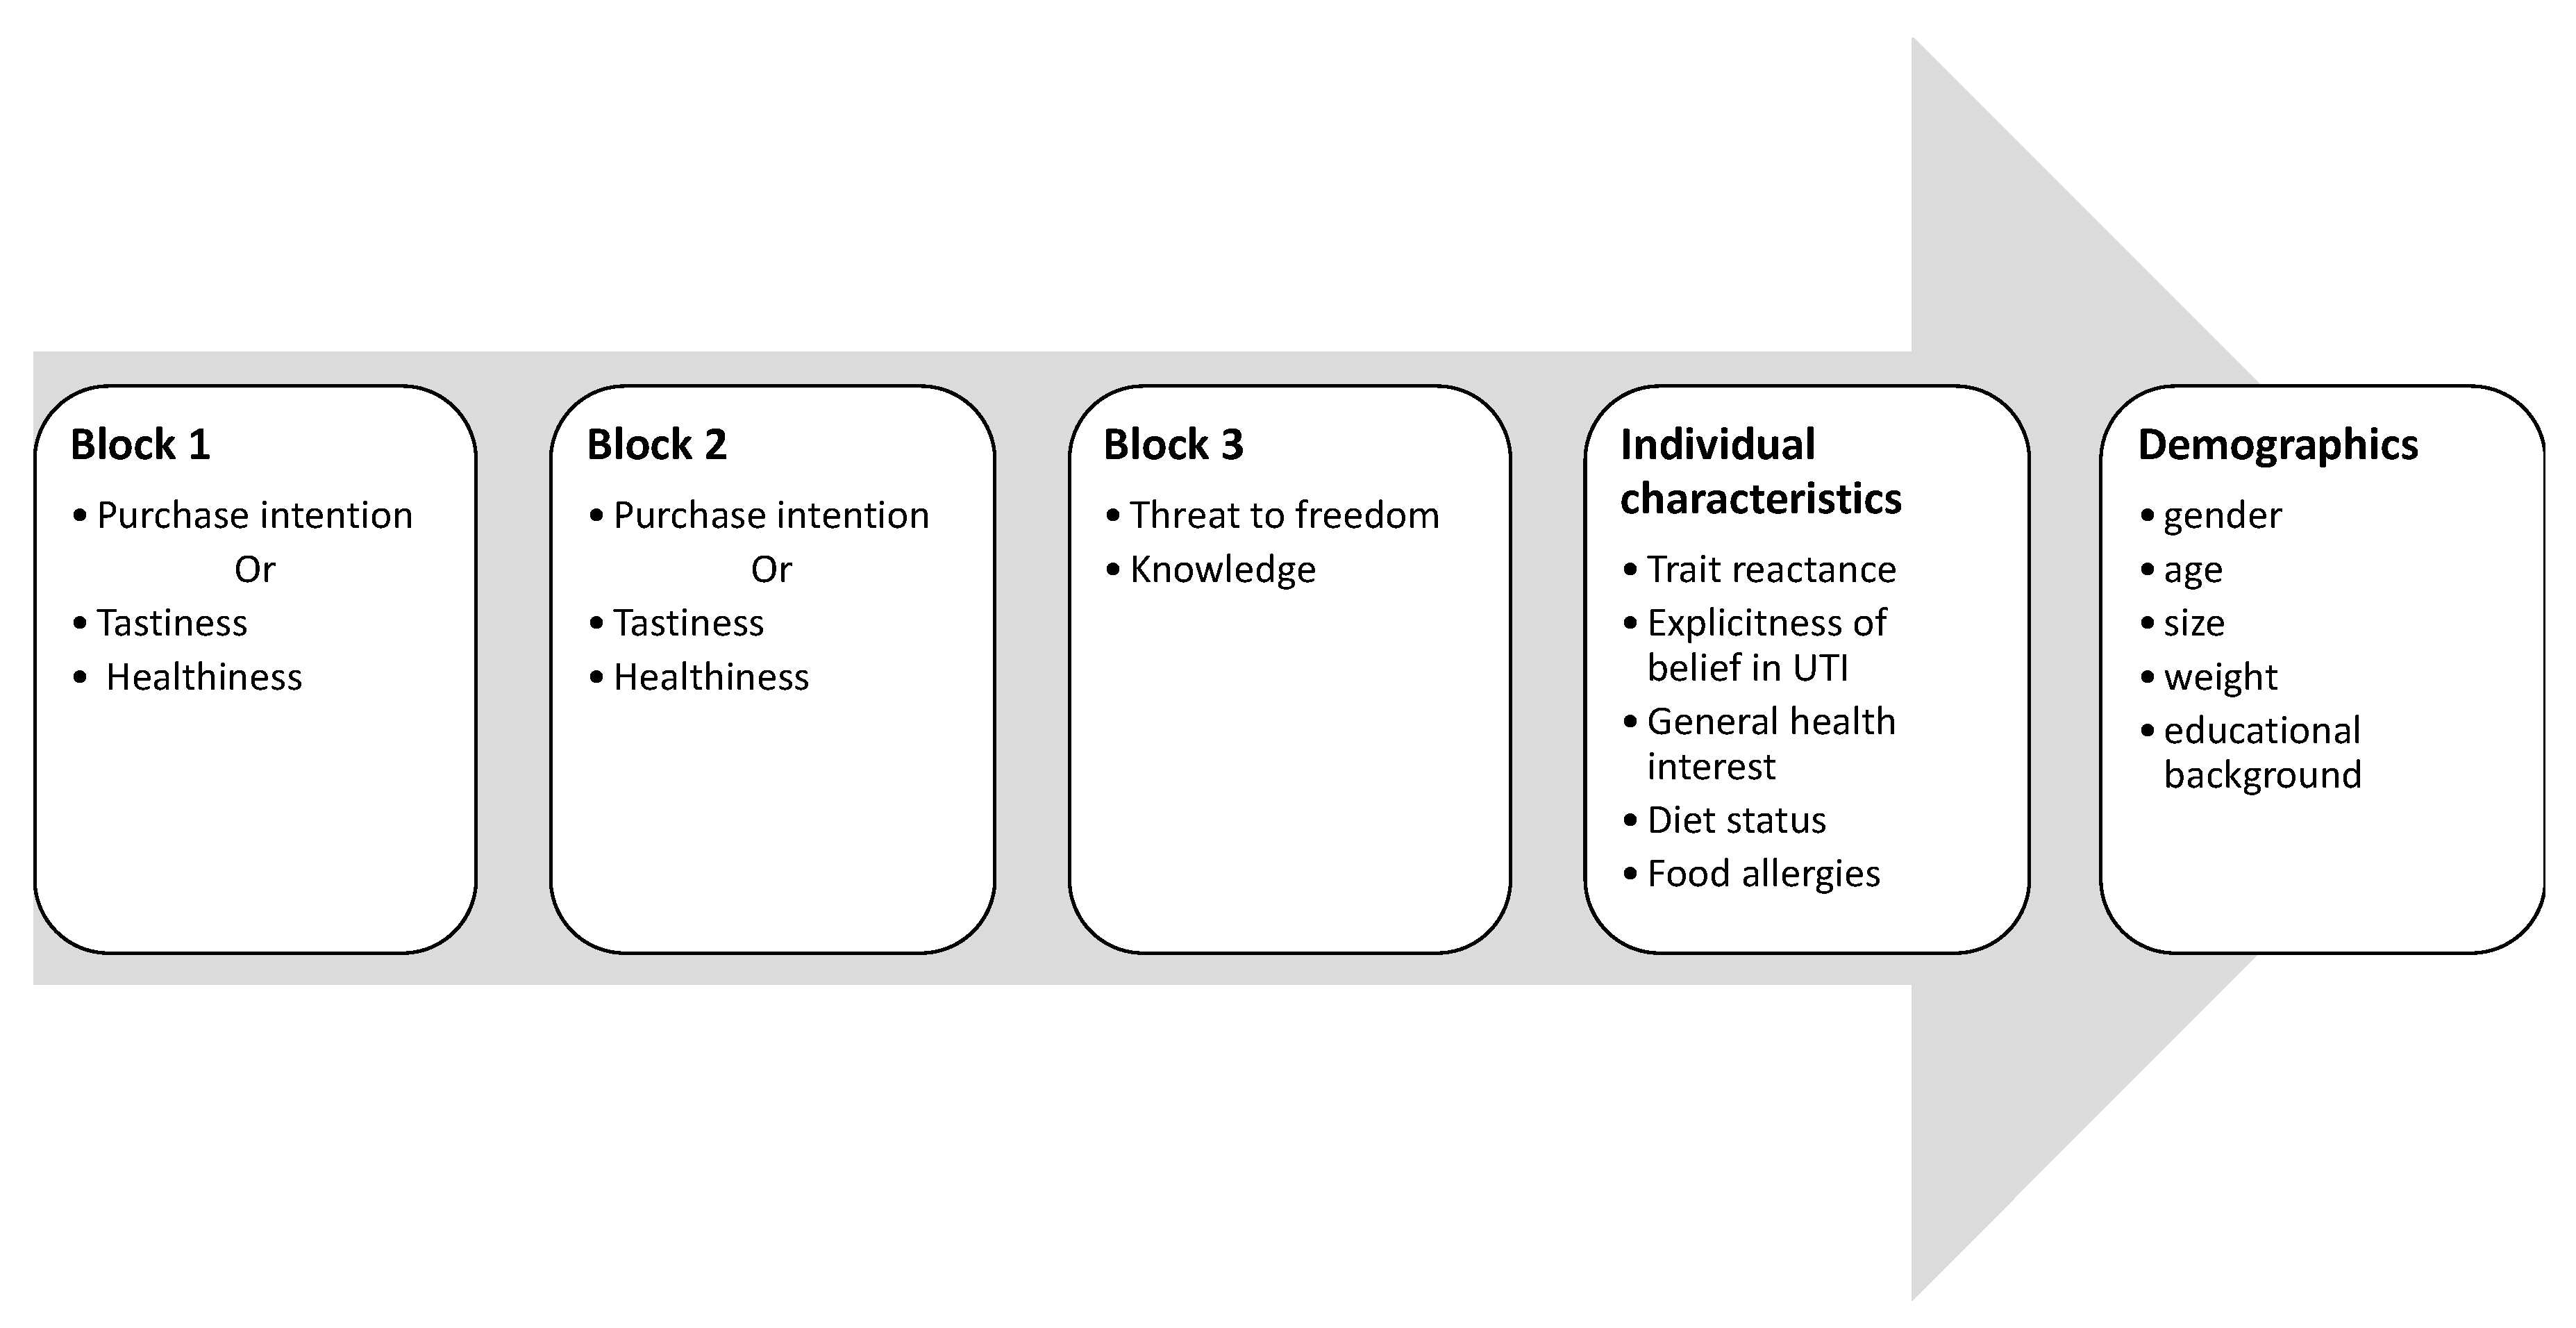
2.3. Design and Procedure
2.4. Data Analysis
3. Results
3.1. Effects of Traffic Light Labels on Knowledge and Perceived Threat to Freedom
3.1.1. Knowledge about Recommendations
3.1.2. Threat to Freedom
3.2. Effects of Traffic Light Labels on Expected Healthiness, Expected Tastiness, and Purchase Intentions
3.2.1. Influence of Traffic Light Labels on Healthiness Expectations
3.2.2. Influence of Traffic Light Labels on Taste Expectations
3.2.3. Influence of Traffic Light Labels on Purchase Intentions
3.3. Effects of Traffic Light Labels on Associations between Healthiness and Tastiness
3.3.1. Influence of Traffic Light Labels on the Belief that Unhealthy Food Tastes better than Healthy Food
3.3.2. Influence of Traffic Light Labels on the Healthiness–Tastiness Relationship
3.3.3. Influence of Traffic Light Labels on the Healthiness–Purchase Intention Relationship
4. Discussion
Supplementary Materials
Author Contributions
Funding
Conflicts of Interest
References
- World Health Organization. Obesity and Overweight. 2018. Available online: https://www.who.int/news-room/fact-sheets/detail/obesity-and-overweight (accessed on 11 November 2019).
- UK FSA. Guide to creating a front of pack (FoP) nutrition label for pre-packed products sold through retail outlets. Food Standards Agency, 2013. Available online: www.dh.gsi.gov.uk (accessed on 11 November 2019).
- Balcombe, K.; Fraser, I.; Falco, S.D. Traffic lights and food choice: A choice experiment examining the relationship between nutritional food labels and price. Food Policy 2010, 35, 211–220. [Google Scholar] [CrossRef] [Green Version]
- Thorndike, A.N.; Riis, J.; Sonnenberg, L.M.; Levy, D.E. Traffic-light labels and choice architecture: Promoting healthy food choices. Am. J. Prev. Med. 2014, 2014 46, 143–149. [Google Scholar] [CrossRef] [Green Version]
- Sonnenberg, L.; Gelsomin, E.; Levy, D.E.; Riis, J.; Barraclough, S.; Thorndike, A.N. A traffic light food labeling intervention increases consumer awareness of health and healthy choices at the point-of-purchase. Prev. Med. 2013, 57, 253–257. [Google Scholar] [CrossRef] [PubMed] [Green Version]
- Sacks, G.; Rayner, M.; Swinburn, B. Impact of front-of-pack “traffic-light” nutrition labelling on consumer food purchases in the UK. Health Promot. Int. 2009, 24, 344–352. [Google Scholar] [CrossRef] [PubMed] [Green Version]
- Sacks, G.; Tikellis, K.; Millar, L.; Swinburn, B. Impact of “traffic-light” nutrition information on online food purchases in Australia. Aust. N. Z. J. Public Health 2011, 35, 122–126. [Google Scholar] [CrossRef]
- Seward, M.W.; Soled, D.R. Unintended consequences in traffic-light food labeling: A call for mixed methods in public health research. J. Am. Coll. Health 2019. [Google Scholar] [CrossRef]
- Seward, M.W.; Block, J.P.; Chatterjee, A. A traffic-light label intervention and dietary choices in college cafeterias. Am. J. Public Health 2016, 106, 1808–1814. [Google Scholar] [CrossRef]
- Brehm, J.W. A Theory of Psychological Reactance; Academic Press: Oxford, UK, 1966. [Google Scholar]
- Raghunathan, R.; Naylor, R.W.; Hoyer, W.D. The unhealthy = tasty intuition and its effects on taste inferences, enjoyment, and choice of food products. J. Mark. 2006, 70, 170–184. [Google Scholar] [CrossRef]
- Aschemann-Witzel, J.; Grunert, K.G.; van Trijp, H.C.M.; Bialkova, S.; Raats, M.M.; Hodgkins, C.; Wasowicz-Kirylo, G. Koenigstorfer, J. Effects of nutrition label format and product assortment on the healthfulness of food choice. Appetite 2013, 71, 63–74. [Google Scholar] [CrossRef]
- Hieke, S.; Wilczynski, P. Colour me in-An empirical study on consumer responses to the traffic light signposting system in nutrition labelling. Public Health Nutr. 2012, 15, 773–782. [Google Scholar] [CrossRef] [Green Version]
- Roberto, C.A.; Bragg, M.A.; Schwartz, M.B.; Seamans, M.J.; Musicus, A.; Novak, N.; Brownell, K.D. Facts up front versus traffic light food labels: A randomized controlled trial. Am. J. Prev. Med. 2012, 43, 134–141. [Google Scholar] [CrossRef] [PubMed]
- Clee, M.A.; Wicklund, R.A. Consumer behavior and psychological reactance. J. Consumer Res. 1980, 6, 389–405. [Google Scholar] [CrossRef]
- Miron, A.M.; Brehm, J.W. Reactance Theory–40 Years Later. Zeitschrift Für Sozialpsychologie 2006, 37, 9–18. [Google Scholar] [CrossRef]
- Wicklund, R.A.; Slattum, V.; Solomon, E. Effects of implied pressure toward commitment on ratings of choice alternatives. J. Exp. Social Psychol. 1970, 6, 449–457. [Google Scholar] [CrossRef]
- Brehm, J.W.; Stires, L.K.; Sensenig, J.; Shaban, J. The attractiveness of an eliminated choice alternative. J. Exp. Social Psychol. 1966, 2, 301–313. [Google Scholar] [CrossRef]
- Byrne, S.; Hart, P.S. The Boomerang effect: A synthesis of findings and a preliminary theoretical framework. Ann. Int. Commun. Assoc. 2009, 33, 3–37. [Google Scholar] [CrossRef]
- Capacci, S.; Mazzocchi, M.; Shankar, B.; Brambila Macias, J.; Verbeke, W.; Pérez-Cueto, F.J.; … Traill, W.B. Policies to promote healthy eating in Europe: A structured review of policies and their effectiveness. Nutr. Rev. 2012, 70, 188–200. [Google Scholar] [CrossRef] [Green Version]
- Cho, H.; Salmon, C.T. Unintended effects of health communication campaigns. J. Commun. 2007, 57, 293–317. [Google Scholar] [CrossRef]
- van’t Riet, J.; Ruiter, R.A.C. Defensive reactions to health-promoting information: An overview and implications for future research. Health Psychol. Rev. 2013, 7, 104–136. [Google Scholar] [CrossRef]
- Grandpre, J.; Alvaro, E.M.; Burgoon, M.; Miller, C.H.; Hall, J.R. Adolescent reactance and anti-smoking campaigns: A theoretical approach. Health Commun. 2003, 15, 349–366. [Google Scholar] [CrossRef]
- Wolburg, J.M. College students’ responses to antismoking messages: Denial, defiance, and other boomerang effects. J. Consum. Aff. 2006, 40, 294–323. [Google Scholar] [CrossRef]
- Bensley, L.S.; Wu, R. The Role of Psychological Reactance in Drinking Following Alcohol Prevention Messages. J. App. Social Psychol. 1991, 2, 1111–1124. [Google Scholar] [CrossRef]
- Foxcroft, D.R.; Lister-Sharp, D.; Lowe, G. Alcohol misuse prevention for young people: A systematic review reveals methodological concerns and lack of reliable evidence of effectiveness. Addiction 1997, 92, 531–537. [Google Scholar] [CrossRef]
- Ringold, D.J. Boomerang effects in response to public health interventions: Some unintended consequences in the alcoholic beverage market. J. Consum. Policy 2002, 25, 27–63. [Google Scholar] [CrossRef]
- Crano, W.D.; Burgoon, M.; Oskamp, S. Mass Media and Drug Prevention: Classic and Contemporary Theories and Research; Lawrence Erlbaum Associates: Mahwah, NJ, USA; London, UK, 2001. [Google Scholar] [CrossRef]
- Fishbein, M.; Hall-Jamieson, K.; Zimmer, E.; Von Haeften, I.; Nabi, R. Avoiding the boomerang: Testing the relative effectiveness of antidrug public service announcements before a national campaign. Am. J. Public Health 2002, 92, 238–245. [Google Scholar] [CrossRef]
- Fisher, J.O.; Birch, L.L. Restricting access to palatable foods affects children’s behavioral response, food selection, and intake. Am. J. Clin. Nutr. 1999, 69, 1264–1272. [Google Scholar] [CrossRef] [Green Version]
- Jansen, E.; Mulkens, S.; Jansen, A. Do not eat the red food!: Prohibition of snacks leads to their relatively higher consumption in children. Appetite 2007, 49, 572–577. [Google Scholar] [CrossRef]
- Dillard, J.P.; Kim, J.; Li, S.S. Anti-sugar-sweetened beverage messages elicit reactance: Effects on attitudes and policy preferences. J. Health Commun. 2018, 23, 703–711. [Google Scholar] [CrossRef]
- Pham, N.; Mandel, N.; Morales, A.C. Messages from the food police: How food-related warnings backfire among dieters. J. Assoc. Consum. Res. 2016, 1, 175–190. [Google Scholar] [CrossRef]
- Werle, C.O.C.; Cuny, C. The boomerang effect of mandatory sanitary messages to prevent obesity. Mark. Lett. 2012, 23, 883–891. [Google Scholar] [CrossRef]
- Wagner, H.; Howland, M.; Mann, T. Effects of subtle and explicit health messages on food choice. Health Psychol. 2015, 34, 79–82. [Google Scholar] [CrossRef] [Green Version]
- Bushman, B.J. Effects of warning and information labels on consumption of full-fat, reduced-fat, and no-fat products. J. App. Psychol. 1998, 83, 97–101. [Google Scholar] [CrossRef] [PubMed]
- Weber, M. The Protestant Work Ethic and the Spirit of Capitalism, 2nd ed.; Roxbury: Los Angeles, CA, USA, 1998. [Google Scholar]
- Machiels, C.J.A.; Karnal, N. See how tasty it is? Effects of symbolic cues on product evaluation and taste. Food Qual. Prefer. 2016, 52, 195–202. [Google Scholar] [CrossRef]
- Haasova, S.; Florack, A. Sugar labeling: How numerical information of sugar content influences healthiness and tastiness expectations. PLoS ONE 2019, 14, e0223510. [Google Scholar] [CrossRef] [PubMed]
- Kunz, S.; Haasova, S.; Florack, A. Fifty shades of food: The influence of package color saturation on health and taste in consumer judgments. Psychol. Mark. 2019. [Google Scholar] [CrossRef]
- Cho, Y.J.; Thrasher, J.F.; Swayampakala, K.; Yong, H.H.; McKeever, R.; Hammond, D.; Anshari, D.; Cummings, K.M.; Borland, R. Does reactance against cigarette warning labels matter? Warning label responses and downstream smoking cessation amongst adult smokers in Australia, Canada, Mexico and USA. PLoS ONE 2016, 11, e0159245. [Google Scholar] [CrossRef]
- Wang, Q.; Oostindjer, M.; Amdam, G.V.; Egelandsdal, B. Snacks with nutrition labels: Tastiness perception, healthiness perception, and willingness to pay by Norwegian adolescents. J. Nutr. Educ. Behav. 2016, 48, 104–111. [Google Scholar] [CrossRef] [Green Version]
- Bullock, K.; Lahne, J.; Pope, L. Investigating the role of health halos and reactance in ice cream choice. Food Qual. Prefer. 2020, 80, 103826. [Google Scholar] [CrossRef]
- Haasova, S.; Florack, A. Practicing the (un)healthy = tasty intuition: Toward an ecological view of the relationship between health and taste in consumer judgments. Food Qual. Prefer. 2019, 75, 39–53. [Google Scholar] [CrossRef]
- Hong, S.M.; Faedda, S. Refinement of the Hong psychological reactance scale. Educ. Psychol. Meas. 1996, 56, 173–182. [Google Scholar] [CrossRef]
- Roininen, K.; Lähteenmäki, L.; Tuorila, H. Quantification of consumer attitudes to health and hedonic characteristics of foods. Appetite 1999, 33, 71–88. [Google Scholar] [CrossRef] [PubMed]
- Talk Online Panel GmbH. 2019. The Talk Group. Available online: https://b2b.talkonlinepanel.com/gb (accessed on 17 January 2020).
- Podsakoff, P.M.; MacKenzie, S.B.; Lee, J.Y.; Podsakoff, N.P. Common method biases in behavioral research: A critical review of the literature and recommended remedies. J. App. Psychol. 2003, 88, 879–903. [Google Scholar] [CrossRef] [PubMed]
- Dillard, J.P.; Shen, L. On the nature of reactance and its role in persuasive health communication. Commun. Monogr. 2005, 72, 144–168. [Google Scholar] [CrossRef]
- Maxwell, S.E.; Delaney, H.D. Designing Experiments and Analyzing Data: A Model Comparison Perspective; Psychology Press: New York, NY, USA, 2004. [Google Scholar]
- Jones, G.; Richardson, M. An objective examination of consumer perception of nutrition information based on healthiness ratings and eye movements. Public Health Nutr. 2007, 10, 238–244. [Google Scholar] [CrossRef] [Green Version]
- Cowburn, G.; Stockley, L. Consumer understanding and use of nutrition labelling: A systematic review. Public Health Nutr. 2005, 8, 21–28. [Google Scholar] [CrossRef] [Green Version]
- Friese, M.; Engeler, M.; Florack, A. Self-perceived successful weight regulators are less affected by self-regulatory depletion in the domain of eating behavior. Eating Behav. 2015, 16, 5–8. [Google Scholar] [CrossRef]
- Florack, A.; Keller, J.; Palcu, J. Regulatory focus in economic contexts. J. Econ. Psychol. 2013, 38, 127–137. [Google Scholar] [CrossRef]
- Florack, A.; Palcu, J.; Friese, M. The moderating role of regulatory focus on the social modeling of food intake. Appetite 2013, 69, 114–122. [Google Scholar] [CrossRef]
- Leder, S.; Florack, A.; Keller, J. Self-regulation and protective health behaviour: How regulatory focus and anticipated regret are related to vaccination decisions. Psychol. Health 2015, 30, 165–188. [Google Scholar] [CrossRef]
- Li, T.; Dando, R. Impact of common food labels on consumer liking in vanilla yogurt. Foods 2019, 8, 584. [Google Scholar] [CrossRef] [Green Version]


| Overall (N = 157) | Traffic Light Label (N = 79) | Neutral Label (N = 78) | |
|---|---|---|---|
| Age (years) | |||
| Mean (SD) | 49.20 (18.01) | 49.49 (17.57) | 48.91 (18.56) |
| Minimum-Maximum | 18–83 | 20–83 | 18–80 |
| Gender | |||
| Male | 82 (52.2%) | 47 (59.5%) | 35 (44.9%) |
| Female | 75 (47.8%) | 32 (40.5%) | 43 (55.1%) |
| BMI | |||
| Mean (SD) | 25.52 (4.26) | 25.28 (4.07) | 25.77 (4.46) |
| Minimum-Maximum | 16.60–38.51 | 16.60–37.45 | 18.37–38.51 |
| Diet | |||
| Yes | 6 (3.4%) | 5 (6.3%) | 1 (1.3%) |
| No | 151 (96.2%) | 74 (93.7%) | 77 (98.7%) |
| Food allergies | |||
| Yes | 26 (16.6%) | 14 (17.7%) | 12 (15.4%) |
| No | 131 (83.4%) | 65 (82.3%) | 66 (84.6%) |
| Educational background | |||
| Compulsory school | 31 (19.7%) | 20 (25.3%) | 11 (14.1%) |
| Middle/secondary school | 4 (2.5%) | 4 (5.1%) | - |
| Vocational school/training | 79 (50.3%) | 40 (50.5%) | 39 (50.0%) |
| High school | 24 (15.3%) | 7 (8.9%) | 17 (21.8%) |
| University/college degree | 18 (11.5%) | 8 (10.1%) | 10 (12.8%) |
| Other | 1 (0.6%) | - | 1 (1.3%) |
| Variable | M (SD) | α |
|---|---|---|
| Belief in unhealthy = tasty intuition | 4.17 (2.27) | 0.81 |
| General health interest | 4.31 (1.09) | 0.81 |
| Trait reactance | 2.45 (0.75) | 0.70 |
| Parameter | Outcome Variable | |
|---|---|---|
| Knowledge | Threat to Freedom | |
| Fixed effects | ||
| Intercept | 8.16 *** (0.26) | 2.69 *** (0.23) |
| Condition | 0.27 (0.36) | 0.02 (0.32) |
| Sugar level | −2.09 *** (0.13) | −0.21 ** (0.08) |
| Condition × Sugar level | −0.59 ** (0.19) | −0.31 ** (0.11) |
| Knowledge | Threat to Freedom | ||||||
|---|---|---|---|---|---|---|---|
| M | M | ||||||
| Overall | Traffic Light Label | Neutral Label | Overall | Traffic Light Label | Neutral Label | ||
| Overall | 7.22 x | 7.26 x | Overall | 2.50 x | 2.59 x | ||
| Low sugar | 5.90 a | 5.74 ax | 6.07 ax | Low sugar | 2.33 a | 2.18 ax | 2.47 ax |
| Original sugar | 7.53 b | 7.50 bx | 7.56 bx | Original sugar | 2.61 b | 2.63 bx | 2.60 abx |
| High sugar | 8.29 c | 8.43 cx | 8.16 cx | High sugar | 2.70 b | 2.71 bx | 2.69 bx |
| Parameter | Outcome Variable | ||
|---|---|---|---|
| Healthiness | Tastiness | Purchase Intention | |
| Fixed effects | |||
| Intercept | 3.53 *** (0.19) | 5.90 *** (0.22) | 3.64 *** (0.24) |
| Condition | −0.34 (0.27) | 0.09 (0.31) | 0.24 (0.34) |
| Sugar level | 1.31 *** (0.10) | 0.13 (0.14) | 0.73 *** (0.06) |
| Condition × Sugar level | 0.86 *** (0.14) | 0.23 (0.20) | 0.73 ** (0.21) |
| Healthiness | Tastiness | ||||||
|---|---|---|---|---|---|---|---|
| M (SD) | M (SD) | ||||||
| Overall | Traffic Light Label | Neutral Label | Overall | Traffic Light Label | Neutral Label | ||
| Overall | 4.20 x | 4.06 x | Overall | 6.13 x | 5.97 x | ||
| Low sugar | 5.10 a | 5.35 ax | 4.84 ax | Low sugar | 6.19 a | 6.35 ax | 6.0 ax |
| Original sugar | 3.96 b | 4.08 bx | 3.82 bx | Original sugar | 6.00 ab | 6.03 abx | 5.96 ax |
| High sugar | 3.35 c | 3.18 cx | 3.53 cx | High sugar | 5.95 b | 6.00 bx | 5.90 ax |
| Purchase Intention | |||
|---|---|---|---|
| M (SD) | |||
| Overall | Traffic Light Label | Neutral Label | |
| Overall | 4.51 x | 4.01 x | |
| Low sugar | 4.85 a | 5.33 ax | 4.37 ay |
| Original sugar | 4.16 b | 4.31 bx | 4.02 ax |
| High sugar | 3.76 c | 3.88 cx | 3.64 bx |
| Parameter | Outcome Variable | |
|---|---|---|
| Tastiness | Purchase Intention | |
| Fixed effects | ||
| Intercept | 5.98 *** (0.21) | 4.03 *** (0.21) |
| Condition | 0.14 (0.29) | 0.45 (0.29) |
| Healthiness | 0.17 *** (0.03) | 0.34 *** (0.04) |
| Condition × Healthiness | −0.07 (0.04) | −0.02 (0.05) |
© 2020 by the authors. Licensee MDPI, Basel, Switzerland. This article is an open access article distributed under the terms and conditions of the Creative Commons Attribution (CC BY) license (http://creativecommons.org/licenses/by/4.0/).
Share and Cite
Kunz, S.; Haasova, S.; Rieß, J.; Florack, A. Beyond Healthiness: The Impact of Traffic Light Labels on Taste Expectations and Purchase Intentions. Foods 2020, 9, 134. https://doi.org/10.3390/foods9020134
Kunz S, Haasova S, Rieß J, Florack A. Beyond Healthiness: The Impact of Traffic Light Labels on Taste Expectations and Purchase Intentions. Foods. 2020; 9(2):134. https://doi.org/10.3390/foods9020134
Chicago/Turabian StyleKunz, Sonja, Simona Haasova, Jannik Rieß, and Arnd Florack. 2020. "Beyond Healthiness: The Impact of Traffic Light Labels on Taste Expectations and Purchase Intentions" Foods 9, no. 2: 134. https://doi.org/10.3390/foods9020134