The Effect of Moringa oleifera Leaf Powder on the Physical Quality, Nutritional Composition and Consumer Acceptability of White and Brown Breads


Abstract
:1. Introduction
2. Methodology
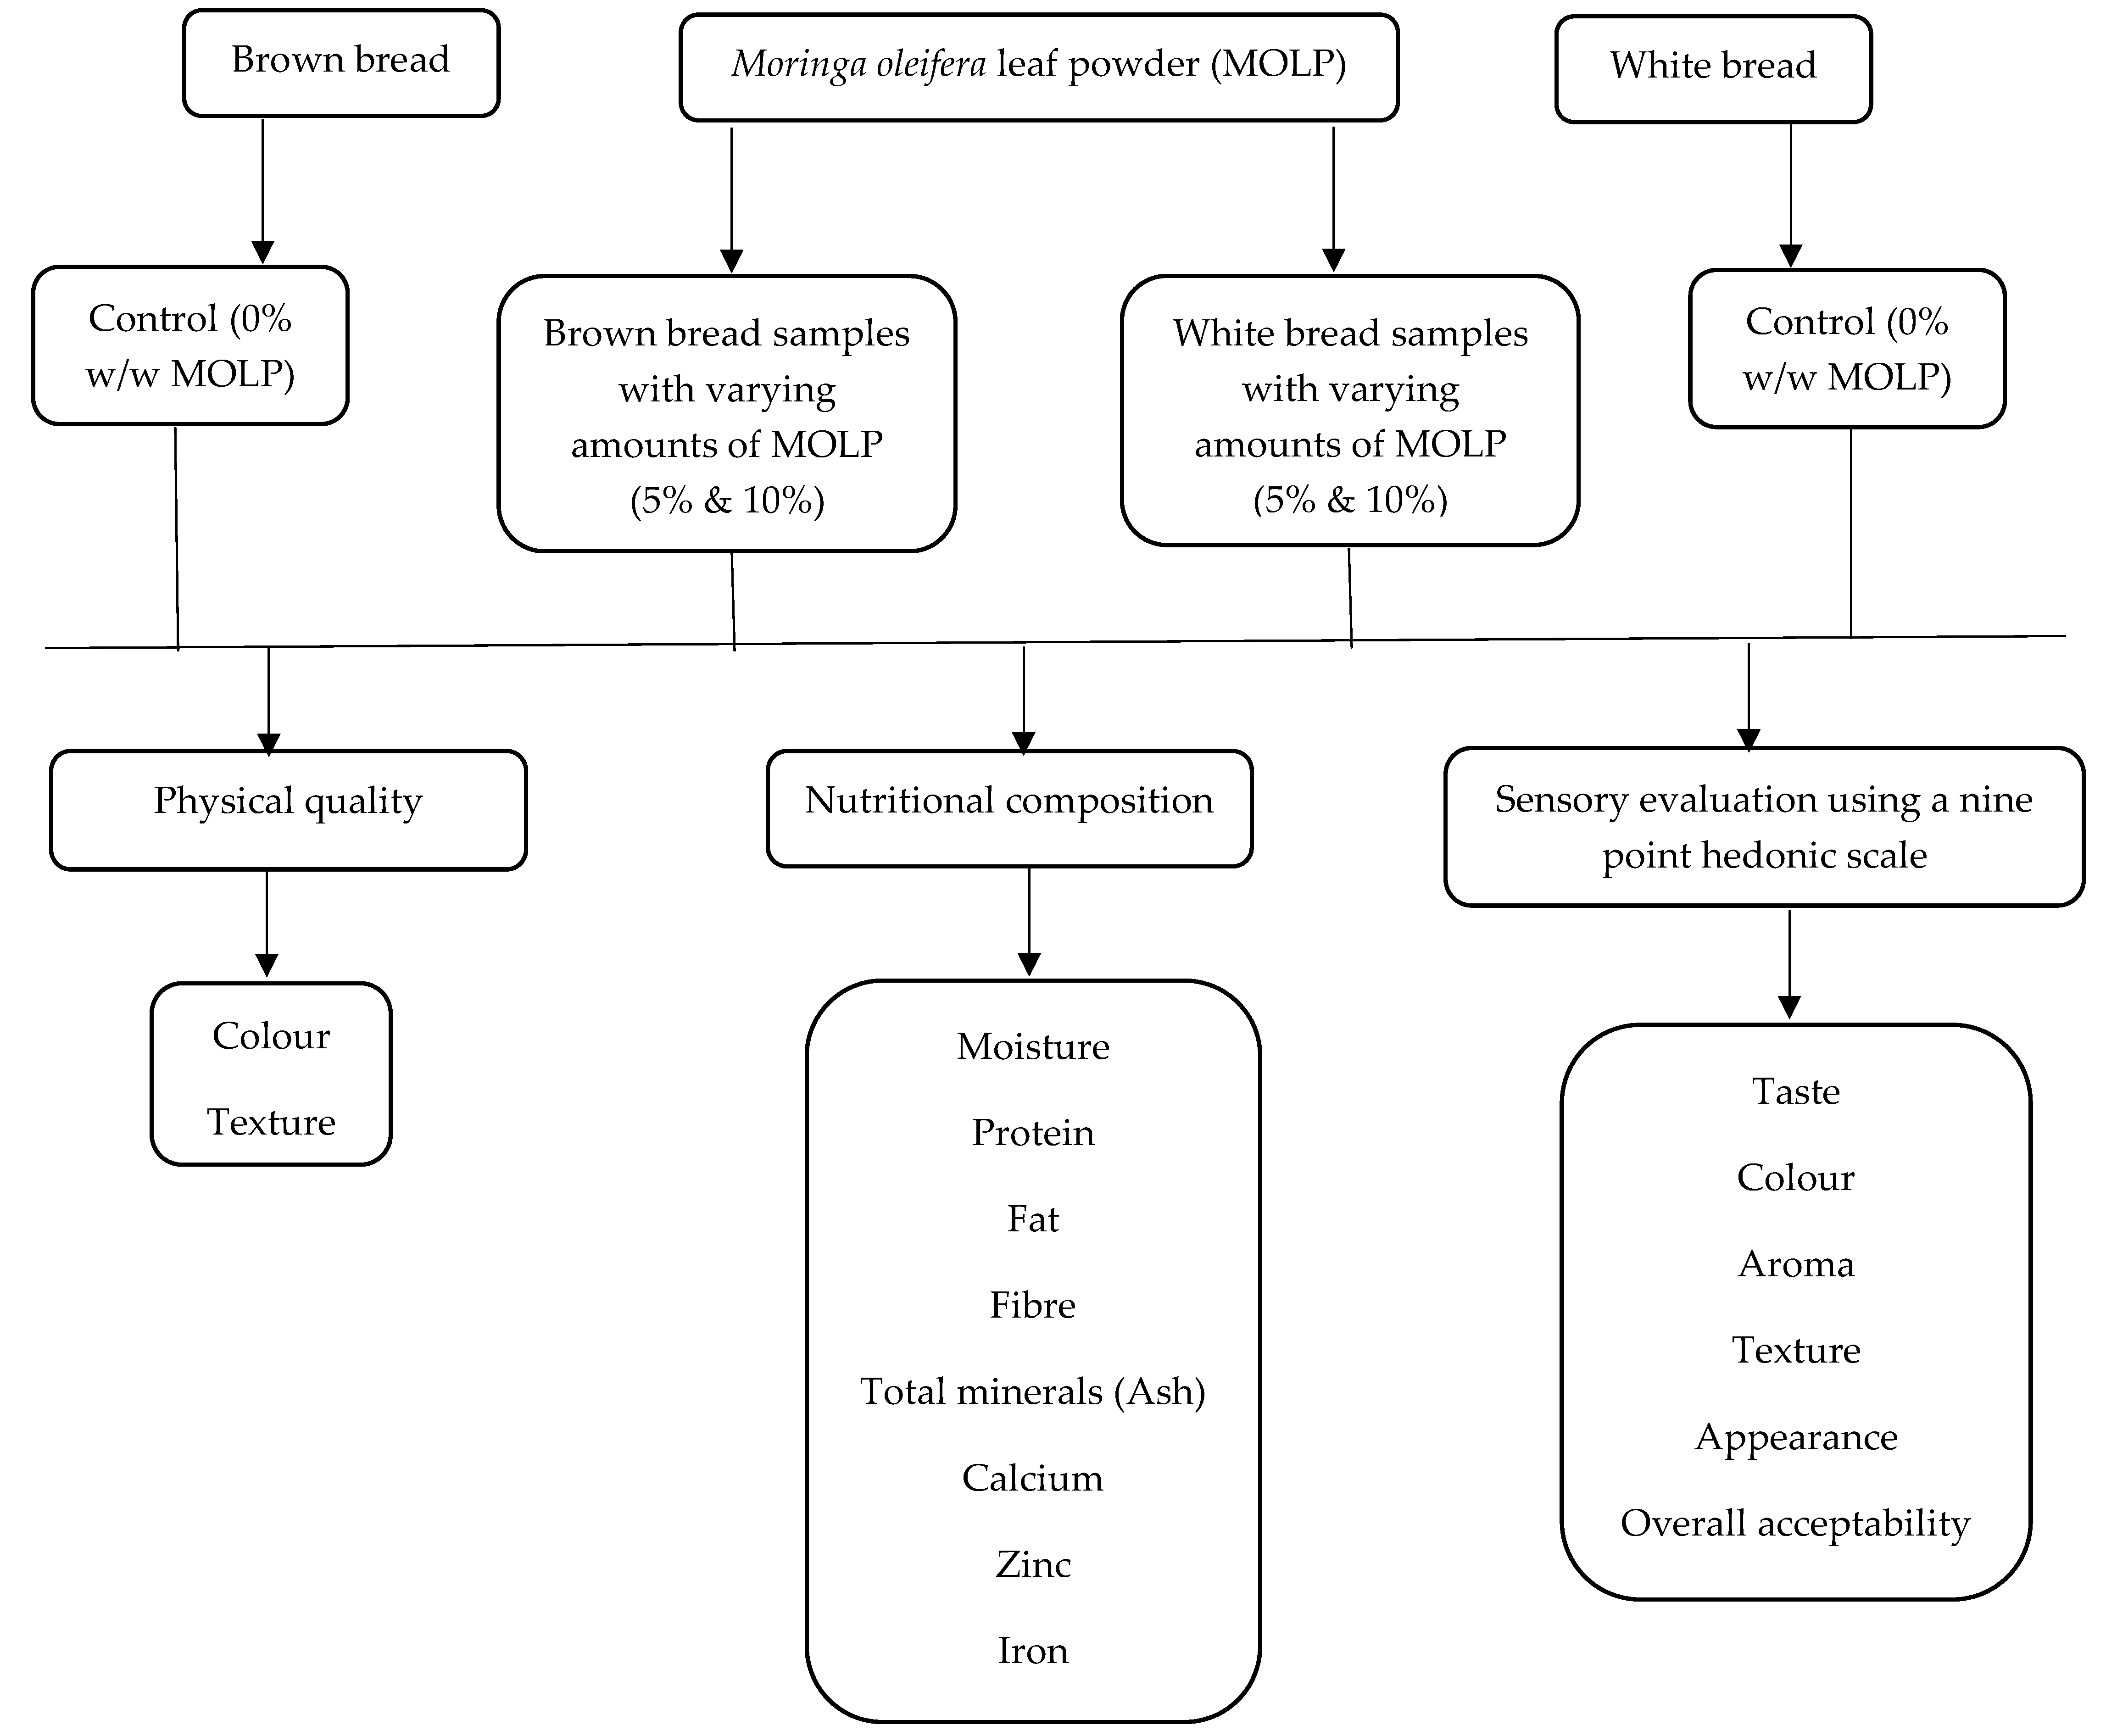
2.1. Study Design
2.2. Preparation of Bread
2.2.1. Ingredients
- 180–250 mL lukewarm water;
- 300 g brown/white bread flour;
- 10 g dry yeast;
- 3.8 g salt;
- 15 mL melted butter;
- 15 g or 30 g MOLP for substitution (This will be added after the flour and salt is sifted).
2.2.2. Method
2.3. Physical Quality
2.4. Nutritional Composition
2.4.1. Moisture
2.4.2. Protein
2.4.3. Fat
2.4.4. Fibre (NDF)
2.4.5. Total Mineral Content (Ash)
2.4.6. Calcium, Zinc and Iron
2.5. Sensory Evaluation
2.6. Ethical Consideration
2.7. Statistical Analysis
3. Results
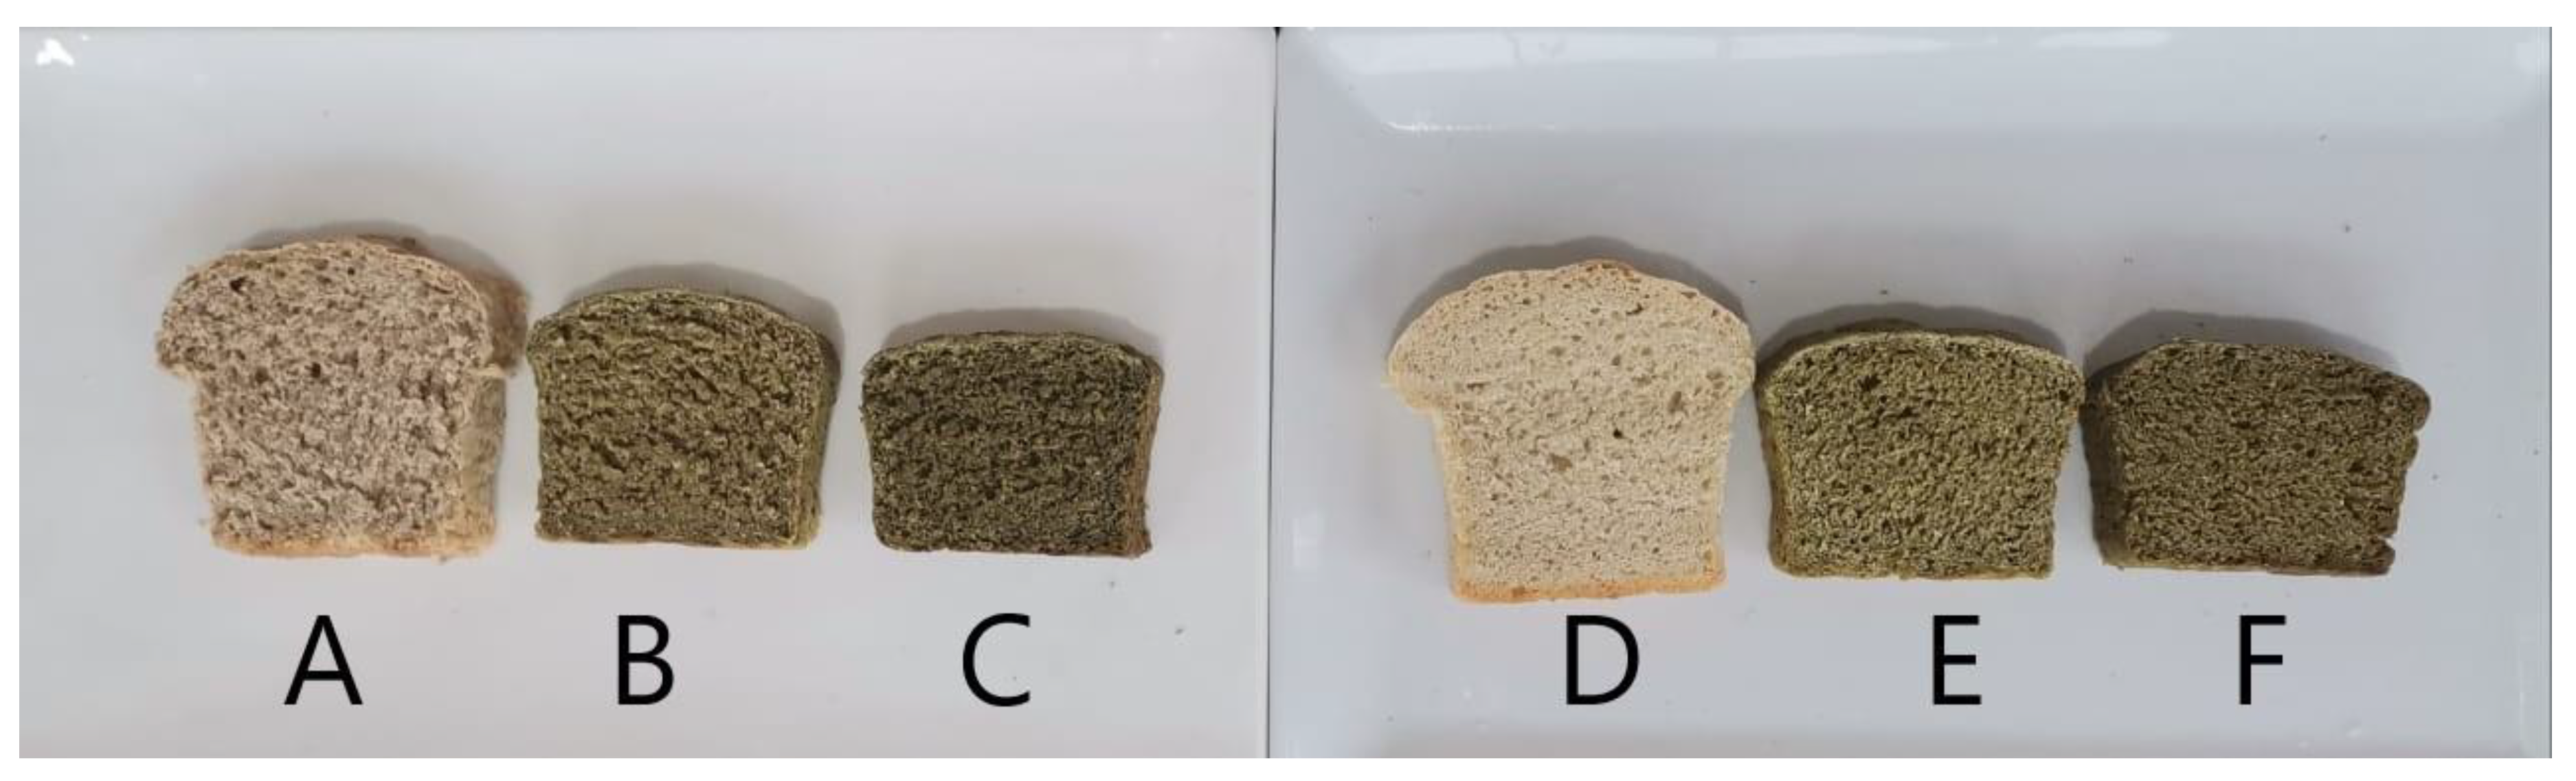
3.1. The Effect of Moringa oleifera Leaf Powder on the Physical Quality of White and Brown Breads
3.2. The Effect of MOLP on the Nutritional Composition of White and Brown Breads
Nutritional Composition of White and Brown Breads Compared to the Estimated Average Requirement
3.3. The Effect of MOLP on the Sensory Acceptability of White and Brown Breads
4. Discussion
5. Conclusions
Author Contributions
Funding
Acknowledgments
Conflicts of Interest
References
- FAO; IFAD; UNICEF; WHO. The State of Food Security and Nutrition in the World 2020. Transforming Food Systems for Affordable Healthy Diets; FAO: Rome, Italy, 2020. [Google Scholar]
- DevelopmentInitiatives. 2020 Global Nutrition Report: Action on Equity to End Malnutrition; Development Initiatives: Bristol, UK, 2020. [Google Scholar]
- NAMC. Food Basket Price Monthly. Available online: https://www.namc.co.za/wp-content/uploads/2020/02/Food-Basket-Feb-2020.pdf (accessed on 20 October 2020).
- Bailey, R.L.; West, K.P., Jr.; Black, R.E. The epidemiology of global micronutrient deficiencies. Ann. Nutr. Metab. 2015, 66, 22–33. [Google Scholar] [CrossRef] [PubMed]
- Laborde, D.; Martin, W.; Vos, R. Poverty and Food Insecurity Could Grow Dramatically as Covid-19 Spreads; Internationla Food Policy Research Institute (IFPRI): Washington, DC, USA, 2020; pp. 16–19. [Google Scholar]
- Van der Hoeven, M.; Osei, J.; Greeff, M.; Kruger, A.; Faber, M.; Smuts, C.M. Indigenous and traditional plants: South african parents’ knowledge, perceptions and uses and their children’s sensory acceptance. J. Ethnobiol. Ethnomed. 2013, 9, 78. [Google Scholar] [CrossRef] [PubMed] [Green Version]
- Method, A.; Tulchinsky, T.H. Commentary: Food Fortification: African Countries Can Make more Progress. Adv. Food Technol. Nutr. Sci. 2015, SE, S22–S28. [Google Scholar] [CrossRef]
- Shah, S.K.; Jhade, D.; Chouksey, R. Moringa oleifera lam. A study of ethnobotany, nutrients and pharmacological profile. Res. J. Pharm. Biol. Chem. Sci. 2016, 7, 2158–2165. [Google Scholar]
- Mutiara, T.; Titi, E.; Estiasih, W. Effect lactagogue moringa leaves (moringa oleifera lam) powder in rats. J. Basic Appl. Sci. Res. 2013, 3, 430–434. [Google Scholar]
- Pasricha, S.-R.; Drakesmith, H.; Black, J.; Hipgrave, D.; Biggs, B.-A. Control of iron deficiency anemia in low-and middle-income countries. Blood 2013, 121, 2607–2617. [Google Scholar] [CrossRef] [PubMed] [Green Version]
- Allen, L.H. Anemia and iron deficiency: Effects on pregnancy outcome. Am. J. Clin. Nutr. 2000, 71, 1280S–1284S. [Google Scholar] [CrossRef]
- Mbikay, M. Therapeutic potential of moringa oleifera leaves in chronic hyperglycemia and dyslipidemia: A review. Front. Pharmacol. 2012, 3, 24. [Google Scholar] [CrossRef] [Green Version]
- Mahan, L.; Raymond, J. Krauses Food & the Nutrition Care Process. 14a; Elsevier Inc.: St. Louis, MA, USA, 2017; p. 1063. [Google Scholar]
- Falowo, A.B.; Mukumbo, F.E.; Idamokoro, E.M.; Lorenzo, J.M.; Afolayan, A.J.; Muchenje, V. Multi-functional application of moringa oleifera lam. In nutrition and animal food products: A review. Food Res. Int. 2018, 106, 317–334. [Google Scholar] [CrossRef]
- Manary, M.J.; Sandige, H.L. Management of acute moderate and severe childhood malnutrition. BMJ 2008, 337, a2180. [Google Scholar] [CrossRef] [Green Version]
- Labadarios, D.; Moodie, I.; Rensburg, A. Vitamin a Status: In: Labadarios d. National Food Consumption Survey: Fortification Baseline, Chapter 9b: South africa 2005; Department of Health: Stellenbosch, South Africa, 2007.
- Department of Health (DoH); United Nations Children’s Fund (UNICEF). A Reflection of the South African Maize Meal and Wheat Flour Fortification Programme (2004 to 2007); Department of Health: Pretoria, South Africa, 2007.
- Labadarios, D.; Swart, R.; Maunder, E.; Kruger, H.; Gericke, G.; Kuzwayo, P.; Ntsie, P.; Steyn, N.; Schloss, I.; Dhansay, M.; et al. The national food consumption survey fortification baseline (nfcs-fb). S. Afr. J. Clin. Nutr. 2008, 21, 246–271. [Google Scholar]
- Statistics South Africa General Household Survey. 2018. Available online: http://www.statssa.gov.za/publications/P0318/P03182018.pdf (accessed on 20 September 2020).
- Ameh, M.O.; Gernah, D.I.; Igbabul, B.D. Physico-chemical and sensory evaluation of wheat bread supplemented with stabilized undefatted rice bran. Food Nutr. Sci. 2013, 4, 43. [Google Scholar] [CrossRef] [Green Version]
- Olushola, A. Achieve Vibrant Health with Nature; University of Jos Consultancy Ltd. Press: Jos, Nigeria, 2006. [Google Scholar]
- Karim, O.; Kayode, R.; Oyeyinka, S.; Oyeyinka, A. Physicochemical properties of stiff dough ‘amala’prepared from plantain (musa paradisca) flour and moringa (moringa oleifera) leaf powder. Hrana Zdr. Boles. Znan. Strucni Cas. Nutr. Dijetetiku 2015, 4, 48–58. [Google Scholar]
- Sengev, A.I.; Abu, J.O.; Gernah, D.I. Effect of moringa oleifera leaf powder supplementation on some quality characteristics of wheat bread. Food Nutr. Sci. 2013, 4, 270. [Google Scholar]
- Bolarinwa, I.F.; Aruna, T.E.; Raji, A.O. Nutritive value and acceptability of bread fortified with moringa seed powder. J. Saudi Soc. Agric. Sci. 2019, 18, 195–200. [Google Scholar] [CrossRef]
- Bourekoua, H.; Różyło, R.; Gawlik-Dziki, U.; Benatallah, L.; Zidoune, M.N.; Dziki, D. Evaluation of physical, sensorial, and antioxidant properties of gluten-free bread enriched with moringa oleifera leaf powder. Eur. Food Res. Technol. 2018, 244, 189–195. [Google Scholar] [CrossRef] [Green Version]
- Ogunsina, B.; Radha, C.; Indrani, D. Quality characteristics of bread and cookies enriched with debittered moringa oleifera seed flour. Int. J. Food Sci. Nutr. 2011, 62, 185–194. [Google Scholar] [CrossRef]
- El-Gammal, R.E.; Ghoneim, G.A.; ElShehawy, S.M. Effect of moringa leaves powder (moringa oleifera) on some chemical and physical properties of pan bread. J. Food Dairy Sci. 2016, 7, 307–314. [Google Scholar] [CrossRef]
- Obichili, O.; Ifediba, D. Sensory acceptability studies of whole wheat bread fortified with moringa leaf powder. South Asian J. Biol. Res. 2019, 2, 58–67. [Google Scholar]
- Smit, S.M.F. The A–Z of Food & Cookery in South Africa, 3rd ed.; Struik Lifestyle: Cape Town, South Africa, 2011. [Google Scholar]
- Afoakwa, E.O.; Yenyi, S.E. Application of response surface methodology for studying the influence of soaking, blanching and sodium hexametaphosphate salt concentration on some biochemical and physical characteristics of cowpeas (vigna unguiculata) during canning. J. Food Eng. 2006, 77, 713–724. [Google Scholar] [CrossRef]
- AOAC. Official Methods of Analysis of the Association of Official Analytical Chemists International, 17th ed.; AOAC International: Gaithersburg, ML, USA, 2003. [Google Scholar]
- Heymann, H. Three-Day Advanced Sensory Analysis Workshop; Agricultural Research Council (ARC): Pretoria, South Africa, 1995. [Google Scholar]
- Medicine, I.O. Dietary dri Refernce Intakes: The Essential Guide to Nutrient Requirement; National Academy Press: Washington, DC, USA, 2006. [Google Scholar]
- Moyo, B.; Masika, P.J.; Hugo, A.; Muchenje, V. Nutritional characterization of moringa (moringa oleifera lam.) leaves. Afr. J. Biotechnol. 2011, 10, 12925–12933. [Google Scholar]


| Authors | Study Methods | Location | Participants | Findings |
|---|---|---|---|---|
| Bolarinwa, Aruna and Raji (2019) [24] | Bread was fortified with 0%, 5%, 10%, 15% and 20% Moringa seed powders. The proximate, mineral and vitamin A contents were determined. A sensory evaluation was conducted using a seven-point hedonic scale to assess consumer acceptability for the sensory attributes—colour, shape, texture, sweetness, flavour, mouthfeel and overall acceptability. | Nigeria | Twenty randomly selected judges. | Study results indicated the as Moringa seed powder was added to bread, there was a significant increase in protein, ash, fat, fibre, phosphorus, potassium, calcium, iron and vitamin A contents. However, there was a decrease in moisture and carbohydrates. The sensory evaluation results indicated that there was no difference between the control bread and the 5% Moringa fortified bread. Further, the bread containing 5% Moringa seed powder was rated the best for the sensory attributes investigated. |
| Obichili and Ifediba (2019) [28] | Experimental research study. Two samples were prepared. The authors prepared a whole wheat bread (control) and a whole wheat bread fortified with Moringa leaf powder (MLP) using the ratio 1:4 (v/v). A nine-point hedonic scale was used to assess the sensory attributes—colour, taste, flavour, texture and general acceptability. | Nigeria | Thirty-seven evaluators categorised into two groups of seven lecturers and 30 registered postgraduate students in the Department of Home Economics, University of Nigeria Nsukka. | The whole wheat bread containing MLP was rated better for the sensory attributes flavour, taste and general acceptability. In contrast, the whole wheat bread (control) was rated better for colour and texture. |
| Bourekoua, Różyło, Gawlik-Dziki et al. (2018) [25] | Gluten-free bread (made with rice semolina) was fortified with 2.5%, 5%, 7.5% and 10% MLP. Antioxidant activity was determined. The sensory acceptability was determined using a nine-point hedonic scale. The following attributes were assessed—taste, aroma, texture, appearance and overall acceptability. | Poland | Fifty-two untrained consumers (23–48 years, 28 females and 24 males) | There was a significant decrease in the volume of the bread samples as MLP was added with the exception of 2.5% MLP. With the addition of 2.5% and 10% MLPs, there was a slight decrease in hardiness and chewiness. The lightness of the bread decreased when MLP was added. As MOLP was increased from 0% to 10%, so too was the antioxidant activity. In comparison to the control, the most acceptable MLP-containing bread was with the addition of 2.5% MLP. |
| El-Gammal, Ghoneim and ElShehawy (2016) [27] | Pan bread was fortified with 5%, 10%, 15% and 20% MLPs. The moisture, fat, ash, crude fibre, magnesium, calcium, copper, zinc and iron contents were determined using standard methods. Sensory evaluation was conducted using the AACC method to access the smoothness, crust colour, crumb colour, taste and overall acceptability. Texture and stalling of the bread were also determined. | Egypt | Fifteen staff members from the Food Industries Department, Faculty of Agriculture, Mansoura University | The Moringa leaf powder contained a high protein, crude fibre, calcium, magnesium, phosphorous and iron content. The pan bread containing MLP had a high protein content but lower carbohydrate content in comparison to the control. Further, the 10% MLP pan bread had higher calcium, magnesium and iron contents compared to the control pan bread. The sensory acceptability decreased as the MLP concentration increased, especially with the 15% and 20% MLPs pan bread. When MLP was increased, there was a decrease in gumminess, chewiness and springiness and a gradual increase in freshness. |
| Sengev, Abu and Gernah (2013) [23] | Bread was prepared using 0%, 1%, 2%, 3%, 4% and 5% MLP. Moisture, crude protein, crude fat, crude fibre and ash content were determined according to standardised methods. The volume and weight of the baked loaves were determined. Meilgaard’s procedure was used to determine the sensory evaluation after 24 h. The sensory attributes of the bread that were evaluated were crust colour, crumb colour, crumb texture, flavour and overall acceptability. | Nigeria | Was not provided | There was a significant increase in the protein, fibre, ash, magnesium, calcium and beta-carotene content and a decrease in iron and copper content as the MLP concentration increased in the bread samples. The volume and loaf height decreased while the weight of the loaf containing MLP increased. There was a negative effect on the sensory evaluation as the MLP concentration increased. |
| Ogunsina, Radha and Indrani (2011) [26] | The bread samples were prepared using 0%, 5%, 10% and 15% dry Moringa oliefera seed flours. The nutritional contents (moisture, crude fat, as, crude protein, crude fibre, iron and calcium) were determined. A quantitative descriptive analysis was used. The sensory evaluation was conducted using a quantified structure scale (crust colour (10); shape (15) and symmetry (15); crumb colour (10); grain (20); mouthfeel (20) and taste (10)). | India | Suitably trained panellists. The total number of panellist was not provided. | This study found that bread fortified with 10% Moringa was acceptable. Additionally, the 10% Moringa fortified bread had higher protein, iron and calcium contents compared to the other samples. |
| Bread Samples (% w/w MOLP Added) | Colour and Texture (Mean ± SD) | |||
|---|---|---|---|---|
| L (Lightness) | a (Redness) | b (Yellowness) | Texture (g) | |
| White bread | ||||
| 0% (control) | 67.14 ± 0.77 e | 1.56 ± 0.05 a | 24.1 ± 0.1 b | 0.09 ± 0.02 a |
| 5% | 54.02 ± 0.14 b,c | 0.86 ± 0.02 a | 27.4 ± 0.1 d | 0.08 ± 0.01 a |
| 10% | 45.97 ± 0.29 a | 1.31 ± 0.05 a | 25.4 ± 0.2 c | 0.13 ± 0.07 a |
| Brown bread | ||||
| 0% (control) | 63.1 ± 0.6 d | 3.02 ± 0.07 b | 21.5 ± 0.3 a | 0.09 ± 0.02 a |
| 5% | 55.8 ± 0.4 c | 2.67 ± 0.19 b | 24.9 ± 0.2 c | 0.08 ± 0.02 a |
| 10% | 51.7 ± 2.0 b | 2.79 ± 0.87 b | 27.5 ± 0.2 d | 0.08 ± 0.03 a |
| Bread Samples (% MOLP Added) | ||||||||
|---|---|---|---|---|---|---|---|---|
| Moisture g/100 g | Ash g/100 g | Fat g/100 g | NDF g/100 g | Protein g/100 g | Calcium mg/kg | Zinc mg/kg | Iron mg/kg | |
| White bread | ||||||||
| 0% (control) | 35.18 ± 1.32 a | 1.97 ± 0.06 a | 3.12 ± 0.11 a | 13.75 ± 0.10 a | 13.68 ± 0.01 c | 0.04 ± 0.00 | 3.00 ± 0.00 a | 6.50 ± 2.83 a |
| 5% | 31.84 ± 0.25 a | 2.40 ± 0.00 b,c | 3.58 ± 0.06 a | 19.02 ± 2.73 a | 13.96 ± 0.00 d | 0.10 ± 0.00 | 3.50 ± 9.90 a | 7.60 ± 2.83 a |
| 10% | 32.39 ± 0.40 a | 2.54 ± 0.15 b,c | 3.33 ± 0.32 a | 14.77 ± 2.94 a | 14.59 ± 0.01 e | 0.15 ± 0.00 | 2.95 ± 0.71 a | 16.55 ± 2.12 b |
| Brown bread | ||||||||
| 0% (control) | 33.56 ± 0.40 a | 2.28 ± 0.01 a,b | 2.98 ± 0.42 a | 23.87 ± 4.86 a | 13.07 ± 0.06 a | 0.03 ± 0.00 | 3.20 ± 0.00 a | 16.50 ± 2.83 b |
| 5% | 38.93 ± 6.93 a | 2.46 ± 0.06 b,c | 2.78 ± 0.02 a | 20.60 ± 1.20 a | 13.16 ± 0.01 ab | 0.05 ± 0.00 | 3.05 ± 0.71 a | 23.20 ± 2.83 c |
| 10% | 33.60 ± 0.10 a | 2.62 ± 0.04 c | 3.36 ± 0.13 a | 17.75 ± 1.14 a | 13.34 ± 0.10 b | 0.09 ± 0.00 | 3.10 ± 0.00 a | 30.95 ± 9.19 d |
| Bread Samples (% MOLP a Added) | 1–3 Years | 4–5 Years | 14–18 Years (Female) | 19–50 Years (Female) | ||||||||
|---|---|---|---|---|---|---|---|---|---|---|---|---|
| Protein (g) | EAR b g/day | % EAR Met | Protein (g) | EAR g/day | % EAR Met | Protein (g) | EAR g/day | % EAR Met | Protein (g) | EAR g/day | % EAR Met | |
| White bread | ||||||||||||
| 0% (control) | 6.15 | 11.31 | 54.4 | 12.30 | 18.24 | 67.4 | 24.60 | 39.05 | 63.0 | 36.90 | 40.92 | 90.2 |
| 5% | 6.29 | 11.31 | 55.6 | 12.57 | 18.24 | 68.9 | 25.14 | 39.05 | 64.4 | 37.71 | 40.92 | 92.2 |
| 10% | 6.57 | 11.31 | 58.1 | 13.14 | 18.24 | 72.0 | 26.28 | 39.05 | 67.3 | 39.42 | 40.92 | 96.3 |
| Brown bread | ||||||||||||
| 0% | 5.88 | 11.31 | 52.0 | 11.76 | 18.24 | 64.8 | 23.52 | 39.05 | 60.2 | 35.28 | 40.92 | 86.2 |
| 5% | 5.93 | 11.31 | 52.4 | 11.85 | 18.24 | 65.0 | 23.70 | 39.05 | 60.7 | 35.55 | 40.92 | 86.9 |
| 10% | 6.00 | 11.31 | 53.1 | 12.00 | 18.24 | 65.8 | 24.00 | 39.05 | 61.5 | 36.00 | 40.92 | 88.0 |
| Bread Samples (% MOLP a Added) | 1–3 Years | 4–5 Years | 14–18 Years (Female) | 19–50 Years (Female) | ||||||||
|---|---|---|---|---|---|---|---|---|---|---|---|---|
| Iron (mg) | EAR b mg/day | % EAR Met | Iron (mg) | EAR mg/day | % EAR met | Iron (mg) | EAR mg/day | % EAR met | Iron (mg) | EAR mg/day | % EAR Met | |
| White bread | ||||||||||||
| 0% (control) | 2.93 | 3.00 | 98.3 | 5.85 | 4.10 | 142.7 | 11.7 | 7.90 | 148.1 | 17.6 | 8.10 | 217.3 |
| 5% | 3.42 | 3.00 | 114.0 | 6.84 | 4.10 | 166.8 | 13.7 | 7.90 | 173.4 | 20.5 | 8.10 | 253.1 |
| 10% | 7.46 | 3.00 | 248.7 | 14.91 | 4.10 | 363.7 | 29.8 | 7.90 | 235.4 | 44.7 | 8.10 | 551.9 |
| Brown bread | ||||||||||||
| 0% | 7.43 | 3.00 | 247.7 | 14.85 | 4.10 | 362.2 | 29.7 | 7.90 | 375.9 | 44.6 | 8.10 | 550.6 |
| 5% | 10.44 | 3.00 | 348.0 | 20.88 | 4.10 | 509.3 | 41.8 | 7.90 | 529.1 | 62.6 | 8.10 | 772.8 |
| 10% | 13.91 | 3.00 | 463.7 | 27.81 | 4.10 | 678.3 | 55.6 | 7.90 | 703.8 | 83.4 | 8.10 | 1029.6 |
| Bread Samples (% MOLP Added) | Overall Acceptability | ||||||||||
|---|---|---|---|---|---|---|---|---|---|---|---|
| Dislike Extremely (1) | Dislike Very Much (2) | Dislike Moderately (3) | Dislike Slightly (4) | Neither Like Nor Dislike (5) | Like Slightly (6) | Like Moderately (7) | Like Very Much (8) | Like Extremely (9) | Overall Like (6–9) | Overall Dislike (1–4) | |
| White bread | |||||||||||
| 0 (Control) | 1 a (1.9) b | 1 (1.9) | 0 (0) | 1 (1.9) | 7 (13.0) | 10 (18.5) | 9 (16.7) | 13 (24.1) | 12 (22.2) | 44 (81.5) | 3 (5.6) |
| 5 | 3 (5.6) | 4 (7.4) | 4 (7.4) | 8 (14.8) | 10 (18.5) | 9 (16.7) | 9 (16.7) | 5 (9.3) | 2 (3.7) | 25 (46.3) | 19 (35.2) |
| 10 | 7 (13.0) | 6 (11.1) | 8 (14.8) | 12 (22.2) | 7 (13.0) | 5 (9.3) | 4 (7.4) | 2 (3.7) | 3 (5.6) | 14 (25.9) | 33 (61.1) |
| Brown bread | |||||||||||
| 0 (Control) | 0 (0) | 0 (0) | 0 (0) | 0 (0) | 3 (5.6) | 9 (16.7) | 10 (18.5) | 16 (29.6) | 16 (29.6) | 51 (94.4) | 0 (0) |
| 5 | 1 (1.9) | 2 (3.7) | 1 (1.9) | 3 (5.6) | 10 (18.5) | 7 (13.0) | 13 (24.1) | 8 (14.8) | 9 (16.7) | 37 (68.5) | 7 (13.0) |
| 10 | 2 (3.7) | 4 (7.4) | 2 (3.7) | 7 (13.0) | 14 (25.9) | 9 (16.7) | 10 (18.5) | 3 (5.6) | 3 (5.6) | 25 (46.3) | 15 (27.8) |
| Bread Samples (% MOLP Added) | Sensory Acceptability (Mean ± SD) | |||||
|---|---|---|---|---|---|---|
| Taste | Colour | Aroma | Texture | Appearance | Overall Acceptability | |
| White bread | ||||||
| 0 (Control) | 6.28 ± 2.16 c,d | 7.46 ±1.40 c | 7.07 ± 1.52 c | 6.32 ± 2.04 b | 7.2 ± 1.59 c | 6.98 ± 1.79 cd |
| 5% | 4.57 ± 2.07 a | 5.06 ± 2.29 a,b | 4.70 ± 2.31 a,b | 5.11 ± 2.34 a | 5.4 ± 2.31 b | 5.19 ± 2.07 ab |
| 10% | 3.83 ± 2.25 a | 4.09 ± 2.48 a | 4.07 ± 2.26 a | 5.11 ± 2.12 a | 4.1 ± 2.70 a | 4.20 ± 2.23 a |
| Brown bread | ||||||
| 0 (Control) | 7.07 ± 1.46 d | 7.57 ± 1.11 c | 7.24 ± 1.36 c | 6.85 ± 1.89 b | 7.5 ± 1.33 c | 7.61 ± 1.23 d |
| 5% | 5.91 ± 2.10 b,c | 6.56 ± 1.86 c | 5.74 ± 1.99 b | 6.06 ± 2.01 ab | 6.4 ± 2.07 b,c | 6.44 ± 1.96 c |
| 10% | 4.78 ± 2.06 a,b | 5.44 ± 2.07 b | 4.85 ± 1.99 a,b | 5.87 ± 1.82 a,b | 5.7 ± 2.06 b | 5.35 ± 1.94 b |
Publisher’s Note: MDPI stays neutral with regard to jurisdictional claims in published maps and institutional affiliations. |
© 2020 by the authors. Licensee MDPI, Basel, Switzerland. This article is an open access article distributed under the terms and conditions of the Creative Commons Attribution (CC BY) license (http://creativecommons.org/licenses/by/4.0/).
Share and Cite
Govender, L.; Siwela, M. The Effect of Moringa oleifera Leaf Powder on the Physical Quality, Nutritional Composition and Consumer Acceptability of White and Brown Breads. Foods 2020, 9, 1910. https://doi.org/10.3390/foods9121910
Govender L, Siwela M. The Effect of Moringa oleifera Leaf Powder on the Physical Quality, Nutritional Composition and Consumer Acceptability of White and Brown Breads. Foods. 2020; 9(12):1910. https://doi.org/10.3390/foods9121910
Chicago/Turabian StyleGovender, Laurencia, and Muthulisi Siwela. 2020. "The Effect of Moringa oleifera Leaf Powder on the Physical Quality, Nutritional Composition and Consumer Acceptability of White and Brown Breads" Foods 9, no. 12: 1910. https://doi.org/10.3390/foods9121910