Analysis of Caffeine, Chlorogenic Acid, Trigonelline, and Volatile Compounds in Cold Brew Coffee Using High-Performance Liquid Chromatography and Solid-Phase Microextraction—Gas Chromatography-Mass Spectrometry


Abstract
:
1. Introduction
2. Materials and Methods
2.1. Coffee Samples and Preparation
2.1.1. Brewed Coffee
2.1.2. Ready-to-Drink (RTD) Coffee
2.1.3. Coffee from a Coffee Shop (CS)
2.2. Analysis of Caffeine, Chlorogenic Acid, and Trigonelline
HPLC
2.3. Analysis of Volatile Compounds
2.3.1. Headspace Solid-Phase Microextraction (HS-SPME)
2.3.2. Gas Chromatography—Mass Spectrometry (GC—MS)
2.3.3. Consumer Evaluation
2.4. Statistical Analysis
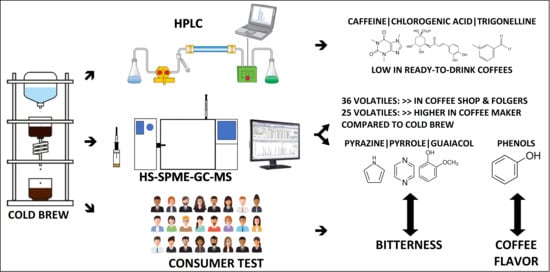
3. Results and Discussion
3.1. Caffeine, Chlorogenic Acid, and Trigonelline Compounds in CB Coffee Samples
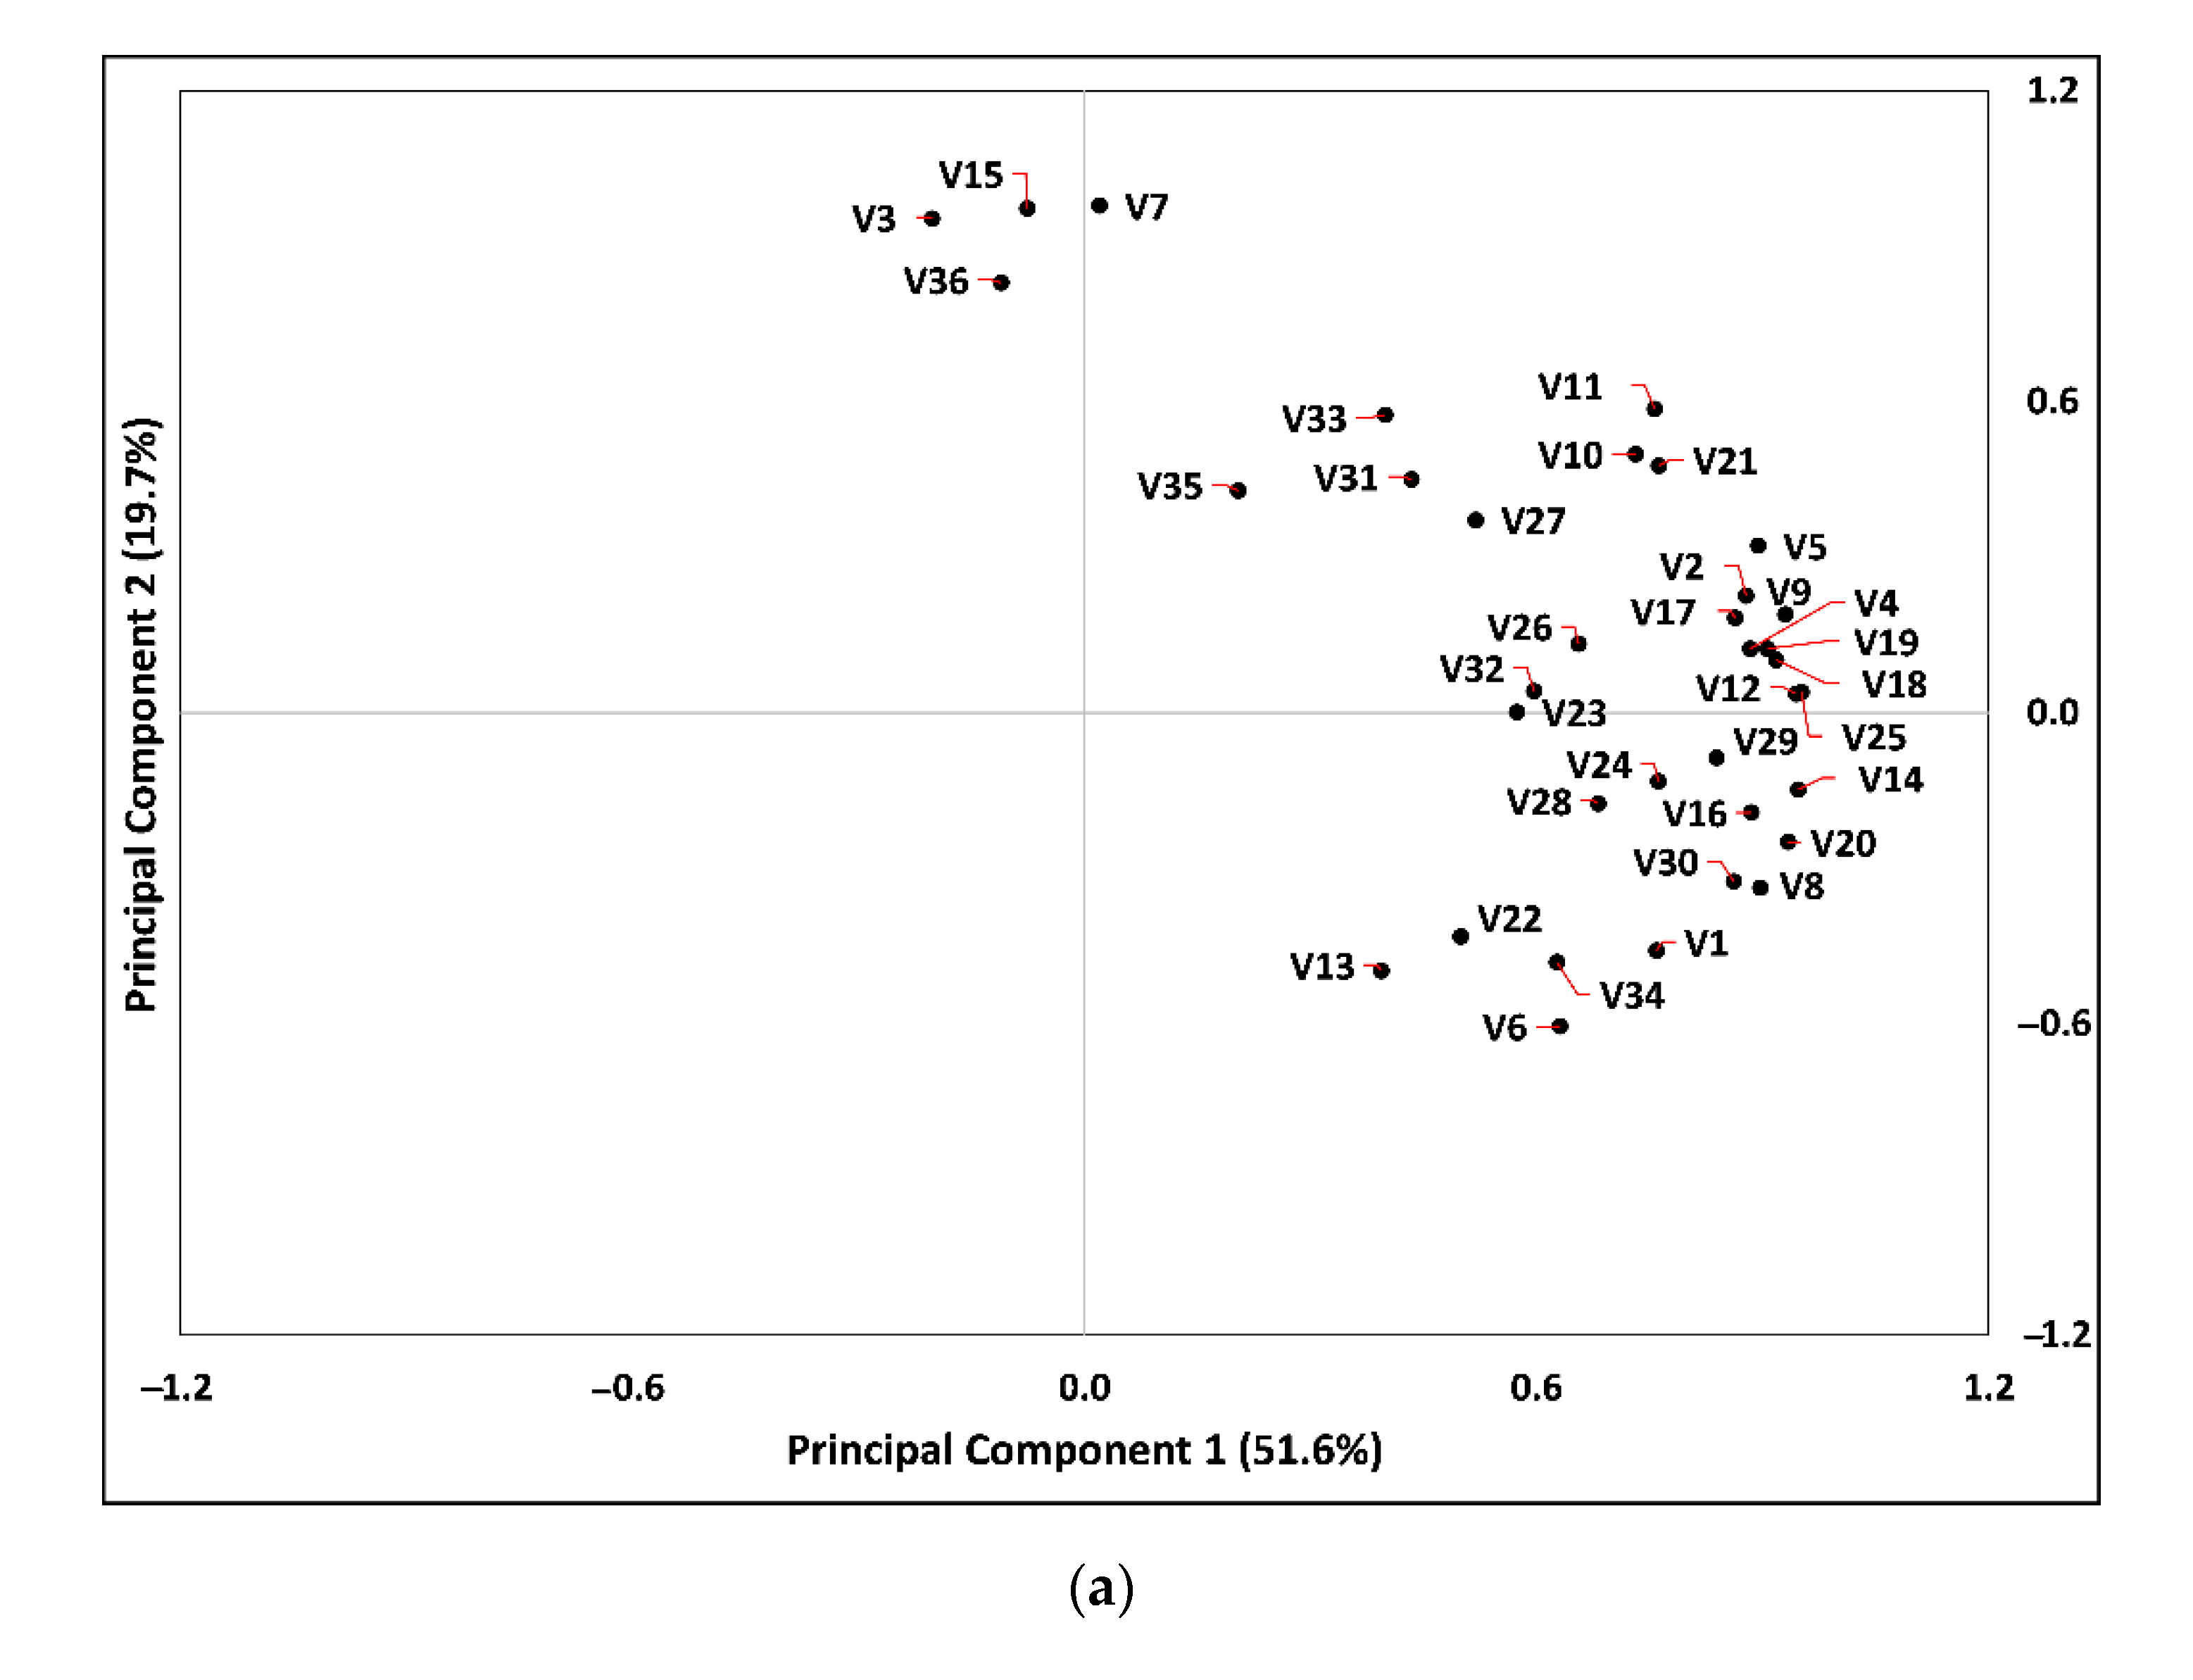
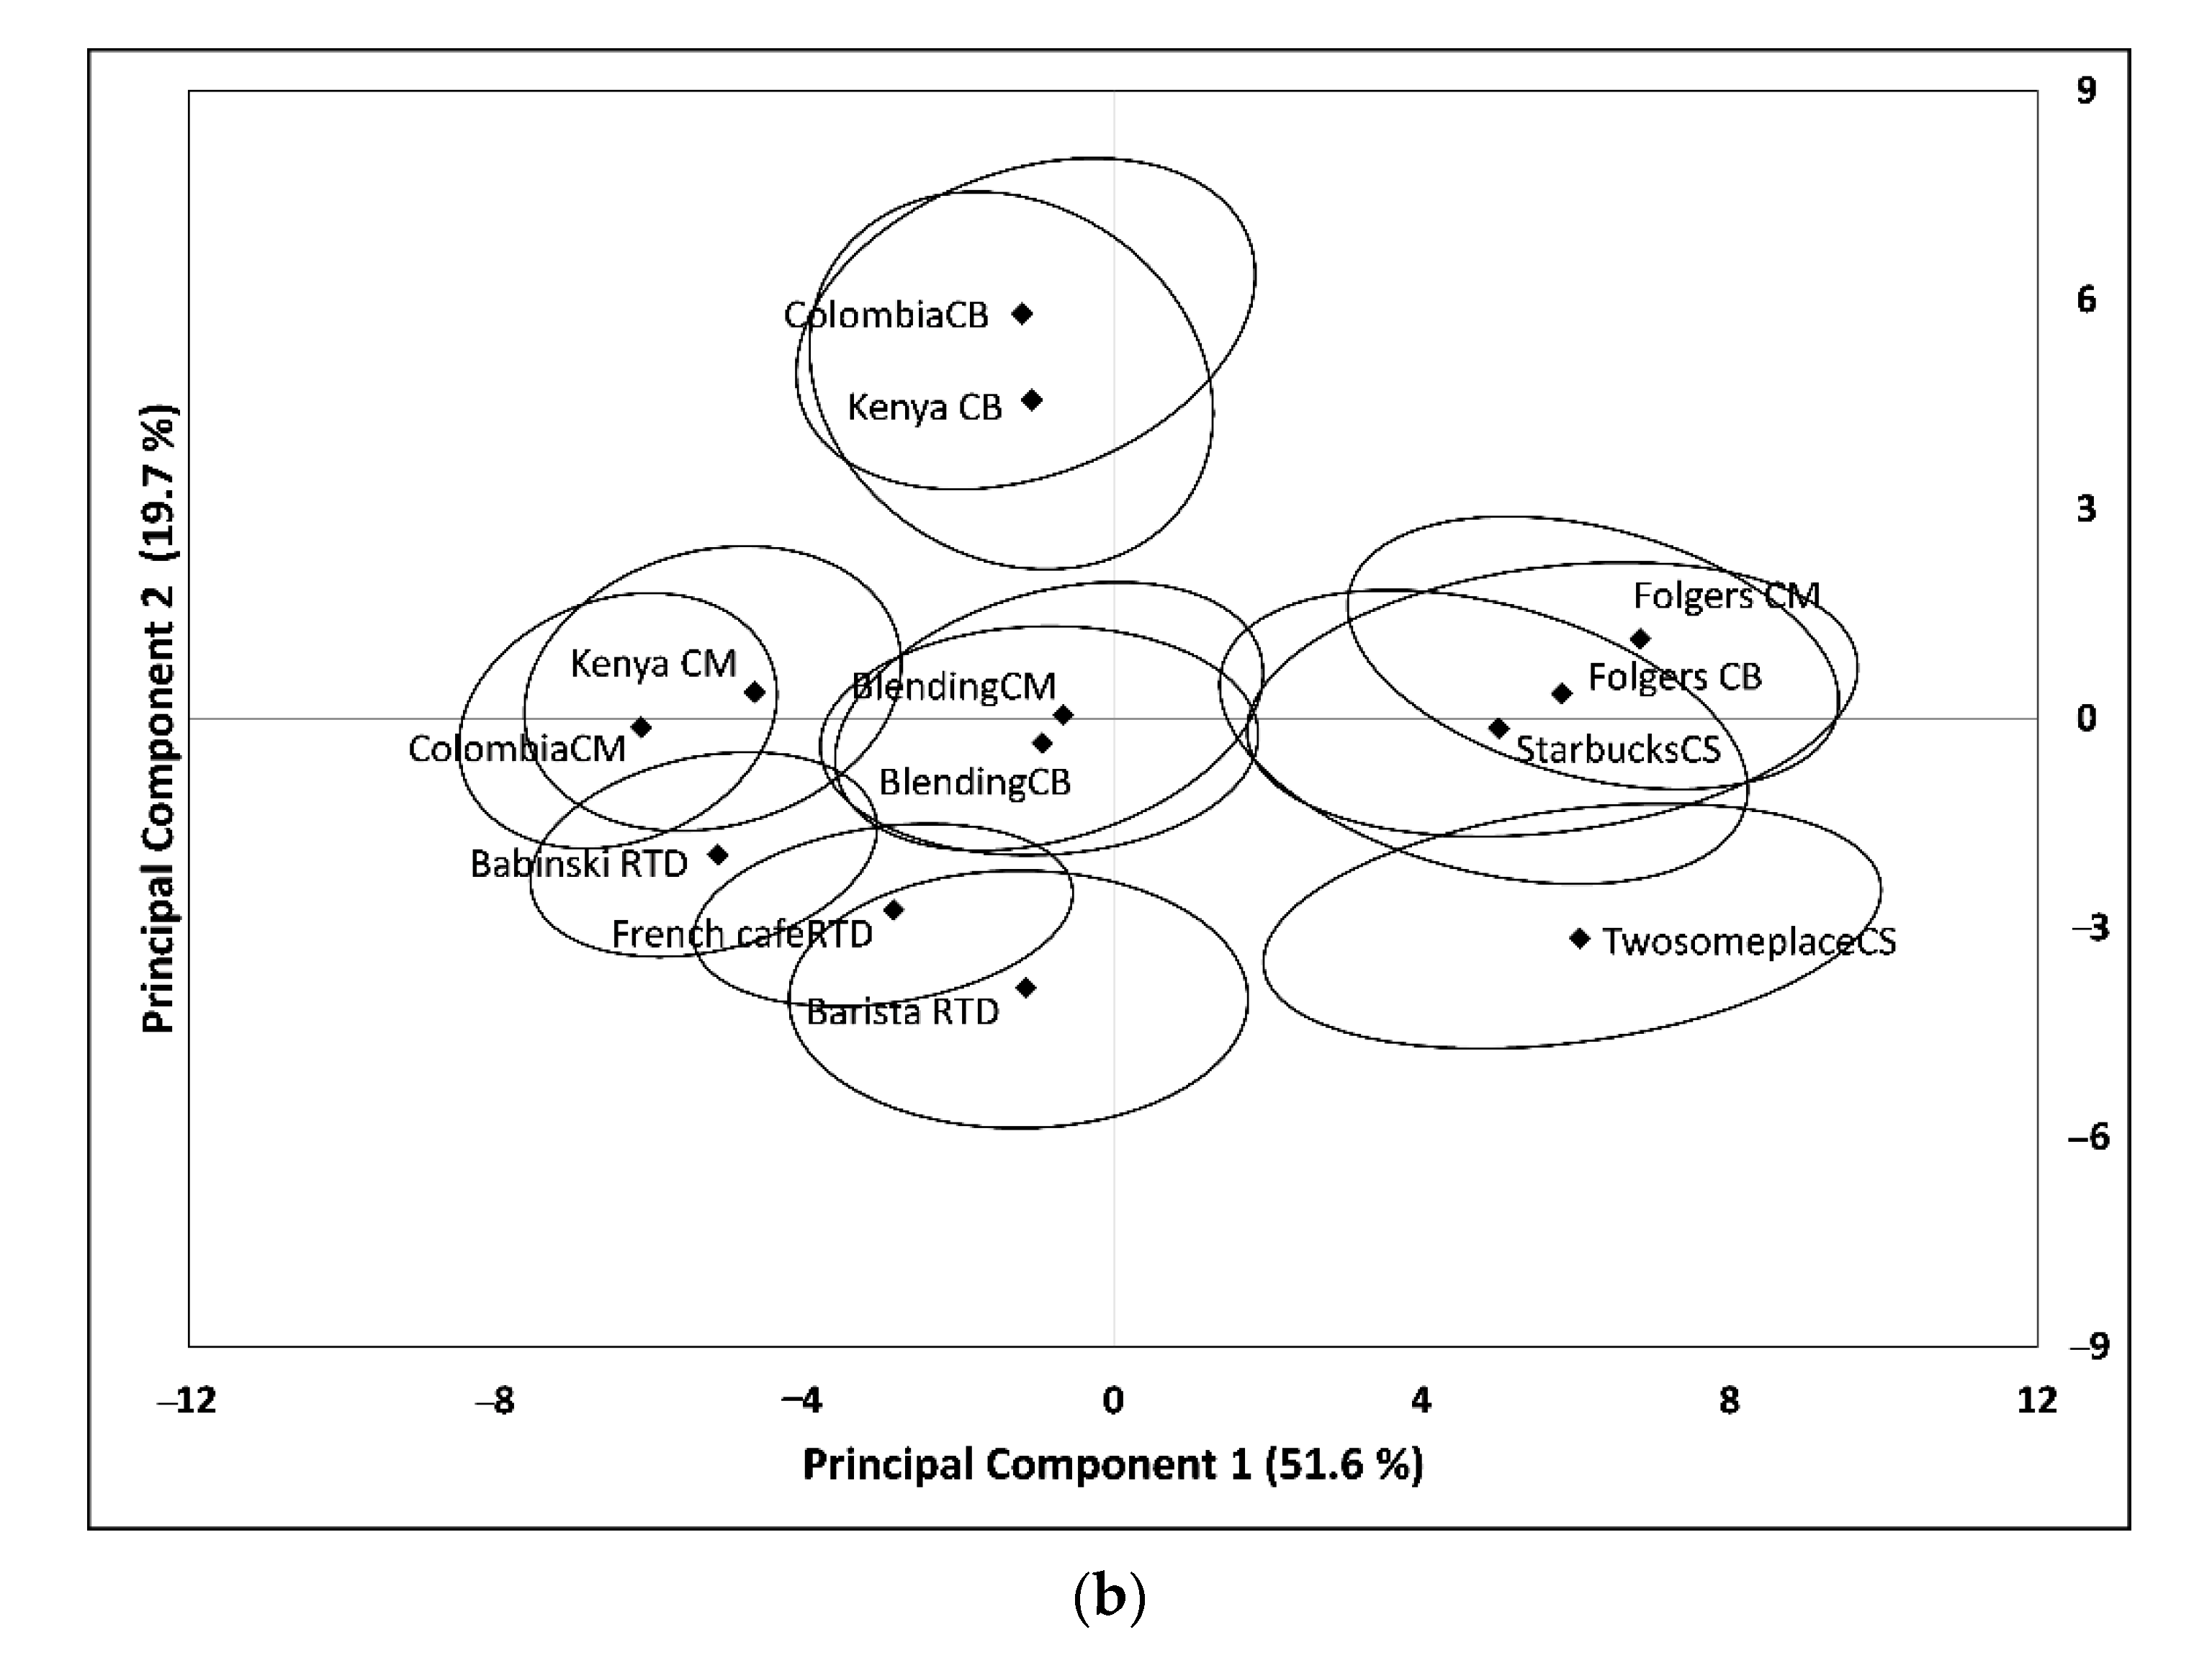
3.2. Volatile Compounds in CB Coffee Samples

| RT 2 | No. | Compounds | Base Peak (m/z ± 0.5 amu) | KI (Lit) 3 | KI (exp) | BlendingCB | ColombiaCB | Kenya CB | Folgers CB | BlendingCM | ColombiaCM | Kenya CM | Folgers CM | Barista RTD | BabinskiRTD | French cafeRTD | Starbucks CS | TwosomeplaceCS |
|---|---|---|---|---|---|---|---|---|---|---|---|---|---|---|---|---|---|---|
| 4.105 | V1 | Pyridine | 79 | 769 [37] | 787 | 694 ± 50.6 | 521 ± 62.5 | 508 ± 61.3 | 870 ± 110 | 643 ± 241 | 268 ± 20.5 | 309 ± 32.4 | 815 ± 76.2 | 972 ± 76.1 | 515 ± 42.2 | 772 ± 53.2 | 1229 ± 73.9 | 1695 ± 185 |
| 7.015 | V2 | Methylpyrazine | 94 | 826 [38] | 817 | 62 ± 6.54 | 85 ± 15.9 | 72 ± 14.4 | 149 ± 17.9 | 62 ± 24.6 | 42 ± 6.40 | 41 ± 6.82 | 156 ± 14.6 | 45 ± 2.91 | 69 ± 5.26 | 43 ± 2.85 | 116 ± 6.33 | 98 ± 11.5 |
| 7.500 | V3 | Furfural | 96 | 830 [39] | 826 | 120 ± 8.50 | 354 ± 65.3 | 309 ± 41.0 | 105 ± 11.0 | 116 ± 45.0 | 156 ± 34.6 | 169 ± 37.6 | 113 ± 9.11 | 32 ± 1.90 | 74 ± 4.91 | 44 ± 3.42 | 94 ± 6.30 | 50 ± 5.27 |
| 9.126 | V4 | 2-Furanmethanol | 98 | 853 [40] | 853 | 82 ± 8.06 | 101 ± 21.7 | 96 ± 18.2 | 127 ± 17.9 | 86 ± 35.1 | 44 ± 7.88 | 53 ± 10.4 | 136 ± 15.5 | 74 ± 3.92 | 71 ± 6.79 | 60 ± 3.71 | 191 ± 11.8 | 137 ± 18.8 |
| 12.39 | V5 | 2,6-Dimethylpyrazine | 108 | 910 [41] | 913 | 125 ± 15.1 | 164 ± 30.3 | 137 ± 24.5 | 229 ± 27.1 | 120 ± 47.3 | 85 ± 11.9 | 75 ± 10.9 | 235 ± 18.9 | 81 ± 4.62 | 104 ± 6.58 | 84 ± 5.36 | 187 ± 11.7 | 173 ± 19.5 |
| 14.34 | V6 | 3-Ethylpyridine | 92 | 959 [42] | 963 | 23 ± 4.51 | 9 ± 1.65 | 12 ± 1.76 | 45 ± 6.67 | 17 ± 6.86 | 3 ± 0.32 | 5 ± 0.69 | 37 ± 3.12 | 76 ± 9.90 | 11 ± 1.11 | 52 ± 4.22 | 61 ± 6.51 | 111 ± 12.9 |
| 14.57 | V7 | 5-Methyl-2-furaldehyde | 110 | 966 [43] | 969 | 183 ± 17.1 | 323 ± 55.6 | 317 ± 43.2 | 166 ± 17.8 | 183 ± 72.4 | 145 ± 36.1 | 178 ± 37.9 | 178 ± 14.8 | 52 ± 4.38 | 99 ± 7.02 | 76 ± 4.70 | 157 ± 8.72 | 103 ± 11.0 |
| 15.32 | V8 | Phenol | 94 | 989 [44] | 988 | 9 ± 1.07 | 8 ± 1.57 | 10 ± 1.29 | 24 ± 3.15 | 10 ± 3.71 | 4 ± 0.96 | 6 ± 1.35 | 29 ± 2.39 | 19 ± 1.52 | 7 ± 0.57 | 15 ± 1.22 | 27 ± 1.65 | 39 ± 4.41 |
| 15.71 | V9 | 2-Ethyl-3-methylpyrazine | 121 | 999 [38] | 998 | 61 ± 10.4 | 66 ± 11.8 | 57 ± 10.7 | 108 ± 12.3 | 51 ± 20.7 | 25 ± 4.23 | 25 ± 3.8 | 105 ± 7.39 | 38 ± 2.41 | 33 ± 2.14 | 44 ± 2.00 | 69 ± 4.68 | 87 ± 9.09 |
| 16.07 | V10 | Pyrrole-2-carboxaldehyde | 95 | 1008 [45] | 1010 | 39 ± 5.58 | 47 ± 10.0 | 53 ± 8.95 | 42 ± 6.27 | 41 ± 15.0 | 18 ± 4.88 | 27 ± 5.62 | 46 ± 4.03 | 19 ± 7.60 | 17 ± 1.69 | 28 ± 2.11 | 49 ± 2.43 | 53 ± 5.05 |
| 16.24 | V11 | 1-Methyl-1H-pyrrole-2-acetonitrile | 120 | 1118 [46] | 1017 | 6 ± 0.90 | 8 ± 1.61 | 7 ± 1.11 | 9 ± 0.92 | 5 ± 1.91 | 3 ± 0.56 | 3 ± 0.49 | 9 ± 0.57 | 3 ± 0.21 | 3 ± 0.18 | 3 ± 0.20 | 6 ± 0.45 | 6 ± 0.64 |
| 16.38 | V12 | N-acetyl-4(H)-pyridine | 80 | 1038 [47] | 1022 | 5 ± 0.58 | 5 ± 0.79 | 4 ± 0.62 | 10 ± 1.42 | 5 ± 1.98 | 2 ± 0.47 | 3 ± 0.50 | 11 ± 1.09 | 5 ± 0.30 | 4 ± 0.09 | 2 ± 0.12 | 10 ± 0.50 | 8 ± 0.92 |
| 17.36 | V13 | 3-Methylphenol | 108 | 1065 [48] | 1059 | 3 ± 0.32 | 2 ± 0.34 | 3 ± 0.25 | 4 ± 0.37 | 4 ± 1.56 | 1 ± 0.27 | 2 ± 0.59 | 5 ± 0.42 | 4 ± 0.36 | 8 ± 0.83 | 4 ± 0.35 | 5 ± 0.44 | 7 ± 0.64 |
| 17.49 | V14 | 2-Acetylpyrrole | 94 | 1060 [49] | 1063 | 28 ± 4.77 | 27 ± 6.39 | 29 ± 5.47 | 44 ± 7.72 | 31 ± 11.9 | 12 ± 3.73 | 15 ± 3.84 | 50 ± 4.64 | 32 ± 2.75 | 16 ± 1.96 | 24 ± 2.15 | 53 ± 2.64 | 67 ± 9.84 |
| 17.55 | V15 | 3,5-Octadien-2-one | 95 | 1081 [50] | 1066 | 7 ± 0.69 | 19 ± 4.00 | 17 ± 2.80 | 6 ± 0.82 | 8 ± 3.11 | 8 ± 2.09 | 9 ± 1.95 | 8 ± 0.74 | 2 ± 1.60 | 4 ± 0.48 | 3 ± 0.14 | 8 ± 0.59 | 4 ± 0.69 |
| 17.82 | V16 | 2-Acetyl-1-methylpyrrole | 108 | 1096 [51] | 1076 | 19 ± 2.42 | 15 ± 2.29 | 16 ± 2.36 | 24 ± 2.54 | 18 ± 7.89 | 6 ± 1.36 | 8 ± 2.00 | 27 ± 2.20 | 20 ± 1.83 | 1 ± 0.11 | 20 ± 1.31 | 28 ± 2.08 | 39 ± 3.52 |
| 17.95 | V17 | 3-Ethyl-2,5-dimethylpyrazine | 135 | 1078 [38] | 1081 | 84 ± 15.1 | 88 ± 16.7 | 65 ± 12.4 | 154 ± 16.3 | 63 ± 24.8 | 29 ± 4.48 | 25 ± 3.10 | 130 ± 8.25 | 44 ± 3.96 | 30 ± 2.40 | 58 ± 3.77 | 68 ± 4.77 | 112 ± 12.1 |
| 18.09 | V18 | 2-Ethyl-3,5-dimethylpyrazine | 135 | 1085 [52] | 1086 | 12 ± 1.82 | 12 ± 2.57 | 10 ± 1.77 | 23 ± 2.44 | 10 ± 3.86 | 4 ± 0.59 | 4 ± 0.41 | 20 ± 1.00 | 8 ± 0.40 | 5 ± 0.57 | 9 ± 0.57 | 12 ± 0.85 | 18 ± 2.37 |
| 18.14 | V19 | 2,5-Diethylpyrazine | 121 | 1085 [53] | 1088 | 14 ± 3.18 | 14 ± 2.91 | 12 ± 2.26 | 29 ± 3.16 | 11 ± 4.62 | 5 ± 0.90 | 5 ± 0.83 | 26 ± 2.20 | 9 ± 0.84 | 6 ± 0.48 | 10 ± 0.76 | 14 ± 1.51 | 21 ± 2.04 |
| 18.18 | V20 | Guaiacol | 109 | 1090 [43] | 1089 | 15 ± 1.80 | 14 ± 2.18 | 16 ± 2.01 | 46 ± 5.32 | 15 ± 5.84 | 6 ± 1.89 | 8 ± 1.85 | 54 ± 4.33 | 26 ± 2.54 | 10 ± 1.04 | 27 ± 2.05 | 41 ± 2.32 | 57 ± 5.21 |
| 18.24 | V21 | 3-Ethyl-2-hydroxy-2-cyclopenten-1-one | 126 | 1091 [54] | 1092 | 5 ± 0.49 | 7 ± 1.10 | 7 ± 1.08 | 6 ± 0.68 | 5 ± 2.03 | 3 ± 0.66 | 4 ± 1.09 | 7 ± 0.56 | 3 ± 0.38 | 3 ± 0.25 | 4 ± 0.23 | 9 ± 0.67 | 7 ± 0.49 |
| 18.55 | V22 | Nonanal | 57 | 1102 [55] | 1104 | 8 ± 1.87 | 0 ± 0.00 | 2 ± 0.16 | 8 ± 2.67 | 9 ± 2.32 | 3 ± 0.74 | 7 ± 1.65 | 7 ± 5.48 | 7 ± 1.85 | 2 ± 0.48 | 3 ± 1.17 | 7 ± 1.84 | 7 ± 3.79 |
| 18.71 | V23 | Maltol | 126 | 1139 [47] | 1111 | 20 ± 1.87 | 22 ± 5.54 | 29 ± 7.30 | 20 ± 5.94 | 25 ± 7.53 | 9 ± 5.16 | 11 ± 3.47 | 21 ± 3.62 | 21 ± 1.12 | 13 ± 3.43 | 24 ± 4.67 | 65 ± 5.31 | 34 ± 10.0 |
| 19.14 | V24 | 2-Methyl-5-propionylfuran | 109 | 1151 [56] | 1131 | 12 ± 1.69 | 12 ± 2.07 | 14 ± 2.08 | 13 ± 1.26 | 11 ± 4.54 | 4 ± 1.31 | 7 ± 1.76 | 13 ± 1.30 | 11 ± 1.31 | 10 ± 0.82 | 12 ± 0.73 | 18 ± 2.22 | 24 ± 2.60 |
| 19.36 | V25 | 5H-5-methyl-6,7-dihydrocyclopenta[b]pyrazine | 119 | 1147 [57] | 1141 | 6 ± 1.12 | 7 ± 1.74 | 6 ± 1.12 | 15 ± 1.95 | 6 ± 2.32 | 3 ± 0.78 | 3 ± 0.54 | 16 ± 0.97 | 6 ± 0.52 | 3 ± 0.39 | 5 ± 0.36 | 9 ± 0.70 | 13 ± 1.62 |
| 20.26 | V26 | 1-Furfurylpyrrole | 81 | 1189 [47] | 1181 | 11 ± 1.34 | 9 ± 0.61 | 8 ± 2.35 | 17 ± 1.82 | 18 ± 6.65 | 3 ± 0.93 | 5 ± 1.28 | 27 ± 3.45 | 15 ± 3.39 | 1 ± 0.12 | 2 ± 0.19 | 8 ± 0.35 | 8 ± 1.82 |
| 20.51 | V27 | Methyl salicylate | 120 | 1197 [58] | 1195 | 230 ± 50.2 | 315 ± 72.5 | 252 ± 32.6 | 313 ± 30.4 | 228 ± 89.0 | 248 ± 32.3 | 255 ± 50.8 | 252 ± 61.4 | 266 ± 39.6 | 228 ± 36.5 | 219 ± 49.5 | 299 ± 20.7 | 275 ± 76.5 |
| 21.86 | V28 | Nonanoic acid | 60 | 1270 [59] | 1265 | 47 ± 15.4 | 4 ± 1.24 | 10 ± 5.90 | 41 ± 16.8 | 45 ± 35.4 | 4 ± 2.43 | 28 ± 8.93 | 82 ± 66.2 | 57 ± 72.2 | 5 ± 1.08 | 3 ± 2.27 | 83 ± 48.5 | 29 ± 12.9 |
| 22.12 | V29 | 4-Ethylguaiacol | 137 | 1280 [60] | 1279 | 31 ± 5.44 | 25 ± 4.22 | 23 ± 5.03 | 173 ± 22.9 | 36 ± 14.9 | 11 ± 3.01 | 13 ± 2.28 | 207 ± 13.9 | 79 ± 10.9 | 13 ± 2.28 | 38 ± 4.09 | 72 ± 8.42 | 89 ± 10.3 |
| 22.53 | V30 | Difurfuryl ether | 81 | 1305 [47] | 1300 | 31 ± 3.26 | 18 ± 1.61 | 27 ± 6.46 | 50 ± 6.41 | 40 ± 17.4 | 7 ± 3.43 | 14 ± 6.03 | 60 ± 3.75 | 61 ± 11.6 | 6 ± 1.26 | 28 ± 4.48 | 54 ± 3.83 | 66 ± 9.24 |
| 22.75 | V31 | 4-Vinylguaiacol | 135 | 1315 [43] | 1313 | 10 ± 1.37 | 30 ± 4.89 | 14 ± 3.72 | 35 ± 6.72 | 20 ± 8.11 | 22 ± 5.60 | 14 ± 3.53 | 76 ± 9.10 | 3 ± 0.60 | 1 ± 0.26 | 2 ± 0.28 | 5 ± 0.22 | 3 ± 0.92 |
| 23.56 | V32 | Decanoic acid | 60 | 1362 [61] | 1360 | 2 ± 0.19 | 0 ± 0.00 | 3 ± 1.79 | 3 ± 1.37 | 5 ± 4.23 | 1 ± 0.26 | 3 ± 1.34 | 6 ± 3.67 | 2 ± 2.02 | 1 ± 0.23 | 1 ± 0.37 | 6 ± 1.09 | 2 ± 0.73 |
| 23.64 | V33 | 3,4-Dimethoxystyrene | 164 | 1365 [61] | 1365 | 6 ± 0.85 | 6 ± 0.97 | 10 ± 3.09 | 6 ± 0.92 | 9 ± 4.27 | 3 ± 1.30 | 7 ± 2.28 | 7 ± 0.44 | 4 ± 0.54 | 1 ± 0.33 | 3 ± 0.47 | 8 ± 0.76 | 5 ± 0.59 |
| 25.96 | V34 | 2,4-Di-tert-butylphenol | 191 | 1513 [62] | 1507 | 88 ± 31.8 | 58 ± 5.07 | 81 ± 42.2 | 113 ± 20.9 | 79 ± 33.0 | 83 ± 8.84 | 89 ± 17.2 | 86 ± 27.4 | 90 ± 12.7 | 64 ± 1.49 | 92 ± 22.1 | 101 ± 23.0 | 119 ± 49.1 |
| 26.65 | V35 | Dodecanoic acid | 73 | 1566 [63] | 1553 | 2 ± 0.71 | 4 ± 0.43 | 4 ± 0.38 | 3 ± 1.06 | 3 ± 0.66 | 3 ± 0.98 | 5 ± 2.48 | 4 ± 0.58 | 2 ± 0.25 | 3 ± 1.27 | 3 ± 0.52 | 6 ± 2.68 | 3 ± 1.63 |
| 29.37 | V36 | Tetradecanoic acid | 73 | 1756 [64] | 1753 | 0 ± 0.00 | 1 ± 0.16 | 1 ± 0.11 | 0 ± 0.00 | 0 ± 0.00 | 0 ± 0.05 | 0 ± 0.00 | 0 ± 0.00 | 0 ± 0.00 | 0 ± 0.21 | 0 ± 0.05 | 0 ± 0.00 | 0 ± 0.00 |
| Sample | Relative Standard Deviation (%) |
|---|---|
| BlendingCB | 5.7 |
| ColombiaCB | 7.6 |
| KenyaCB | 11.4 |
| FolgersCB | 14.0 |
| BlendingCM | 4.6 |
| ColombiaCM | 9.1 |
| KenyaCM | 8.2 |
| FolgersCM | 7.1 |
| BaristaRTD | 14.3 |
| BabinskiRTD | 7.5 |
| FrenchCafeRTD | 9.6 |
| StarbucksCS | 6.1 |
| TwosomeplaceCS | 10.3 |
| No | Volatile Compounds | Descriptors | Threshold (ng/mL) |
|---|---|---|---|
| V1 | Pyridine | Sour, Fishy, Burnt [65], Smoky [35] | 2000 [66] |
| V2 | Methylpyrazine | - | - |
| V3 | Furfural | Sweet, Wood, Almond [65] | 3 [31] |
| V4 | 2-Furanmethanol | Sweet, Caramel, Coffee [65] | - |
| V5 | 2,6-Dimethylpyrazine | Cocoa, Roasted, Nutty [65] | 1.72 [67] |
| V6 | 3-Ethylpyridine | Tobacco, Lethery [65] | - |
| V7 | 5-Methyl-2-furaldehyde | Caramel, Coffee [65] | - |
| V8 | Phenol | Phenolic [65] | 2400 [66] |
| V9 | 2-Ethyl-3-methylpyrazine | Nutty, Peanut, Musty, Earthy [65] | 0.035 [67] |
| V10 | Pyrrole-2-carboxaldehyde | Musty, Coffee [65] | - |
| V11 | 1-methyl-1H-pyrrole-2-acetonitrile | - | - |
| V12 | N-acetyl-4(H)-pyridine | - | - |
| V13 | 3-Methylphenol | Phenolic [65] | 31–800 [68] |
| V14 | 2-Acetylpyrrole | Musty, Nutty [65] | - |
| V15 | 3,5-Octadien-2-one | Fruity, Fatty [65] | - |
| V16 | 2-Acetyl-1-methylpyrrole | Earthy [65] | - |
| V17 | 3-Ethyl-2,5-dimethylpyrazine | Nutty [65] | 1 [66] |
| V18 | 2-Ethyl-3,5-dimethylpyrazine | Almond, Burn, Coffee, Nutty [65] | 0.04 [69] |
| V19 | 2,5-Diethylpyrazine | Sweet [67] | 0.0017 [67] |
| V20 | Guaiacol | Phenolic [65,70], Smoky [65], Burnt [35] | 0.003 [26] |
| V21 | 3-Ethyl-2-hydroxy-2-cyclopenten-1-one | Caramel, Sweet [65] | - |
| V22 | Nonanal | Waxy, Rose, Fresh [65] | 0.001 [31] |
| V23 | Maltol | Caramel, Sweet [65] | 20 [26], 5800 [66] |
| V24 | 2-Methyl-5-propionylfuran | - | - |
| V25 | 5H-5-methyl-6,7-dihydrocyclopenta[b]pyrazine | Earthy, Rosted [65] | - |
| V26 | 1-Furfurylpyrrole | Vegetable, Green, Waxy [65] | - |
| V27 | Methyl salicylate | Wintergreen, Mint [65] | 0.04 [31] |
| V28 | Nonanoic acid | Waxy, Cheese [65] | - |
| V29 | 4-Ethylguaiacol | Spicy [65,70], Sweet [35] | 35 [71] |
| V30 | Difurfuryl ether | Coffee, Earthy, Mushroom [65] | - |
| V31 | 4-Vinylguaiacol | Woody, Dry, Roasted, Clove-like [35] | 80 [71] |
| V32 | Decanoic acid | Rancid, Sour, Fatty [65] | - |
| V33 | 3,4-Dimethoxystyrene | Green, Floral [65] | - |
| V34 | 2,4-Di-tert-butylphenol | - | - |
| V35 | Dodecanoic acid | Fatty [65] | - |
| V36 | Tetradecanoic acid | Waxy, Fatty [65] | - |
3.3. Consumers’ Perceptions of Coffee Samples
3.4. Relationship between Coffee Acceptability and Volatile Compounds
3.5. Relationship between Sensory Data, Volatiles, and Caffeine, Chlorogenic Acid, and Trigonelline Compounds in Coffee
3.5.1. Relationship between Sensory Data and Volatile Compounds
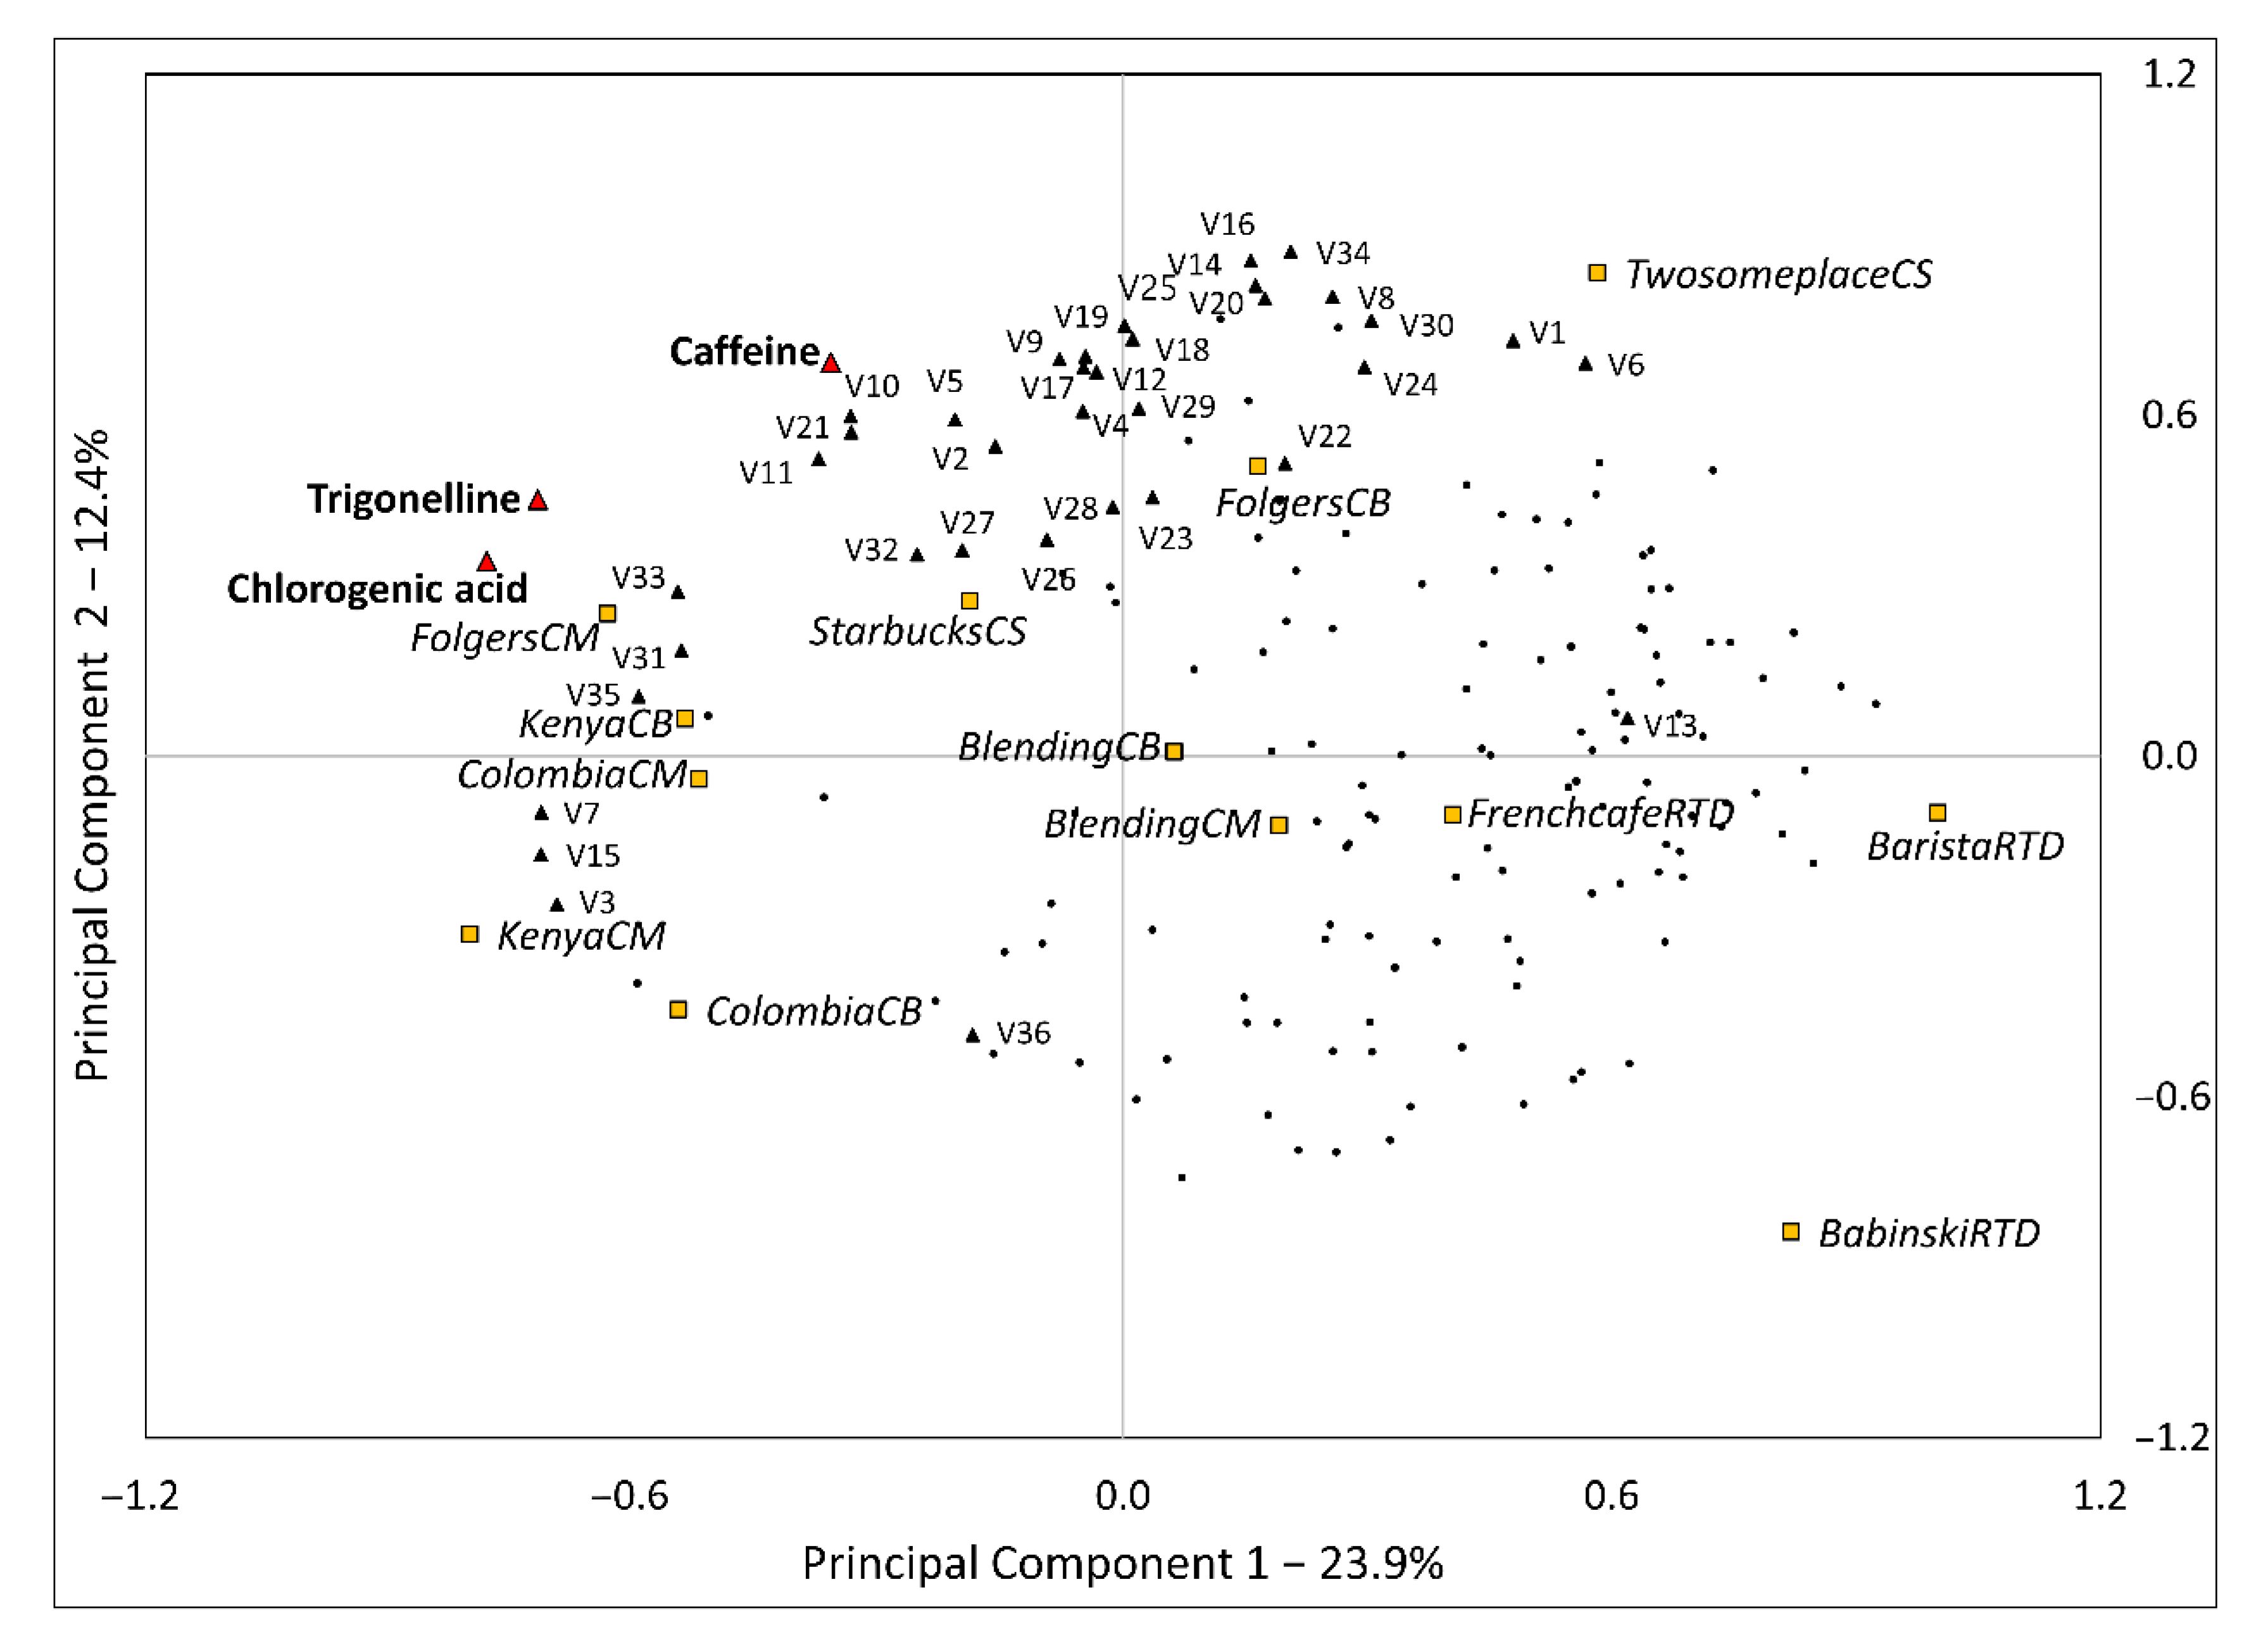
3.5.2. Internal Preference Mapping
4. Conclusions
Author Contributions
Funding
Conflicts of Interest
References
- Buffo, R.A.; Cardelli-Freire, C. Coffee flavor: An overview. Flavour Fragr. J. 2004, 19, 99–104. [Google Scholar] [CrossRef]
- Charles-Bernard, M.; Kraehenbuehl, K.; Rytz, A.; Roberts, D.D. Interactions between volatile and nonvolatile coffee components. 1. Screening of Nonvolatile components. J. Agric. Food Chem. 2005, 53, 4417–4425. [Google Scholar] [CrossRef] [PubMed]
- Kim, K.J.; Park, S.K. Changes in major chemical constituents of green coffee beans during the roasting. Korean J. Food Sci. Technol. 2006, 38, 153–158. [Google Scholar]
- Caprioli, G.; Cortese, M.; Cristalli, G.; Maggi, F.; Odello, L.; Ricciutelli, M.; Sagratini, G.; Sirocchi, V.; Tomassoni, G.; Vittori, S. Optimization of espresso machine parameters through the analysis of coffee odorants by HS-SPME-GC/MS. Food Chem. 2012, 135, 1127–1133. [Google Scholar] [CrossRef] [PubMed]
- Franca, A.S.; Oliveira, L.S.; Oliveira, R.C.S.; Agresti, P.C.M.; Augusti, R. A preliminary evaluation of the effect of processing temperature on coffee roasting degree assessment. J. Food Eng. 2009, 92, 345–352. [Google Scholar] [CrossRef]
- Cheong, M.W.; Tong, K.H.; Ong, J.J.M.; Liu, S.Q.; Curran, P.; Yu, B. Volatile composition and antioxidant capacity of Arabica coffee. Food Res. Int. 2013, 51, 388–396. [Google Scholar] [CrossRef]
- Agresti, P.D.C.M.; Franca, A.S.; Oliveira, L.S.; Augusti, R. Discrimination between defective and non-defective Brazilian coffee beans by their volatile profile. Food Chem. 2008, 106, 787–796. [Google Scholar] [CrossRef]
- Dulsat-Serra, N.; Quintanilla-Casas, B.; Vichi, S. Volatile thiols in coffee: A review on their formation, degradation, assessment and influence on coffee sensory quality. Food Res. Int. 2016, 89, 982–988. [Google Scholar] [CrossRef]
- Caporaso, N.; Whitworth, M.B.; Cui, C.; Fisk, I.D. Variability of single bean coffee volatile compounds of Arabica and robusta roasted coffees analysed by SPME-GC-MS. Food Res. Int. 2018, 108, 628–640. [Google Scholar] [CrossRef]
- Bhumiratana, N.; Adhikari, K.; Chambers IV, E. Evolution of sensory aroma attributes from coffee beans to brewed coffee. LWT Food Sci. Technol. 2011, 44, 2185–2192. [Google Scholar] [CrossRef] [Green Version]
- Cordoba, N.; Pataquiva, L.; Osorio, C.; Moreno, F.L.M.; Ruiz, R.Y. Effect of grinding, extraction time and type of coffee on the physicochemical and flavour characteristics of cold brew coffee. Sci. Rep. 2019, 9, 8440. [Google Scholar] [CrossRef] [PubMed] [Green Version]
- Steen, I.; Waehrens, S.S.; Petersen, M.A.; Münchow, M.; Bredie, W.L.P. Influence of serving temperature on flavor perception and release of Bourbon Caturra coffee. Food Chem. 2017, 219, 61–68. [Google Scholar] [CrossRef] [PubMed]
- Angeloni, G.; Guerrini, L.; Masella, P.; Innocenti, M.; Bellumori, M.; Parenti, A. Characterization and comparison of cold brew and cold drip coffee extraction methods. J. Sci. Food Agric. 2019, 99, 391–399. [Google Scholar] [CrossRef] [PubMed]
- Heo, J.; Choi, K.S.; Wang, S.; Adhikari, A.; Lee, J. Cold brew coffee: Consumer acceptability and characterization using the check-all-that-apply (CATA) method. Foods 2019, 8, 344. [Google Scholar] [CrossRef] [Green Version]
- Masi, C.; Dinnella, C.; Monteleone, E.; Prescott, J. The impact of individual variations in taste sensitivity on coffee perceptions and preferences. Physiol. Behav. 2015, 138, 219–226. [Google Scholar] [CrossRef]
- Gloess, A.N.; Schönbächler, B.; Klopprogge, B.; D’Ambrosio, L.; Chatelain, K.; Bongartz, A.; Strittmatter, A.; Rast, M.; Yeretzian, C. Comparison of nine common coffee extraction methods: Instrumental and sensory analysis. Eur. Food Res. Technol. 2013, 236, 607–627. [Google Scholar] [CrossRef] [Green Version]
- Kim, A.F.; Kim, J.S. Flavor contributing nonvolatile chemical and sensory characterization of cold water extraction-based coffee by different extraction methods (dripping vs steeping) and time. J. Korean Soc. Coffee Ind. 2014, 3, 1–9. [Google Scholar]
- Fuller, M.; Rao, N.Z. The effect of time, roasting temperature, and grind size on caffeine and chlorogenic acid concentrations in cold brew coffee. Sci. Rep. 2017, 7, 17979. [Google Scholar] [CrossRef] [Green Version]
- Bell, L.N.; Wetzel, C.R.; Grand, A.N. Caffeine content in coffee as influenced by grinding and brewing techniques. Food Res. Int. 1996, 29, 785–789. [Google Scholar] [CrossRef]
- Farah, A.; Monteiro, M.C.; Calado, V.; Franca, A.S.; Trugo, L.C. Correlation between cup quality and chemical attributes of Brazilian coffee. Food Chem. 2006, 98, 373–380. [Google Scholar] [CrossRef]
- Fujioka, K.; Shibamoto, T. Chlorogenic acid and caffeine contents in various commercial brewed coffees. Food Chem. 2008, 106, 217–221. [Google Scholar] [CrossRef]
- Moon, J.K.; Yoo, H.S.; Shibamoto, T. Role of roasting conditions in the level of chlorogenic acid content in coffee beans: Correlation with coffee acidity. J. Agric. Food Chem. 2009, 57, 5365–5369. [Google Scholar] [CrossRef] [PubMed]
- Oestreich-Janzen, S. Chemistry of coffee. In Comprehensive Natural Products II; Elsevier Ltd.: Kidlington, UK, 2010; Volume 3, pp. 1085–1117. [Google Scholar]
- Andueza, S.; De Peña, M.P.; Cid, C. Chemical and sensorial characteristics of espresso coffee as affected by grinding and torrefacto roast. J. Agric. Food Chem. 2003, 51, 7034–7039. [Google Scholar] [CrossRef] [PubMed]
- Petracco, M. Beverage Preparation: Brewing Trends for the New Millennium; Blackwell’s: Oxford, UK, 2001; pp. 140–164. [Google Scholar]
- Flament, I. Coffee Flavor Chemistry; John Wiley & Sons: Hoboken, NJ, USA, 2002; Chapter 5. [Google Scholar]
- Wright, J. Flavor Creation, 2nd ed.; Allured Publishing Corporation: Carol Stream, IL, USA, 2011; Chapter 2. [Google Scholar]
- Arctander, S. Perfume and Flavor Chemicals (Aroma Chemicals); Allured Publishing Corporation: Carol Stream, IL, USA, 1994; Volume I. [Google Scholar]
- De Maria, C.A.B.; Trugo, L.C.; Aquino Neto, F.R.; Moreira, R.F.A.; Alviano, C.S. Volatiles formed during roasting. Food Chem. 1996, 55, 203–207. [Google Scholar] [CrossRef]
- Ash, M.; Ash, I. Handbook of Flavors and Fragrances; Synapse Information Resources, Inc.: Endicott, NY, USA, 2006. [Google Scholar]
- Buttery, R.G.; Ling, L.C. Volatile flavor components of corn tortillas and related products. J. Agric. Food Chem. 1995, 43, 1878–1882. [Google Scholar] [CrossRef]
- Flavornet. Available online: http://www.flavornet.org/flavornet.html (accessed on 25 October 2016).
- Fisk, I.D.; Kettle, A.; Hofmeister, S.; Virdie, A.; Kenny, J.S. Discrimination of roasted and ground coffee aroma. Flavour 2012, 1, 14. [Google Scholar] [CrossRef] [Green Version]
- Kumazawa, K.; Masuda, H. Investigation of the change in the flavor of a coffee drink during heat processing. J. Agric. Food Chem. 2003, 51, 2674–2678. [Google Scholar] [CrossRef]
- Amanpour, A.; Selli, S. Differentiation of volatile profiles and odor activity values of Turkish coffee and French press coffee. J. Food Process. Preserv. 2016, 40, 1116–1124. [Google Scholar] [CrossRef]
- Lee, J.; Chambers, D.H.; Chambers, E., IV; Adhikari, K.; Yoon, Y. Volatile aroma compounds in various brewed green teas. Molecules 2013, 18, 10024–10041. [Google Scholar] [CrossRef]
- Estevez, M.; Ventanas, S.; Ramirez, R.; Cava, R. Influence of the Addition of Rosemary Essential Oil on the Volatiles Pattern of Porcine Frankfurters. J. Agric. Food Chem. 2005, 53, 8317–8324. [Google Scholar] [CrossRef]
- Cerny, C.; Guntz-Dubini, R. Role of the solvent glycerol in the Maillard reaction of D-fructose and L-aniline. J. Agric. Food Chem. 2006, 54, 574–577. [Google Scholar] [CrossRef] [PubMed]
- Maia, J.G.S.; Andrade, E.H.A.; Zoghbi, M.G.B. Volatile constituents of the leaves, fruits and flowers of cashew (Anacardium occidentale L.). J. Food Comp. Anal. 2000, 13, 227–232. [Google Scholar] [CrossRef]
- Beal, A.D.; Mottram, D.S. Compounds contributing to the characteristic aroma of malted barley. J. Agric. Food Chem. 1994, 42, 2880–2884. [Google Scholar] [CrossRef]
- Whitfield, F.B.; Mottram, D.S. Heterocyclic volatiles formed by heating cysteine or hydrogen sulfide with 4-hydroxy-5-methyl-3(2H)-furanone at pH 6.5. J. Agric. Food Chem. 2001, 49, 816–822. [Google Scholar] [CrossRef] [PubMed]
- Radulovic, N.; Blagojevic, P.; Palic, R. Comparative study of the leaf volatiles of Arctostaphylos uva-ursi (L.) Spreng. and Vaccinium vitis-idaea L. (Ericaceae). Molecules 2010, 15, 6168–6185. [Google Scholar] [CrossRef] [PubMed] [Green Version]
- Asuming, W.A.; Beauchamp, P.S.; Descalzo, J.T.; Dev, B.C.; Dev, V.; Frost, S.; Ma, C.W. Essential oil composition of four Lomatium Raf. species and their chemotaxonomy. Biochem. Syst. Ecol. 2005, 33, 17–26. [Google Scholar] [CrossRef]
- Wanakhachornkrai, P.; Lertsiri, S. Comparison of determination method for volatile compounds in Thai soy sauce. Food Chem. 2003, 83, 619–629. [Google Scholar] [CrossRef]
- Kim, J.S.; Chung, H.Y. GC-MS analysis of the volatile components in dried boxthorn (Lycium chimensis) Fruit. J. Korean Soc. Appl. Biol. Chem. 2009, 52, 516–524. [Google Scholar] [CrossRef]
- Deport, C.; Ratel, J.; Berdagué, J.-L.; Engel, E. Comprehensive combinatory standard correction: A calibration method for handling instrumental drifts of gas chromatography-mass spectrometry systems. J. Chromatogr. A 2006, 1116, 248–258. [Google Scholar] [CrossRef] [PubMed]
- Risticevic, S.; Carasek, E.; Pawliszyn, J. Headspace solid-phase microextraction-gas chromatographic-time-of-flight mass spectrometric methodology for geographical origin verification of coffee. Anal. Chim. Acta 2008, 617, 72–84. [Google Scholar] [CrossRef] [PubMed]
- Ádámová, M.; Orinák, A.; Halás, L. Retention indices as identification tool in pyrolysis-capillary gas chromatography. J. Chromatogr. A 2005, 1087, 131–141. [Google Scholar] [CrossRef] [PubMed]
- Siegmund, B.; Murkovic, M. Changes in chemical composition of pumpkin seeds during the roasting process for production of pumpkin seed oil (Part 2: Volatile compounds). Food Chem. 2004, 84, 367–374. [Google Scholar] [CrossRef]
- Oruna-Concha, M.J.; Duckham, S.C.; Ames, J.M. Comparison of volatile compounds isolated from the skin and flesh of four potato cultivars after baking. J. Agric. Food Chem. 2001, 49, 2414–2421. [Google Scholar] [CrossRef] [PubMed]
- Ames, J.M.; Guy, R.C.E.; Kipping, G.J. Effect of pH, temperature, and moisture on the formation of volatile compounds in glycine/glucose model systems. J. Agric. Food Chem. 2001, 49, 4315–4323. [Google Scholar] [CrossRef] [PubMed]
- Ames, J.M.; Defaye, A.B.; Bates, L. The effect of pH on the volatiles formed in an extruded starch-glucose-lysine model system. Food Chem. 1997, 58, 323–327. [Google Scholar] [CrossRef]
- Yu, A.N.; Zhang, A.D. The effect of pH on the total formation of aroma compounds produced by hearting a model system containing L-ascorbic acid with L-threonine/L-serine. Food Chem. 2010, 119, 214–219. [Google Scholar] [CrossRef]
- de Simon, B.F.; Estruelas, E.; Munoz, A.M.; Cadahia, E.; Sanz, M. Volatile compounds in acacia, chestnut, cherry, ash, and oak woods, with a view to their use in cooperage. J. Agric. Food Chem. 2009, 57, 3217–3227. [Google Scholar] [CrossRef]
- Adams, R.P.; González Elizondo, M.S.; González Elizondo, M.; Slinkman, E. DNA fingerprinting and terpenoid analysis of Juniperus blancoi var. huehuentensis (Cupressaceae), a new subalpine variety from Durango, Mexico. Biochem. Syst. Ecol. 2006, 34, 205–211. [Google Scholar] [CrossRef]
- Aaslyng, M.D.; Elmore, J.S.; Mottram, D.S. Comparison of the aroma characteristics of acid-hydrolyzed and enzyme-hydrolyzed vegetable proteins produced from soy. J. Agric. Food Chem. 1998, 46, 5225–5231. [Google Scholar] [CrossRef]
- Ho, C.W.; Wan Aida, W.M.; Maskat, M.Y.; Osman, H. Changes in volatile compounds of palm sap (Arenga pinnata) during the heating process for production of palm sugar. Food Chem. 2007, 102, 1156–1162. [Google Scholar] [CrossRef]
- Alissandrakis, E.; Tarantilis, P.A.; Harizanis, P.C.; Polissiou, M. Comparison of the volatile composition in thyme honeys from several origins in Greece. J. Agric. Food Chem. 2007, 55, 8152–8157. [Google Scholar] [CrossRef] [PubMed]
- Andrade, M.S.; Sampaio, T.S.; Nogueira, P.C.L.; Ribeiro, A.S.; Bittrich, V.; Amaral, M.C.E. Volatile compounds of the leaves, flowers and fruits of Kielmeyera rugosa Choisy (Clusiaceae). Flavour Fragr. J. 2007, 22, 49–52. [Google Scholar] [CrossRef]
- Zhao, C.; Zeng, Y.; Wan, M.; Li, R.; Liang, Y.; Li, C.; Zeng, Z.; Chau, F.T. Comparative analysis of essential oils from eight herbal medicines with pungent flavor and cool nature by GC-MS and chemometric resolution methods. J. Sep. Sci. 2009, 32, 660–670. [Google Scholar] [CrossRef] [PubMed]
- Radulovic, N.; Dordevic, N.; Markovic, M.; Palic, R. Volatile constituents of Glechoma hirsuta Waldst. Kit. and G. hederacea L. (Lamiaceae). Bull. Chem. Soc. Ethiop. 2010, 24, 67–76. [Google Scholar] [CrossRef] [Green Version]
- Zhao, C.X.; Li, X.N.; Liang, Y.Z.; Fang, H.Z.; Huang, L.F.; Guo, F.Q. Comparative analysis of chemical components of essential oils from different samples of Rhododendron with the help of chemometrics methods. Chemom. Intell. Lab. Syst. 2006, 82, 218–228. [Google Scholar] [CrossRef]
- Skaltsa, H.D.; Mavrommati, A.; Constantinidis, T. A chemotaxonomic investigation of volatile constituents in Stachys subsect. Swainsonianeae (Labiatae). Phytochemistry 2001, 57, 235–244. [Google Scholar] [CrossRef]
- Boulanger, R.; Crouzet, J. Free and bound flavour components of Amazonian fruits: 2. cupuacu volatile compounds. Flavour Fragr. J. 2000, 15, 251–257. [Google Scholar] [CrossRef]
- The Good Scents Company Information System. Available online: http://www.thegoodscentscompany.com (accessed on 3 November 2020).
- Piccino, S.; Boulanger, R.; Descroix, F.; Sing, A.S.C. Aromatic composition and potent odorants of the “specialty coffee” brew “bourbon pointu” correlated to its three trade classifications. Food. Res. Int. 2014, 61, 264–271. [Google Scholar] [CrossRef]
- Wagner, R.; Czerny, M.; Bielohradsky, J.; Grosch, W. Structure-odour-activity relationship of alkylpyrazines. Z. Lebensm. Forsch. A 1999, 208, 308–316. [Google Scholar] [CrossRef]
- Czerny, M.; Brueckner, R.; Kirchhoff, E.; Schmitt, R.; Buettner, A. The influence of molecular structure on odor qualities and odor detection thresholds of volatile alkylated phenols. Chem. Senses 2011, 36, 539–553. [Google Scholar] [CrossRef] [Green Version]
- Buttery, R.G.; Ling, L.C. 2-Ethyl-3,5-dimethylpyrazine and 2-ethyl-3,6-dimethylpyrazine: Odor thresholds in water solution. LWT Food Sci. Technol. 1997, 30, 109–110. [Google Scholar] [CrossRef]
- Blank, I.; Sen, A.; Grosch, W. Aroma impact compounds of arabica and robusta coffee. Qualitative and quantitative investigations. In Proceedings of the Fourteenth International Conference on Coffee Science, Colloque, San Francisco, CA, USA, 14–19 July 1991. [Google Scholar]
- Czerny, M.; Grosch, W. Potent odorants of raw arabica coffee. Their changes during roasting. J. Agric. Food Chem. 2000, 48, 868–872. [Google Scholar] [CrossRef] [PubMed]
- Toledo, P.R.A.B.; Pezza, L.; Pezza, H.R.; Toci, A.T. Relationship between the different aspects related to coffee quality and their volatile compounds. Compr. Rev. Food Sci. Food Saf. 2016, 15, 705–719. [Google Scholar] [CrossRef] [Green Version]
- Ito, Y.; Kubota, K. Sensory evaluation of the synergism among odorants present in concentrations below their odor threshold in a Chinese jasmine green tea infusion. Mol. Nutr. Food Res. 2005, 49, 61–68. [Google Scholar] [CrossRef] [PubMed]


| Coffee Samples | Variety | Degree of Roasting | Company or Purchasing Place |
|---|---|---|---|
| Brewed coffee (CB, CM) | |||
| Blending | Brazil, Colombia, Ethiopia aricha, Guatemala | City | Coffee loves him (Busan, Korea) |
| Colombia Nariono Pasto Excelso | Medium | Koozeberry (Busan, Korea) | |
| Folgers classic roast | Medium | Lotte Mart (Seoul, Korea) | |
| Kenya AA Kagumoini | Medium | Coffee loves him (Busan, Korea) | |
| Ready-to-drink coffee | |||
| Barista rules cold brew | El Salvador SHG | Medium | Maeil (Seoul, Korea) |
| Cold brew by Babinski | Brazil, Colombia, Ethiopia | Between medium and high | Korea Yacult (Seoul, Korea) |
| French café cold brew | Ethiopia (Yergacheffe, Sidamo blend) | Unknown | Namyang (Seoul, Korea) |
| Coffee from a coffee shop | |||
| Starbucks | Latin America and Africa blend | Medium | Starbucks (Seattle, WA, USA) |
| Twosomeplace | Unknown | Unknown | Twosomeplace (Seoul, Korea) |
| p-Value | |||
|---|---|---|---|
| Variety (Brand) 1 | Brewing Method 2 | Variety × Brewing Method | |
| Caffeine | <0.0001 | 0.0011 | 0.0008 |
| Chlorogenic acid | <0.0001 | 0.4740 | 0.0070 |
| Trigonelline | <0.0001 | 0.4970 | 0.0094 |
| Sample Name | Caffeine | Chlorogenic Acid | Trigonelline |
|---|---|---|---|
| BlendingCB | 0.80 ± 0.04 d | 0.21 ± 0.03 c,d,e | 0.25 ± 0.03 d |
| ColombiaCB | 0.63 ± 0.03 f | 0.21 ± 0.01 d,e | 0.25 ± 0.03 d |
| FolgersCB | 0.95 ± 0.04 b | 0.25 ± 0.02 a,b | 0.29 ± 0.02 b,c |
| KenyaCB | 0.75 ± 0.02 d,e | 0.23 ± 0.01 a,b,c | 0.28 ± 0.02 b,c,d |
| BlendingCM | 0.77 ± 0.07 d,e | 0.18 ± 0.02 f,g | 0.19 ± 0.03 e |
| ColombiaCM | 0.74 ± 0.04 e | 0.23 ± 0.01 b,c,d | 0.27 ± 0.03 c,d |
| FolgersCM | 1.05 ± 0.04 a | 0.25 ± 0.02 a | 0.31 ± 0.04 a,b |
| KenyaCM | 0.76 ± 0.03 d,e | 0.23 ± 0.01 b,c,d | 0.27 ± 0.03 c,d |
| BabinskiRTD | 0.63 ± 0.06 f | 0.16 ± 0.02 g,h | 0.18 ± 0.03 e |
| BaristaRTD | 0.59 ± 0.04 f | 0.10 ± 0.01 i | 0.11 ± 0.02 f |
| FrenchCafeRTD | 0.61 ± 0.03 f | 0.13 ± 0.01 h | 0.14 ± 0.02 f |
| StarbucksCS | 0.97 ± 0.04 b | 0.25 ± 0.03 a | 0.33 ± 0.01 a |
| TwosomeplaceCS | 0.87 ± 0.03 c | 0.19 ± 0.04 e,f | 0.26 ± 0.05 c,d |
| p-value | <0.0001 | <0.0001 | <0.0001 |
| LSD | 0.05 | 0.03 | 0.04 |
| p-Value | |||
|---|---|---|---|
| Variety (Brand) 1 | Brewing Method 2 | Variety × Brewing Method | |
| Overall Liking | <0.0001 | 0.0149 | 0.0071 |
| Bitterness Intensity | <0.0001 | <0.0001 | 0.0202 |
| CoffeeID Intensity | 0.0041 | 0.1240 | 0.0073 |
| Sample Name 1 | Overall Liking 2 | Bitterness Intensity 2 | CoffeeID Intensity 2 |
|---|---|---|---|
| BlendingCB | 4.29 ± 1.97 b,c,d | 4.89 ± 1.75 d | 5.63 ± 1.53 b,c,d |
| BlendingCM | 4.56 ± 2.00 b,c,d | 4.89 ± 1.78 d | 5.21 ± 1.37 e,f |
| ColombiaCB | 3.64 ± 1.83 e,f,g | 4.60 ± 1.94 d,e | 5.20 ± 1.74 e,f |
| ColombiaCM | 3.50 ± 2.01 g,h | 4.90 ± 2.09 d | 5.35 ± 1.72 d,e,f |
| FolgersCB | 4.13 ± 2.13 c,d,e | 5.83 ± 1.76 b,c | 5.53 ± 1.49 c,d,e |
| FolgersCM | 3.18 ± 2.01 g,h | 6.84 ± 1.72 a | 6.00 ± 1.59 b |
| KenyaCB | 3.53 ± 1.87 f,g,h | 4.36 ± 1.94 e,f | 5.40 ± 1.60 d,e,f |
| KenyaCM | 3.10 ± 1.93 h | 5.04 ± 2.14 d | 5.82 ± 1.51 b,c |
| BaristaRTD(A) 3 | 5.54 ± 2.15 a | 4.23 ± 1.82 e,f | 5.18 ± 1.74 e,f |
| BaristaRTD(B) | 5.80 ± 1.90 a | 4.14 ± 1.77 e,f | 5.01 ± 1.79 f |
| BabinskiRTD | 5.50 ± 2.04 a | 3.89 ± 1.73 f | 5.18 ± 1.61 e,f |
| FrenchCafeRTD | 4.65 ± 2.09 b,c | 4.07 ± 1.81 f | 5.54 ± 1.66 c,d,e |
| StarbucksCS | 4.05 ± 2.12 d,e,f | 625 ± 1.82 b | 6.01 ± 1.42 a,b |
| TwosomeplaceCS | 4.76 ± 2.47 b | 5.69 ± 1.97 c | 6.41 ± 1.68 a |
| p-value | <0.0001 | <0.0001 | <0.0001 |
| LSD | 0.52 | 0.47 | 0.41 |
| No. | Volatile Compounds | Overalllliking | Bitterness Intensity | CoffeeID Intensity | Caffeine | Chlorogenicacid | Trigonelline |
|---|---|---|---|---|---|---|---|
| V1 | Pyridine | 0.4051 | 0.4506 | 0.6294 | 0.4009 | −0.1188 | 0.0673 |
| V2 | Methylpyrazine | −0.2472 | 0.8086 | 0.4608 | 0.8199 | 0.5801 | 0.6219 |
| V3 | Furfural | −0.6355 | −0.1263 | −0.2608 | −0.1285 | 0.4423 | 0.3804 |
| V4 | 2-Furan methanol | −0.0859 | 0.7601 | 0.5833 | 0.7383 | 0.4578 | 0.5857 |
| V5 | 2,6-Dimethylpyrazine | −0.2948 | 0.8019 | 0.4662 | 0.8076 | 0.6103 | 0.6574 |
| V6 | 3-Ethylpyridine | 0.4834 | 0.3109 | 0.5360 | 0.2328 | −0.3096 | −0.1300 |
| V7 | 5-Methyl-2-furaldehyde | −0.6712 | 0.8121 | −0.1314 | 0.1091 | 0.5790 | 0.5186 |
| V8 | Phenol | 0.1530 | 0.6796 | 0.7254 | 0.6269 | 0.1019 | 0.2635 |
| V9 | 2-ethyl-3-methylpyrazine | −0.1883 | 0.7410 | 0.4601 | 0.7540 | 0.4611 | 0.5144 |
| V10 | Pyrrole-2-carboxaldehyde | −0.3690 | 0.5661 | 0.5806 | 0.5901 | 0.5247 | 0.6039 |
| V11 | 1-methyl-1H-pyrrole-2-acetonitrile | −0.4306 | 0.6318 | 0.2789 | 0.6562 | 0.6218 | 0.6298 |
| V12 | N-acetyl-4(H)-pyridine | −0.1002 | 0.8564 | 0.5421 | 0.8420 | 0.4702 | 0.5520 |
| V13 | 3-Methylphenol | 0.6201 | 0.1255 | 0.3068 | 0.1737 | −0.2674 | −0.1545 |
| V14 | 2-Acetylpyrrole | 0.0736 | 0.7221 | 0.7068 | 0.6866 | 0.2262 | 0.3815 |
| V15 | 3,5-Octadien-2-one | −0.6605 | −0.001 | −0.1487 | −0.0081 | 0.5058 | 0.4606 |
| V16 | 2-Acetyl-1-methylpyrrole | 0.0652 | 0.6320 | 0.6768 | 0.5811 | 0.1094 | 0.2566 |
| V17 | 3-Ethyl-2,5-dimethylpyrazine | −0.1762 | 0.6566 | 0.4092 | 0.6729 | 0.4115 | 0.4399 |
| V18 | 2-Ethyl-3,5-dimethylpyrazine | −0.1167 | 0.6941 | 0.4635 | 0.7085 | 0.3795 | 0.4271 |
| V19 | 2,5-Diethylpyrazine | −0.1665 | 0.7169 | 0.4614 | 0.7351 | 0.4239 | 0.4626 |
| V20 | Guaiacol | 0.0527 | 0.7366 | 0.6933 | 0.6967 | 0.1917 | 0.3222 |
| V21 | 3-Ethyl-2-hydroxy-2-cyclopenten-1-one | −0.3873 | 0.6740 | 0.5526 | 0.6574 | 0.5963 | 0.6996 |
| V22 | Nonanal | 0.0994 | 0.5327 | 0.3874 | 0.5662 | 0.1145 | 0.1230 |
| V23 | Maltol | 0.0657 | 0.4424 | 0.4479 | 0.4167 | 0.1943 | 0.3384 |
| V24 | 2-Methyl-5-propionylfuran | 0.2251 | 0.4188 | 0.6402 | 0.4146 | 0.0515 | 0.2315 |
| V25 | 5H-5-methyl-6,7-dihydrocyclopenta[b]pyrazine | −0.1519 | 0.7948 | 0.5582 | 0.7790 | 0.4000 | 0.4689 |
| V26 | 1-Furfuryl pyrrole | −0.1563 | 0.5910 | 0.1064 | 0.5744 | 0.2252 | 0.1986 |
| V27 | Methyl salicylate | −0.2344 | 0.4278 | 0.1778 | 0.3649 | 0.4178 | 0.4739 |
| V28 | Nonanoic acid | −0.0295 | 0.7255 | 0.4077 | 0.6927 | 0.2501 | 0.3134 |
| V29 | 4-Ethylguaiacol | −0.1073 | 0.7424 | 0.4100 | 0.7242 | 0.2966 | 0.3288 |
| V30 | Difurfuryl ether | 0.2240 | 0.5974 | 0.4923 | 0.5505 | −0.0282 | 0.0975 |
| V31 | 4-Vinylguaiacol | −0.6003 | 0.6164 | 0.1443 | 0.5763 | 0.5454 | 0.4771 |
| V32 | Decanoic acid | −0.2637 | 0.7282 | 0.4161 | 0.7641 | 0.4482 | 0.4652 |
| V33 | 3,4-Dimethoxystyrene | −0.5263 | 0.4180 | 0.2003 | 0.4760 | 0.5291 | 0.5141 |
| V34 | 2,4-Di-tert-butylphenol | 0.0732 | 0.5252 | 0.6752 | 0.5544 | 0.1575 | 0.2564 |
| V35 | Dodecanoic acid | −0.5723 | 0.4563 | 0.4057 | 0.4021 | 0.5898 | 0.6323 |
| V36 | Tetradecanoic acid | −0.3523 | −0.2690 | −0.2988 | −0.2671 | 0.1716 | 0.1626 |
Publisher’s Note: MDPI stays neutral with regard to jurisdictional claims in published maps and institutional affiliations. |
© 2020 by the authors. Licensee MDPI, Basel, Switzerland. This article is an open access article distributed under the terms and conditions of the Creative Commons Attribution (CC BY) license (http://creativecommons.org/licenses/by/4.0/).
Share and Cite
Heo, J.; Adhikari, K.; Choi, K.S.; Lee, J. Analysis of Caffeine, Chlorogenic Acid, Trigonelline, and Volatile Compounds in Cold Brew Coffee Using High-Performance Liquid Chromatography and Solid-Phase Microextraction—Gas Chromatography-Mass Spectrometry. Foods 2020, 9, 1746. https://doi.org/10.3390/foods9121746
Heo J, Adhikari K, Choi KS, Lee J. Analysis of Caffeine, Chlorogenic Acid, Trigonelline, and Volatile Compounds in Cold Brew Coffee Using High-Performance Liquid Chromatography and Solid-Phase Microextraction—Gas Chromatography-Mass Spectrometry. Foods. 2020; 9(12):1746. https://doi.org/10.3390/foods9121746
Chicago/Turabian StyleHeo, JeongAe, Koushik Adhikari, Kap Seong Choi, and Jeehyun Lee. 2020. "Analysis of Caffeine, Chlorogenic Acid, Trigonelline, and Volatile Compounds in Cold Brew Coffee Using High-Performance Liquid Chromatography and Solid-Phase Microextraction—Gas Chromatography-Mass Spectrometry" Foods 9, no. 12: 1746. https://doi.org/10.3390/foods9121746