FT-NIR Analysis of Intact Table Grape Berries to Understand Consumer Preference Driving Factors

 , ,
, ,
Abstract
:1. Introduction
2. Material and Methods
2.1. Chemical Analysis
2.2. NIR Analysis
2.3. Sensory Characterisation
2.4. Structure of Data Sets and Statistical Analysis
3. Results and Discussion
3.1. Chemical Analysis
3.2. Sensory Data Analysis
3.3. Chemometrics
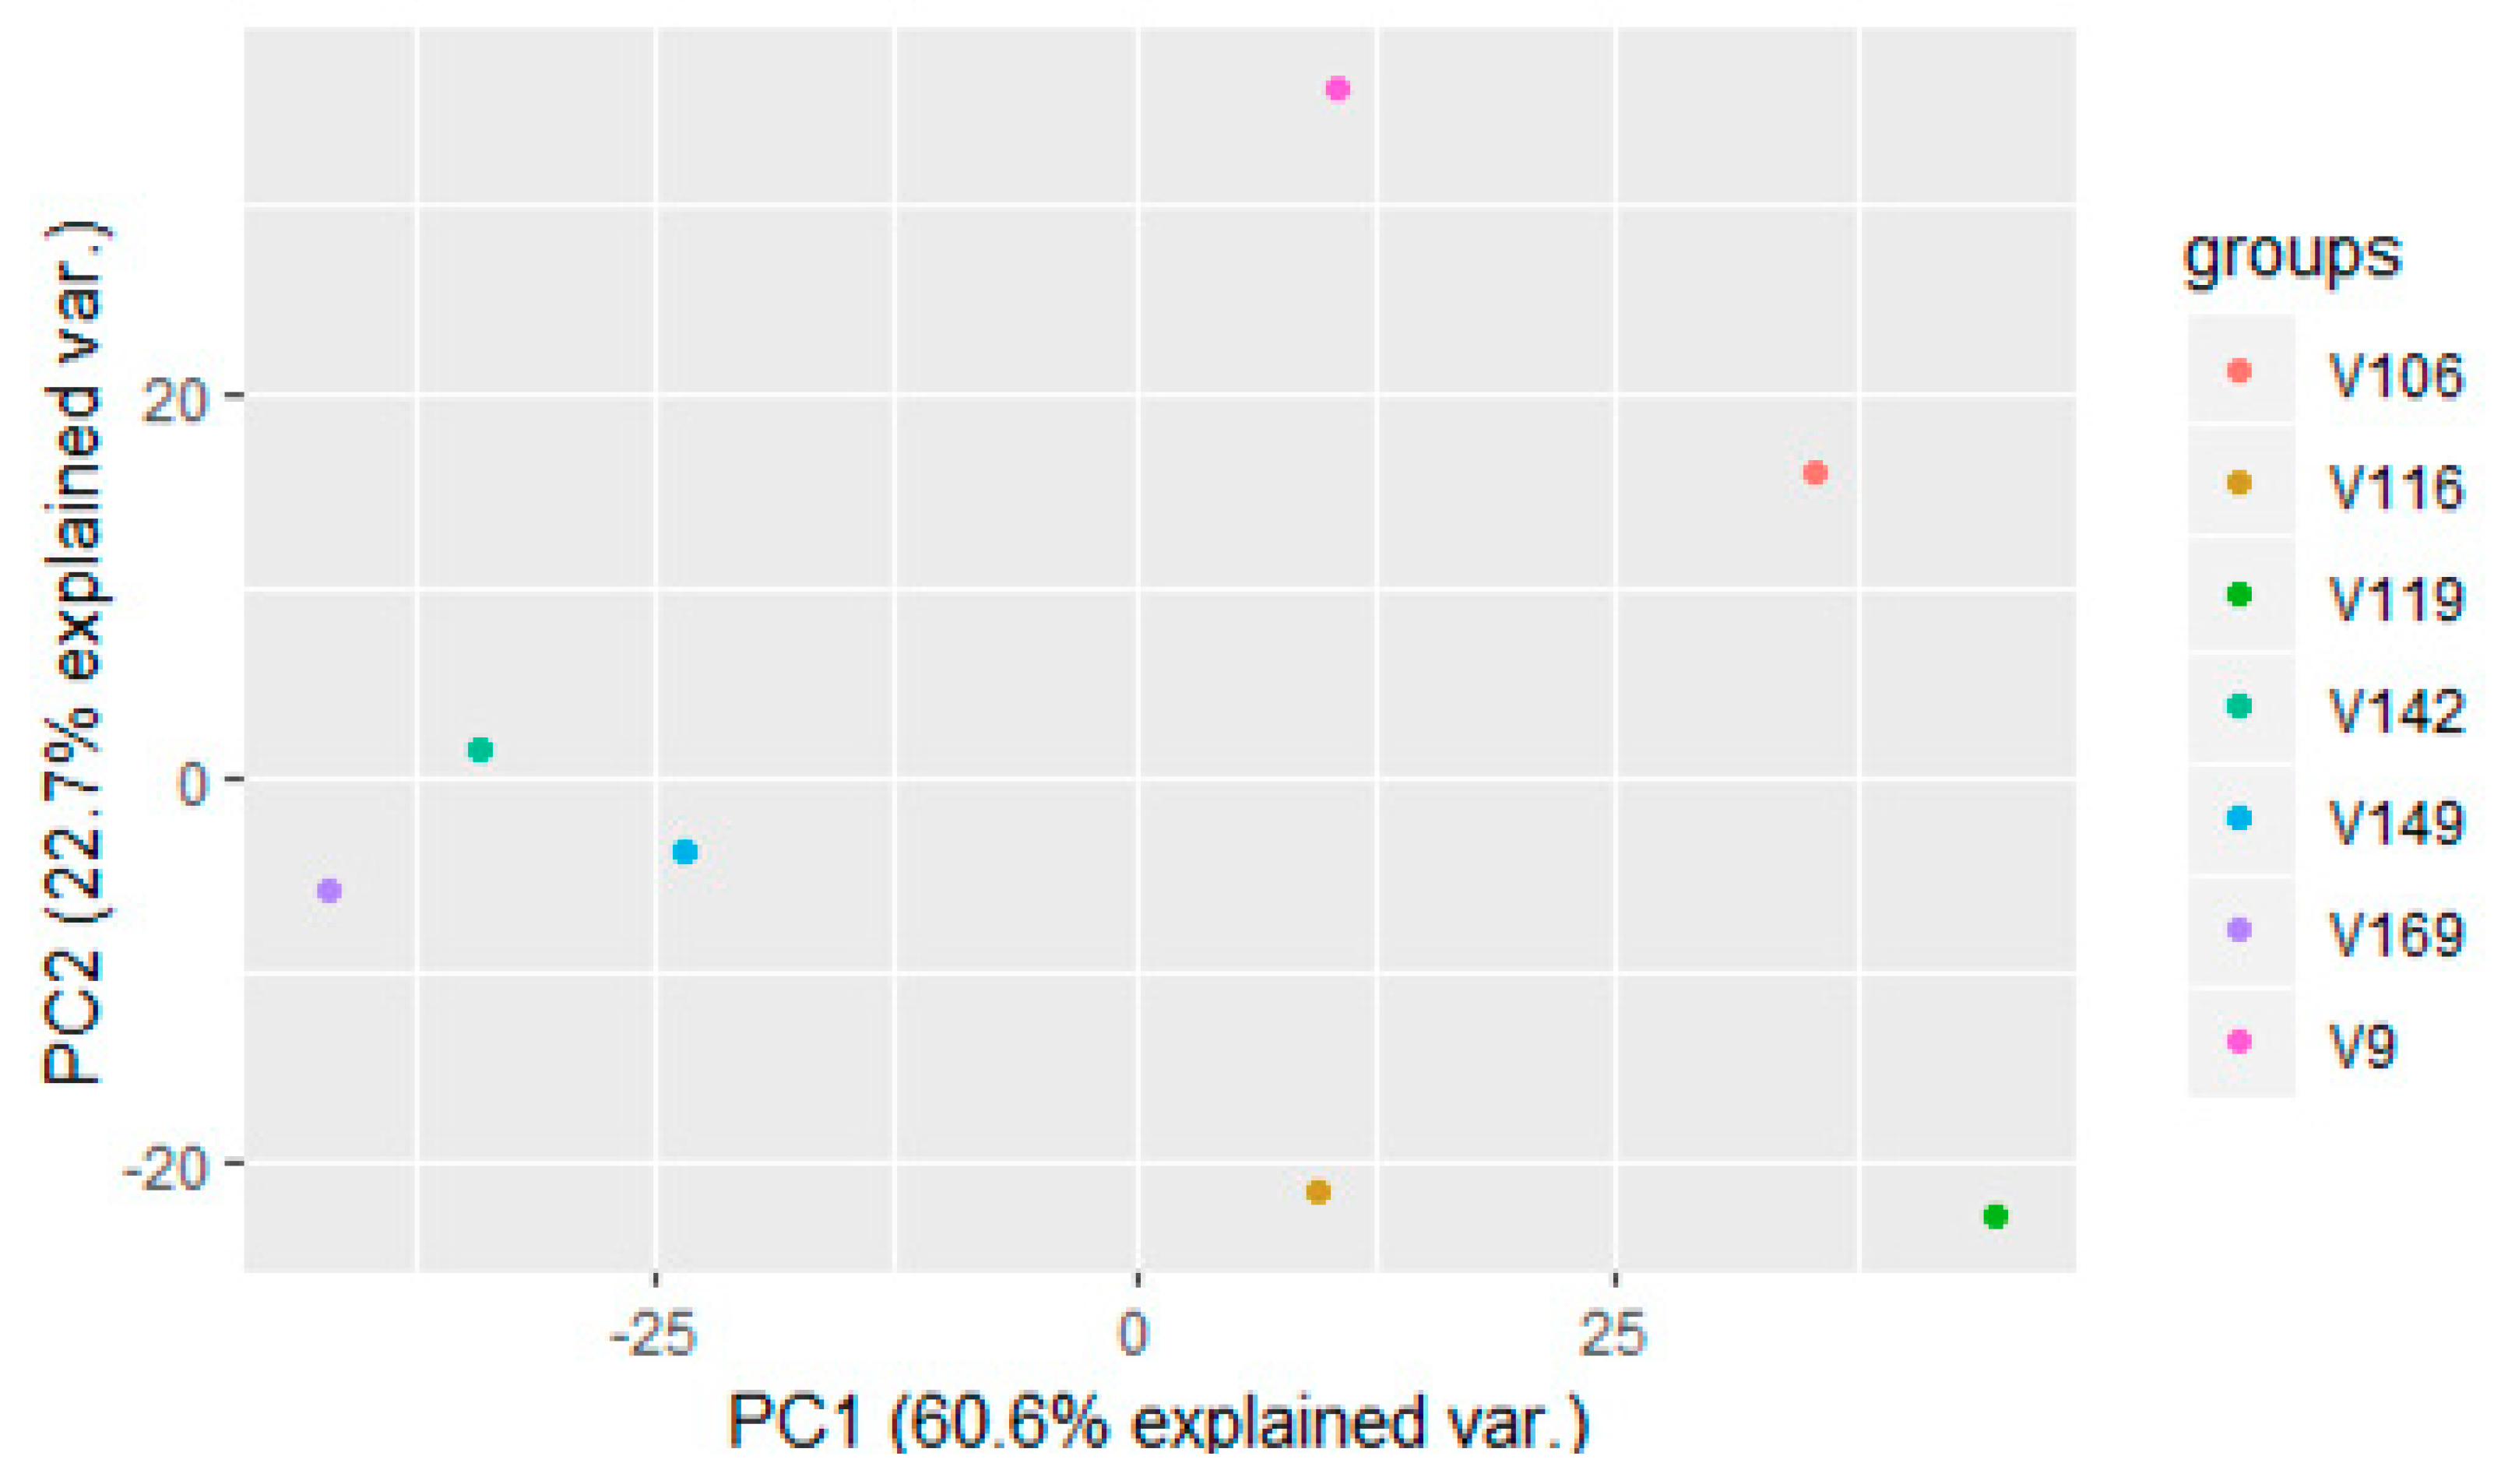
3.3.1. PCA
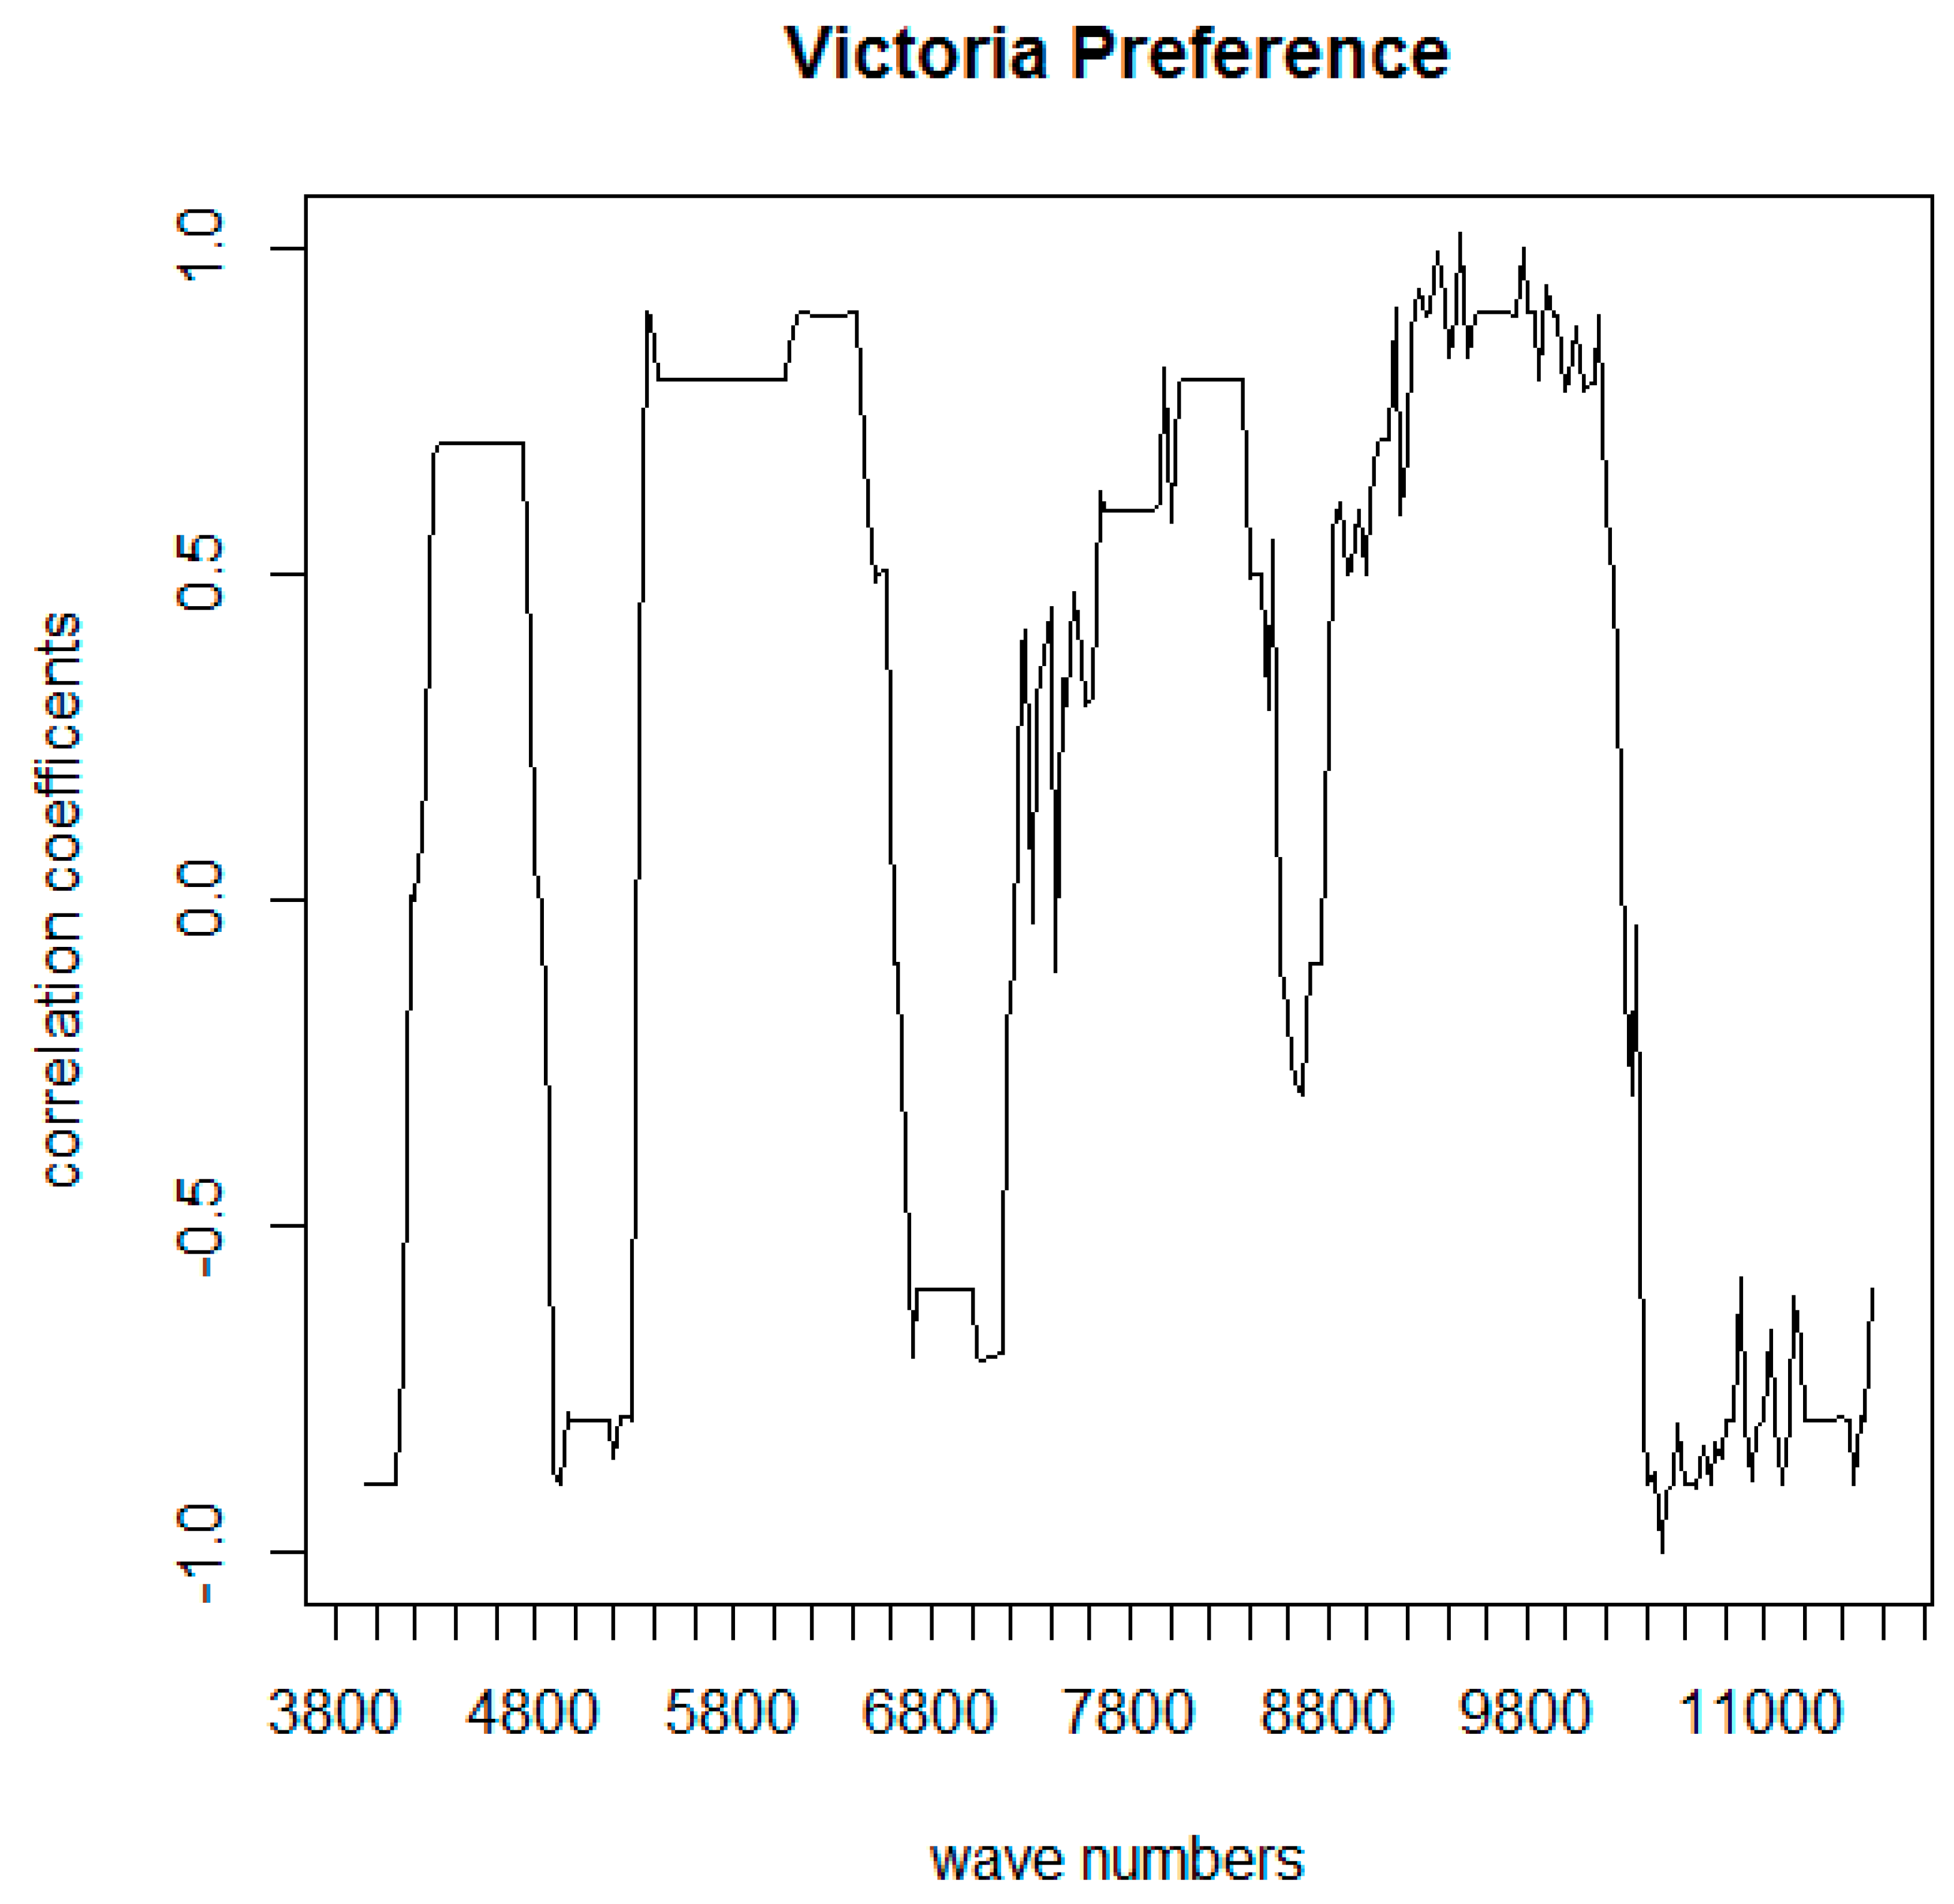
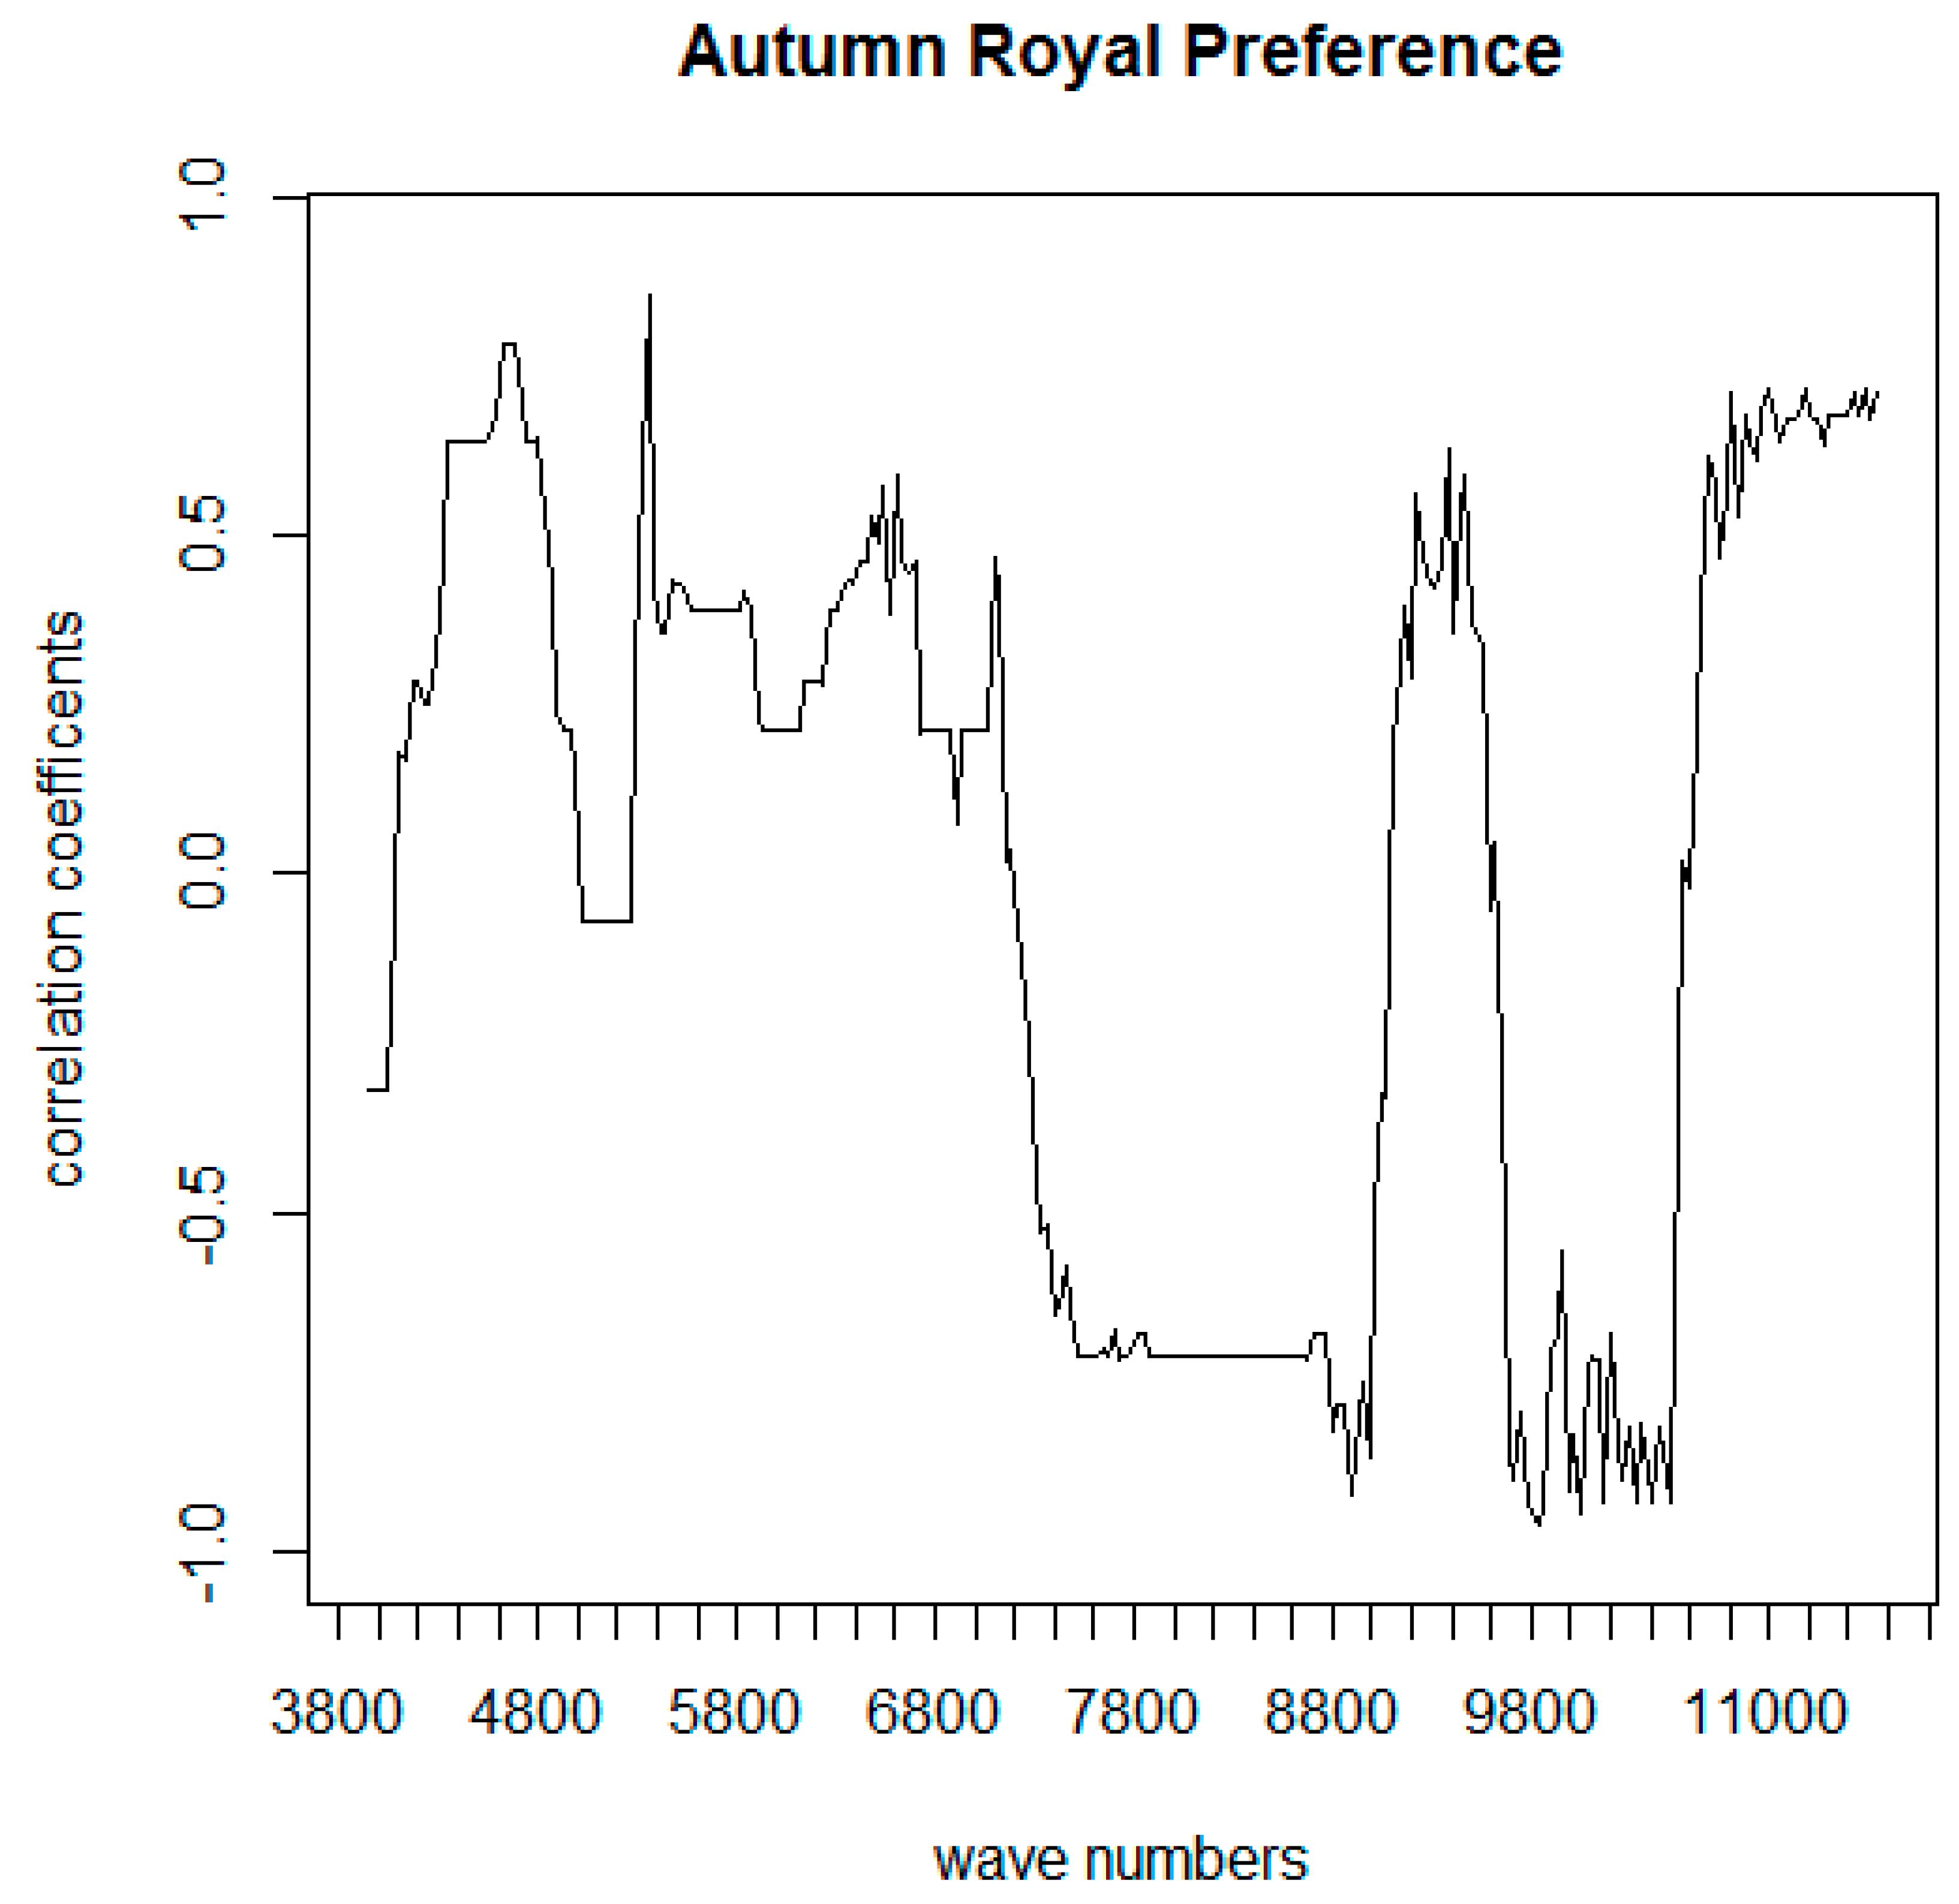
3.3.2. Correlogram
4. Conclusions
Author Contributions
Funding
Acknowledgments
Conflicts of Interest
References
- OIV (International Organisation of Vine and Wine). Resolution VITI 1/2008 Standard on Minimum Maturity Requirements for Table Grapes. Available online: http://www.oiv.int/public/medias/369/viti-2008-1-en.pdf (accessed on 1 February 2019).
- Food and Agriculture Organization of the United Nations (FAO). Codex Standard for Table Grapes (CODEX STAN 255-2007) Amended 2011. Available online: http://www.fao.org/fao-who-codexalimentarius/sh-proxy/en/?lnk=1&url=https%253A%252F%252Fworkspace.fao.org%252Fsites%252Fcodex%252FStandards%252FCXS%2B255-2007%252FCXS_255e.pdf (accessed on 1 February 2019).
- European Union (EU). Commission Implementing Regulation (EU) No 543/2011 of 7 June 2011.
- Jayasena, V.; Cameron, I. Brix/acid ratio as a predictor of consumer acceptability of Crimson seedless table grapes. J. Food Qual. 2008, 31, 736–750. [Google Scholar] [CrossRef]
- OIV (International Organisation of Vine and Wine). Resolution OIV/VITI 371/2010 OIV General form for the Sensorial Analysis of Table Grapes. Available online: http://www.oiv.int/public/medias/385/viti-2010-2-en.pdf (accessed on 1 February 2019).
- Pojić, M.M.; Mastilović, J.S. Near Infrared Spectroscopy-Advanced Analytical Tool in Wheat Breeding, Trade, and Processing. Food Biopro. Tech. 2013, 62, 330–352. [Google Scholar] [CrossRef]
- Shen, F.; Yang, D.; Ying, Y.; Li, B.; Zheng, Y.; Jiang, T. Discrimination Between Shaoxing Wines and Other Chinese Rice Wines by Near-Infrared Spectroscopy and Chemometrics. Food Biopro. Tech. 2012, 52, 786–795. [Google Scholar] [CrossRef]
- Cortés, V.; Blasco, J.; Aleixos, N.; Cubero, S.; Talens, P. Visible and Near-Infrared Diffuse Reflectance Spectroscopy for Fast Qualitative and Quantitative Assessment of Nectarine Quality. Food Biopro. Tech. 2017, 10, 1755–1766. [Google Scholar] [CrossRef]
- Magwaza, L.S.; Opara, U.L.; Nieuwoudt, H.; Cronje, P.J.R.; Saeys, W.; Nicolaï, B. FT-NIR Spectroscopy Applications for Internal and External Quality Analysis of Citrus Fruit-A Review. Food Biopro. Tech. 2012, 52, 425–444. [Google Scholar] [CrossRef]
- Baca-Bocanegra, B.; Nogales-Bueno, J.; García-Estévez, I.; Escribano, T.; Hernandez-Hierro, J.M.; Heredia, F.J. Screening of Wine Extractable Total Phenolic and Ellagitannin Contents in Revalorized Cooperage By-products: Evaluation by Micro-FT-NIRS Technology. Food Biopro. Tech. 2019, 12, 477–485. [Google Scholar] [CrossRef]
- Páscoa, R.N.M.J.; Machado, S.; Magalhães, L.M.; Lopes, J.A. Value Adding to Red Grape Pomace Exploiting Eco-friendly FT-NIR Spectroscopy Technique. Food Biopro. Tech. 2015, 8, 865–874. [Google Scholar] [CrossRef]
- Parpinello, G.P.; Nunziatini, G.; Rombola, A.D.; Gottardi, F.; Versari, A. Relationship between sensory and FT-NIR spectroscopy in consumer preference of table grape (cv Italia). Postharvest Biol. Tech. 2013, 83, 47–53. [Google Scholar] [CrossRef]
- Cane, P. Il controllo della qualità dei vini mediante HPLC: Determinazione degli acidi organici. L’Enotecnico 1990, 26, 69–72. [Google Scholar]
- Association de coordination technique pour l’industrie agro-alimentaire (ACTIA). Sensory Evaluation Guide of Good Practice; Technical Report; Technical Coordination Association for the Food Industry: Paris, France, 2001; Available online: http://www.actia-asso.eu/cms/rubrique-2085-sensory_evaluation.html (accessed on 1 February 2019).
- R Core Team. R: A Language and Environment for Statistical Computing; R Foundation for Statistical Computing: Vienna, Austria, 2013; Available online: http://www.R-project.org/ (accessed on 1 February 2019).
- Siesler, H.W.; Ozaki, Y.; Kawata, S.; Heise, H.M. Near Infrared Spectroscopy; Wiley-VCH Verlags GmbH: Weinheim, Germany, 2002. [Google Scholar]
- Martelo-Vidal, M.J.; Vázquez, M. Evaluation of Ultraviolet, Visible, and Near Infrared Spectroscopy for the Analysis of Wine Compounds. Czech J. Food Sci. 2014, 32, 37–47. [Google Scholar] [CrossRef] [Green Version]
- Liu, F.; He, Y.; Wang, L.; Sun, G. Detection of organic acids and pH of fruit vinegars using near-infrared spectroscopy and multivariate calibration. Food Biopro. Tech. 2011, 4, 1331–1340. [Google Scholar] [CrossRef]
- Da Costa Filho, P.A. Rapid determination of sucrose in chocolate mass using near infrared spectroscopy. Anal. Chim. Acta 2009, 631, 206–211. [Google Scholar] [CrossRef] [PubMed]
- Ferrari, E.; Foca, G.; Vignali, M.; Tassi, L.; Ulrici, A. Adulteration of the anthocyanin content of red wines: Perspectives for authentication by Fourier Transform Near Infra Red and 1H NMR spectroscopies. Anal. Chim. Acta 2011, 701, 139–151. [Google Scholar] [CrossRef] [PubMed]
- Simeone, M.L.F.; Parrella, R.A.C.; Schaffert, R.E.; Damasceno, C.M.B.; Leal, M.C.B.; Pasquini, C. Near infrared spectroscopy determination of sucrose, glucose and fructose in sweet sorghum juice. Microchem. J. 2017, 134, 125–130. [Google Scholar] [CrossRef] [Green Version]
- Musingarabwi, D.M.; Nieuwoudt, H.H.; Young, P.R.; Eyeghe-Bickong, H.A.; Vivier, M.A. A rapid qualitative and quantitative evaluation of grape berries at various stages of development using Fourier-transform infrared spectroscopy and multivariate data analysis. Food Chem. 2016, 190, 253–262. [Google Scholar] [CrossRef]
- Le Moigne, M.; Maury, C.; Bertrand, D.; Jourjon, F. Sensory and instrumental characterisation of Cabernet Franc grapes according to ripening stages and growing location. Food Qual. Pref. 2008, 19, 220–231. [Google Scholar] [CrossRef]
- Marsico, A.D.; Perniola, R.; Cardone, M.F.; Velenosi, M.; Antonacci, D.; Alba, V.; Basile, T. Study of the Influence of Different Yeast Strains on Red Wine Fermentation with FT-NIR Spectroscopy and Principal Component Analysis. Multidiscip. Sci. J. 2018, 1, 13. [Google Scholar] [CrossRef] [Green Version]
- Acri, G.; Testagrossa, B.; Vermiglio, G. FT-NIR Analysis of Different Garlic Cultivars. J. Food Meas. Character. 2016, 10, 127–136. [Google Scholar] [CrossRef]
- Conzen, J.-P. Multivariate Calibration, 3rd ed.; Bruker Optik GmbH: Ettlingen, Germany, 2014; ISBN 978-3-929431-13-1. [Google Scholar]
- Cozzolino, D.; Cynkar, W.U.; Shah, N.; Smith, P. Multivariate data analysis applied to spectroscopy: Potential application to juice and fruit quality. Food Res. Intern. 2011, 44, 1888–1896. [Google Scholar] [CrossRef]
- Rambla, F.J.; Garrigues, S.; De la Guardia, M. PLS-FT-NIR determination of total sugar, glucose, fructose and sucrose in aqueous solutions of fruit juices. Anal. Chim. Acta 1997, 344, 41–53. [Google Scholar] [CrossRef]
- Liu, L.; Cozzolino, D.; Cynkar, W.U.; Dambergs, R.D.; Janik, L.; O’Neill, B.K.; Colby, C.B.; Gishen, M. Preliminary study on the application of visible-near infrared spectroscopy and chemometrics to classify Riesling wines from different countries. Food Chem. 2008, 106, 781–786. [Google Scholar] [CrossRef]
- Guimarães, C.C.; Assis, C.; Simeone, M.L.F.; Sena, M.M. Use of near-infrared spectroscopy, partial least-squares, and ordered predictors selection to predict four quality parameters of sweet sorghum juice used to produce bioethanol. Energy Fuels 2016, 30, 4137–4144. [Google Scholar] [CrossRef]
- Cozzolino, D.; Cynkar, W.U.; Shah, N.; Smith, P. Can spectroscopy geographically classify Sauvignon Blanc wines from Australia and New Zeland? Food Chem. 2011, 126, 673–678. [Google Scholar] [CrossRef]


| Parameter | RMSECV | Rank | Regions (cm−1) | Preprocessing | R2 (%) | Bias |
|---|---|---|---|---|---|---|
| TA | 0.861 | 5 | 9400–6100 5452–4600 | Vector normalization | 57.32 | −0.000762 |
| TSS | 1.3 | 6 | 9400–7500 | First derivative + Vector normalization | 83.04 | 0.01 |
| Maturity Parameters † | Sensory Data ‡ | ||||
|---|---|---|---|---|---|
| Variety | ° Brix | TA | TSS/TA | %Acceptance | Preference |
| Autumn royal | 18.3 ± 0.1 a | 3.8 ± 0.1 e | 49 | 100 | 7.13 ± 0.63 a |
| 16.4 ± 0.1 b | 4.5 ± 0.1 d | 36 | 81 | 6.42 ± 0.58 ab | |
| 14.4 ± 0.0 c | 5.5 ± 0.1 ab | 26 | 50 | 5.63 ± 0.85 ab | |
| 13.8 ± 0.1 d | 5.0 ± 0.1 c | 27 | 56 | 5.17 ± 0.68 ab | |
| 13.3 ± 0.1 e | 5.0 ± 0.1 c | 27 | 33 | 5.25 ± 1.41 ab | |
| 12.6 ± 0.2 f | 5.7 ± 0.1 a | 22 | 29 | 4.40 ± 1.29 b | |
| 11.8 ± 0.2 g | 5.4 ± 0.1 b | 22 | 44 | 4.56 ± 1.88 b | |
| ° Brix | TA | TSS/TA | %Acceptance | Preference | |
| Victoria | 16.9 ± 0.1 a | 3.8 ± 0.1 d | 45 | 86 | 6.72 ± 1.85 a |
| 14.9 ± 0.1 b | 3.9 ± 0.1 d | 38 | 86 | 6.08 ± 1.23 a | |
| 14.2 ± 0.1 b | 5.4 ± 0.1 c | 26 | 87 | 5.80 ± 1.50 a | |
| 11.9 ± 0.1 c | 5.3 ± 0.0 c | 22 | 40 | 4.20 ± 0.60 b | |
| 11.6 ± 0.1 c | 3.0 ± 0.0 e | 39 | 65 | 4.70 ± 0.50 b | |
| 10.6 ± 0.0 d | 6.7 ± 0.2 b | 16 | 32 | 4.08 ± 1.81 b | |
| 9.0 ± 0.1 e | 10.7 ± 0.1 a | 8 | 4 | 2.41 ± 1.29 b | |
© 2020 by the authors. Licensee MDPI, Basel, Switzerland. This article is an open access article distributed under the terms and conditions of the Creative Commons Attribution (CC BY) license (http://creativecommons.org/licenses/by/4.0/).
Share and Cite
Basile, T.; Marsico, A.D.; Cardone, M.F.; Antonacci, D.; Perniola, R. FT-NIR Analysis of Intact Table Grape Berries to Understand Consumer Preference Driving Factors. Foods 2020, 9, 98. https://doi.org/10.3390/foods9010098
Basile T, Marsico AD, Cardone MF, Antonacci D, Perniola R. FT-NIR Analysis of Intact Table Grape Berries to Understand Consumer Preference Driving Factors. Foods. 2020; 9(1):98. https://doi.org/10.3390/foods9010098
Chicago/Turabian StyleBasile, Teodora, Antonio Domenico Marsico, Maria Francesca Cardone, Donato Antonacci, and Rocco Perniola. 2020. "FT-NIR Analysis of Intact Table Grape Berries to Understand Consumer Preference Driving Factors" Foods 9, no. 1: 98. https://doi.org/10.3390/foods9010098